Embed Size (px)
Citation preview
Hearing Research, 11 (1983) 395-401
Elsevier
395
Measurement neurons in
Short Communication
of frequency selectivity of single the central auditory pathway
Michael B. Calford ‘,*, William R. Webster *,** and Malcolm M. Semple *, * * *
Departments of’ Physiology and ’ Psychologv, Monash University, Clayton, Vie. 3168, Australia
(Received 28 December 1981; revised 16 May 1983; accepted 17 May 1983)
A large sample of threshold tuning curves of single units from various levels of the auditory pathway
was used in order to examine the relationship between best frequency and a measure of sharpness of
tuning. This measure is simply the tuning curve bandwidth at 20 dB above threshold on a square-root
scale of frequency. The transformation was found to be largely independent of unit best frequency,
suggesting that it is suitable for comparing sharpness of .tuning between samples. No difference in
sharpness of tuning was found between samples of units from nuclei in the lemniscal auditory pathway,
although units from the anterior auditory field showed broader tuning than those in the lemniscal
pathway.
Key words: frequency selectivity; sharpness of tuning; central auditory pathway.
A continuing issue in central auditory neurophysiology has been the comparison of the frequency selectivity of single neurons from different populations
[3,5,7-9,18--20,22,24]. To allow such comparisons a number of measures have been suggested to quantify the tuning of central auditory neurons [ 1,7,12,16,26,27]. In all cases these measures are based upon transformations from threshold tuning curves
of single neurons, where the frequency with the lowest threshold is known as the best frequency (BF). Plotted in the usual manner on a logarithmic frequency scale, tuning
curves from neurons with higher BFs appear sharper than those from lower-BF units [ 161. However, this relationship is scale-dependent since the opposite trend is formed if curves are plotted on a linear scale [16]. Similarly, bandwidth transformations from tuning curves also display a scale-dependent relationship with frequency [ 1,2,7,19,20]. Since samples from different neural populations are rarely matched for frequency it is preferal+ that a measure of sharpness of frequency tuning be independent of BF.
* Present address: Department of Physiology and Pharmacology, University of Queensland, St. Lucia,
Queensland, 4067, Australia.
** To whom reprint requests should be addressed.
*** Present address: Department of Anatomy, University of California, Irvine, CA 92717, U.S.A.
0378-5955/83/$03.00 0 1983 Elsevier Science Publishers B.V
396
The most widely used measure of tuning specificity, Q,,,, was introduced by Kiang et al. in 1965 [16]. It is defined as the quotient of the best frequency divided by the bandwidth at 10 dB above threshold. At all levels of the auditory pathway
studied, Q,, has been shown to have a monotonically increasing relationship with BF. Most studies have used a logarithmic scale of frequency when presenting Q,,,
measures and few have analysed its frequency relationship [lo], however it has been shown [9] that the increase in Q,, is largely linear with respect to frequency. Because of this frequency dependence, studies attempting to compare samples have been limited to either casual inspection of the Qlo distributions [5,10,22,24] or have omitted data in order to match samples across frequency [18]. To compare popula- tions not matched for frequency is obviously inappropriate [3]. Despite this relation-
ship with frequency, Q,, is still the most extensively used measure of tuning
specificity [3,5,10,18,21,22,24]. Whitfield [26] plotted threshold tuning curves using a square-root frequency scale.
It appeared that curves with different BFs had similar shapes. This led to the use of
the bandwidth at 15 dB above threshold on a square-root frequency scale as a measure of sharpness of tuning which was expected to be independent of BF [27]. While this aim seemed to be achieved for a sample of tuning curves from units in the medial geniculate body (MGB) of awake cats, the independence of the measure to BF was not tested quantitatively. Previously [9] we have used a similar transforma- tion, termed fi - fi where fi and f, are the frequencies marking the limits of the
tuning curve bandwidth 20 dB above threshold (hereafter referred to as the square- root transformation), to show a difference between the sharply tuned units of the ventral division of MGB and the broadly tuned units of the dorsal division of MGB.
The purposes of this paper are to examine the relationship of the square-root transformation to frequency (unit BF), testing for independence, and to use the square-root transformation to describe the neural frequency tuning at various
centres of the auditory pathway. Single-unit tuning curves were obtained from ongoing studies in this laboratory of the ventral nucleus of the cochlear nucleus
(VCN), the dorsal nucleus of the cochlear nucleus (DCN), the central nucleus of the inferior colliculus (ICC), the ventral nucleus of the medial geniculate body (MGV), the primary auditory cortical field (AI) and the anterior auditory cortical field (AAF) of anesthetized cats. Five of these centres VCN, DCN, ICC, MGV and AI are considered as relays in the ascending primary (lemniscal) auditory pathway. The status of AAF is unclear; it is connected with non-primary regions of auditory thalamus [6], is tonotopically organized [ 11,171, has physiological responses similar to AI [22] and has precise connections with the other tonotopically organized cortical fields [ 111.
Methods of surgery, stimulation and recording have been described in detail elsewhere [9,21,23,25]; for the present purposes we indicate that data were obtained from single neurons, using conventional extracellular recording techniques in anaesthetized cats to which controlled tonal stimuli were presented using calibrated systems (dichotic). Neurons were allocated to regions on the basis of histological (DCN, VCN, ICC, MGV) and physiological criteria (MGV, AI, AAF). Threshold tuning curves were obtained either audiovisually, by adjustment of tonal intensity to
397
.
1.2. "CN 1.2. DCN . N=56 - N=60
1.0 - 1.0 - .
08. l .
0.8 - . . .*
0.6 - . . a* '0. 0.6 - 8.
. : . . l
:. 0.4- . l
. . 0.2 - l .
;;; j . '. O.4: :g :
1.2 - MG" - N=50
1.0 - .
0.8 . . .
. l .
0.6 - . 0. l . l m .‘.
. s .
04- P :* . : c . 0. l .
0.2- : l . l .f . .
1.2- AI 1.2 - AAF . . N=89 . N=51 .
l.O- :* 1.0 - . . l .
l
0 0.8 - . . . 0.8. .
.* l l .
0.6 - .(. UP' .
06- . . . ' l 0.4-O l .*
. . :.*>**- l . 0.4- .* l . 1.q . . . ?* l
0.2 - . . l @$ti.::. 0.2 - : . 08 .
. .
4:. t 1 1 . 1 0.3 0.5 1.0 2.0 3.0 5.0 10.0 20.0 30.0 0.3 0.5 1.0 2.0 3.0 5.0 10 0 20.0 30.0
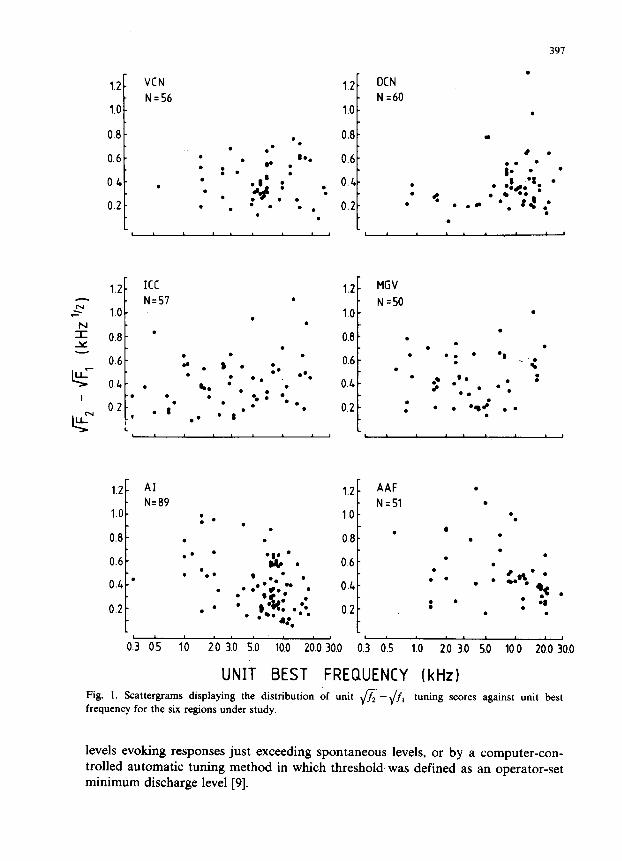
UNIT BEST FREQUENCY (kHz) Fig. 1. Scattergrams displaying the distribution of unit \/7; -fi tuning scores against unit best
frequency for the six regions under study.
levels evoking responses just exceeding spontaneous levels, or by a computer-con- trolled automatic tuning method in which threshold, was defined as an operator-set minimum discharge level [9].
398
Fig. 1 presents the square-root tuning scores for single units from VCN, DCN, ICC, MGV, AI and AAF plotted against their BFs. There is no obvious frequency relationship in any of the scattergrams. This is evidenced in a linear regression analysis of the relationship of the square-root measure to unit best frequency, which revealed slightly positive, or negative, regression slopes (e.g. VCN, slope (m) = -0.00015 kHz-‘j2; MGV, m = 0.010 kHz-‘12 ) which for all regions excepting AI were not significantly different to zero. The AI regression analysis revealed a significant negative regression line (m = - 0.019 kHz-‘j2; r = -0.36). but it is apparent that the slope is of little consequence over the frequency range in which most of the units in the sample had their BF.
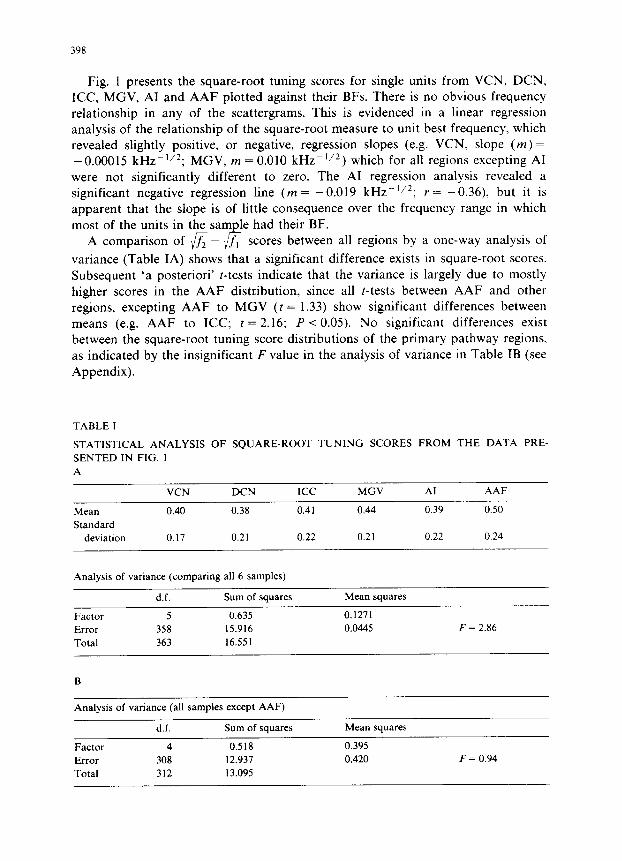
A comparison of iifI - ~~ scores between all regions by a one-way analysis of
variance (Table IA) shows that a significant difference exists in square-root scores.
Subsequent ‘a posteriori’ t-tests indicate that the variance is largely due to mostly higher scores in the AAF distribution, since all t-tests between AAF and other regions, excepting AAF to MGV (t = 1.33) show significant differences between
means (e.g. AAF to ICC; t = 2.16; P < 0.05). No significant differences exist between the square-root tuning score distributions of the primary pathway regions,
as indicated by the insignificant F value in the analysis of variance in Table IB (see
Appendix).
TABLE I
STATISTICAL ANALYSIS OF SQUARE-ROOT TUNING SCORES FROM THE DATA PRE-
SENTED IN FIG. 1
A
Mean Standard
deviation
VCN DCN ICC MGV AI AAF
0.40 0.38 0.41 0.44 0.39 0.50
0.17 0.2 1 0.22 0.21 0.22 0.24
Analysis of variance (comparing all 6 samples)
d.f. Sum of squares
Factor 5 0.635 Error 358 15.916
Total 363 16.551
Mean squares
0.1271 0.0445 F = 2.86
B
Analysis of variance (all samples except AAF)
d.f. Sum of wuares Mean squares
Factor 4 0.518 0.395 Error 308 12.931 0.420 F = 0.94 Total 312 13.095
399
Thus, the square-root measure is largely independent of frequency for central auditory units, and appears useful in discriminating small differences in population
tuning characteristics. This, in itself, does not imply that this measure should be used in preference to Q,,, which is not independent of frequency. If Q,, has validity by virtue of its derivation (construct-validity), then it would be more correct to use this measure in comparisons; after allowing for its relationship to unit BF by complex statistical methods (e.g. least-squares transformation prior to parametric testing).
Through Q,, being a ratio that compensates for centre frequency, it was presented as an independent measure of tuning specificity [16]. However, this interpretation can be questioned. The measure is derived from the Q measure used by electronic engineers, in which case the bandwidth at 3 dB re-centre frequency intensity is used.
By definition, 3 dB represents l/2 power points on the low and high sides of the
tuning curve. Consider the case of a band-pass filter. If the centre frequency is changed then the power output is changed and can be expressed as a function of Q. A constant Q filter would have a constant power output at any frequency, given a flat ‘broad-band’ input. The electronic circuits into which the filter feeds are
dependent upon the input power, thus Q is an appropriate measure of sharpness of tuning for the system. However, for the auditory system we cannot assume a
property analogous to power, which can be derived from tuning curves, and which would allow a validation of the Q,, measure. In contrast, the square-root measure has little ‘a priori’ basis as tuning measure, yet its external validation through its independence of frequency, and its ability to discriminate small differences, support its role as a measure of frequency tuning. Thus, we suggest the square-root transformation for use in population comparisons of sharpness of tuning, particu- larly when samples are not matched for frequency. However, we recognize that this transformation uses only a small amount of the available information on the tuning of single neurons. Consequently its use should be restricted to overall comparisons
between groups of auditory units. A more general use of the square-root transforma- tion would be to plot tonal frequency tuning curves using a square-root frequency scale, as originally suggested by Ross (cited by Whitfield [26]).
That no difference could be demonstrated in the sharpness of tuning between nuclei of the primary auditory pathway is interesting because it was once considered [ 13- 151 that frequency tuning is more precise at higher levels of the auditory
pathway, reaching a peak at the medial geniculate body (being ‘sharpened’ by lower processing to allow frequency discrimination at the thalamus). The present analysis has found that frequency tuning within 20 dB of threshold is equivalent throughout the primary auditory pathway and provides no support for the concept of ‘neural sharpening’.
Appendix
It can be shown that a difference of 0.09 between means would differentiate samples with the probability of a Type I error being < 0.05. Using means as estimates for sample size and variance, the power of the analysis of variance can be

400
calculated (Winer, 1962) to be > 0.9, thus the probability of a Type II error (concluding that no difference exists between samples when such a difference does
exist between populations) is low.
Acknowledgements
We thank Dennis Phillips for supplying some of the data and for his aid in preparing an earlier version of this paper. We are grateful to Judy Sack for art-work and Karin Calford for typing the manuscript.
This work was supported by grants under the Australian Research Grants
Scheme.
References
1 Abeles, M. and Goldstein, M.H. Jr. (1970): Functional architecture in cat primary auditory cortex:
columnar organization and organization according to depth. J. Neurophysiol. 33. 172-187.
2 Aitkin, L.M. (1973): Medial geniculate body of the cat: response to tonal stimuli of neurons in medial
division. J. Neurophysiol. 36, 275-283.
3 Aitkin, L.M. and Moore, D.R. (1975): Inferior colliculus II. Development of tuning characteristics
and tonotopic organization in central nucleus of the neonatal cat. J. Neurophysiol. 38, 1208-1216.
4 Aitkin, L.M. and Webster, W.R. (1972): Medial geniculate body of the cat: organization and
responses to tonal stimuli of neurons in ventral division. J. Neurophysiol. 35, 365-380.
5 Aitkin, L.M., Webster, W.R., Veale, J.L. and Crosby, D.C. (1975): Inferior colliculus I. Comparison of
response properties of neurons in central, pericentral and external nuclei of adult cat. J. Neurophysiol.
38, 1196-1207.
6 Andersen. R.A., Knight, P.L. and Merzenich, M.M. (1980): The thalamocortical and corticothalamic
connections of AI, AII, and the anterior auditory field (AAF) in the cat: evidence for two largely
segregated systems of connections. J. Comp. Neurol. 194, 663-701.
7 Boudreau, J.C. and Tsuchitani, C. (1970): Cat superior olive S-segment cell discharge to tonal
stimulation. In: Contributions to Sensory Physiology, pp. 144-214. Editor: W.D. Neff. Academic
Press, New York.
8 Calford, M.B. and Webster, W.R. (1979): Auditory properties of single units in dorsal and ventral
divisions of the principal nucleus of cat medial geniculate. Proc. Aust. Physiol. Pharmacol. Sot. IO.
104P.
9 Calford, M.B. and Webster, W.R. (1981): Auditory representation within principal division of cat
medial geniculate body: an electrophysiological study. J. Neurophysiol. 45, 1013- 1028.
10 Goldberg, J.M. and Brownell, W.E. (1973): Discharge characteristics of neurons in anteroventral and
dorsal cochlear nuclei of cat. Brain Res. 65, 35-54.
11 Imig, T.J. and Reale, R.A. (1980): Patterns of cortico-cortical connections related to tonotopic maps
in cat auditory cortex. J. Comp. Neurol. 192. 293-332.
12 Irvine, D.R.F. and Heubner. H. (1979): Acoustic response characteristics of neurons in nonspecific
areas of cat cerebral cortex. J. Neurophysiol. 43, 395-408. 13 Katsuki, Y. (1961): Neural mechanism of auditory sensation in cat. In: Sensory Communications, pp.
561-585. Editor: W.A. Rosenblith. MIT Press, Cambridge, Mass. 14 Katsuki, Y. (1966): Neural mechanisms of hearing in cats and monkeys, Progr. Brain Res. 21A.
15 Katsuki, Y., Watanabe, T. and Mayama, N. (1959): Activity of auditory neurons in upper levels of the
brain of cat. J. Neurophysiol. 22, 343-359. 16 Kiang, N.Y.S., Watanabe, T., Thomas, E.C. and Clark, L.F. (1965): Discharge Patterns of Single
Fibers in the Cat’s Auditory Nerve. MIT Press, Cambridge, Mass.
401
17 Knight, P.L. (1977): Representation of the cochlea within the anterior auditory field (AAF) of the cat.
Brain Res. 130, 447-467.
18 Moore, D.R. and Irvine, D.R.F. (1979): The development of some peripheral and central auditory
responses in the neonatal cat. Brain Res. 163, 49-59.
19 Morel, A. (1980): Codage des sons dans le corps genouille median du chat: Evaluation de l’organisa-
tion tonotopique de ses differents noyaux. These, 1’Universitt de Lausanne. Juris Druck and Verlag,
Zurich, Lausanne.
20 Phillips, D.P. and Irvine, D.R.F. (1979): Acoustic input to single neurons in pulvinar-posterior
complex of cat thalamus. J. Neurophysiol. 42, 123-126.
21 Phillips, D.P. and Irvine, D.R.F. (1981): Responses of single neurons in physiologically defined
primary auditory cortex (AI) of the cat: frequency tuning and responses to intensity. J. Neurophysiol.
4548-58.
22 Phillips, D.P. and Irvine, D.R.F. (1982): Properties of single neurons in the anterior auditory field
(AAF) of the cat cerebral cortex. Brain Res. 248, 237-244.
23 Semple, M.N. and Aitkin, L.M. (1979): Representation of sound frequency and laterality by units in
central nucleus of cat inferior colliculus. J. Neurophysiol. 42, 1626-1639.
24 Symmes, D., Alexander, G.E. and Newman, J.D. (1980): Neural processing of vocalizations and
artificial stimuli in the medial geniculate body of squirrel monkey. Hearing Res. 3, 133- 146.
25 Webster, W.R. (1977): Chopper units recorded in the cochlear nucleus of the awake cat. Neurosci.
Lett. 7, 261-265.
26 Whitfield, I.C. (1968): The functional organization of the auditory pathways. J. Sound Vib. 8,
108- 117.
27 Whitfield, I.C. and Purser, D. (1972): Microelectrode study of the medial geniculate body in
anaesthetized free-moving cats. Brain Behav. Evol. 6, 3 1 l-322.
28 Winer, B.J. (1962): Statistical Principles in Experimental Design. McGraw-Hill, New York.


![Optogenetic stimulation of the auditory pathway for ... · auditory pathway [16 ]. However, potential effects of activating Employing non-auditory neurons need to be considered. conditional](https://img.dokumen.tips/doc/110x75/6045088d601118224f2b5624/optogenetic-stimulation-of-the-auditory-pathway-for-auditory-pathway-16-.jpg)