Embed Size (px)
Citation preview

TECHNICAL BULLETIN
6399 Weston Parkway, Cary, North Carolina, 27513 • Telephone (919) 678-2220
TRI 4005
MEASUREMENT OF DURABLE PRESS RESIN ON COTTON BY
NEAR-INFRARED SPECTROSCOPY
© 1998 Cotton Incorporated. All rights reserved; America’s Cotton Producers and Importers.

TABLE OF CONTENTS
Page Summary...................................................................................................................................1 Introduction ..............................................................................................................................1 Experimental.............................................................................................................................2 NIR Statistical Terms ...............................................................................................................2 Results and Discussion .............................................................................................................3 Determination of Total and Fixed Resin..............................................................................3 On-Line Measurement of Total and Fixed Resin ................................................................4 Discrimination into Classes .................................................................................................5 References.................................................................................................................................6 Table 1: Resin Application Bath Formula ..........................................................................7 Table 2: Fabrics used in Study of Construction and Dye Effects on Calibration Modeling............................................................................................7 Table 3: Data for % Total Resin on 3x1 Twill....................................................................8 Table 4: Data for % Fixed Resin on 3x1 Twill ...................................................................9 Table 5: Data on % Total Resin from Construction/Dyes Study......................................10 Table 6: Data of % Fixed Resin from Construction/Dyes Study......................................11 Table 7: Fabrics and Resin Bath Formulations for On-Line Study ..................................13 Table 8: Data for % Total Resin from On-Line Lab Study...............................................14 Table 9: Data for % Total Resin from On-Line Project....................................................16 Table 10: Data for % Fixed Resin from On-Line Project ...................................................16 Table 11: Classification Libraries for Total and Fixed Resin.............................................17 Table 12: Results for Classification of Validation Files .....................................................18 Figure 1: NIR Spectra.........................................................................................................19 Figure 2: Derivatives of Cotton and Chemicals .................................................................19 Figure 3: NIR Spectra of Cotton Plus Resin ......................................................................20 Figure 4: Derivatives of Cotton Plus Resin........................................................................20 Figure 5: Comparison of Total Resin (Lab work on 3x1 Twill) ........................................21 Figure 6: Comparison of Fixed Resin (Lab work on 3x1 Twill)........................................21 Figure 7: Comparison of Total Resin (Lab work on Constructions/Dyes) ........................22 Figure 8: Comparison of Fixed Resin (Lab work on Constructions/Dyes)........................22 Figure 9: Comparison of Total Resin (On-Line Lab Study) ..............................................23 Figure 10: Comparison of Total Resin (On-Line Project) ...................................................24 Figure 11: Comparison of Fixed Resin (On-Line Project)...................................................24 Figure 12: Flow Chart for NIR Classification......................................................................25 Figure 13: Flow Chart for Identification Followed by Quantitative Analysis .....................26

MEASUREMENT OF DURABLE PRESS RESIN ON COTTON BY NEAR-INFRARED SPECTROSCOPY
SUMMARY This technical brief is a summary of the Cotton Incorporated developments for the near-infrared (NIR) analysis of durable press (DP) resin on 100% cotton fabrics. The work covered three applications of NIR technology. The initial study involved the quantitative determination of both total and fixed resins on fabric of different constructions and colors. This work was followed by the on-line measurement of resin at a production facility. Finally, the discrimination of samples into classes according to fabric/dye types or quality parameters was demonstrated. NIR is recommended for the rapid, non-destructive determination of total and fixed DP resin in the production of wrinkle-resistant fabrics or garments. INTRODUCTION The NIR portion of the electromagnetic spectrum covers the 700 to 2500 nanometer (nm) wavelength range. The absorbance bands observed in this region are primarily due to O-H, C-H, and N-H molecular groups. Essentially all fibers, chemicals, and finishes used in textiles are observed in NIR spectra. Although relatively weak absorbance is observed in the NIR region, this provides for the significant advantage of no sample preparation (i.e., the fabric or garment can be scanned as is). The broad overlapping absorption bands of a multiconstituent sample prevent easy measurement of a given component. However, the application of spectra pretreatment and multivariate calibration techniques allows the quantitative analysis of one or more components in a sample. Either absorbance or reflectance bands may be used for measurement depending on the instrument and sample configurations. Normally textile products are analyzed by diffuse reflectance. An excellent review of NIR theory and applications is given in Reference 1. The textile industry utilizes NIR for the measurement of size, finish, blend ratios, maturity, and mercerization. Most analyses are made in a lab or at-line (i.e., on the plant floor). On-line measurements are not common, but there is considerable interest in this approach. Although the measurement of total DP resin by NIR has been reported for 100% cotton (Reference 2) and 50/50 cotton/polyester (Reference 3), no instrumental measurement of fixed resin in the presence of unfixed resin has been reported. The common method uses the total nitrogen value to measure total resin and the nitrogen content after washing to measure the fixed resin. This method is both time consuming, destructive to the sample, and subject to error caused by other sources of nitrogen. The goal of the NIR research at Cotton Incorporated has been to give the cotton textile industry a rapid (<1 minute), non-destructive, and reliable quality control technique for monitoring DP resin finishing operations.
1
EXPERIMENTAL The early stages of the development work involved only an undyed 100% cotton 3x1 twill, 7.0 oz/yd2 treated with a typical resin formulation (see Table 1). The active DMDHEU levels on the fabric varied between about 0.2% and 4.1%. After establishing that NIR could provide accurate analysis of both fixed and total resin on the twill, the study was expanded to other constructions of 100% cotton which included fabrics dyed with reactive or vat dyes (see Table 2). Swatches of each fabric type were prepared for each resin bath. The baths were applied using a lab padder. The swatches were dried at 200F (93C) for eight minutes. A swatch of each fabric type at each resin level was cured for 45-60 seconds at 290-310F (143-154C). This provided for fixation of 8-52%. One swatch from each set was cured for 15 minutes at 310F (154C) to obtain fixation of >85%. NIR scans were collected in the warp and fill directions on the cured swatches. Total and fixed nitrogen was determined for each swatch. The corresponding resin levels were assigned to the appropriate NIR scan. The NIR spectra files were divided into calibration and validation files for the subsequent modeling and prediction studies. All spectra were collected using a NIRSystems Model 5000 spectrophotometer equipped with a hand held remote reflectance unit. The instrument covers the wavelength region from 1100-2500 nm, but calibrations were limited to 1100-2200 nm because of light absorption by the fiber optic cable above 2200 nm. NIR STATISTICAL TERMS The software available with current NIR instruments is capable of generating good models (i.e., excellent statistics) within the calibration set of spectra. However, these models may not be able to predict accurate values for samples not included in the calibration set. Thus, several sample spectra not used in the calibration files were placed into validation files. The calibration model was used to predict the resin content of the validation file samples. These predictions are the true measure of the validity of a calibration model. These predictions generate several statistical terms which may be used to judge the accuracy of the calibration model. Brief descriptions of two terms (included with each table of prediction data) are given below. 1) Bias is a measure of the offset of the values predicted by NIR measurements from the value by
lab measurement (i.e., resin values based on nitrogen analyses). A positive bias means that on the average a model will predict a value that is greater than the lab measured value by the amount of the bias. The smaller the bias the better.
2) The standard error of prediction (SEP) is the standard deviation of the differences between the
NIR and lab values. The SEP value gives an estimate of the prediction error for future measurements. With a 95% confidence limit, the error for any one resin measurement is equal to approximately ±(2 x SEP).
2

RESULTS AND DISCUSSION Determination of Total and Fixed Resin The NIR spectra of cotton, DMDHEU, silicone and polyethylene softeners are shown in Figure 1. It is common practice to utilize a second derivative pretreatment of diffuse reflectance spectra before calibration modeling or validation testing. The second derivative pretreatment removes most of the scattering differences caused by variation in surface characteristics of the fabrics. Also, second derivative transforms enhance differences in the chemical make-up of samples. The second derivative transforms of the spectra in Figure 1 are shown in Figure 2. Figures 3 and 4 show the spectra and second derivative transforms respectively of cotton with only dried resin and only cured resin. The best predictions were generated using partial least squares (PLS) modeling on the second derivative transforms. The PLS modeling utilized the entire spectral regions of either 1150-2200 nm or 1600-1860 nm. PLS modeling broke down the spectra into patterns (i.e. principal components) and correlated them to the known concentration of the resin in the sample. This type of modeling worked best because of the complex nature of the treated fabrics. A detailed explanation of PLS is given in Reference 4. The results of the NIR predictions of the validation samples for the twill from the first phase of our work are given in Figures 5 and 6 and Tables 3 and 4. Inspection of these figures and tables indicates that the total and fixed resin values were predicted very accurately for this part of the study. However, modeling on one fabric construction will not allow accurate analysis of resin on other constructions of fabric. The prediction accuracy further deteriorates as dyes are introduced. Changes in the chemicals in the resin baths provide an additional challenge. If NIR is to become a “real world” quality control tool, it must be able to handle the daily variations observed in textile finishing operations. The next step of the research was to determine the best way to compensate for changes in fabric construction and dyeing. Many textile applications of NIR presently use the technique of bias correction for this purpose. Although adequately compensating for construction changes, bias correction does not yield acceptable results with many shades and/or types of dyes. The application of PLS modeling on the second derivative transforms of calibration spectra representing all of the fabric/dye combinations in Table 2 yielded very good predictions of the validation samples. See Figures 7 and 8 and Tables 5 and 6. Note in Table 5 that the model 1 which predicted best for fabrics A, B, E, F, G, and H did not predict as well for fabrics C and D as did model 2. For the most accurate predictions, model 1 should be used for all fabrics in this series except C and D. Model 2 would be the choice for C and D. Under the discussion of classification given below, it will be shown that the NIR software can recognize the different types of fabric and assign the correct model for analysis. As part of the laboratory study leading to an on-line measurement of resin, six different undyed construction/weight fabrics were treated with a different resin formulation for each fabric. A
3

glycolated (i.e., reacted) DMDHEU was used in each formulation. As can be seen in Table 7, the fabrics and formulations varied widely. The resin was dried on the fabric without curing at that stage of the project. Again, PLS modeling on the second derivative transforms of calibration spectra representing all of the fabric/formulation combinations in Table 7 yielded very good predictions of the validation samples (see Figure 9 and Table 8). The success of the above efforts clearly shows that NIR can be used as a “real world” quality control measurement provided proper calibration procedures have been utilized. It must be noted that several days’ work may be involved in obtaining a proper calibration. However, the rapid analysis time of <1 minute and non-destructive nature of the testing make the time investment worthwhile. The analyses may be done in a laboratory or on the production floor. Thus, after cooling to near room temperature, a garment or a cart or roll of fabric could be analyzed without the need to cut out a sample. On-line Measurement of Total and Fixed Resin The on-line determination of total and fixed resin was a joint project of Cotton Incorporated and the Institute of Textile Technology. The project was funded by Cotton Incorporated and merged the respective skills and experience levels of the researchers from both organizations into a very effective team. The Direct Light™ remote reflectance spectrophotometer from NIRSystems was used in this study. It is of significantly different design than previous on-line instruments and may be mounted several inches above the moving fabric. Three to five yard by eighteen inch calibration standards were prepared from the fabrics listed in Table 7. Additionally, the fabrics were dyed with different colors, strengths, and types of dyes. The standards were cured at different times to achieve varying degrees of fixation. The standards were scanned at ITT using a simulated line at a speed of 2 yards/minute. Calibration and validation statistics were comparable to those obtained in the laboratory studies above. Production samples were scanned on an inspection frame using the normal production line speed of 65 yards/minute. The inspection frame was utilized because changes in production scheduling did not include the production of any of the calibration fabrics during the test period. The “correct” resin values of the standards and of samples from each end of the production lots were based on total nitrogen analyses corrected for nitrogen from the fabric and formulation chemicals other than resin. The results for total resin are given in Table 9 and Figure 10. The results for fixed resin are given in Table 10 and Figure 11. The negative bias (0.4-1.0%) between resin by NIR and nitrogen analysis is caused primarily by the much higher line speed of production (65 yards/minute) compared to the calibration line speed (2 yards/minute). This bias has been observed by ITT in other on-line projects. How to correct for this bias presents a significant challenge. The NIR model could be corrected to predict higher. Since the variation in the resin content of the production samples is usually very small, a bias correction would amount to a one point adjustment. Such a correction could lead to significant errors in % resin predicted at higher or lower resin levels. Cotton Incorporated is actively working to overcome this bias problem.
4

The measurement of total and fixed resin on a precure line using an on-line NIR instruments was successful. Certain concerns about the bias caused by higher line speeds must be addressed to assure accurate predictions. The calibration technique utilized in the above laboratory studies yielded excellent results for the on-line analysis as well. Discrimination into Classes The discrimination of samples into classes (hereafter referred to as classification) can be of advantage for several reasons. The flow diagram in Figure 12 shows how sample classification could be done according to product quality parameters. This would not yield quantitative values, but these may not be required in all cases. Additionally, the up-front work for classification is often not as detailed or time consuming as for the development of calibration models. The flow diagrams in Figure 13 show how classification could prevent erroneous quantitative analyses by first identifying a sample and then applying the correct calibration model. The IQ2 (Identify, Qualify, and Quantify) program supplied with the NIRSystems Model 5000 spectrophotometer was utilized in this work. The IQ2 program provides three different options for identifying samples. In order of increasing complexity, these options are spectral correlation, Mahalanobis distance, and principal component analysis (see Reference 4 for a detailed description of the latter two options). Only the first two options were investigated in this work. The efforts at Cotton Incorporated to date have been what is termed “proof of principle” research. As will be shown below, classification has been successful in two limited trials. The object of one effort was to classify DMDHEU treated 100% cotton as to the amount of total and fixed resin. The second derivative transforms of the calibration spectra from the first phase of the total and fixed resin development work above were divided into six class libraries as follows: 1) low resin level/low fixation, 2) low resin level/acceptable fixation, 3) acceptable resin level/low fixation, 4) acceptable resin level/acceptable fixation, 5) high resin level/low fixation, and 6) high resin level/acceptable fixation. The resin level classes were arbitrarily chosen to provide enough samples in each class for modeling purposes. The data are given in Table 11. A few samples have greater than 100% fixation as a result of errors in the nitrogen analyses. IQ2 was trained with these class libraries and then used to predict the class of each sample in the validation files. The best results were obtained using the spectral correlation option. As shown in Table 12, all samples were correctly classed according to the quality parameters of total resin level and % fixation. The second derivative transforms of the calibration spectra from the second phase of the total and fixed resin development work were divided into the following six class libraries: 1) knit fabric, undyed, 2) knit fabric, reactive dyed, 3) 2x1 twill, undyed, 4) 3x1 twill, undyed, 5) 3x1 twill, vat dyed, and 6) plain weave. IQ2 was trained with these class libraries and then used to predict the class of each sample in the validation files. Using the Mahalanobis distance option, each fabric in the validation files was correctly classed. Once IQ2 has identified a sample, it is capable of assigning the correct calibration models for quantitative analyses. As noted under the above discussion of the second phase work, different calibration models should be used to
5

optimize resin predictions according to the sample type. Model 2 would be selected for fabrics C and D (3x1 twill, vat dyed class) and model 1 for the other fabrics. The success of both classification efforts reflects great promise for these approaches. Extensive work is planned to test classification as a “real world” methodology. REFERENCES 1) “Near-Infrared Analysis (NIRA): A Technology for Quantitative and Qualitative
Analysis,” E. Stark, K. Luchter, and M. Margoshes, Applied Spectroscopy Reviews, Vol. 2(4), 335-399 (1986).
2) “Quantitative Analysis of Durable Press Resin on Cotton Fabrics Using Near Infrared
Reflectance Spectroscopy,” S. Ghosh and M. Cannon, Textile Research Journal, Vol. 60(3), 167-172 (1990).
3) “On-Line Measurement of Durable Press Resin on Fabrics Using NIR Spectroscopy Method,”
S. Ghosh and G. Brodmann, Textile Chemist and Colorist, Vol. 25 (4), 11-14 (1993). 4) “Chemical Systems Under Indirect Observation: Latent Properties and Chemometrics,” S.
Brown, Applied Spectroscopy, Vol. 49 (12), 14A-31A (1995).
6

TABLE 1
Resin Application Bath Formula
Chemical % OWB*
DMDHEU Resin (38% active) Varied from 1.0% to 17.0% Magnesium Chloride Catalyst Varied from 0.2% to 2.8% Wetting Agent 0.1% Silicone Softener 3.0% Polyethylene Softener 3.0%
*The softener levels were varied slightly to allow for more accurate calibration of the resin.
TABLE 2
100% Cotton Fabrics Used in Study of Construction and Dye Effects on Calibration Modeling
Fabric Construction Dye
A Interlock Knit, 40/1 RS, 5.2 oz/yd2 Undyed B Plain Weave, 6.25 oz/yd2 Undyed C 3x1 Twill, 7.5 oz/yd2 Vat Dyed, Dark Olive D 3x1 Twill, 7.5 oz/yd2 Vat Dyed, Light Olive E 2x1 Twill, 6.2 oz/yd2 Undyed F 3x1 Twill, 6.0 oz/yd2 Undyed G Interlock Knit, 40/1 RS, 5.2 oz/yd2 Reactive Dyed, Light Blue H Interlock Knit, 40/1 RS, 5.2 oz/yd2 Reactive Dyed, Dark Navy
7

TABLE 3
Data for % Total Resin on 3x1 Twill
Lab Value [Nitrogen Based] NIR Predicted Value Difference 0.89 0.97 0.08 1.14 1.25 0.11 1.33 1.26 -0.07 1.73 2.01 0.28 2.02 1.99 -0.03 2.30 2.27 -0.03 2.63 2.76 0.13 3.08 3.03 -0.05 3.66 3.44 -0.22 0.81 0.76 -0.05 1.19 1.35 0.16 1.62 1.73 0.11 1.78 1.97 0.19 2.29 2.31 0.02 2.62 2.66 0.04 3.40 3.43 0.03 3.67 3.83 0.16
Bias = 0.05% SEP = 0.13%
8

TABLE 4
Data for % Fixed Resin on 3x1 Twill
Lab Value [Nitrogen Based] NIR Predicted Value Difference 0.85 0.77 -0.08 1.11 1.14 0.03 1.28 1.17 -0.11 1.84 2.10 0.26 1.97 1.87 -0.10 2.31 2.50 0.19 2.56 2.77 0.21 3.07 3.31 0.24 3.60 3.47 -0.13 0.26 .0.08 -0.18 0.37 0.44 0.07 0.32 0.44 0.12 0.55 0.43 -0.12 0.64 0.81 0.17 0.55 0.74 0.19 0.58 0.48 -0.10 0.53 0.78 0.25 0.62 0.82 0.20 1.61 1.54 -0.07
Bias = 0.06% SEP = 0.17%
9

TABLE 5
Data on % Total Resin from Constructions/Dyes Study
Fabric Lab Value NIR ValueModel 1*
NIR ValueModel 2#
Difference
A 2.87 2.92 0.05 A 2.47 2.54 0.07 A 1.84 1.85 0.01 A 2.97 2.81 -0.16 B 1.34 1.34 0.00 B 3.04 2.90 -0.14 B 2.67 2.63 -0.04 B 0.98 0.94 -0.04 C 2.32 2.12 2.45 -0.20/0.13 C 3.22 2.72 3.02 -0.50/-0.20 C 1.88 1.94 1.86 0.06/-0.02 C 1.04 1.26 1.12 0.22/0.08 D 1.46 1.34 1.50 -0.12/0.04 D 3.25 2.82 3.17 -0.43/-0.08 D 2.99 2.76 2.91 -0.23/-0.08 D 1.07 1.18 1.06 0.11/-0.01 E 2.38 2.49 0.11 E 3.32 3.09 -0.23 E 2.93 3.06 0.13 E 1.09 1.28 0.19 F 3.35 3.19 -0.16 F 3.09 3.01 -0.08 F 1.95 2.16 0.21 F 1.10 1.31 0.21 G 2.97 3.03 0.06 G 2.39 2.46 0.07 G 3.03 2.99 -0.04 G 1.73 1.89 0.16 H 1.04 1.20 0.16 H 2.53 2.52 -0.01 H 3.09 3.07 -0.02 H 2.53 2.60 0.07
* 7 Factor PLS Model (1150-2200nm) #7 factor PLS Model (1600-1860nm)
10

TABLE 5 (Continued)
Fabric Bias, % SEP, % Fabric Bias, %
SEP, %
A -0.06 0.10 D(Model 2) -0.03 0.07 B -0.05 0.09 E 0.05 0.20
C(Model 1) -0.11 0.34 F 0.04 0.20 C(Model 2) 0.00 0.14 G 0.06 0.11 D(Model 1) -0.17 0.30 H 0.05 0.10
TABLE 6
Data on % Fixed Resin from Constructions/Dyes Study
Fabric Lab Value NIR Value DifferenceA 0.41 0.40 -0.01 A 1.11 0.76 -0.35 A 1.68 1.68 0.00 A 2.73 2.71 -0.02 B 0.03 0.09 0.06 B 0.43 0.52 0.09 B 2.55 2.64 0.09 B 0.90 0.83 -0.07 C 0.19 0.16 -0.03 C 0.58 0.59 0.01 C 1.91 2.00 0.09 C 1.01 1.18 0.17 D 0.10 0.06 -0.04 D 0.49 0.39 -0.10 D 2.87 2.93 0.06 D 1.03 1.14 0.11 E 0.10 0.14 0.04 E 0.21 0.46 0.25 E 2.84 3.11 0.27 E 1.05 1.24 0.19 F 2.93 2.89 -0.05 F 0.15 -0.10 -0.25 F 1.05 1.11 0.06
11

TABLE 6 (Continued)
Fabric Lab Value NIR Value DifferenceG 0.76 0.71 -0.05 G 0.54 0.73 0.19 G 2.77 2.95 0.18 G 1.60 1.64 0.04 H 0.27 -0.14 -0.41 H 0.66 0.69 0.03 H 0.74 0.90 0.16 H 2.31 2.52 0.21
Fabric Bias, % SEP, % A 0.09 0.20 B 0.04 0.09 C 0.06 0.11 D 0.07 0.10 E 0.19 0.24 F -0.07 0.18 G 0.09 0.15 H 0.00 0.28
12

TABLE 7
Fabrics and Resin Bath Formulations for On-line Study*
Fabric AA 3x1 Twill, 7.3 oz./yd.
% owb Fabric BB 3x1 Twill, 12 oz./yd.
% owb
Wetter 1 0.29 Ethylene Urea 1.0 Defoamer 0.013 Wetter 1 0.5
Lubricant 1 1.5 Defoamer 0.013 Wetter 2 0.14 Lubricant 1 1.5 Softener 2.25 Shrink. Controller 2.0
Lubricant 2 0.5 Lubricant 2 0.62
Fabric CC 3x1 Twill, 4.8 oz./yd.
% owb Fabric DD 3x1 Twill, 14 oz./yd.
% owb
Wetter 1 0.29 Ethylene Urea 1.0 Defoamer 0.013 Wetter 1 0.5
Lubricant 1 1.5 Defoamer 0.013 Shrink. Controller 3.0 Lubricant 1 2.0
Lubricant 2 0.5 Shrink. Controller 3.0 Lubricant 2 0.62
Fabric EE Canvas,
7.5 oz./yd.
% owb Fabric FF Chamois, 7 oz./yd.
% owb
Wetter 1 0.29 Wetter 1 0.29 Defoamer 0.013 Defoamer 0.013
Lubricant 1 1.5 Lubricant 1 3.5 Shrink. Controller 3.0 Crock Fast. Agent 2.5
Softener 2.02.0 Shrink. Controller 2.5 Lubricant 2 0.5 Ethylene Urea 1.0
Urea 0.4 *Glycolated DMDHEU Resin and Catalyst Varied over Appropriate
Range (0.9-12.0% owb of resin)
13

TABLE 8
Data for % Total Resin from On-line Lab Study
Fabric Lab Value NIR Value DifferenceAA 0.18 0.09 -0.09 AA 0.18 0.08 -0.10 AA 0.35 0.34 -0.01 AA 0.53 0.41 -0.12 AA 0.53 0.48 -0.05 AA 0.53 0.38 -0.15 AA 0.70 0.78 0.08 AA 0.88 0.84 -0.04 AA 1.37 1.48 0.11 AA 1.41 1.33 -0.08 AA 1.41 1.22 -0.19 AA 1.58 1.83 0.25 AA 1.93 2.02 0.09 AA 2.11 2.07 -0.04 BB 0.34 0.29 -0.05 BB 0.52 0.71 0.19 BB 0.69 0.78 0.09 BB 0.86 0.95 0.09 BB 1.03 1.09 0.06 BB 1.03 1.19 0.16 BB 0.20 1.27 0.07 BB 1.20 1.18 -0.02 BB 1.20 1.28 0.08 BB 1.37 1.43 0.06 BB 1.72 1.64 -0.08 BB 1.89 1.74 -0.15 BB 1.89 1.73 -0.16 BB 2.23 1.99 -0.24 CC 0.30 0.25 -0.05 CC 0.40 0.36 -0.04 CC 0.40 0.41 0.01 CC 0.50 0.51 0.01 CC 0.50 0.61 0.11 CC 0.60 0.53 -0.07 CC 0.70 0.74 0.04
14

TABLE 8 (Continued)
Fabric Lab Value NIR Value DifferenceDD 0.37 0.47 0.10 DD 0.37 0.50 0.13 DD 1.12 1.33 0.21 DD 1.12 1.32 0.20 DD 1.49 1.64 0.15 DD 1.49 1.64 0.15 DD 1.68 1.69 0.01 DD 1.68 1.69 0.01 DD 1.87 1.78 -0.09 DD 1.87 1.76 -0.11 DD 2.24 2.16 -0.08 DD 2.24 2.10 -0.14 EE 0.28 0.20 -0.08 EE 0.56 0.48 -0.08 EE 0.93 1.06 0.13 EE 1.12 1.25 0.13 EE 1.68 1.97 0.29 EE 1.68 1.83 0.15 FF 0.25 0.18 -0.07 FF 0.25 0.23 -0.02 FF 0.76 0.77 0.01 FF 0.76 0.86 0.10 FF 1.39 1.35 -0.04 FF 1.39 1.47 0.08 FF 1.77 1.87 0.10 FF 1.77 1.82 0.05 FF 2.28 2.12 -0.16 FF 2.28 2.09 -0.19
Fabric Bias, % SEP, % AA -0.02 0.12 BB 0.01 0.12 CC 0.00 0.06 DD 0.04 0.13 EE 0.09 0.18 FF 0.02 0.10
15

TABLE 9
Data for % Total Resin from On-line Project
Fabric Lot # Resin by Nitrogen Range Resin by NIR Range Fabric BB
1 2.13 0.07 1.28 0.09 2 2.13 0.04 1.31 0.08 3 2.18 0.06 1.36 0.12 4 2.00 0.05 1.25 0.08 5 2.11 0.06 1.38 0.12 6 2.08 0.07 1.34 0.12 7 2.12 0.71 1.25 0.07
Fabric FF 8 2.62 0.19 2.13 0.05 9 3.64 0.15 2.80 0.84
TABLE 10
Data for % Fixed Resin from On-line Project
Fabric Lot # Resin by Nitrogen Range Resin by NIR Range Fabric BB
1 1.74 0.04 1.62 0.09 2 1.76 0.05 1.55 0.16 3 1.77 0.08 1.47 0.22 4 1.67 0.04 1.28 0.17 5 1.68 0.06 1.37 0.24 6 1.74 0.05 1.30 0.12 7 1.74 0.07 1.40 0.16
Fabric FF 8 1.66 0.06 1.09 0.03 9 1.59 0.10 1.55 0.06
16

TABLE 11
Classification Libraries for Total and Fixed Resin
Low Resin (<1.9%)/Low Fixation (<52%) % Total Resin % Fixed Resin % Fixation
1.2 0.27 23 1.2 0.27 23 1.41 0.46 33 1.64 0.55 34 1.89 0.98 52 1.89 0.98 52
Low Resin (<1.9%)/Acpt. Fixation (93-106%)
% Total Resin % Fixed Resin % Fixation 1.17 1.19 102 1.40 1.49 106 1.40 1.49 106 1.68 1.75 104 1.93 1.88 97
Acpt. Resin (2.1-3.2%)/Low Fixation (<52%)
% Total Resin % Fixed Resin % Fixation 2.84 0.23 8 2.84 0.23 8 2.38 0.38 16 2.38 0.38 16 2.16 0.46 21 2.63 0.49 19 3.09 0.78 25 3.09 0.78 25
Acpt. Resin (2.1-3.2%)/Acpt. Fixation (93-106%)
% Total Resin % Fixed Resin % Fixation 2.14 2.22 104 2.36 2.32 98 2.36 2.32 98 2.62 2.47 94 2.90 2.81 97 2.90 2.81 97 3.19 2.98 99
17

TABLE 11 (Continued)
High Resin (>3.3%)/ Low Fixation (<52%) % Total Resin % Fixed Resin % Fixation
3.36 0.44 13 3.54 0.53 15 3.81 1.32 35 3.81 1.32 35
High Resin (>3.3%)/ Acpt. Fixation (93-106%)
% Total Resin % Fixed Resin % Fixation 3.53 3.51 99 3.70 3.80 103 3.70 3.80 103
TABLE 12
Results for Classification of Validation Files
SAMPLE # TOTAL RESIN
FIXED RESIN
% FIXATION CLASS CORRELATION COEFFICIENT*
1 0.72 0.76 106 L/A 1.000 2 0.94 1.02 109 L/A 1.000 3 1.17 1.19 102 L/A 1.000 4 1.68 1.75 104 L/A 1.000 5 1.93 1.88 97 L/A 1.000 6 2.14 2.22 104 A/A 1.000 7 2.62 2.47 94 A/A 1.000 8 3.19 2.98 93 A/A 1.000 9 3.53 3.51 99 H/A 1.000 10 0.24 0.17 71 L/L 0.996 11 0.48 0.28 58 L/L 0.999 12 0.93 0.23 25 L/L 1.000 13 1.41 0.46 33 L/L 1.000 14 1.64 0.55 34 L/L 1.000 15 2.16 0.46 21 A/L 1.000 16 2.63 0.49 19 A/L 1.000 17 3.36 0.44 13 H/L 1.000 18 3.54 0.53 15 H/L 1.000 19 4.07 1.52 37 H/L 1.000
*1.00 is perfect match. Any value greater than 0.98 is considered an excellent match.
18
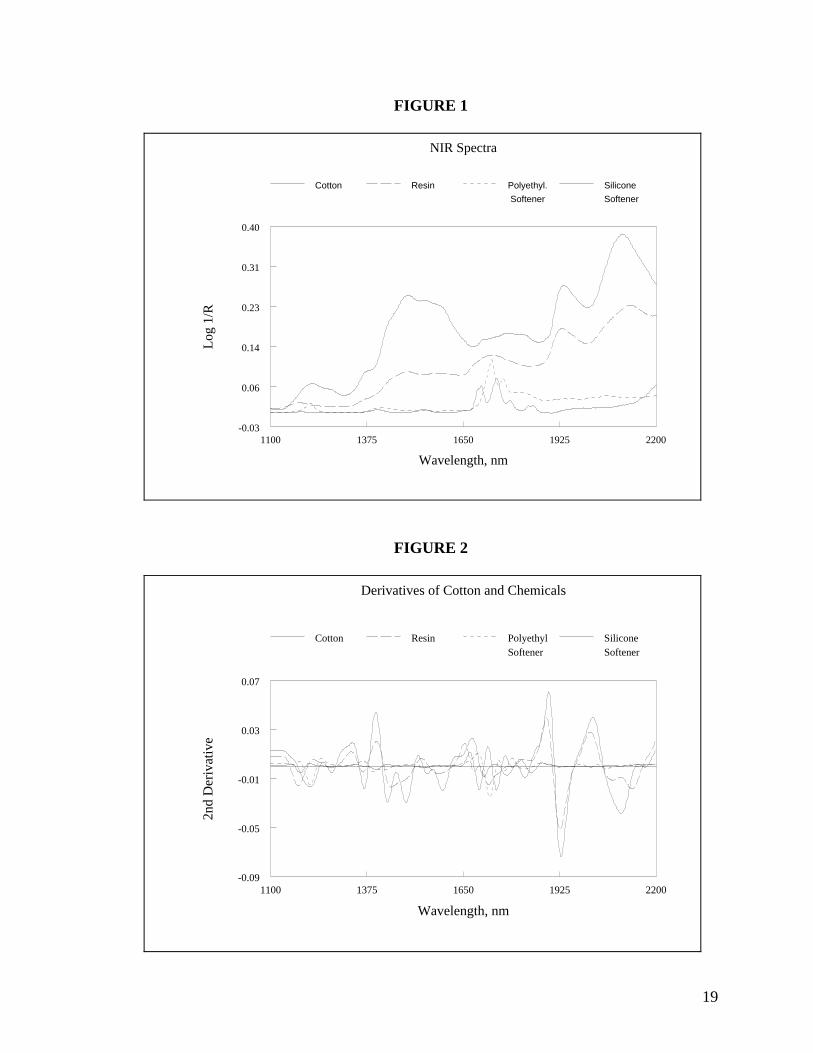
FIGURE 1
1100 1375 1650 1925 2200
Wavelength, nm
-0.03
0.06
0.14
0.23
0.31
0.40
Log
1/R
NIR Spectra
Cotton Resin Polyethyl. Softener
Silicone Softener
FIGURE 2
1100 1375 1650 1925 2200
Wavelength, nm
-0.09
-0.05
-0.01
0.03
0.07
2nd
Der
ivat
ive
Derivatives of Cotton and Chemicals
Cotton Resin PolyethylSoftener
SiliconeSoftener
19

FIGURE 3
1500 1600 1700 1800 1900 2000 2100 2200
Wavelength, nm
0.1
0.2
0.3
0.4
Log
1/R
NIR Spectra of Cotton Plus Resin
Cotton Dried Resin OnCotton
Fixed Resin OnCotton
FIGURE 4
1500 1675 1850 2025 2200
Wavelength, nm
-0.08
-0.04
0.00
0.04
0.08
2nd
Der
ivat
ive
Derivatives of Cotton Plus Resin
Cotton Dried Resin OnCotton
Fixed Resin OnCotton
20

FIGURE 5
0.0 1.0 2.0 3.0 4.0
Lab Value, % DMDHEU
0.0
1.0
2.0
3.0
4.0
NIR
Val
ue, %
Comparison of Total Resin[Lab Work on 3x1 Twill]
Ideal Fit
FIGURE 6
0.0 1.0 2.0 3.0 4.0
Lab Value, % DMDHEU
0.0
1.0
2.0
3.0
4.0
NIR
Val
ue, %
Comparison of Fixed Resin[Lab Work on 3x1 Twill]
Ideal Fit
21

FIGURE 7
0.5 1.5 2.5 3.5
Lab Values, % DMDHEU
0.5
1.5
2.5
3.5N
IR V
alue
s, %
Comparison of Total Resin[Lab Work on Constructions/Dyes]
A B C1 C2 D1 D2E F G H Ideal Fit
FIGURE 8
0.0 1.0 2.0 3.0
Lab Values, % DMDHEU
0.0
1.0
2.0
3.0
NIR
Val
ues,
%
Comparison of Fixed Resin[Lab Work on Constructions/Dyes]
A B C D EF G H Ideal Fit
22
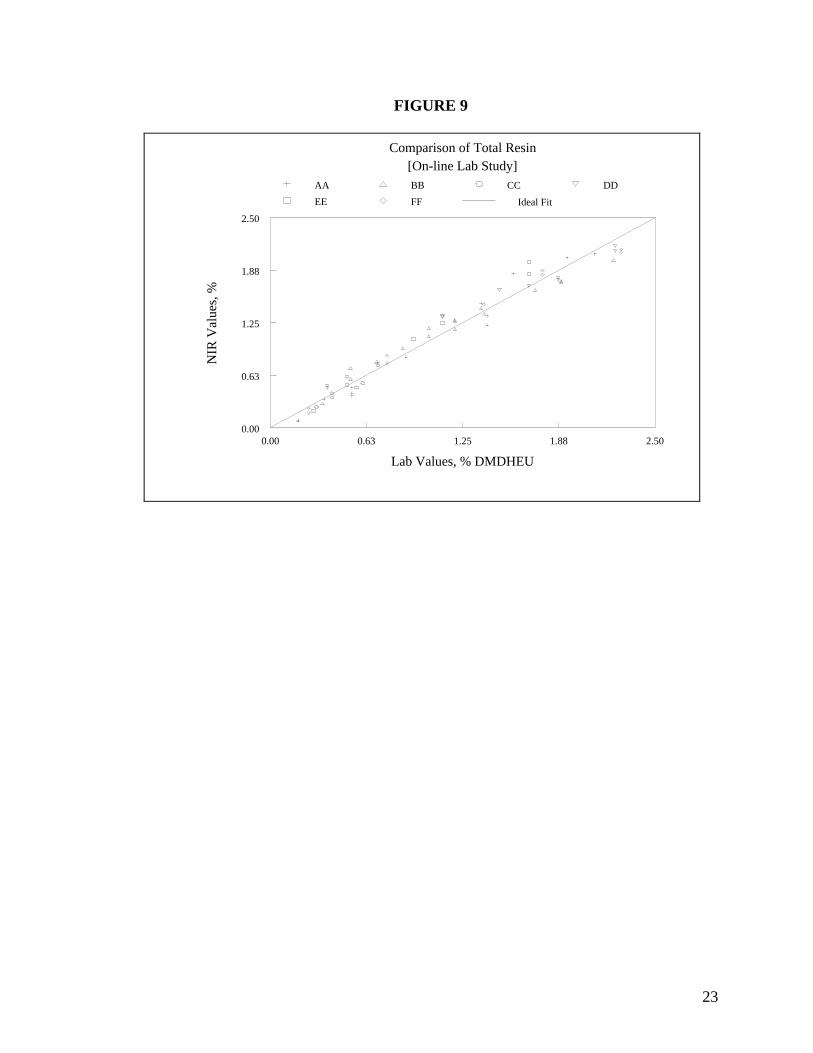
FIGURE 9
0.00 0.63 1.25 1.88 2.50
Lab Values, % DMDHEU
0.00
0.63
1.25
1.88
2.50N
IR V
alue
s, %
Comparison of Total Resin[On-line Lab Study]
AA BB CC DDEE FF Ideal Fit
23

FIGURE 10
2
Comparison of Total Resin
FIGURE 11
1 2 3 4 5 5 6 7 8 9
Fabric Lot Number
0.0
1.0
2.0
3.0
4.0%
Tot
al R
esin
[On-line Project]On-line NIR Total Nitrogen
1 2 3 4 5 5 6 7 8 9
Fabric Lot Number
0.0
0.5
1.0
1.5
2.0
% F
ixed
Res
in
Comparison of Fixed Resin[On-line Project]
On-line NIR Total Nitrogen
4

FIGURE 12
Flow Chart for NIR Classification
Sample ClassifiedYes/No
Collect NIR Spectrum
Compare to SpectraData Base
Report
Alarm/Report
No
Yes
No
Yes
ID Sample
Alarm/Report
Acceptable QualityYes/No What Is Wrong!
Add
25

FIGURE 13
Sample IdentifiedYes/No
Collect NIR Spectrum
Compare to SpectraData Base
Alarm/Report(NO ANALYSIS)
Calibration ModelChoose Correct
Predict % Resin
% Resin In SpecYes/No
Report
Alarm/Report
No
Yes
No
Yes
AddID Sample
Flow Chart for Identification FollowedBy Quantitative Analysis
"The statements, recommendations, and suggestions contained herein are based on experiments and information believed to be reliable only with regard to the products and/or processes involved at the time. No guarantee is made of their accuracy, however, and the information is given without warranty as to its accuracy or reproducibility either express or implied, and does not authorize use of the information for purposes of advertisement or product endorsement or certification. Likewise, no statement contained herein shall be construed as a permission or recommendation for the use of any information, product, or process that may infringe any existing patents. The use of trade names does not constitute endorsement of any product mentioned, nor is permission granted to use the name Cotton Incorporated or any of its trademarks in conjunction with the products involved."
26

RESEARCH AND TECHNICAL SERVICES Cotton Incorporated is a research and promotion company representing cotton worldwide. Through research and technical services, our company has the capability to develop, evaluate, and then commercialize the latest technology to benefit cotton. • Agricultural research leads to improved agronomic practices, pest control, and fiber variants with
properties required by the most modern textile processes and consumer preferences. Ginning development provides efficient and effective machines for preservation of fiber characteristics. Cottonseed value is enhanced with biotechnology research to improve nutritional qualities and expand the animal food market.
• Research in fiber quality leads to improved fiber testing methodology and seasonal fiber analyses to bring
better value both to growers and then mill customers. • Computerized fiber management techniques result from in-depth fiber processing research. • Product Development and Implementation operates programs leading to the commercialization of new
finishes and improved energy and water conserving dyeing and finishing systems. New cotton fabrics are engineered -- wovens, circular knits, warp knits, and nonwovens -- that meet today's standards for performance.
• Technology Implementation provides comprehensive and customized professional assistance to the cotton
industry and its customers -- textile mills and manufacturers. • A fiber-to-yarn pilot spinning center allows full exploration of alternative methods of producing yarn for
various products from cotton with specific fiber profiles. • The Company operates its own dyeing and finishing laboratory, knitting laboratory, and a laboratory for
physical testing of yarn, fabric, and fiber properties including High Volume Instrument testing capable of measuring micronaire, staple length, strength, uniformity, color, and trash content.
For further information contact:
COTTON INCORPORATED COTTON INCORPORATED WORLD HEADQUARTERS CONSUMER MARKETING HEADQUARTERS 6399 WESTON PARKWAY 488 MADISON AVENUE CARY, NC 27513 NEW YORK, NY 10022-5702 PHONE: 919-678-2220 PHONE: 212-413-8300 FAX: 919-678-2230 FAX: 212-413-8377
Other Locations • Los Angeles • Mexico City • Osaka • Shanghai • Singapore •
Visit our website at: www.cottoninc.com