Embed Size (px)
Citation preview

Reference number ECMA-123:2009
© Ecma International 2009
ECMA-74 15th Edition / June 2018
Measurement of
Airborne Noise emitted by Information
Technology and
Telecommunications Equipment

COPYRIGHT PROTECTED DOCUMENT
© Ecma International 2018

© Ecma International 2018 i
Contents Page
1 Scope ...................................................................................................................................................... 1
2 Normative references ............................................................................................................................ 2
3 Terms and definitions ........................................................................................................................... 3 3.1 General definitions ................................................................................................................................ 3 3.2 Acoustical definitions ........................................................................................................................... 5
4 Conformity requirements...................................................................................................................... 7
5 Installation and operating conditions ................................................................................................. 7 5.1 Equipment installation .......................................................................................................................... 7 5.1.1 General ................................................................................................................................................... 7 5.1.2 Floor-standing equipment .................................................................................................................... 8 5.1.3 Table-top equipment ............................................................................................................................. 8 5.1.4 Wall-mounted equipment ...................................................................................................................... 8 5.1.5 Rack-mounted equipment .................................................................................................................... 9 5.1.6 Hand-held equipment ............................................................................................................................ 9 5.1.7 Sub-assemblies ..................................................................................................................................... 9 5.2 Input voltage and frequency ................................................................................................................ 9 5.3 Equipment operation ............................................................................................................................. 9
6 Method for determination of sound power levels of equipment in reverberation test rooms .... 10 6.1 General ................................................................................................................................................. 10 6.2 Measurement uncertainty ................................................................................................................... 11 6.3 Test environment ................................................................................................................................. 11 6.3.1 General ................................................................................................................................................. 11 6.3.2 Meteorological conditions .................................................................................................................. 11 6.4 Instrumentation ................................................................................................................................... 12 6.4.1 General ................................................................................................................................................. 12 6.4.2 The microphone and its associated cable ........................................................................................ 12 6.4.3 Frequency response of the instrumentation system ....................................................................... 12 6.4.4 Reference sound source..................................................................................................................... 12 6.4.5 Filter characteristics ........................................................................................................................... 12 6.4.6 Calibration ............................................................................................................................................ 12 6.5 Installation and operation of equipment: General requirements ................................................... 13 6.6 Microphone positions and source locations .................................................................................... 13 6.6.1 General ................................................................................................................................................. 13 6.6.2 Number of microphone positions, reference sound source locations and equipment
locations ............................................................................................................................................... 13 6.6.3 Microphone arrangement ................................................................................................................... 13 6.7 Measurement of sound pressure level .............................................................................................. 13 6.7.1 General ................................................................................................................................................. 13 6.7.2 Measurement time interval ................................................................................................................. 14 6.7.3 Corrections for background noise .................................................................................................... 14 6.8 Measurement of the sound pressure level of the reference sound source .................................. 14 6.9 Calculation of the mean time-averaged band sound pressure levels ........................................... 14 6.10 Determination of sound power level ................................................................................................. 14 6.10.1 Calculation of band sound power levels ........................................................................................... 14 6.10.2 Calculation of A-weighted sound power level .................................................................................. 15
7 Method for determination of sound power levels of equipment under essentially free-field conditions over a reflecting plane ..................................................................................................... 17
7.1 General ................................................................................................................................................. 17 7.2 Measurement uncertainty ................................................................................................................... 17

ii © Ecma International 2018
7.3 Test environment ................................................................................................................................ 18 7.3.1 General ................................................................................................................................................. 18 7.3.2 Meteorological conditions ................................................................................................................. 19 7.4 Instrumentation ................................................................................................................................... 19 7.4.1 General ................................................................................................................................................. 19 7.4.2 The microphone and its associated cable ....................................................................................... 20 7.4.3 Frequency response of the instrumentation system ...................................................................... 20 7.4.4 Reference sound source .................................................................................................................... 20 7.4.5 Filter characteristics ........................................................................................................................... 20 7.4.6 Calibration ........................................................................................................................................... 20 7.5 Installation and operation of equipment: General requirements ................................................... 20 7.6 Measurement surface and microphone positions ........................................................................... 20 7.6.1 General ................................................................................................................................................. 20 7.6.2 Microphone positions on the measurement surface ...................................................................... 21 7.7 Measurement of sound pressure levels ........................................................................................... 22 7.7.1 General ................................................................................................................................................. 22 7.7.2 Measurement time interval ................................................................................................................ 22 7.7.3 Corrections for background noise .................................................................................................... 22 7.8 Calculation of surface time-averaged sound pressure level ......................................................... 22 7.9 Determination of time-averaged sound power levels ..................................................................... 23 7.9.1 Calculation of band time-averaged sound power levels ................................................................ 23 7.9.2 Calculation of A-weighted sound power level ................................................................................. 23
8 Method for determination of emission sound pressure levels at defined operator and bystander positions ............................................................................................................................ 23
8.1 General ................................................................................................................................................. 23 8.2 Measurement uncertainty .................................................................................................................. 24 8.3 Test environment ................................................................................................................................ 25 8.3.1 General ................................................................................................................................................. 25 8.3.2 Meteorological conditions ................................................................................................................. 25 8.4 Instrumentation ................................................................................................................................... 25 8.5 Installation and operation of equipment .......................................................................................... 25 8.6 Microphone positions ........................................................................................................................ 26 8.6.1 At the operator position(s) ................................................................................................................. 26 8.6.2 At the bystander positions ................................................................................................................ 28 8.6.3 Microphone orientation ...................................................................................................................... 28 8.7 Measurement of sound pressure levels ........................................................................................... 28 8.7.1 General ................................................................................................................................................. 28 8.7.2 Measurement time interval ................................................................................................................ 29 8.7.3 Corrections for background noise .................................................................................................... 29 8.8 Determination of emission sound pressure levels ......................................................................... 29 8.8.1 Calculation of band emission sound pressure levels..................................................................... 29 8.8.2 Calculation of A-weighted emission sound pressure levels from band levels ............................ 29 8.8.3 Calculation of the mean emission sound pressure level at the bystander positions ................. 30
9 Information to be recorded and reported ......................................................................................... 31 9.1 Information to be recorded ................................................................................................................ 31 9.1.1 General ................................................................................................................................................. 31 9.1.2 Equipment under test ......................................................................................................................... 31 9.1.3 Acoustical environment ..................................................................................................................... 31 9.1.4 Instrumentation ................................................................................................................................... 32 9.1.5 Acoustical data ................................................................................................................................... 33 9.2 Test report ........................................................................................................................................... 35
Annex A (normative) Test accessories .......................................................................................................... 37
Annex B (normative) Measurement surfaces ................................................................................................ 41
Annex C (normative) Installation and operating conditions for specific equipment categories ............. 47
Annex D (informative) Identification and evaluation of prominent discrete tones .................................... 95
Annex E (informative) Detection of impulsive noise ................................................................................. 113
© Ecma International 2018 iii
Annex F (informative) A hearing model approach to calculate psychoacoustic parameters ................. 115
Annex G (informative) Identification and evaluation of prominent tonalities using a psychoacoustic tonality calculation method.................................................................................. 125

iv © Ecma International 2018

© Ecma International 2018 v
Introduction
ECMA-74 specifies methods for the measurement of airborne noise emitted by information technology and telecommunications equipment. Hitherto, a wide variety of methods have been applied by individual manufacturers and users to satisfy particular equipment or application needs. These diverse practices have, in many cases, made comparison of noise emission difficult. This Standard simplifies such comparisons and is the basis for declaration of the noise emission level of information technology and telecommunications equipment.
In order to ensure accuracy, validity and acceptability, this Standard is based on the basic Standards for determining the sound power level and for determining the emission sound pressure level at the operator position(s) and bystander position(s). Furthermore, implementation is simplified by conformance with these International Standards.
In many cases free-field conditions over a reflecting plane are realised by hemi-anechoic rooms. These rooms may be particularly useful during product design to locate and to improve individual contributing noise sources. Reverberation test rooms may be more economical for production control and for obtaining sound power levels for noise emission declaration purposes.
The method for measuring the emission sound pressure level at the operator or bystander positions (based on ISO 11201) is specified in a separate clause, as this level is not considered to be primary noise emission declaration information. The measurements can, however, be carried out in conjunction with those for sound power determination in a free field over a reflecting plane.
For comparison of similar equipment it is essential that the installation conditions and mode of operation are the same. In Annex C these parameters are standardized for many categories of equipment.
The first edition of this Standard was issued in September 1981. It was contributed to ISO/TC 43 and formed the base for ISO 7779:1988, first edition. The second edition of ECMA-74 was issued in December 1987. The third edition was issued in December 1992 and was submitted to ISO for fast-track processing as a revision to ISO 7779 in the spring of 1993. The document was balloted by ISO from November 1994 to May 1995 and was approved with 18 of 20 P members in favour and 2 of 22 member bodies opposed. The fourth edition was issued in December 1996, taking into account most of the comments that accompanied the voting. The fifth edition was issued December 1997 to add a new equipment category – CD- and DVD-ROM drives as C.19.
ISO 7779, second edition, was published August 1st, 1999. The sixth edition of ECMA-74 was adapted to the final wording of new ISO 7779 and also included additional provisions for CD- and DVD-ROM drives as C.19. Now C.19 with minor modifications was adopted as ISO/DIS 7779 Amendment 1.
The C.19 changes that are in ISO/DIS 7779 Amendment 1 along with a revised Annex B and a revised Annex D are included in the seventh edition of ECMA-74, which was approved in December, 2002. The Annex B includes a provision allowing the use of a 0,5 m radius hemispherical surface for measuring the sound power emitted by small noise sources such as disk drives. Annex B also allows the use of a cylindrical measurement surface. The revised Annex D in the seventh edition includes prominence ratio in addition to tone-to-noise ratio, provides improved figures illustrating the tone-to-noise and prominence ratio calculations, and contains new criteria for prominent discrete tones. The new criteria are a result of a three-year study by Ecma TC26 and ITI TC6.
For the eighth edition, the reference list was updated and some text modified to account for the changes. The cylindrical measurement surface section of Annex B was re-worded to more closely follow the wording used in the draft of ISO 3744. Annex C contains additional figures in section C.15 on personal computers and workstations. A new equipment category, C.20, for data projectors was added. Also Annex D was expanded with additional figures, equations and examples.

vi © Ecma International 2018
For the ninth edition, only Annex D was modified. Changes were made in part to better define the critical band edges, including changing from geometric critical bands to arithmetic critical bands for frequencies below 500 Hz. Also, curves were fitted to the band edges for the lower and upper critical bands when calculating prominence ratio, thus eliminating the need to use iteration for the calculations. Clarifications were added on frequency range of interest and elsewhere. The criteria for prominence did not change.
For the 10th edition, changes were made to the main body of the Standard to be in agreement with upcoming changes in the underlying standards: ISO 3741, ISO 3744, ISO 3745 and ISO 11201. Two new equipment categories were added to Annex C: 1) multi-function devices (MFDs) and 2) hand-held computing and media playback devices. The addition of these categories included some changes in the main body of the Standard as well as some of the other print-related categories. Annex D was revised to give clearer direction on determining the prominence of tones as well as introducing the concept of Threshold of Hearing when analyzing very low-noise equipment.
For the 11th edition, changes were made to the Standard to align more closely with ISO 7779:2010, 3rd edition. A new equipment category was added to Annex C, Digital media recorders and playback units for consumer use. Also the document was reformatted with the new Ecma standards template.
For 12th edition, there were several updates as follows:
In Clause 3, the wording of some definitions was updated to be more consistent with the basic
standards (ISO 3741, ISO 3744, ISO 3745, ISO 11201).
In 7.3.1 and related sections, an expanded criteria on the environmental correction K2 was added to
address its more detailed treatment in the basic standards.
In Annex B, the minimum number of fixed microphone positions on the cylindrical measurement
surface was made consistent with ISO 3744 Annex D.
In Annex C, the clarity and consistency of procedures for imaging equipment under C.3, C.13, C.16
and C.21 were improved. Inkjet printers were categorized under C.16. Procedures for measuring idle
mode noise were made uniform. The measurement of functional operations under C.13, C.16 and
C.21 were aligned with one another and with the typical use prescription of C.1. The consistency of
media use and reporting procedures across C.13, C.16 and C.21 was improved. Hand-held
computing and media playback devices under C.22 having neither air moving devices nor a hard disk
drive were generally exempted from reporting requirements.
In Annex D, bibliographical references [18], [19] and [20] were replaced by ISO 28961[29].
For 13th edition, there were several updates as follows:
In 6.4.6 and 7.4.6, the microphone calibration procedures were amended to be consistent to those of
the basic standards (ISO 3741 and 3744, respectively).
In 7.3.1, the procedure for test environment qualification was amended to clarify that any frequency
bands, typically low in frequency, not significantly affecting A-weighted sound power level need not
meet the hemi-anechoic room qualification criteria for the purposes of determining A-weighted sound
power level.
In Annex B, B.2, a procedure for reducing the microphone positions on cylindrical measurement
surface was introduced. This procedure is not presently in ISO 3744 but is expected in future versions
of ISO 3744. In addition, editorial improvements were made, and equations were renumbered.
In Annex D, some editorial improvements were made, and references to content within the annex
were corrected (no technical changes).
In Annex E, the method for detecting impulsive noise was removed. Because, by the recent update of
IEC 61672-1:2013, the time-weighting I, which was the technical basis of the previous detection
method in Annex E, had been removed. However, for historical reasons and also for the possibility of

© Ecma International 2018 vii
future development of another method detecting for impulsive noise, this informative Annex E remains
with the same title, at least, in the 13th edition.
For 14th edition, there were several updates as follows:
Annex C, C.21 Multi-function devices and its related categories were updated to harmonize their
gramages and to refine MFD’s mandatory test conditions.
For 15th edition, there were several updates as follows:
In Annex D descriptions were amended to clarify that Annex D permits using FFT data below 89,1 Hz
and above 11 200 Hz to calculate tone-to-noise ratio and prominence ratio. Notes were added to
indicate that new metrics are under development for detecting prominent discrete tones for small fans
whose noise emissions consist of many harmonic components and other discrete tones.
A new Annex F was included on a hearing model approach to calculate psychoacoustic parameters
such as prominent tonalities contained in the new Annex G and other psychoacoustic parameters.
A new Annex G was included on the identification and evaluation of prominent tonalities using a
psychoacoustic tonality calculation method, which is based on the hearing model approach in Annex
F. This method complements the procedures for determining prominent discrete tones contained in
Annex D.
This Ecma Standard was developed by Technical Committee 26 and was adopted by the Gener al Assembly of June 2018.

viii © Ecma International 2018
"COPYRIGHT NOTICE
© 2018 Ecma International
This document may be copied, published and distributed to others, and certain derivative works of it may be prepared, copied, published, and distributed, in whole or in part, provided that the above copyright notice and this Copyright License and Disclaimer are included on all such copies and derivative works. The only derivative works that are permissible under this Copyright License and Disclaimer are:
(i) works which incorporate all or portion of this document for the purpose of providing commentary or explanation (such as an annotated version of the document),
(ii) works which incorporate all or portion of this document for the purpose of incorporating features that provide accessibility,
(iii) translations of this document into languages other than English and into different formats and
(iv) works by making use of this specification in standard conformant products by implementing (e.g. by copy and paste wholly or partly) the functionality therein.
However, the content of this document itself may not be modified in any way, including by removing the copyright notice or references to Ecma International, except as required to translate it into languages other than English or into a different format.
The official version of an Ecma International document is the English language version on the Ecma International website. In the event of discrepancies between a translated version and the official version, the official version shall govern.
The limited permissions granted above are perpetual and will not be revoked by Ecma International or its successors or assigns.
This document and the information contained herein is provided on an "AS IS" basis and ECMA INTERNATIONAL DISCLAIMS ALL WARRANTIES, EXPRESS OR IMPLIED, INCLUDING BUT NOT LIMITED TO ANY WARRANTY THAT THE USE OF THE INFORMATION HEREIN WILL NOT INFRINGE ANY OWNERSHIP RIGHTS OR ANY IMPLIED WARRANTIES OF MERCHANTABILITY OR FITNESS FOR A PARTICULAR PURPOSE."

© Ecma International 2018 1
Measurement of Airborne Noise emitted by Information Technology and Telecommunications Equipment
1 Scope
This Ecma Standard specifies procedures for measuring and reporting the noise emission of information technology and telecommunications equipment.
NOTE 1 This Standard is considered part of a noise test code (see 3.1.2) for this type of equipment, and is based on basic noise emission standards (see 3.1.1) ISO 3741, ISO 3744, ISO 3745 and ISO 11201.
The basic emission quantity is the A-weighted sound power level which may be used for comparing equipment of the same type but from different manufacturers, or for comparing different equipment.
Three basic noise emission standards for determining the sound power levels are specified in this Ecma Standard in order to avoid undue restriction on existing facilities and experience. ISO 3741 specifies comparison measurements in a reverberation test room; ISO 3744 and ISO 3745 specify measurements in an essentially free field over a reflecting plane. Any one of these three basic noise emission standards can be selected and shall then be used exclusively in accordance with this Standard when determining sound power levels of a machine.
The A-weighted sound power level is supplemented by the A-weighted emission sound pressure level determined at the operator position(s) or the bystander positions, based on the basic noise emission standard ISO 11201. This sound pressure level is not a worker's immission rating level, but it can assist in identifying any potential problems that could cause annoyance, activity interference, or hearing damage to operators and bystanders.
Method for determination of whether the noise emission includes prominent discrete tones is specified in Annex D. A psychoacoustic tonality calculation method on the identification and evaluation of prominent tonalities is specified in Annex G (based on the hearing model approach in Annex F). This method complements the procedures for determining prominent discrete tones contained in Annex D.
This Standard is suitable for type tests and provides methods for manufacturers and testing laboratories to obtain comparable results.
The methods specified in this Standard allow the determination of noise emission levels for a functional unit (see 3.1.4) tested individually.
The procedures apply to equipment which emits broad-band noise, narrow-band noise and noise which contains discrete-frequency components, or impulsive noise.
The sound power and emission sound pressure levels obtained can serve noise emission declaration and comparison purposes (see ECMA-109).
NOTE 2 The sound power and emission sound pressure levels obtained are not to be considered as installation noise
immission levels; however they can be used for installation planning (see ECMA TR/27[4]).
If sound power levels obtained are determined for a number of functional units of the same production series or “batch,” they can be used to determine the mean sound power level to declare and the statistical upper limit to be used for verification (see ECMA-109).

2 © Ecma International 2018
2 Normative references
The following referenced documents are indispensable for the application of this document. For dated references, only the edition cited applies. For undated references, the latest edition of the referenced document (including any amendments) applies.
ISO/IEC 10561:1999 Information technology — Office equipment — Printing devices — Method for measuring throughput — Class 1 and Class 2 printers
NOTE 1 C.3 refers to ISO/IEC 10561:1999.
ISO/IEC 11160-1:1996 Information technology — Office equipment — Minimum information to be included in specification sheets — Printers — Part 1: Class 1 and Class 2 printers
NOTE 2 C.3 refers to ISO/IEC 11160-1:1996.
ISO 266 Acoustics — Preferred frequencies
ISO 3741 Acoustics — Determination of sound power levels and sound energy levels of noise sources using sound pressure — Precision methods for reverberation test rooms
ISO 3744 Acoustics — Determination of sound power levels and sound energy levels of noise sources using sound pressure — Engineering methods for an essentially free field over a reflecting plane
ISO 3745 Acoustics — Determination of sound power levels and sound energy levels of noise sources using sound pressure — Precision methods for anechoic test rooms and hemi-anechoic test rooms
ISO 6926 Acoustics — Requirements for the performance and calibration of reference sound sources used for the determination of sound power levels
ISO 7779 Acoustics — Measurement of airborne noise emitted by information technology and telecommunications equipment
ISO 9295 Acoustics — Measurement of high-frequency noise emitted by computer and business equipment (ECMA-108)
ISO 9296 Acoustics — Declared noise emission values of computer and business equipment (ECMA-109)
ISO 10302-1 Acoustics — Method for the measurement of airborne noise emitted and structure-borne vibration induced by small air-moving devices — Part 1: Airborne noise measurement
ISO 10302-2 Acoustics — Method for the measurement of airborne noise emitted and structure-borne vibration induced by small air-moving devices — Part 2: Structureborne vibration measurement
ISO 11201 Acoustics — Noise emitted by machinery and equipment — Determination of emission sound pressure levels at a work station and at other specified positions in an essentially free field over a reflecting plane with negligible environmental corrections

© Ecma International 2018 3
ISO 11203 Acoustics — Noise emitted by machinery and equipment — Determination of emission sound pressure levels at a work station and at other specified positions from the sound power level
IEC 60942 Electroacoustics — Sound calibrators
IEC 61260 Electroacoustics — Octave-band and fractional-octave-band filters
IEC 61672-1 Electroacoustics — Sound level meters — Part 1: Specifications
IEC 61947-1:2002 Electronic projection — Measurement and documentation of key performance criteria - Part 1: Fixed resolution projectors
NOTE 3 C.20 refers to IEC 61947-1:2002.
IEC 61947-2:2001 Electronic projection — Measurement and documentation of key performance criteria — Part 2: Variable resolution projectors
NOTE 4 C.20 refers to IEC 61947-2:2001.
CAUTION IEC document numbering was at one time modified to add 60000 to the original number. This rule applies to not only new standards but also already published ones. Therefore, for instance, IEC 60942 is the identical standard which had been referred to as IEC 942 herein.
3 Terms and definitions
For the purposes of this Ecma Standard, the terms and definitions given in ISO 3744, and ISO 11201, and the following apply.
NOTE If a definition is identical to that in another standard, that standard and definition number is given in brackets.
3.1 General definitions
3.1.1 basic noise emission standard, B-type standard standard which specifies a procedure for determining the noise emission of machinery and equipment in such a way as to obtain reliable, reproducible results with a degree of accuracy
[ISO 12001:1996[2], 3.1]
3.1.2 noise test code, C-type standard standard that is applicable to a particular class, family or type of machinery or equipment which specifies all the information necessary to carry out efficiently the determination, declaration and verification of the noise emission characteristics under standardized conditions
[ISO 12001:1996[2], 3.2]
NOTE This Standard (ECMA-74) together with ECMA-108 and ECMA-109 comprises the noise test code for ITT Equipment. These Standards are Ecma counterparts of ISO 7779, ISO 9295 and ISO 9296, respectively. Both set of noise
test codes (Ecma and ISO) are consistent with guidelines specified in ISO 12001.
3.1.3 information technology and telecommunications equipment, ITT equipment equipment for information processing, and components thereof, used in homes, offices, server installations,

4 © Ecma International 2018
telecommunications installations, or similar environments, covered under the scope of this Standard
NOTE Annex C, which specifies particular requirements for use with this Standard, may be useful in identifying many
of the categories of ITT equipment.
3.1.4 functional unit unit of ITT equipment, either with or without its own end-use enclosure that is tested or intended to be tested according to the procedures of this Standard
NOTE 1 A functional unit can comprise more than one unit of ITT equipment when such units are to be tested together
in accordance with the methods of this Standard. A functional unit can also comprise one or more units of ITT equipment coupled to one or more units of non-ITT equipment, such as power modules, water pumps, or refrigeration units, when
such equipment is necessary for the normal operation of the ITT equipment.
NOTE 2 Functional units of ITT equipment can take on a wide range of forms, including commercially-available
products, prototype units under development, or sub-assemblies and components thereof.
3.1.5 work station; operator's position: position in the vicinity of the equipment under test which is intended for the operator
NOTE 1 Adapted from ISO 11201:2010, 3.11.
NOTE 2 This term does not refer to a computer “workstation”, which denotes a high-performance, single-user computer.
3.1.6 operating mode condition in which the equipment being tested is performing its intended function(s)
3.1.7 idle mode one or more steady-state conditions in which the equipment being tested is energized but is not operating
3.1.8 floor-standing equipment functional unit which is intended to be installed on the floor
3.1.9 table-top equipment functional unit which has a complete enclosure and which is intended to be installed or used on a table, desk or separate stand
3.1.10 wall-mounted equipment functional unit which is normally mounted against or in a wall and which does not have a stand of its own
3.1.11 sub-assembly functional unit, generally without its own end-use enclosure, intended to be installed in another unit of ITT equipment or assembled together with other sub-assemblies or units of ITT equipment into a single end-use enclosure
3.1.12 rack-mountable unit functional unit that is designed to be installed in an end-use enclosure in the form of a rack, frame, or cabinet,

© Ecma International 2018 5
either fully-enclosed, partially-enclosed, or open-frame
3.1.13 rack-enclosed system functional unit in the form of a rack, frame, or cabinet containing one or more rack-mountable units
NOTE Rack-enclosed systems represent a wide variety of ITT equipment, depending on the particular configuration of the rack-mountable units in the rack or enclosure. These may be server systems, storage systems, I/O systems,
networking systems, or “integrated” systems of these or other types of rack-mountable units.
3.1.14 hand-held equipment functional unit, generally small and lightweight, intended to be supported in one’s hand(s) during operation
3.1.15 standard test table rigid table having a top surface of at least 0,5 m2 and length of the top plane not less than 700 mm
NOTE The design for the standard test table is shown in Annex A.
3.2 Acoustical definitions
3.2.1 emission, noise emission airborne sound radiated by a well-defined noise source (e.g. the equipment under test)
NOTE Noise emission descriptors can be incorporated into a product declaration and/or product specification. The basic noise emission descriptors are the sound power level of the source itself and the emission sound pressure levels at
an operator position or at bystander positions (if no operator position is defined) in the vicinity of the source.
3.2.2 sound pressure, p difference between instantaneous total pressure and static pressure
NOTE 1 Sound pressure is expressed in pascals.
NOTE 2 The symbol p for instantaneous sound pressure, is often used without modification to represent a root-mean-
square (rms) sound pressure.
[ISO 80000-8:2007[3], 9.2]
3.2.3 sound pressure level, Lp ten times the logarithm to the base 10 of the ratio of the square of the sound pressure, p, to the square of a reference value, p0
dBlg102
0
2
p
pLp
NOTE 1 Sound pressure level, Lp, is expressed in decibels with a reference value, p0, of 20 µPa (20 × 10-6 Pa).
NOTE 2 This definition is technically in accordance with ISO 80000-8:2007[3]
, 8.22.
[ISO/TR 25417:2007[23], 2.2]

6 © Ecma International 2018
3.2.4 time-averaged sound pressure level, LpT sound pressure level of a continuous steady sound that, within a measurement time interval, T, has the same mean-square sound pressure as a sound under consideration which varies with time
NOTE Time averaged sound pressure level, LpT, is expressed in decibels with a reference value, p0, of 20 µPa (20 ×
10-6 Pa).
3.2.5 emission sound pressure level, Lp sound pressure level measured at a specified position near a noise source, when the source is in operation under specified operating and mounting conditions on a reflecting plane surface, but excluding the effects of background noise
NOTE The emission sound pressure level is expressed in decibels with a reference value, p0, of 20 µPa (20 × 10-6
Pa).
3.2.6 time-averaged emission sound pressure level, LpeqT emission sound pressure level of a continuous steady sound that, within a measurement time interval, T, has the same mean-square sound pressure as a sound under consideration which varies with time
t
p
tp
TL
T
Tp d1
lg100
2
0
2
eq dB
NOTE 1 The time-averaged emission sound pressure level is expressed in decibels with a reference value, p0, of
20 µPa (20 × 10-6 Pa).
NOTE 2 Clause 8 of this Standard specifies the method for the determination of time-averaged A-weighted emission sound pressure level, LpA, for ITT equipment defined in 3.1.3.
NOTE 3 In general, the subscripts “eq” and “T” are omitted since time-averaged emission sound pressure levels are
necessarily determined over a certain measurement time interval.
3.2.7 C-weighted peak emission sound pressure level, LpCpeak highest instantaneous value of the C-weighted emission sound pressure level determined over an operational cycle
NOTE The C-weighted peak sound pressure level is expressed in decibels with a reference value, p0, of 20 µPa (20 ×
10-6 Pa).
3.2.8 sound power, P
rate per unit time at which airborne sound energy is radiated by a source
NOTE Sound power is expressed in watts.
3.2.9 sound power level, LW ten times the logarithm to the base 10 of the ratio of the sound power, P, radiated by the sound source under test to the reference value, P0

© Ecma International 2018 7
dBlg100P
PLW
NOTE 1 Sound power level LW is expressed in decibels with a reference value of 1 pW (10-12 W).
NOTE 2 Clauses 6 and 7 of this standard specify the method for the determination of the A-weighted sound power level, LWA, for ITT equipment defined in 3.1.3.
3.2.10 reference sound source device which is intended for use as a stable source of sound, which has a known, broad-band sound power spectrum determined in full conformance with ISO 6926 over the frequency range of interest.
3.2.11 frequency range of interest one-third-octave bands with centre frequencies specified in ISO 266 from 100 Hz to 10 000 Hz inclusive
NOTE For equipment which emits discrete tone(s) in the 16 kHz octave band, the procedures specified in ECMA-108
should be used; see Table 4.
4 Conformity requirements
Measurements are in conformity with this Standard if they meet the following requirements:
a) the measurement procedures, the installation and the operating conditions specified by this Standard are
taken fully into account.
b) for the determination of sound power levels, one (and only one) of the methods specified in Clause 6 or
Clause 7 is used.
c) for the determination of emission sound pressure level at the operator or bystander positions, the method
specified in Clause 8 is used.
5 Installation and operating conditions
5.1 Equipment installation
5.1.1 General
The equipment shall be installed in accordance with its intended use. Requirements are given in this clause for general types of equipment. Specific installation conditions for many different categories of ITT equipment are specified in Annex C, and these shall be followed insofar as they represent the intended use of the equipment. If the normal installation associated with intended use is unknown or ambiguous or if several possibilities exist, a representative condition shall be selected for the measurements and reported.
Care shall be taken to ensure that any electrical conduits, piping, air ducts or other auxiliary equipment connected to the equipment being tested do not radiate significant amounts of sound energy into the test room. If practicable, all auxiliary equipment necessary for the operation of the equipment shall be located outside the test room and the test room shall be free from all objects which may interfere with the measurements.
NOTE If the equipment is mounted near one or more reflecting planes, the sound power radiated by the equipment can depend upon its position and orientation. It is possible that the radiated sound power is of interest either for one
particular equipment position and orientation or from the average value for several positions and orientations.

8 © Ecma International 2018
5.1.2 Floor-standing equipment
5.1.2.1 Requirements for reverberation test rooms
Floor-standing equipment shall be located at least 1,5 m from any wall of the room and no major surfaces shall be parallel to a wall of the reverberation test room.
5.1.2.2 Requirements for hemi-anechoic rooms
Floor-standing equipment shall be installed on the reflecting (hard) floor at a sufficient distance (more than 2 m, if possible) from the walls, unless otherwise specified in Annex C.
The equipment shall be installed in a way which allows access to all sides except the reflecting plane(s). The dimensions of the reflecting plane(s) shall extend beyond the test object by at least the measurement distance. The requirements for reflection are specified in the NOTE to 7.3.1. The plane(s) shall not contribute to the sound radiation due to their own vibrations.
5.1.2.3 Common requirements
If the equipment being tested consists of several frames bolted together in an installation or is too large for testing purposes, the frames may be measured separately. In such circumstances, additional covers may be required for the frames during the acoustical evaluation. These additional covers shall be acoustically comparable with the other covers on the equipment. If a unit is mechanically or acoustically coupled to another unit so that the noise emission levels of one are significantly influenced by the other, the equipment being tested shall, where practicable, include all units coupled together in this way.
Floor-standing equipment which is to be installed only in front of a wall shall be placed on a hard floor in front of a hard wall (see the NOTE to 7.3.1). The distance from the wall shall be in accordance with the machine manufacturer's instructions or as specified in Annex C. If such information is not available, the distance shall be 0,1 m.
5.1.3 Table-top equipment
5.1.3.1 Requirements for reverberation test rooms
Table-top equipment (see 3.1.9) shall be placed on the floor at least 1,5 m from any wall of the room unless a table or stand is required for operation in accordance with Annex C (e.g. printers which take paper from or stack paper on the floor). Such equipment shall be placed in the centre of the top plane of the standard test table (see Annex A).
5.1.3.2 Requirements for hemi-anechoic rooms
Table-top equipment shall be placed on the floor unless a table or stand is required for operation in accordance with Annex C (e.g. printers which take paper from or stack paper on the floor). Such equipment shall be placed in the centre of the top plane of the standard test table (see Annex A). In any case the measurement surface defined in 7.6 terminates on the floor.
5.1.4 Wall-mounted equipment
Wall-mounted equipment (see 3.1.10) shall be mounted on a wall of the reverberation test room at least 1,5 m from any other reflecting surface, unless otherwise specified. Alternatively, if operation permits, the equipment may be laid with its mounting surface on the floor at least 1,5 m (more than 2 m, if possible, in hemi-anechoic rooms) from any wall of the room.
If the equipment is usually installed by being recessed into a wall or other structure, a representative structure shall be used for mounting during the measurements and described in the test report.

© Ecma International 2018 9
5.1.5 Rack-mounted equipment
Rack-mounted equipment includes both individual rack-mountable units (see 3.1.12) and rack-enclosed systems (see 3.1.13). Rack-mountable units shall either be tested outside of the rack or installed in a rack enclosure in accordance with the requirements of C.18.2. Rack-enclosed systems shall be tested either as floor-standing equipment (see 5.1.2) or as table-top equipment (see 5.1.3) in accordance with the type and size of system. The specific installation and operation requirements of C.18.2 and C.18.3, respectively, shall be followed.
For rack-enclosed systems that are available in more than one configuration of rack-mountable units, the particular configuration to be measured is usually governed by the purposes of the test and is thus not specified in this Standard (see C.18.1 for more information).
5.1.6 Hand-held equipment
Hand-held equipment (see 3.1.14) shall be supported 0,25 m ± 0,03 m above the reflecting plane by a vibration-isolating stand or fixture, or by appropriate vibration-isolating elements. If a hemispherical measurement surface is used with any radius less than 1 m (see B.1), the hand-held equipment support height shall be reduced to 0,125 m ± 0,015 m. The method of supporting the hand-held equipment shall not interfere with the propagation of airborne sound from the equipment or generate any additional sound radiation.
5.1.7 Sub-assemblies
A sub-assembly (see 3.1.11) shall be supported 0,25 m ± 0,03 m above the reflecting plane by a vibration-isolating stand or fixture, or by appropriate vibration-isolating elements. If a hemispherical measurement surface is used with any radius less than 1 m (see B.1), the sub-assembly support height shall be reduced to 0,125 m ± 0,015 m. The method of supporting the sub-assembly shall not interfere with the propagation of airborne sound from the sub-assembly or generate any additional sound radiation.
If the above-specified support height is not adequate to allow the manufacturer’s recommended air flow at the sub-assembly’s air inlet, the height may be adjusted accordingly but shall not exceed 0,5 m. The new height shall be documented in the test report.
5.2 Input voltage and frequency
The equipment shall be operated at its nominal rated voltage and the rated power line frequency.
Phase-to-phase voltage variations shall not exceed 5 %.
5.3 Equipment operation
During the acoustical measurements the equipment shall be operated in a manner typical of normal use. The equipment shall be operated for a sufficient amount of time in the test chamber, from either the initial power on or whenever operating conditions change from one state to another, to reach a steady-state condition in terms of the noise emission levels.
Annex C specifies what are considered to be typical operating conditions for many categories of equipment and shall be followed. However, if the specified conditions therein are clearly contrary to the objective of providing uniform conditions for measurements closely corresponding to the intended use of the product, then one or more additional operating conditions, or additional modes more closely related to the intended use of the equipment shall be defined for the measurements, and documented in the test report. In this case, the test report shall include either:

10 © Ecma International 2018
the measured results using both the operating conditions described in Annex C and any additional
operating conditions or operating modes defined according to this clause that are considered to be more
representative of typical use (additional conditions case) or
the measured results using only the additional operating conditions or operating modes defined according
to this clause that are considered to be more representative of typical use (substitute conditions case)
When there are multiple operating modes specified in Annex C, at a minimum, the most typical operating mode shall be tested and reported.
The equipment shall be operated for a sufficient period of time before proceeding with the acoustical test to allow temperature and other pertinent conditions to stabilize.
The noise shall be measured with the equipment in both the idle and operating modes. If the equipment is designed for performing different functions, such as manually typing and automatic printing of stored information, or for printing in different print qualities, unless otherwise specified in Annex C, the noise of each individual mode shall be determined and recorded. For equipment which, in normal functional operation, performs several operating modes, such as document insertion, reading, encoding, printing and document eject, and for which a typical operation cycle has not been defined in Annex C, such a typical cycle shall be defined for the measurements and described in the test report.
For rack-mounted equipment in which the operation of several functional units is possible, the units intended to operate together shall be operated during the test; all other units shall be in idle mode. In the absence of operational specifications provided by Annex C or by the manufacturer, an operating mode that represents the most typical usage shall be tested. This mode shall be clearly described in the test report.
Some equipment does not operate continuously because of its mechanical design or its mode of operation under program control. Long periods may occur during which the equipment is idle. The operating mode measurements shall not include these idle periods. If it is not possible to operate the equipment continuously during the acoustical evaluation, the time interval during which measurements have to be made shall be described in the test plan, equipment specifications or other documentation.
Some equipment has operational cycles that are too short to allow reliable determination of the noise emissions. In such cases, a typical cycle shall be repeated several times.
If the equipment being tested produces attention signals, such as tones or bells, such intermittent sound shall not be included in an operating mode. During the acoustical evaluation in the operating mode(s), such attention signals shall be inoperative or, if this is not possible, they shall be set to a minimum.
NOTE For certain applications, such signals as well as the maximum response of feedback signals of keyboards can be of interest. Such measurements can be made, but they are not part of the methods specified in this Standard.
6 Method for determination of sound power levels of equipment in reverberation test rooms
6.1 General
The method specified in this clause provides a comparison procedure for determining the sound power levels produced by ITT equipment in a reverberation test room, in accordance with the comparison method specified in ISO 3741. It applies to equipment which radiates broad-band noise, narrow-band noise, noise which contains discrete frequency components or impulsive noise.

© Ecma International 2018 11
It is strongly recommended that the room be qualified for discrete-frequency components in accordance with the relevant procedure specified in ISO 3741. This avoids the need to determine the number of microphone positions and equipment locations each time equipment is measured.
6.2 Measurement uncertainty
Measurements carried out in accordance with this method yield standard deviations of reproducibility for the frequency range of interest of this Standard which are equal to, or less than, those given in Table 1.
Table 1 — Uncertainty in determining sound power levels in a reverberation test room in accordance with Clause 6
Octave band centre frequencies
One-third-octave band centre frequencies
Standard deviation
Hz Hz dB
125 100 to 160 3,0
250 200 to 315 2,0
500 to 4 000 400 to 5 000 1,5
8 000 6 300 to 10 000 3,0
NOTE 1 For most ITT equipment, the A-weighted sound power level is determined by the sound power levels in the 250 Hz to 4 000 Hz octave bands. The A-weighted sound power level is determined with a standard deviation of
approximately 1,5 dB. A larger standard deviation can result when the sound power levels in other bands determine the A-weighted sound power level.
NOTE 2 The standard deviations given in Table 1 reflect the cumulative effects of all causes of measurement uncertainty, including variations from laboratory to laboratory but excluding variations in the sound power level from
equipment to equipment or from test to test which can be caused, for example, by changes in the installation or operating conditions of the equipment. The reproducibility and repeatability of the test results for the same piece of equipment and
the same measurement conditions can be considerably better (i.e. smaller standard deviations) than the uncertainties given in Table 1 indicate.
NOTE 3 If the method specified in this clause is used to compare the sound power levels of similar equipment that are omnidirectional and radiate broad-band noise, the uncertainty in this comparison yields a standard deviation which is less
than that given in Table 1, provided that the measurements are carried out in the same environment.
6.3 Test environment
6.3.1 General
Guidelines specified in ISO 3741 for the design of the reverberation test room, as applicable, shall be used. Criteria for room absorption and the procedure for room qualifications, specified in ISO 3741 shall be used.
ISO 3741 shall be followed with regard to the following:
a) test room volume;
b) level of background noise.
6.3.2 Meteorological conditions
The requirements of ISO 3741 shall be followed.

12 © Ecma International 2018
The following conditions are recommended:
a) ambient pressure: 86 kPa to 106 kPa;
b) temperature: within the range defined by the manufacturer for the equipment, if a range is defined; if no
range is so defined by the manufacturer, the recommended range is 15 °C to 30 °C;
c) relative humidity: within the range defined by the manufacturer for the equipment, if a range is defined;
for processing of paper and card media only, if no range is so defined by the manufacturer, the
recommended range is 40 % to 70 %.
For equipment whose noise emissions vary with ambient temperature in a prescribed manner (e.g., by varying
the speeds of air moving devices), the room temperature during the measurement shall be 23 C 2 C.
For equipment whose noise emissions vary with altitude in a prescribed manner (e.g., by varying the speeds of air moving devices), the altitude of the test room shall either be less than or equal to 500 m or the equipment shall be tested under conditions simulating its operation at an altitude less than or equal to 500 m.
NOTE This variation of speed of air-moving devices does not refer to the changing speed that is already accounted
for in the correction for ambient pressure described in the NOTE to 6.10.1.
6.4 Instrumentation
6.4.1 General
The requirements of 6.4 as well as the instrumentation requirements of ISO 3741 shall be followed.
Digital integration is the preferred method of averaging.
6.4.2 The microphone and its associated cable
The instrument system, including the microphone and its associated cable, shall meet the requirements of ISO 3741. If the microphone is moved, care shall be exercised to avoid introducing acoustical or electrical noise (e.g. from gears, flexing cables, or sliding contacts) that could interfere with the measurements.
6.4.3 Frequency response of the instrumentation system
The requirements of ISO 3741 shall be followed.
6.4.4 Reference sound source
The reference sound source shall meet the requirements specified in ISO 6926 over the frequency range of interest.
6.4.5 Filter characteristics
The requirements for an instrument specified in accordance with IEC 61260, class 1, shall be followed.
6.4.6 Calibration
The microphones shall be calibrated for random incidence as specified in IEC 61183.
Before and after each series of measurements, a sound calibrator meeting the requirements of IEC 60942:2003, class 1 shall be applied to each microphone to verify the calibration of the entire measuring system at one or more frequencies within the frequency range of interest. Without any further adjustment, the

© Ecma International 2018 13
difference between the readings made before and after each series of measurements shall be less than or equal to 0,5 dB. If this value is exceeded, the results of the series of measurements shall be discarded.
NOTE A “series” of measurements does not require that this verification be conducted “daily”. Other methods for checking the calibration of the measurement system to insure this requirement will be met may be available. For example,
see JBMIA-TR-28[30].
The calibration of the sound calibrator, the compliance of the instrumentation system with the requirements of IEC 61672-1, the compliance of the filter set with the requirements of IEC 61260, and, if used, the compliance of the reference sound source with the requirements of ISO 6926, shall be verified at intervals in a laboratory making calibrations traceable to appropriate standards.
Unless national regulations dictate otherwise, it is recommended that the sound calibrator should be calibrated at intervals not exceeding 1 year, the reference sound source should be calibrated at intervals not exceeding 2 years, the compliance of the instrumentation system with the requirements of IEC 61672-1 should be verified at intervals not exceeding 2 years, and the compliance of the filter set with the requirements of IEC 61260 should be verified at intervals not exceeding 2 years.
6.5 Installation and operation of equipment: General requirements
See Clause 5.
6.6 Microphone positions and source locations
6.6.1 General
The major cause of uncertainty in determining sound power level in a reverberation test room is the spatial irregularity of the sound field. The extent of this irregularity and, hence, the effort required to determine the average sound pressure level accurately is greater for discrete-frequency sound than for broad-band sound.
It is strongly recommended that the room be qualified for the measurement of discrete-frequency components in accordance with the relevant procedures of ISO 3741. This avoids the need to determine the number of microphone positions and equipment locations each time equipment is measured.
If the room has not been qualified for the measurement of discrete-frequency components, the procedures specified in ISO 3741 shall be used to determine the minimum number of microphone positions and to evaluate the need for additional noise source locations prior to each measurement. The results of these procedures depend on the presence or absence of significant discrete-frequency components or narrow bands of noise in the sound emitted by the source. When these are present, the number of microphone positions and equipment locations may be large.
6.6.2 Number of microphone positions, reference sound source locations and equipment locations
The requirements of ISO 3741shall be followed.
6.6.3 Microphone arrangement
The requirements of ISO 3741shall be followed.
6.7 Measurement of sound pressure level
6.7.1 General
The requirements of ISO 3741 shall be followed, as applicable. The reference sound source shall be located in the reverberation room during the measurements of the equipment under test.

14 © Ecma International 2018
NOTE Depending on the purposes of the test, it may be the case that one or more repeated measurements are taken
for either the sound pressure levels of the reference sound source (see 6.8) or the source under test (see 6.9), or both. Provided that each of the measurements in the repeated set represent identical conditions for the reference sound source
or the source under test, and that they are each valid measurements in accordance with the requirements of this Standard, the arithmetic average of the measured sound pressure levels, in decibels, should be taken as the measurement result
from this clause.
6.7.2 Measurement time interval
The requirements below in addition to those of ISO 3741 shall be followed, as applicable.
For equipment which performs repetitive operation cycles (e.g. enveloping machines), the measurement time interval shall include at least three operation cycles. For equipment which performs a sequence of varying operation cycles, the measurement time interval shall include the total sequence. Annex C specifies additional requirements for many categories of equipment.
6.7.3 Corrections for background noise
The requirements of ISO 3741 shall be followed, as applicable.
NOTE When the background noise levels in the test room are extremely low and very controlled, it is possible that
the environment satisfies the absolute and/or relative criteria for background noise in accordance with ISO 3741. Care should be taken to use the latest version of ISO 3741; the fourth edition (2010-10-01) is the first version of ISO 3741 to
use the concept of absolute and relative criteria for background noise.
6.8 Measurement of the sound pressure level of the reference sound source
The requirements below in addition to those of ISO 3741 shall be followed.
For the purposes of determining the sound power level of the equipment by means of reverberation test rooms, this Standard uses exclusively the comparison method specified in ISO 3741. This method has the advantage that it is not necessary to measure the reverberation time of the test room. The comparison method requires the use of a reference sound source which meets the requirements of ISO 6926 and for which the sound power levels have been determined in full conformance with ISO 6926 over the frequency range of interest (see 3.2.12). The equipment under test shall be located in the reverberation room during the measurements of the reference sound source. The reference sound source shall be operated under the same conditions (e.g., at the same rotational speed) for which its sound power levels were determined, and in the presence of the operator, if one is required to operate the equipment.
6.9 Calculation of the mean time-averaged band sound pressure levels
The requirements of ISO 3741 shall be followed for the calculation of the mean time-averaged band sound pressure levels, including the requirements for applying background noise corrections.
6.10 Determination of sound power level
6.10.1 Calculation of band sound power levels
The sound power level, under reference meteorological conditions, of the equipment in each one-third-octave band within the frequency range of interest (see 3.2.12) shall be determined from the mean time-averaged band sound pressure levels using the procedures of ISO 3741 for the comparison method.
NOTE The procedures in ISO 3741 are used to determine the sound power level under reference meteorological conditions (ambient pressure 1,013 25 × 105 Pa, temperature 23,0 °C, relative humidity 50 %). Care should be taken to
use the latest version of ISO 3741; the fourth edition (2010-10-01) is the first version of ISO 3741 to use the concept of reference meteorological conditions.

© Ecma International 2018 15
The sound power level in the k-th octave band, LWoct, k in decibels, if needed, shall be based on one-third-octave band data, and calculated from:
k
kj
L
kWjWL
3
23
1,0
oct,,3/110lg10 dB (1)
where
k is an identification number of octave band within the frequency range of interest (see Table 2);
LW1/3, j is the sound power level in the j-th one-third-octave band, in decibels (see Table 3); j is an identification number lying within the range of (3k – 2) and 3k, and which identifies the
three one-third-octave bands which make up the k-th octave band.
6.10.2 Calculation of A-weighted sound power level
The A-weighted sound power level, LWA in decibels shall be based on the frequency range of interest, and calculated from the following formula:
21
1=
)0,1(
A,3/110lg10
j
AL
WjjWL dB (2)
where
LW1/3, j is the sound power level in the j-th one-third-octave band, in decibels;
Aj is the A-weighting value corresponding to j-th one-third-octave band (see Table 3);
j is an identification number of a one-third-octave band within the frequency range of interest (see Table 3).
NOTE The Formulae (1) and (2), as well as Tables 2 and 3, are intended for common use for not only Clause 6, but
also Clause 7.
Table 2 — Identification number k for octave bands
k Octave band centre frequency
Hz
1 125
2 250
3 500
4 1 000
5 2 000
6 4 000
7 8 000

16 © Ecma International 2018
Table 3 — Values of A-weighting, Aj, for one-third-octave bands
j One-third-octave-band
centre frequency A-weighting
Aj
Hz dB
1 100 – 19,1
2 125 – 16,1
3 160 – 13,4
4 200 – 10,9
5 250 – 8,6
6 315 – 6,6
7 400 – 4,8
8 500 – 3,2
9 630 – 1,9
10 800 – 0,8
11 1 000 0,0
12 1 250 0,6
13 1 600 1,0
14 2 000 1,2
15 2 500 1,3
16 3 150 1,2
17 4 000 1,0
18 5 000 0,5
19 6 300 – 0,1
20 8 000 – 1,1
21 10 000 – 2,5
Some ITT equipment emits high-frequency noise in the 16 kHz octave band. Depending upon the nature of noise emissions, Table 4 shows how to handle each situation.
For the determination of A-weighted sound power levels from band levels, this Standard does not extend the frequency range of interest to include the 16 kHz octave band.
For equipment which emits discrete tone(s) in the 16 kHz octave band, each frequency and level of the tone(s) that is (are) within 10 dB of the highest tone level in the band shall be determined in accordance with the procedures specified in ECMA-108 (see Table 4). The derived levels are not frequency weighted.
CAUTION The 16 kHz octave band contribution is not included in the determination of A-weighted level.

© Ecma International 2018 17
Table 4 — Type of noise and determination of sound power levels
Type of noise in the frequency range of the octave bands centred at
Sound power level to be determined
125 Hz to 8 kHz 16 kHz
Broad-band or narrow-band noise a
No significant noise A-weighted level (125 Hz to 8 kHz octave bands) in accordance with this Standard
Broad-band noise A-weighted level (125 Hz to 8 kHz octave bands in accordance
with this Standard, and one-third-octave-band sound power level in 16 kHz octave band in accordance with the procedure of
ECMA-108
Broad-band or
narrow-band noise a
Discrete tone A-weighted level (125 Hz to 8 kHz octave bands) in accordance
with this Standard and the level and frequency of the discrete tone in accordance with ECMA-108
Multiple tones A-weighted level (125 Hz to 8 kHz octave bands) in accordance
with this Standard and the levels and frequencies of all tones in the 16 kHz octave band that are within 10 dB of the highest tone
level in the band in accordance with ECMA-108
No significant noise b
Discrete tone Level and frequency of the discrete tone in the 16 kHz octave
band in accordance with ECMA-108.
Multiple tones Levels and frequencies of all tones in the 16 kHz octave band that are within 10 dB of the highest tone level in the band in
accordance with ECMA-108.
a For noise in 125 Hz to 8 kHz octave bands, sound power level in one-third-octave bands and in octave
bands may also be reported in accordance with this Standard.
b A significant noise contribution not within the 125 Hz to 8 kHz octave band lies outside the scope of this
Standard, in that case only ECMA-108 is applicable.
7 Method for determination of sound power levels of equipment under essentially free-field conditions over a reflecting plane
7.1 General
The method specified in this clause provides a direct procedure for determining the sound power levels produced by ITT equipment using essentially free-field conditions over a reflecting plane as specified in ISO 3744 or ISO 3745. It applies to equipment which radiates broad-band noise, narrow-band noise, noise which contains discrete frequency components or impulsive noise.
The measurement shall be carried out in an environment qualified in accordance with ISO 3744 or ISO 3745.
7.2 Measurement uncertainty
Measurements carried out in accordance with this method yield standard deviations of reproducibility for the frequency range of interest of this Standard which are less than or equal to those given in Table 5.

18 © Ecma International 2018
Table 5 — Uncertainty in determining sound power levels in a free field over a reflecting plane in accordance with Clause 7
Octave band centre frequencies
One-third-octave band centre frequencies
Standard deviation
Hz Hz dB
125 100 to 160 3,0
250 to 500 200 to 630 2,0
1 000 to 4 000 800 to 5 000 1,5
8 000 6 300 to 10 000 2,5
NOTE 1 For most ITT equipment, A-weighted sound power level will be determined by the sound power levels in the 250 Hz to 4 000 Hz octave bands. The A-weighted sound power level is determined with a standard deviation of
approximately 1,5 dB. A larger standard deviation can result when the sound power levels in other bands determine the A-weighted sound power level.
NOTE 2 The standard deviations given in Table 5 reflect the cumulative effects of all causes of measurement uncertainty, including variations from laboratory to laboratory but excluding variations in the sound power level from
equipment to equipment or from test to test which can be caused, for example, by changes in the installation or operating conditions of the equipment. The reproducibility and repeatability of the test results for the same piece of equipment and
the same measurement conditions can be considerably better (i.e. smaller standard deviations) than the uncertainties given in Table 5 indicate.
NOTE 3 If the method specified in this clause is used to compare the sound power levels of similar equipment that are omnidirectional and radiate broad-band noise, the uncertainty in this comparison yields a standard deviation which is less
than that given in Table 5, provided that the measurements are carried out in the same environment.
7.3 Test environment
7.3.1 General
The test environment shall provide an essentially free field over a reflecting plane. Criteria for suitable test environments are defined in ISO 3744 and ISO 3745.
NOTE A plane (floor, wall) is considered to be reflecting (hard) if its absorption coefficient is less than 0,06 over the
frequency range of interest (e.g. concrete floor: < 0,01, plastered wall: 0,04, tiled wall: 0,01).
For test environments qualified in accordance with ISO 3744 the environmental correction, K2, shall be equal to or less than 2 dB in each one-third octave band over the frequency range of interest.
The above requirement for K2 may not be achievable in all frequency bands, even if the test environment is suitable for determining A-weighted sound power levels. Therefore, if the A-weighted sound power level is to be determined from one-third-octave band levels, the following steps shall be followed to determine whether this quantity meets the environmental correction criteria of this Standard:
a) the A-weighted sound power level is computed in accordance with the procedures in ISO 3744 using
the data from every one-third-octave band within the frequency range of interest and corrected for K2
using the values determined from Annex A in ISO 3744 even when those values exceed K2 = 2,0 dB;
b) the computation is repeated, but excluding those bands for which K2 exceeds 2 dB.
If the difference between these two levels is less than 0,5 dB, the A-weighted sound power level determined from the data for all bands can be considered as conforming to the test environmental correction criteria of this Standard.

© Ecma International 2018 19
For environments qualified in accordance with ISO 3745, qualification shall be conducted in accordance with ISO 3745 Annex A over the frequency range of interest.
The above requirement for qualification in accordance with ISO 3745 Annex A may not be achievable in all frequency bands, even if the test environment is suitable for determining A-weighted sound power levels. Therefore, if the A-weighted sound power level is to be determined from one-third-octave band levels, the following steps shall be followed to determine whether this quantity meets the environmental qualification criteria of this Standard:
a) the A-weighted sound power level is computed in accordance with the procedures in ISO 3744 using the data from every one-third-octave band within the frequency range of interest for which the chamber qualifies in accordance with ISO 3745 Annex A;
b) the computation is repeated, but excluding those bands for which the chamber does not qualify in accordance with ISO 3745 Annex A.
If the difference between these two levels is less than 0,5 dB, the A-weighted sound power level determined from the data for all bands can be considered as conforming to the test environmental qualification criteria of this Standard.
7.3.2 Meteorological conditions
The requirements of ISO 3744 as applicable shall be followed.
The following conditions are recommended:
a) ambient pressure: 86 kPa to 106 kPa;
b) temperature: within the range defined by the manufacturer for the equipment, if a range is defined; if no
range is so defined by the manufacturer, the recommended range is 15 C to 30 C;
c) relative humidity: within the range defined by the manufacturer for the equipment, if a range is defined;
for processing of paper and card media only, if no range is so defined by the manufacturer, the
recommended range is 40 % to 70 %.
For equipment whose noise emissions vary with ambient temperature in a prescribed manner (e.g., by varying
the speeds of air moving devices), the room temperature during the measurement shall be 23 C 2 C.
For equipment whose noise emissions vary with altitude in a prescribed manner (e.g., by varying the speeds of air moving devices), the altitude of the test room shall either be less than or equal to 500 m or the equipment shall be tested under conditions simulating its operation at an altitude less than or equal to 500 m.
NOTE This variation of speed of air-moving devices does not refer to the changing speed that is already accounted for in the correction for ambient pressure specified in 7.9.1.
7.4 Instrumentation
7.4.1 General
The requirements of 7.4, as well as the instrumentation requirements of ISO 3744 or ISO 3745, shall be followed.
Digital integration is the preferred method of averaging.
20 © Ecma International 2018
7.4.2 The microphone and its associated cable
The instrument system, including the microphone and its associated cable, shall meet the requirements of ISO 3744 or ISO 3745, as applicable. If the microphone is moved, care shall be exercised to avoid introducing acoustical or electrical noise (e.g. from wind, gears, flexing cables or sliding contacts) that could interfere with the measurements.
7.4.3 Frequency response of the instrumentation system
The requirements of ISO 3744 or ISO 3745, as applicable, shall be followed.
7.4.4 Reference sound source
The reference sound source shall meet the requirements specified in ISO 6926 over the frequency range of interest.
7.4.5 Filter characteristics
The requirements for an instrument specified in accordance with IEC 61260, class 1, shall be followed.
7.4.6 Calibration
Before and after each series of measurements, a sound calibrator meeting the requirements of IEC 60942:2003, class 1 shall be applied to each microphone to verify the calibration of the entire measuring system at one or more frequencies within the frequency range of interest. Without any adjustment, the difference between the readings made before and after each series of measurements shall be less than or equal to 0,5 dB. If this value is exceeded, the results of the series of measurements shall be discarded.
The calibration of the sound calibrator, the compliance of the instrumentation system with the requirements of IEC 61672-1, the compliance of the filter set with the requirements of IEC 61260, and, if used, the compliance of the reference sound source with the requirements of ISO 6926, shall be verified at intervals in a laboratory making calibrations traceable to appropriate standards.
Unless national regulations dictate otherwise, it is recommended that the sound calibrator should be calibrated at intervals not exceeding 1 year, the reference sound source should be calibrated at intervals not exceeding 2 years, the compliance of the instrumentation system with the requirements of IEC 61672-1 should be verified at intervals not exceeding 2 years, and the compliance of the filter set with the requirements of IEC 61260 should be verified at intervals not exceeding 2 years.
NOTE A “series” of measurements does not require that this verification be conducted “daily”. Other methods for
checking the calibration of the measurement system to insure this requirement will be met may be available. For example, see JBMIA-TR-28[30].
7.5 Installation and operation of equipment: General requirements
See Clause 5.
7.6 Measurement surface and microphone positions
7.6.1 General
Except as specified in Annex B, the requirements of ISO 3744 or ISO 3745 shall be followed as applicable. For most ITT equipment, the preferred measurement surface is hemispherical. If a hemispherical surface is used, then one of the following shall be applied:
(a) B.1;

© Ecma International 2018 21
(b) relevant annex of ISO 3745; or
(c) relevant annex of ISO 3744 (but, with a minimum of five different microphone heights) .
However, for equipment with tall aspect ratios, such as equipment racks, frames, or cabinets, the cylindrical measurement surface specified in B.2 may be preferred. For sources which have a relatively large foot print, the parallelepiped measurement surface may be more practical. The conditions of Clause 5 above shall however be followed. The number and location of the microphone positions shall be as specified in ISO 3744 or ISO 3745, as applicable, except as specified in Annex B of this Standard.
In some cases, e.g. when small equipment emits very low-level noise, it may be helpful to use a hemispherical measurement surface with a smaller radius. For such situations, B.1 defines measurement conditions with a hemisphere radius less than 1 m, but at least 0,5 m.
In order to facilitate the location of the microphone positions, a hypothetical reference surface is defined. This reference surface, or “reference box”, is the smallest possible rectangular box (i.e. rectangular parallelepiped) that just encloses the equipment and terminates on the reflecting plane(s). It has length l1, width l2 and height l3. Elements protruding from the equipment being tested which are unlikely to contribute to the noise emission
may be disregarded. The microphone positions lie on the measurement surface, a hypothetical surface of area S which envelops the equipment as well as the reference box and terminates on the reflecting plane.
The location of the equipment being tested, the measurement surface and the microphone positions are defined by a co-ordinate system with horizontal axes x and y in the ground plane parallel to the length and width of the reference box and with the vertical axis z passing through the geometric centre of the reference box. The x axis points towards the front of the equipment. The position of the origin for the coordinates of the microphone positions is specified as follows:
a) for floor-standing equipment: on the floor in the centre of the plane of the reference box which is
coplanar with the room floor;
b) for table-top equipment on a table or on the floor: as for a);
c) for wall-mounted equipment: in the centre of that plane of the reference box which is coplanar with the
mounting surface;
d) for rack-mounted equipment: as for a);
e) for hand-held equipment: as for a);
f) for sub-assemblies: as for a).
NOTE For fixed microphone arrays, either a single microphone can be moved from one position to the next
sequentially or a number of fixed microphones can be used and their outputs sampled sequentially or simultaneously. Alternatively, a continuous microphone traverse can be used as described in ISO 3744.
Near air exhausts, the microphone position shall be selected in such a way that the microphone is not exposed to the air stream, otherwise a windscreen shall be used.
The microphones shall be oriented in such a way that the angle of sound incidence is the same as the angle for which the microphone has the most uniform frequency response as specified by the manufacturer. For most practical cases this will be an orientation towards the origin of the co-ordinate system on the floor.
7.6.2 Microphone positions on the measurement surface
Except as stated immediately below, microphone positions shall meet the requirements of ISO 3744 or ISO 3745, as applicable, including the requirements for additional microphone positions and for the reduction in the number of microphone positions, where applicable.
22 © Ecma International 2018
If large equipment is to be measured in small rooms providing free-field conditions over a reflecting plane in accordance with ISO 3745, it may be easier to place the equipment not in the centre of the room but closer to a corner and to arrange the microphone positions in the free field of the room. The equipment should be turned around so that noise radiation from the different sides of the machine can be determined sequentially.
7.7 Measurement of sound pressure levels
7.7.1 General
Measurements of the sound pressure levels shall be carried out in accordance with ISO 3744 or ISO 3745 and with the following requirements.
Measurements of the sound pressure level shall be carried out at the microphone positions specified in 7.6 with A-weighting and/or for each frequency band within the frequency range of interest, if required. The following data shall be obtained:
the A-weighted sound pressure levels and/or the one-third-octave band sound pressure levels, for the
specified modes of operation of the equipment;
the A-weighted sound pressure levels and/or the one-third-octave band sound pressure levels of the
background noise (including noise from support equipment).
When using a sound level meter, the person reading the meter shall not disturb the sound field at the microphone.
NOTE Depending on the purposes of the test, it may be the case that one or more repeated measurements are taken for the source under test. Provided that each of the measurements in the repeated set represent identical conditions for
the source under test, and that they are each valid measurements in accordance with the requirements of this Standard, the arithmetic average of the measured sound pressure levels, in decibels, should be taken as the measurement result
from 7.7.
7.7.2 Measurement time interval
The requirements below, in addition to those of ISO 3744, shall be followed, as applicable.
For equipment which performs repetitive operation cycles (e.g., enveloping machines), the measurement time interval shall include at least three cycles. For equipment which performs a sequence of varying cycles, the measurement time interval shall include the total sequence. Annex C specifies additional requirements for many types of equipment.
7.7.3 Corrections for background noise
The requirements of ISO 3744 shall be followed, as applicable.
NOTE When the levels of the background noise levels in the test room are extremely low and very controlled, it is
possible that the environment satisfies the absolute and/or relative criteria for background noise in accordance with ISO 3744. Care should be taken to use the latest version of ISO 3744; the third edition (2010-10-01) is the first version of ISO
3744 to use the concept of absolute and relative criteria for background noise.
7.8 Calculation of surface time-averaged sound pressure level
Calculation of surface time-averaged sound pressure level averaged shall be in accordance with the relevant procedure of ISO 3744. This includes corrections for background noise, K1 and test environment K2. For hemi-anechoic rooms meeting the qualification requirements of ISO 3745, no K2 correction is applied.

© Ecma International 2018 23
7.9 Determination of time-averaged sound power levels
7.9.1 Calculation of band time-averaged sound power levels
When band data are required, the sound power level, under reference meteorological conditions, of the equipment in each one-third-octave band within the frequency range of interest shall be based on the surface time-averaged sound pressure level and determined in accordance with the procedure of ISO 3744.
NOTE The procedures in ISO 3744 are used to determine the sound power level under reference meteorological
conditions (ambient pressure 1,013 25 × 105 Pa, temperature 23,0 °C, relative humidity 50 %). Care should be taken to
use the latest version of ISO 3744; the third edition (2010-10-01) is the first version of ISO 3744 to use the concept of
reference meteorological conditions.
The sound power level in the k-th octave band, LWoct, k, in decibels, if needed, shall be based on one-third-octave band data, LW1/3, j, and calculated from Formula (1).
7.9.2 Calculation of A-weighted sound power level
For the purpose of this Standard, the A-weighted sound power level, LWA in decibels, under reference meteorological conditions, can be derived either directly from A-weighted sound pressure levels, or calculation from one-third-octave band data using the A-weighting values for each band in accordance with the procedures of ISO 3744.
NOTE The procedures in ISO 3744 are used to determine the sound power level under reference meteorological conditions (ambient pressure 1,013 25 × 105 Pa, temperature 23,0 °C, relative humidity 50 %).
In the latter case, the A-weighted sound power level, LWA, in decibels, shall be based on the frequency range of interest, and calculated from Formula (2).
Some ITT equipment emits high-frequency noise in the 16 kHz octave band. Depending upon the nature of noise emissions, Table 4 shows how to handle each situation.
For the determination of A-weighted sound power levels from band levels, this Standard does not extend the frequency range of interest to include the 16 kHz octave band.
For equipment which emits noise discrete tone(s) in the 16 kHz octave band, each frequency and level of the tone(s) that is (are) within 10 dB of the highest tone level in the band shall be determined in accordance with the procedures specified in ECMA-108 (see Table 4). The derived levels are not frequency weighted.
CAUTION The 16 kHz octave band contribution is not included in the determination of A-weighted level.
8 Method for determination of emission sound pressure levels at defined operator and bystander positions
8.1 General
The method specified in this clause defines the conditions for the determination of emission sound pressure levels of ITT equipment at the operator position (also called a “work station”) and, if no operator position exists, at the bystander positions in an essentially free field over a reflecting plane in accordance with ISO 11201, accuracy grade 2 (engineering method). It applies to equipment which radiates broad-band noise, narrow-band noise, noise which contains discrete frequency components, or impulsive noise.
NOTE The determination specified in this clause is historically based on the engineering method.

24 © Ecma International 2018
Table C.1 identifies whether the types of equipment identified in Annex C shall be measured at the operator position or bystander positions. If the equipment under test is not specifically included in Annex C (or in Table C.1), the requester of the test shall specify whether or not the equipment is considered operator-attended. If so, an operator position shall be defined in accordance with 8.6.1; if not, bystander positions shall be defined in accordance with 8.6.2.
This determination does not apply to sub-assemblies. However, where desired for sub-assemblies, determine an emission sound pressure level from a previously obtained sound power level using Q = Q1 = 8 dB in accordance with ISO 11203. This value of Q corresponds to a radial distance of 1 m from a small sub-assembly radiating hemispherically; for uniformity this value of Q is applicable to all sub-assemblies. Optionally, actual emission sound pressure levels may be determined at operator or bystander positions as described in the following.
Determination of whether the noise at the operator position or at the bystander positions contains prominent discrete tones is specified in Annex D. The method is applicable to both ITT equipment and their sub-assemblies.
Determination of whether the noise at the operator position or at the bystander positions contains prominent tonalities is specified in Annex G based on the hearing model approach in Annex F. The method is applicable to both ITT equipment and their sub-assemblies.
8.2 Measurement uncertainty
Measurements carried out in accordance with this method yield standard deviations of reproducibility for the frequency range of interest of this Standard which are equal to, or less than, those given in Table 6.
Table 6 — Uncertainty in determining emission sound pressure level at the operator and bystander positions in an essentially free field over a reflecting plane in accordance with Clause 8
Octave band centre
frequencies
One-third-octave band
centre frequencies Standard deviation
Hz Hz dB
125 100 to 160 3,0
250 to 500 200 to 630 2,0
1 000 to 4 000 800 to 5 000 1,5
8 000 6 300 to 10 000 2,5
NOTE 1 For most ITT equipment, the A-weighted emission sound pressure level is determined by the sound pressure levels in the 250 Hz to 4 000 Hz octave bands. The A-weighted emission sound pressure level is determined with a
standard deviation of approximately 1,5 dB. A larger standard deviation can result when the emission sound pressure levels in other bands determine the A-weighted emission sound pressure level.
NOTE 2 In free-field conditions over a reflecting plane, the standard deviations given in Table 6 reflect the cumulative effects of all causes of measurement uncertainty, including variations from laboratory to laboratory but excluding variations
in the emission sound pressure level from equipment to equipment or from test to test which can be caused, for example, by changes in the installation or operating conditions of the equipment. The reproducibility and repeatability of the test
results for the same piece of equipment and the same measurement conditions can be considerably better (i.e. smaller standard deviations) than the uncertainties given in Table 6 indicate.
NOTE 3 If the method specified in this clause is used to compare the emission sound pressure levels of similar equipment that are omnidirectional and radiate broad-band noise, the uncertainty in this comparison yields a standard
deviation which is less than that given in Table 6, provided that the measurements are carried out in the same environment.

© Ecma International 2018 25
8.3 Test environment
8.3.1 General
The measurements shall be carried out in a qualified environment in accordance with ISO 11201, accuracy grade 2 (engineering method). For convenience, the measurements may be carried out in conjunction with those performed in accordance with Clause 7.
CAUTION: Installation conditions are not always identical between Clause 7 and Clause 8.
8.3.2 Meteorological conditions
The requirements of ISO 11201, accuracy grade 2 (engineering method) shall be followed.
The following conditions are recommended:
a) ambient pressure: 86 kPa to 106 kPa;
b) temperature: within the range defined by the manufacturer for the equipment, if a range is defined; if no
range is so defined by the manufacturer, the recommended range is 15 C to 30 C;
c) relative humidity: within the range defined by the manufacturer for the equipment, if a range is defined;
for processing of paper and card media only, if no range is so defined by the manufacturer, the
recommended range is 40 % to 70 %.
For equipment whose noise emissions vary with ambient temperature in a prescribed manner (e.g., by varying the speeds of air moving devices), the room temperature during the measurement shall be 23 °C ± 2 °C.
For equipment whose noise emissions vary with altitude in a prescribed manner (e.g., by varying the speeds of air moving devices), the altitude of the test room shall either be less than or equal to 500 m or the equipment shall be tested under conditions simulating its operation at an altitude less than or equal to 500 m.
NOTE This variation of speed of air-moving devices does not refer to the changing speed that is already accounted for in the correction for ambient pressure described in the NOTE to 8.8.1.
8.4 Instrumentation
Instrumentation shall meet the requirements of ISO 11201, accuracy grade 2 (engineering method) and the additional requirements of 7.4.
8.5 Installation and operation of equipment
Equipment shall be installed and operated in accordance with the requirements of Clause 5 except for hand-held and table-top equipment.
Hand-held equipment shall be installed so that the equipment is flat on a standard test table, with the front edge of the device aligned with the front edge of the table. Hand-held equipment may be optionally isolated from the surface by a small number of elastomeric feet, approximately 12 mm high.
Table-top equipment shall be installed centred on a standard test table, unless otherwise specified in Annex C. Any table-top equipment combination which includes a keyboard shall be installed such that the smallest rectangle in the plane of the table and encompassing the keyboard and other units is centred on the top of the standard test table or as specified in Annex C of this Standard. Any table-top equipment combination which normally is operated with a detachable keyboard but which is tested without the keyboard shall be centred on the test table, as if the keyboard were present, unless otherwise specified in Annex C.

26 © Ecma International 2018
For optional measurement of sub-assemblies intended for use in table-top products, install the sub-assembly in the centre of a standard test table and isolated from the surface by a small number of elastomeric feet, approximately 12 mm high. For optional measurement of sub-assemblies intended for use in other enclosures or racks, install the sub-assembly as specified in 5.1.7.
8.6 Microphone positions
NOTE These requirements are in accordance with, but more specific than, those of ISO 11201, accuracy grade 2
(engineering method).
8.6.1 At the operator position(s)
One or more operator positions shall be specified for equipment which requires operator attention while in the operating mode.
For equipment which is operated from a standing position, the microphone shall be located 1,50 m 0,03 m above the floor [see Figure 1 a), position P1].
For equipment which is operated from a seated position, the microphone shall be located 1,20 m 0,03 m above the floor [see Figure 1 b) or c), position P2 or P3].
The horizontal distance from the reference box shall be 0,25 m 0,03 m unless this distance is not representative of the operator position; in the latter case the representative operator position shall be described and shall be used.
For table-top equipment which normally has a detachable keyboard and which is tested without the keyboard (e.g. a desk-top personal computer or a video display unit that is tested without a keyboard), the distance from
the front end of the reference box, for purposes of determining the operator position, shall be 0,50 m 0,03 m in front of such equipment [see Figure 1d), position P4].
For optional measurement of sub-assemblies intended for use in equipment with a defined operator position, the microphone shall be placed 0,50 m ± 0,03 m above the centre of the sub-assembly.
During this measurement the operator should be absent, if possible, or move aside, so that he/she can still operate the equipment but does not significantly disturb the sound field around the microphone.
For hand-held equipment, the microphone shall be located 1,0 m ± 0,03 m above the floor, and the horizontal distance from the reference box shall be 0,125 m ± 0,01 m [see Figure 1e), position P5].
NOTE If sound pressure level at the operator position is measured on operator-attended equipment, then measurement of sound pressure level at the bystander position is not required.

© Ecma International 2018 27
Dimensions in metres
a) Standing operator b) Seated operator for floor- standing equipment
c) Seated operator for table-top equipment (case 1: with keyboard)
d) Seated operator for table-top equipment (case 2: without keyboard)
e) Operator for hand-held equipment
Figure 1 — Examples of microphone positions for standing and seated operators

28 © Ecma International 2018
8.6.2 At the bystander positions
For equipment which does not require operator attention while in the operating mode, an operator position need not be specified. In this case, at least four bystander positions shall be selected and specified.
The bystander positions shall be at a horizontal distance of 1,00 m 0,03 m from the sides of the reference
box and at a vertical distance of 1,50 m 0,03 m above the floor. The four preferred bystander positions are centred horizontally at the front, rear, right and left sides of the reference box. If the length of any side of the reference box exceeds 2,0 m, additional bystander positions at 1,0 m intervals should be used. For wall-mounted equipment or for equipment placed against the wall, the three preferred bystander positions are centred at the front, right, and left sides of the reference box.
For optional measurement of sub-assemblies intended for use in equipment which does not require operator attention while in the operating mode, install the sub-assembly in accordance with 5.1.7, define the reference box and apply the provisions of the preceding two paragraphs to define the bystander positions.
8.6.3 Microphone orientation
The microphones shall be oriented in such a way that the angle of sound incidence is the same as the angle for which the microphone has the most uniform frequency response. For most practical cases, the primary sound source is assumed to be either 30° or 45° below horizontal (see Figure 1).
8.7 Measurement of sound pressure levels
8.7.1 General
Measurements of the sound pressure level required by this clause shall be carried out at the microphone positions specified in 8.6 with A-weighting and/or for each frequency band within the frequency range of interest, if required. Record:
a) the A-weighted sound pressure levels and/or the one-third-octave band sound pressure levels, for the
specified modes of operation of the equipment;
b) the A-weighted sound pressure levels and/or the one-third-octave band sound pressure levels of the
background noise (including noise from support equipment).
When using a sound level meter, the person reading the meter shall not disturb the sound field at the microphone.
Should spatial fluctuations occur, due to interferences or standing waves, it is recommended that the microphone be moved by approximately 0,1 m in a vertical plane around the nominal measurement position, and the average sound pressure level be recorded.
In order to obtain the emission sound pressure level at a specified position, only background noise corrections K1 (K1A for A-weighted sound pressure level) shall be applied to the measured sound pressure level, in accordance with the procedure of ISO 11201, accuracy grade 2 (engineering method) (see 8.7.3.); environmental corrections, K2 (K2A for A-weighted sound pressure level) shall not be applied.
NOTE 1 Determination of whether the noise emission at the operator position or at the bystander positions contains
prominent discrete tones is specified in Annex D. Determination of whether the noise at the operator position or at the bystander positions contains prominent tonalities is specified in Annex G based on the hearing model approach in
Annex F.
Measurements of the C-weighted peak emission sound pressure level, LpCpeak, shall be carried out at the
microphone positions specified in 8.6 if any of the C-weighted peak sound pressure levels at the specified positions exceeds 120 dB.

© Ecma International 2018 29
NOTE 2 Some regulations require declaration of C-weighted peak emission sound pressure levels greater than 130 dB. Contemporary ITT equipment is unlikely to emit C-weighted peak emission sound pressure levels (LpCpeak) greater than
120 dB, which is set in this Standard as a conservative threshold above which measurement and reporting are required.
NOTE 3 Depending on the purposes of the test, it may be the case that one or more repeated measurements are taken for the source under test. Provided that each of the measurements in the repeated set represent identical conditions for
the source under test, and that they are each valid measurements in accordance with the requirements of this Standard, the arithmetic average of the measured sound pressure levels, in decibels, should be taken as the measurement result of
this clause.
8.7.2 Measurement time interval
The measurement time interval shall be as specified in 7.7.2.
8.7.3 Corrections for background noise
The requirements of ISO 11201, accuracy grade 2 (engineering method) shall be followed.
NOTE When the background noise levels in the test room are extremely low and very controlled, it is possible that the environment satisfies the absolute and/or relative criteria for background noise in accordance with ISO 11201,
accuracy grade 2 (engineering method). Care should be taken to use the latest version of ISO 11201; the second edition (2010-05-06) is the first version of ISO 11201 to use the concept of absolute and relative criteria for background noise.
8.8 Determination of emission sound pressure levels
8.8.1 Calculation of band emission sound pressure levels
The emission sound pressure level, under reference meteorological conditions, of the equipment in each one-third-octave band within the frequency range of interest (see 3.2.12) is obtained by using the procedure of ISO 11201, accuracy grade 2 (engineering method).
NOTE The procedures in ISO 11201 are used to determine the emission sound pressure level under reference meteorological conditions (ambient pressure 1,013 25 × 105 Pa, temperature 23,0 °C, relative humidity 50 %). Care should
be taken to use the latest version of ISO 11201; the second edition (2010-05-06) is the first version of ISO 11201 to use the concept of reference meteorological conditions.
The emission sound pressure level in the k-th octave band, Lpoct, k in decibels, if needed, shall be based on one-third-octave band data, and calculated from:
k
kj
L
kpjpL
3
23
1,0
oct,,3/110lg10 dB (3)
where
k is an identification number of octave band within the frequency range of interest (see Table 2);
Lp1/3, j is the emission sound pressure level in the j-th one-third-octave band, in decibels (see Table 3);
j is an identification number lying within the range of (3k – 2) and 3k, and which identifies the three one-third-octave bands which make up the k-th octave band.
8.8.2 Calculation of A-weighted emission sound pressure levels from band levels
For the purpose of this Standard, A-weighted emission sound pressure levels LpA in decibels, can be derived either directly from A-weighted sound pressure level or calculation from one-third-octave band data using the

30 © Ecma International 2018
A-weighting values for each band in accordance with the procedures of ISO 11201, accuracy grade 2 (engineering method).
NOTE The procedures in ISO 11201 are used to determine the emission sound pressure level under reference meteorological conditions (ambient pressure 1,013 25 × 105 Pa, temperature 23,0 °C, relative humidity 50 %). Care should
be taken to use the latest version of ISO 11201; the second edition (2010-05-06) is the first version of ISO 11201 to use the concept of reference meteorological conditions.
In the latter case, the A-weighted emission sound pressure level, LpA, in decibels, shall be based on the applicable frequency range of interest, and calculated from:
dB10lg1021
1=
)0,1(
A,3/1
j
AL
pjjpL (4)
where
Lp1/3j is the emission sound pressure level, in decibels, in the j-th one-third-octave band;
Aj is the A-weighting value corresponding to the j-th one-third-octave band from Table 3;
j is an identification number of one-third-octave band within the frequency range of interest.
Some ITT equipment emits high-frequency noise in the 16 kHz octave band. Depending upon the nature of noise emissions, Table 4 shows how to handle each situation. For the purposes of Clause 8, “sound power level” or “level” in Table 4 shall be replaced by “emission sound pressure level”. The derived levels are not frequency weighted.
For the determination of A-weighted emission sound pressure levels from band levels, this Standard does not extend the frequency range of interest.
For equipment which emits discrete tone(s) in the 16 kHz octave band, each frequency and level of the tone(s) that is (are) within 10 dB of the highest tone level in the band shall be determined in accordance with the procedures specified in ECMA-108 (see Table 4).
CAUTION The 16 kHz octave-band contribution is not included in the determination of A-weighted level.
8.8.3 Calculation of the mean emission sound pressure level at the bystander positions
If bystander positions are defined, the mean A-weighted emission sound pressure level, LpA, and the mean band emission sound pressure levels, Lp, in decibels, if required, at bystander positions defined in 8.6.2, shall
be calculated as specified in Formula (5):
dB101
lg10
1
1,0
N
i
L
ppi
NL (5)
where
Lpi is the band emission sound pressure level, in decibels (reference: 20 µPa), resulting from measurement at the i-th bystander position;
N is the number of bystander positions.
For the A-weighted emission sound pressure level, the symbols Lp and Lpi are replaced by LpA and LpAi, respectively.

© Ecma International 2018 31
9 Information to be recorded and reported
9.1 Information to be recorded
9.1.1 General
The information specified in 9.1.2 to 9.1.5 shall be recorded, when applicable. In addition, any deviation from any requirement in this noise test code or from the basic noise emission standards upon which it is based shall be recorded together with the technical justification for such deviation.
All requirements for recording and reporting specified in the basic noise emission standards are also requirements of this Standard. That is, the requirements below are necessary but not sufficient.
9.1.2 Equipment under test
The following information shall be recorded:
a) a description of the equipment under test (including main dimensions; name, model and serial number
of each unit; name, model and serial number of noise-producing components and sub-assemblies in the
equipment under test);
b) a complete description of the idle and operating modes, including operating speed, data medium used
and the test programme in terms that are meaningful for the type of equipment being tested;
c) a complete description of the installation and mounting conditions;
d) the location of the equipment in the test environment;
e) the location and functions of an operator, if present;
f) the nominal power line frequency, in hertz (e.g. 50 Hz), and the measured power line voltage, in volts;
g) a sample of typical hardcopy output of the product being tested, which, when applicable, should be filed
as part of the recorded data;
h) a statement as to whether the noise emission depends on room temperature, if known.
The following information is recommended to be recorded on tape or digitally.
For each operating mode, for the operator position (if defined), otherwise for the bystander position (if defined) with the highest A-weighted emission sound pressure level, a high-quality magnetic tape or digital recording may be made, of at least 1 min duration, annotated by voice on the second track with the name of the product,
the test mode, the microphone position, and the A-weighted sound pressure level of the signal. Dolby1 or other magnetic tape noise reduction features shall not be used. This Standard does not require that a calibration signal be recorded. The bias used in recording shall be noted on the cassette.
9.1.3 Acoustical environment
The following information shall be recorded.
a) If the sound power level is determined in accordance with Clause 6 (ISO 3741):
1) Dolby is an example of a suitable product available commercially. This information is given for the convenience of
users of this Standard and does not constitute an endorsement by Ecma of this product.

32 © Ecma International 2018
1) a description of the test room, including dimensions, shape, surface treatment of the walls, ceiling
and floor; a sketch showing location of source and room contents;
2) a description of diffusers, or rotating vanes, if any;
3) qualification of reverberation test room in accordance with ISO 3741;
4) the air temperature, in degrees Celsius, relative humidity as a percentage, and ambient pressure in
kilopascals.
b) If the sound power level is determined in accordance with Clause 7 (ISO 3744 or ISO 3745):
1) a description of the acoustical environment, if indoors, the size and acoustic characteristics of the
room, including absorptive properties of the walls, ceiling and floor; a sketch showing the location
of the equipment under test;
2) environmental corrections K2f resulting from the acoustical qualification of test environment in
accordance with the relevant procedure of ISO 3744, unless the environment has been qualified in
accordance with ISO 3745 - in the case of compliance with ISO 3745, this fact should be stated;
3) the air temperature in degrees Celsius, relative humidity as a percentage, and ambient pressure in
kilopascals.
c) For emission sound pressure level at the operator and bystander positions in accordance with Clause 8
[ISO 11201, accuracy grade 2 (engineering method)]:
NOTE 1 The type of information below is the same as for sound power determination, just described, but the values can differ from those recorded for sound power. If the information recorded for sound power determination in accordance
with the preceding paragraph is applicable here, it is sufficient to so note in the test file.
1) a description of the acoustical environment, if indoors, the size and acoustic characteristics of the
room, including absorptive properties of the walls, ceiling and floor; a sketch showing the location
of the equipment under test;
2) environmental corrections K2f resulting from the acoustical qualification of test environment in
accordance with ISO 3744, unless the environment has been qualified in accordance with ISO
3745; in the case of compliance with ISO 3745, this fact should be stated;
NOTE 2 Environmental corrections K2 are not to be used to modify the measured values but is included as part of the
test record as an indication of the quality of the measurement.
3) the air temperature in degrees Celsius, relative humidity as a percentage, and ambient pressure in
kilopascals.
9.1.4 Instrumentation
The following information shall be recorded:
a) equipment used for the measurements, including name, type, serial number and manufacturer;
b) bandwidth of frequency analyser (including FFT analyser, if used in Annex D);
c) frequency response of the instrumentation system;
d) method used for daily checking of the calibration of the microphones and other system components;
e) the date and place of any required periodic calibrations;
f) the test method used for determining;

© Ecma International 2018 33
1) the band mean time-averaged sound pressure level in accordance with ISO 3741; or the surface
time-averaged sound pressure level in accordance with ISO 3744;
2) the mean value of the emission sound pressure level at the operator or bystander positions in
accordance with ISO 11201;
9.1.5 Acoustical data
The following information shall be recorded.
a) If the sound power is determined in accordance with Clause 6 (ISO 3741):
1) location and orientation of the microphone traverse (path) or array (a sketch should be included if
necessary);
2) the corrections, if any, in decibels, applied in each frequency band for the frequency response of
the microphone, frequency response of the filter in the passband, background noise, etc.;
3) the values of the difference between the sound power and sound pressure levels produced by the
reference sound source (LWr – Lpr), in decibels, as a function of frequency;
4) the band pressure level readings, in decibels, to at least the nearest 0,1 dB (preferred), or 0,5 dB
(required) for the calculations in accordance with ISO 3741;
5) the sound power levels in decibels (reference: 1 pW) in octave and/or one-third-octave bands,
tabulated or plotted to the nearest 0,1 dB (preferred), or 0,5 dB (required);
6) the sound power level in decibels(reference: 1 pW), under reference meteorological conditions, in
octave and/or one-third-octave bands, tabulated or plotted to the nearest 0,1 dB (preferred), or
0,5 dB (required);
NOTE 1 Care should be taken to use the latest version of ISO 3741; the fourth edition (2010-10-01) is the first version
of ISO 3741 to use the concept of reference meteorological conditions.
7) the A-weighted sound power level in decibels (reference: 1 pW) rounded to the nearest 0,1 dB
(preferred), or 0,5 dB (required);
8) the A-weighted sound power level in decibels (reference: 1 pW), under reference meteorological
conditions, rounded to the nearest 0,1 dB (preferred), or 0,5 dB (required);
9) the date, time and place that the measurements were carried out, and the name of the person who
carried out the measurements.
b) If the sound power level is determined in accordance with Clause 7 (ISO 3744):
1) the shape of the measurement surface, the measurement distance, the location and orientation of
microphone positions (including both key microphone positions and additional ones, if required) or
paths used; if traversing microphones were used, the maximum traversing speed along a path and
microphone orientation shall be reported;
2) the area, S, in square metres, of the measurement surface;
3) the corrections, if any, in decibels, applied in each frequency band for the frequency response of
the microphone, and frequency response of the filter in the passband;
4) the background noise correction K1 (A-weighted or in frequency bands) for the surface
time-averaged sound pressure levels;

34 © Ecma International 2018
5) the background noise level measured at each point and the average background sound pressure
levels;
6) the environmental corrections K2 (A-weighted and in frequency bands) and the method by which it
was determined in accordance with one of the procedures of ISO 3744;
7) the A-weighted surface time-averaged sound pressure level and the band surface time-averaged
sound pressure level pL for each frequency band of interest, rounded to the nearest 0,1 dB
(preferred), or 0,5 dB (required);
8) the sound pressure levels Lpi (A-weighted or in frequency bands) at each measuring point i;
9) the A-weighted sound power level LWA, and the band sound power level LW, for each frequency
band of interest, rounded to the nearest 0,1 dB (preferred), or 0,5 dB (required);
10) the A-weighted sound power level LWA, and the band sound power level LW, under reference
meteorological conditions, for each frequency band of interest, rounded to the nearest 0,1 dB
(preferred), or 0,5 dB (required);
NOTE 2 Care should be taken to use the latest version of ISO 3744; the fourth edition (2010-10-01) is the first version
of ISO 3744 to use the concept of reference meteorological conditions.
11) the date, time and place that the measurements were carried out, and the name of the person who
carried out the measurements.
c) For emission sound pressure levels at the operator and bystander positions in accordance with
Clause 8 [ISO 11201, accuracy grade 2 (engineering method)]:
1) the measurement positions and microphone orientations (preferably including a sketch);
2) if an operator position is defined in accordance with 8.6.1, the A-weighted emission sound
pressure level LpA, the band emission sound pressure levels, if required, and the C-weighted peak
emission sound pressure level LpCpeak if greater than 120 dB, measured at the operator position(s)
for both the idle and operating modes, in decibels, rounded to the nearest 0,1 dB (preferred) or
0,5 dB (required);
3) if bystander positions are defined in accordance with 8.6.2, the A-weighted emission sound
pressure levels at the bystander positions, if required, the mean A-weighted emission sound
pressure level LpA, and the mean band emission sound pressure levels, if required, calculated in
accordance with 8.8.3 and the C-weighted peak emission sound pressure level LpCpeak if greater
than 120 dB (see NOTE 2 to 8.7.1) at the bystander position with the highest A-weighted emission
sound pressure level for both the idle and operating modes, in decibels, rounded to the nearest
0,1 dB preferred or 0,5 dB (required);
4) all emission sound pressure levels, in decibels, under reference meteorological conditions;
NOTE 3 Care should be taken to use the latest version of ISO 11201; the second edition (2010-05-06) is the first
version of ISO 11201 to use the concept of reference meteorological conditions.
5) optionally, the frequency, in hertz, of any prominent discrete tones identified in accordance with the
procedures of Annex D and the value of the tone-to-noise ratio ∆LT and/or prominence ratio ∆LP as
applicable, in decibels, associated with that prominent discrete tone, or the frequency, in hertz, of
prominent tonalities identified in accordance with the procedures of Annex G and the
corresponding psychoacoustic tonality value;
6) A-weighted background noise levels and background noise correction K1A at each specified
position, and as required, background noise levels and correction K1 in frequency bands;

© Ecma International 2018 35
7) the date, time and place where the measurements were carried out, and the name of the person
who carried out the measurements.
9.2 Test report
The test report shall contain at least the following information:
a) A statement of whether the sound power levels and the emission sound pressure levels at operator or
bystander positions have been obtained in full conformity with the procedures specified in this Standard
and ISO 3741, ISO 3744 or ISO 3745, as applicable, and ISO 11201. Any deviation from any
requirement of these International Standards shall be reported, together with the technical justification
for such deviation;
b) A statement that these sound power levels are expressed in decibels (reference: 1 pW) rounded to the
nearest 0,1 dB (preferred), or 0,5 dB (required) and that these emission sound pressure levels are
expressed in decibels (reference: 20 µPa) rounded to the nearest 0,1 dB (preferred), or 0,5 dB
(required);
c) The name(s) and model number(s) of the equipment under test;
d) The A-weighted sound power level, LWA, under reference meteorological conditions, in decibels, for the
idle mode and the operating mode(s) (reference: 1 pW).
e) The sound power levels, LW, under reference meteorological conditions, in decibels, in octave or one-
third-octave bands, if required, for the idle mode and the operating mode(s); the bandwidth used shall
be stated (reference: 1 pW);
f) If an operator position is defined in accordance with 8.6.1, the A-weighted emission sound pressure
level, LpA, and if required, the band emission sound pressure levels, under reference meteorological
conditions, in decibels (reference: 20 µPa), at the operator position(s) for the idle and operating modes;
g) If bystander positions are defined in accordance with 8.6.2, the mean A-weighted emission sound
pressure level, LpA, and, if required, the mean band emission sound pressure levels in decibels
(reference: 20 µPa), under reference meteorological conditions, at the positions specified in 8.6.2
around the equipment for the idle and operating modes;
h) A detailed description of operating and installation conditions of the equipment being tested with
reference to the specific subclause of Annex C (including publication date and edition), if applicable
(e.g., “operating and installation conditions in accordance with C.20 of ECMA-74:2010, 15th edition”). If
additional, or substitute, operating conditions or operating modes have been defined in accordance with
5.3, these shall be clearly described in the report.
NOTE 1 To avoid confusion between emission sound pressure level in decibels (reference: 20 µPa) and sound power
levels in decibels (reference: 1 pW), sound power level can be expressed in bels, using the identity 1 bel = 10 decibels.
NOTE 2 For the determination of declared noise emission values for ITT equipment in accordance with ECMA-109
when multiple units from a production series or “batch” are measured, a positive number is added to the mean sound power level based on statistical considerations to account for both random measurement errors and production variations.
Information in a) to i) may be supplemented by one of the following statements, which describe the character of the noise as determined in accordance with Annex D or Annex G:
1) no prominent discrete tones (Annex D) or no prominent tonalities (Annex G);
2) prominent discrete tones (Annex D) or prominent tonalities (Annex G);

36 © Ecma International 2018
Items 1) through 2) shall be supplemented with a statement of the method used to identify prominent discrete tones or prominent tonalities.
NOTE 3 Some regulations require the reporting of the C-weighted peak emission sound pressure level if greater than 130 dB.

© Ecma International 2018 37
Annex A (normative)
Test accessories
A.1 Standard test table
The design for the standard test table is shown in Figure A.1. The top of the table shall be bonded laminated wood, 0,04 m to 0,10 m thick, having a minimum area of 0,5 m2 and lateral dimensions 0,75 m -
0,05 m/+ 0.03 m. The height of the table shall be 0,75 m 0,03 m. The table may have a slot in its top plate to allow paper to be inserted for printers which feed the paper from underneath their bottom cover. A slot 0,015 m by 0,400 m in lateral dimensions has been found practical for most printer paper.
97-0036-A
0,04 to 0,10 m
0,75 m
0,75 m
Legs & braces: screwed & bonded
Isolatingpads
Figure A.1 — Standard test table
Dimensions in metres

38 © Ecma International 2018
A.2 Typing robot
The typing robot shall be designed to operate a keyboard in the manner specified in this Standard. The robot here described uses eight solenoids, each being individually adjustable to operate one of the selected keyboard keys.
The requirements for this robot are:
a) the noise of the robot shall meet the requirements for background noise of this Standard;
b) the stroke of each solenoid plunger shall fully release the key in its upper position and push it
completely down to its stop; a total stroke of 6 mm to 7 mm should be sufficient for most types of
keyboards including typewriters;
c) the electrical input signal shall be a rectangular pulse of 50 ms duration, and of adjustable amplitude;
d) the solenoid characteristics shall provide an increasing force during key-down motion, as shown in
Figure A.2. A suitable design is shown in Figure A.3;
e) the plunger mass shall be 20 g ± 1 g; its end shall be soft (e.g. closed-cell foam, 40 Shore A).
A complete operation of a single key includes the following three steps, which are shown in Figure A.4:
a) Home position
The plunger rests under its own weight with its soft end on the key.
b) Key operation
When excited by the solenoid, the plunger pushes the key down until it has reached its stop position. The adjustment of the solenoid should give a plunger clearance of 1 mm; an appropriate mark at the upper plunger end will facilitate this adjustment;
c) Key return
The plunger is returned only by the key spring. The plunger return stop shall be soft and allow a maximum overshoot of 0,5 mm; the plunger returns to its home position, resting on the key.
NOTE The specification is based on the design of the robot described in Reference [7].

© Ecma International 2018 39
97-0037-A
12
10
8
6
4
2
0 1 2 3 4 5 6 7 8
Ma
gn
etic
fo
rce
(N
)
Stroke (mm)
Figure A.2 — Solenoid characteristics for a plunger stroke of 4 mm
97-0038-A
Figure A.3 — Solenoid cross section

40 © Ecma International 2018
97-0039-A
4-6 mm
0,5 mm maxovershoot
Step 1.Home position
Step 2.Key operation
Step 3.Key return
Figure A.4 — Individual steps of the solenoid operation

© Ecma International 2018 41
Annex B (normative)
Measurement surfaces
B.1 Hemispherical measurement surface
Refer to ISO 3744 for the requirements for microphone locations and geometry of the hemispherical measurement surface and microphone array, supplemented by the following additional conditions:
a) When using fixed microphone positions, the microphone positions given in ISO 3744 for sources
emitting discrete tones shall be used for all sources. The co-ordinates for this array are reproduced
below in Table B.1;
b) When using the coaxial circular paths arrangement specified in ISO 3744, it is recommended that a
minimum of 10 heights be used.
Other acceptable alternatives are described in the relevant Annexes of ISO 3745.
Table B.1 — Co-ordinates of microphone positions for equipment emitting discrete tones
Position x/r y/r z/r
1 0,16 - 0,96
0,22
2 0,78 - 0,60
0,20
3 0,78 0,55 0,31
4 0,16 0,90 0,41
5 - 0,83
0,32 0,45
6 - 0,83
- 0,40
0,38
7 - 0,26
- 0,65
0,71
8 0,74 - 0,07
0,67
9 - 0,26
0,50 0,83
10 0,10 - 0,10
0,99
For the purpose of this Standard, for small equipment which emits very low level noise, a hemispherical measurement surface with a radius less than 1 m, but at least 0,5 m, may be used, provided that the reduced

42 © Ecma International 2018
radius is greater than or equal to twice the characteristic source dimension. If the radius is reduced below 1 m, the lower end of the frequency range of interest becomes higher. To minimize the near field effects, the 0,5 m radius would have a corresponding lower frequency limit of approximately 172 Hz (based on a requirement of one quarter of the wavelength of sound at the lowest frequency of interest). Additional information is in References [8], [9] and [10].
B.2 Cylindrical measurement surface
B.2.1 General
Figure B.1 illustrates the cylindrical measurement surface, having microphones located along the side and top of the cylinder. The cylinder shall be centred around the reference box with the centre of the cylinder’s base corresponding to the centre of the reference box base. The dimensions of the reference box, l1, l2, and l3, and the reference distances to the cylinder, d1, d2, and d3 are as shown. For the purposes of this annex, the
dimensional labels shall be assigned so that l1 l2.
B.2.2 Selection of size of cylindrical measurement surface
The microphone positions lie on the measurement surface, a hypothetical cylindrical surface enveloping the
source and having a total area S equal to the sum of the area of the top circular surface, Stop, and the area of
the side vertical surface, Sside are given by the following formulae:
S Stop Sside (B.1)
Stop R2 (B.2)
Sside 2RH (B.3)
where
R is the radius of the cylinder, given by
R = l1/2 + d1 = l2/2 + d2 (B.4)
H is the height of the cylinder, given by
H = l3 + d3. (B.5)
Due to the fact that the microphones are associated with unequal sub-areas, both d3 and d1 may be selected
arbitrarily based on the size of the equipment under test or other considerations. It is recommended that both of these be set to the same value, preferably 1 m, but neither shall be less than 0,5 m. Furthermore, none of the distances d1, d2, or d3 shall be greater than 1,5 times either of the others (e.g., this condition will be met for
d1 and d2 provided d1 ≥ l1 – l2). With d3 and d1 selected, H and R are defined and d2 defaults to
d2 = R – l2/2. (B.6)
In certain cases, such as for large machines where l1 and l2 are of the same magnitude, the side microphones may pass too close to the machine during their traverse even when the above constraints are met. In view of this, the radius, R, shall be large enough such that the side microphones remain more than 0,25 m from any corner of the reference box.

© Ecma International 2018 43
B.2.3 Selection of microphone positions on the cylindrical measurement surface
The microphones on the cylindrical measurement surface are associated with unequal sub-areas, as described in the following. The microphones are located along the top and side surfaces of the cylinder and may either sweep out continuous paths (circular traverses) along these surfaces or be located at fixed positions on equally spaced “slices” of the cylindrical surface. It is recommended that continuous paths be used for the microphones for sources emitting steady noise. Fixed microphone positions shall be used when the source emits non-steady noise. However, for either steady or non-steady noise, if fixed microphone positions are used to sample over the circular traverses, at least 8 equally spaced angular positions (i.e., at 45° spacing or less) shall be used, starting from an initial angular position perpendicular to one of the sides of the reference box. The traverses may be implemented by either rotating the microphones, keeping the source stationary, or rotating the source, keeping the microphones stationary. When fixed microphone positions are used, the number of angular positions can be reduced if preliminary investigations for a particular family of noise sources show that the surface sound pressure levels determined using the reduced number of positions deviate by no more than 0,5 dB from those using the complete set of positions. This might be practical, for example, when the pattern of sound emission from the source is symmetrical. The followingrequirements in this section govern the number of side microphones, Nside, and the number of top
microphones, Ntop, and the associated sub-areas:
Nside H / H0 (B.7)
where H0 is set to 0,5 m to achieve adequate vertical sampling by limiting the spacing to 0,5 m or less.
Nside 4 (B.8)
Ntop R/R0 (B.9)
where R0 is set to 0,5 m to achieve adequate radial sampling by limiting spacing to 0,5 m or less.
Ntop 2. (B.10)
The vertical side microphones are associated with equal sub-areas, Si, where Si = Sside / Nside, and positioned
such that the i-th microphone is at a height, from the floor, hi, given by
side
( 1/ 2)i
i Hh
N
. (B.11)
The mean time-averaged sound pressure level over the side surface, side,pL is:
side, side,0,1
, sideside 1
110lg 10 dBp i
NL
p
i
LN
(B.12)
where
ipL side,, is the frequency-band time-averaged sound pressure level, in decibels, measured along the i-th
microphone traverse or at the i-th microphone position on the side surface.
The top microphones are associated with unequal sub-areas, Sj, and are spaced equally along the radius of
the top surface. The outer radius of the j-th sub-area is given by

44 © Ecma International 2018
top/ NRjR j (B.13)
and the positions of each top microphone are given by
rj = Rj–1 + (Rj – Rj–1) / 2 for j > 1 (B.14)
and
r1 = R1 / 2. (B.15)
The mean time-averaged sound pressure level over the top surface is:
top, top,0,1
, toptop 1
110lg 10 dBp j
NL
p j
j
L SS
(B.16)
where
jpL top,, is the frequency-band time-averaged sound pressure level, in decibels, measured along the
j-th microphone traverse or at the j-th microphone position on the top surface.
21
2 jjj RRS
for j > 1 (B.17)
.2
11 RS (B.18)
Figure B.2 illustrates an example of the cylindrical microphone array for 5 vertical side microphones and 4 top microphones.
B.2.4 Calculation of the mean time-averaged sound pressure level over the cylindrical measurement surface
The mean time-averaged sound pressure level from the array of microphones over the cylindrical measurement surface, for the chosen mode of operation of the equipment under test is given by:
,top ,side0,1 0,1top side
110lg 10 10 dBp pL L
pL S SS
(B. 19)
where S , top,pL and ,sidepL are given by Formulae (B.1), (B.16) and (B.12), respectively.
NOTE 1 The quantity pL
is equivalent to the quantity )ST(pL in ISO 3744; that is, the quantity that is subsequently
corrected for background noise and the test environment before computing the surface time-averaged sound pressure
level.
NOTE 2 Additional details about the cylindrical measurement surface can be found in References [11], [12] and [13].

© Ecma International 2018 45
KEY
1 to 6 side microphone paths 7 to 9 top microphone paths 10 reference box 11 reflecting plane d1, d2, d3 reference distances to the cylinder H cylinder height l1, l2, l3 reference box dimensions R cylinder radius
Figure B.1 — Example 1: Illustration of the cylindrical measurement surface and circular microphone traverses showing the arrangement using 6 side microphones and 3 top microphones.

46 © Ecma International 2018
KEY
1 axis of rotation of microphone traversing mechanism 2 dimensions of corresponding areas of cylinder 3 locations of microphone traverses H cylinder height R cylinder radius
Figure B.2 — Example 2: Illustration of the cylindrical measurement surface and microphone array
showing an arrangement using 5 side microphones and 4 top microphones.

© Ecma International 2018 47
Annex C (normative)
Installation and operating conditions
for specific equipment categories
C.1 General
This annex specifies installation and operating conditions for many specific categories of Information Technology and Telecommunication (ITT) equipment. During testing of such equipment, the specified conditions shall be satisfied in order to be in compliance with this Standard. In general, the conditions specified in this annex are considered to be typical of average end use. Because the noise emission levels of the equipment covered by this annex may vary significantly depending on how the equipment is installed and operated during the tests, the primary purpose of specifying the installation and operating conditions is to ensure that the acoustical measurements are taken uniformly across different laboratories testing the same type of equipment. Reported noise emission levels for ITT equipment measured in compliance with this Standard may then be compared or otherwise assessed without having to know the specific details of the installation and operating conditions used during the tests.
For categories of equipment not covered in this annex, the actual installation and operating conditions used during the test shall be described and justified (e.g., as to their representation of typical operating conditions) and test conditions used shall be described and justified (e.g., as to their representation of typical operating conditions) in the test report.
The operating conditions are strictly the same for the determination of both sound power levels and emission sound pressure levels at specified positions (see Clause 3 for definitions of these quantities).
The following categories of equipment are included:

48 © Ecma International 2018
C.2 Typewriters
C.3 Character- and line-printers
C.4 Teleprinters
C.5 Keyboards
C.6 Copiers (duplicators)
C.7 Card readers and card punches
C.8 Magnetic tape units
C.9 Disk units and storage sub-systems
C.10 Visual display units and terminals
C.11 Electronic units
C.12 Microform readers
C.13 Facsimile machines (Telecopiers) and page scanners
C.14 Cheque processors
C.15 Personal computers and workstations
C.16 Page printers
C.17 Self-service automatic teller machines
C.18 Rack-mountable units and rack-enclosed systems
C.19 CD- and DVD-ROM drives
C.20 Data projectors
C.21 Multi-function devices (MFD)
C.22 Hand-held computing and media playback devices
C.23 Digital media recorders and playback units for consumer use
For equipment capable of performing the functions of more than one category, for example printing and facsimile transmission, see 5.3.
When emission sound pressure level information is needed for the above categories of equipment, Table C.1 shall be used to determine whether an operator position or bystander positions measurements are required.

© Ecma International 2018 49
Table C.1 — Equipment measurement position(s) for the determination of emission sound pressure level
Equipment categories Operator
position
Bystander
positions
C.2 Typewriters X
C.3 Character- and line-printers X
C.4 Teleprinters X
C.5 Keyboards X
C.6 Copiers (duplicators) X
C.7 Card readers and card punches X
C.8 Magnetic tape units X
C.9 Disk units
Storage sub-systems
X
X
C.10 Visual display units and terminals X
C.11 Electronic units X
C.12 Microform readers X
C.13 Facsimile machines (Telecopiers) and
page scanners
X
C.14 Cheque processors X
C.15 Personal computers and workstations X
C.16 Page printers X
C.17 Self-service automatic teller machines X
C.18 Rack-mountable units and rack-
enclosed systems
X
C.19 CD- and DVD-ROM drives
- In case of use in end use equipment X
- In case of sub-assembly X
C.20 Data projectors X
C.21 Multi function devices (MFD) X
C.22 Hand-held computing and media
playback devices
X
C.23 Digital media recorders and playback
units for consumer use
X
Reporting emission sound pressure levels from other positions is optional.
Fans, also called “air moving devices”, are often incorporated into the design of ITT equipment to provide

50 © Ecma International 2018
airflow for cooling. To measure such a fan as a component, for example as part of the process of selection for design use in a computer, refer to ISO 10302-1 and ISO 10302-2.
C.2 Equipment category: Typewriters
C.2.1 Description
This category covers equipment with a keyboard for manual information entry. The information is either keyed-in and immediately printed on paper character-by-character (manual typing), or keyed-in and stored for word or line editing with following automatic print-out (interactive operations). Typewriters which are equipped with a full-page storage are considered as typewriters during manual typing and as printers (see C.3) during automatic print-out on a full page.
C.2.2 Installation
C.2.2.1 General
The typewriter shall be placed in the centre of the top plane of the standard test table. For measurements in accordance with Clause 7, the measurement surface terminates on the floor. Alternatively, the typewriter may be placed on a hard reflecting floor. The condition used shall be reported.
C.2.2.2 Type font
If the typewriter allows the use of different type fonts or different type elements, a fine line typestyle (e.g. pica, elite, and not bold) shall be used with a character pitch of 10 characters per 25,4 mm.
C.2.2.3 Paper
Single sheets of paper of grammage 70 g/m2 to 80 g/m2 in the ISO A4 or equivalent format shall be used unless the typewriter is designed for special paper having a different grammage. In this latter case, the special paper shall be used. Paper shall be inserted in vertical format with the left-hand edge at zero; the leading edge of the paper sheet shall be fed through to approximately one-third of the paper length, or 100 mm lower than the trailing edge (see Figure C.1). Paper shall have been stored unpacked and exposed to the environmental conditions specified in 6.3.2, 7.3.2 or 8.3.2 as applicable, for at least 24 h immediately prior to the test.
97-0044-A
100 mm
Figure C.1 — Insertion of single sheet of paper

© Ecma International 2018 51
C.2.3 Operation
C.2.3.1 Idle mode
The power shall be switched on. Paper shall be inserted in accordance with Figure C.1.
NOTE If the typewriter has both standby and ready mode, the idle mode corresponds to the standby mode.
If the typewriter has several idle modes, the mode(s) used for measurement shall be reported.
C.2.3.2 Typing mode
C.2.3.2.1 General
The typing mode consists of keying-in the specified character pattern and printing it on paper. Keying-in should preferably be performed with a suitable robot (see A.2) to simulate manual keystrokes. The noise level due to the operation of the robot alone shall be at least 6 dB and preferably more than 10 dB below the level of operation.
Typing shall start after the paper has been inserted, as specified in Figure C.1 and shall continue for not more than 100 mm.
NOTE If a typing robot is not available, manual typing may be used.
C.2.3.2.2 Settings
The following settings, when applicable, shall be used.
a) Impression control: as recommended for a single sheet of paper.
b) Multi-copy control: set for a single sheet.
c) Line spacing: double-line spacing.
d) Margin: 25 mm from the edges; the end-of-line indicator (bell) shall be disconnected.
e) Paperbail rollers: the paperbail rollers shall be set 25 mm from the edges of the paper; the others shall
be equally spaced between.
C.2.3.2.3 Character pattern
The test pattern characters shall be
etnaiv etnaiv etnaiv etnaiv...
and so on until a full printline of approximately 60 characters has been completed.
The single space between each group of six characters is required as part of the pattern. The carriage return after each line is part of the operation.
NOTE 1 A maximum of two characters may be replaced by other small letters, if there is a need for adjustment of the
robot.
NOTE 2 Should small letters not be available, capital letters may be used instead; equivalent conditions may be
selected for typewriters with non-Latin character sets.

52 © Ecma International 2018
C.2.3.2.4 Operating speed
For manual operations the typing speed shall be five characters per second.
The specified characters shall be keyed in at a rate of five characters per second until the buffer is filled up; a maximum buffer capacity of one printline shall not be exceeded. The stored information shall then be immediately printed (maximum one line) at the maximum printing speed.
C.2.4 Measurement time interval
The time-averaged sound pressure level shall be measured for at least the measurement time interval specified in 6.7.2, 7.7.2 or 8.7.2 as applicable, during the following operations.
For manual operations: measure during continuous typing over at least three full lines.
For interactive operations: measure during keying-in and printing-out until at least three full lines have been printed.
C.3 Equipment category: Character and line printers
C.3.1 Description
This category covers electronically controlled equipment which prints stored information on paper and is not normally keyboard-operated, and the noise output of which depends on the print pattern. The output may be obtained by means of impact printing (e.g. typebar-, train-, chain- or band-printers, printwheel, type-element or matrix printers) or by non-impact printing (e.g. electro-erosion or thermal printers).
NOTE For ink-jet printers, see C.16.
For equipment which offers print and any one or more of the following functions, follow the procedures in C.21 instead of the procedures in C.3:
scan
copy
facsimile
C.3.2 Installation
C.3.2.1 General
Floor-standing printers shall be installed on the hard reflecting floor.
Printers which are normally placed on a special stand or table shall be installed on such a stand on the reflecting floor. Printers which are placed on an office table or desk and which take paper from, or stack paper on, the floor, shall, if possible, be placed in the centre of the top plane of the standard test table, using the floor to support the paper. For such measurements in accordance with Clause 7, the measurement surface terminates on the reflecting floor.
Table-top printers, which do not use the floor for the paper supply or exit stack, shall be placed on the hard reflecting floor for measurements in accordance with Clause 6 or Clause 7, and on the standard test table for measurements in accordance with Clause 8.

© Ecma International 2018 53
C.3.2.2 Type style
For printers that support multiple type styles or type elements, a type style typical of normal use, with a pitch of 10 characters per 25,4 mm and 6 lines per 25,4 mm shall be used. If this is not possible, an adjustment as close as possible to these values shall be chosen. Condensed or extended characters shall not be used.
C.3.2.3 Paper
Either single sheets of paper of grammage 60 g/m2 to 80 g/m2 or continuous, folded or rolled stationery of grammage 50 g/m2 to 60 g/m2 shall be used, unless the printer is designed for special paper having a different grammage. In this latter case, the special paper shall be used. The quantity of paper available for printing shall be as close as possible to the maximum capacity of the printer. The form width shall be the widest that is commonly available for the printer and shall be described in the test report. For special applications (e.g. when the material to be printed is a passbook or cheque) the material shall be typical for customer usage and shall be described in the test report.
Paper storage and unpacking shall follow the machine manufacturer's instructions. If there are no such instructions, paper shall have been stored unpacked and exposed to the environmental conditions specified in 6.3.2, 7.3.2 or 8.3.2 as applicable, for at least 24 h immediately prior to the test.
C.3.3 Operation
C.3.3.1 Paper position
For continuous folded or rolled stationery, the paper length fed through the printer shall be at least ten times its width. For single sheet paper, the print area shall be vertically centered and span at least 60 % of the sheet length.
C.3.3.2 Idle mode
Idle mode is a steady state condition that occurs after completion of print operation. Printers may have several idle modes, each with unique noise and duration, for example, step-down or variable speed cooling fan operation.
Idle noise shall be measured after print job completion with the power switch of the printer remaining on. The idle mode lasting at least one minute with highest noise emissions shall be measured and reported.
The measurement time interval of idle noise measurement shall be in accordance with C.3.4.
C.3.3.3 Operating mode (Print mode)
C.3.3.3.1 General
Printers with single-sheet feeding devices shall be tested in best quality mode. Paper of size ISO A4 or of an equivalent format (portrait) is automatically fed.
Printers with continuous stationery shall be tested in draft mode with maximum paper width.
Printers capable of printing both single sheets of paper and continuous stationery shall be tested in both configurations.
The print mode consists of printing a character pattern specified in C.3.3.3.3.

54 © Ecma International 2018
For graphic printers whose print speed is specified in accordance with ISO/IEC 11160-1 while printing graphic mode in accordance with ISO/IEC 10561, a second operating mode shall be tested and reported: the second mode consists of printing the test pattern in ISO/IEC 10561:1999, Annex D.
C.3.3.3.2 Settings
The following settings, when applicable, shall be used.
a) Impression control: as recommended for a single sheet of paper.
b) Multi-copy control: set for a single sheet.
c) Line spacing: double-line spacing and skip 20 mm to 30 mm on each side of the paper fold.
d) Margin: 25 mm from the edges (excluding the perforation strip) except when the printer characteristics
restrict the available line length; in the latter case, typical margin length shall be used and reported.
C.3.3.3.3 Character pattern
The full content of a 40-character test pattern is specified below. The character pattern shall be arranged in groups of five printed characters followed by five spaces. The position of the pattern should preferably be shifted by five characters on each line, using an end-around shift over the available line length. The printing area shall be left-justified and centred vertically. If the line comprises fewer characters, the left-most ones shall be used.
J1YY7 2DA90 8S8=2 6AI8Q B31AJ 5FTOE PG1TK X6D-4
If some of the specified characters are not available, alternative characters of up to 20 % of the characters in one line may be substituted. For printers which print only non-Latin characters or numerical information a random set of characters or numbers shall be selected and reported.
NOTE The number of characters to be printed in one line depends on the printer itself and is specified in Table C.2.
Examples of test patterns are shown in Figures C.2 and C.3.
C.3.3.3.4 Operating speed
The rated speed for which the printer is designed shall be used. If several speeds are provided, the one which is typical for the majority of the uses shall be selected and described in the test report. Additional conditions may be specified for special applications and shall be described in the test report.

© Ecma International 2018 55
Available Line Length 65 characters
JIYY7 2DA90 8S8=2 6AI8Q B31AJ 5FTOE JIYY7 2DA90 8S8=2 6AI8Q B31AJ 5FTOE JIYY7 2DA90 8S8=2 6AI8Q B31AJ 5FTOE5FTOE JIYY7 2DA90 8S8=2 6AI8Q B31AJ 5FTOE JIYY7 2DA90 8S8=2 6AI8Q B31AJB3IAJ 5FTOE JIYY7 2DA90 8S8=2 6AI8Q B3IAJ 5FTOE JIYY7 2DA90 8S8=2 6AI8Q6AI8Q B31AJ 5FTOE JIYY7 2DA90 8S8=2 6AI8Q B31AJ 5FTOE JIYY7 2DA90 8S8=-28S8=2 6AI8Q B3IAJ 5FTOE JIYY7 2DA90 8S8=2 6A18Q B31AJ 5FTOE JIYY7 2DA902DA90 8S8=2 6AI8Q B31AJ 5FTOE JIYY7 2DA90 8S8=2 6AI8Q B31AJ 5FTOE JIYY7JIYY7 2DA90 8S8=2 6AI8Q B31AJ 5FTOE JIYY7 2DA90 8S8=2 6AI8Q B31AJ 5FTOE JIYY7 2DA90 8S8=2 6AI8Q B31AJ 5FTOE5FTOE JIYY7 2DA90 8S8=2 6AI8Q B31AJ 5FTOE JIYY7 2DA90 8S8=2 6A18Q B31AJB31AJ 5FTOE JIYY7 2DA90 8S8=2 6AI8Q B31AJ 5FTOE JIYY7 2DA90 8S8=2 6AI8Q6AI8Q B31AJ 5FTOE JIYY7 2DA90 8S8=2 6AI8Q B31AJ 5FTOE JIYY7 2DA90 8S8=28S8=2 6AI8Q B31AJ 5FTOE JIYY7 2DA90 8S8=2 6AI8Q B31AJ 5FTOE JIYY7 2DA902DA90 8S8=2 6AI8Q B31AJ 5FTOE JIYY7 2DA90 8S8=2 6AI8Q B31AJ 5FTOE JIYY7JIYY7 2DA90 8S8=2 6AI8Q B31AJ 5FTOE JIYY7 2DA90 8S8=2 6AI8Q B31AJ 5FTOE
margin25mm
margin25mm
20 - 30 mm skip
20 - 30 mm skip
97-0045-A
Figure C.2 — Example of the test pattern for a line length of 65 characters

56 © Ecma International 2018
97-0046-A
Available Line Lenght 115 characters
J
JIYY7 2DA90 858=2 6AI8Q 6AI8Q B31AJ SFTO2 PGITK X6D-4 JIYY7 2DA90 858=2 6AI8Q B31AJ SFTO2 PGITK X6D-4 JIYY7 2DA90 858=2858=2 6AI8Q B31AJ SFTO2 PGITK X6D-4 JIYY7 2DA90 858=2 6AI8Q B31AJ SFTO2 PGITK X6D-4 JIYY7 2DA902DA90 858=2 6AI8Q B31AJ SFTO2 PGITK X6D-4 JIYY7 2DA90 858=2 6AI8Q B31AJ SFTO2 PGITK X6D-4JIYY7 2DA90 858=2 6AI8Q B31AJ 5FTOE PGITK X6D-4 JIYY7 2DA90 858=2 6AI8Q B31AJ 5FTOE PGITK X6D-4 JIYY7 2DA90 858=2 6AI8Q B31AJ 5FTOE PGITK X6D-4
IYY7 2DA90 858=2 6AI8Q B31AJ 5FTOE PGITK X6D-4 JIYY7 2DA90 858=2 6AI8Q B31AJ 5FTOE PGITK X6D-4 JIYY7 2DA90 858=2 6AI8Q B31AJ 5FTOE PGITK X6D-4 JIYY7 2DA90 858=2 6AI8Q B31AJ 5FTOE PGITK X6D-4 JIYY7 2DA90 858=2 6AI8Q B31AJ 5FTOE PGITK X6D-4 JIYY7 2DA90 858=2 6AI8Q B31AJ 5FTOE PGITK X6D-4 JIYY7 2DA90 858=2 6AI8Q B31AJ 5FTOE PGITK X6D-4 JIYY7 2DA90 858=2 6AI8Q B31AJ 5FTOE PGITK X6D-4 JIYY7 2DA90 858=2 6AI8Q B31AJ 5FTOE PGITK X6D-4X6D-4 JIYY7 2DA90 858=2 6AI8Q B31AJ 5FTOE PGITK X6D-4 JIYY7 2DA90 858=2 6AI8Q B31AJ 5FTOE PGITK PGITK X6D-4 JIYY77 2DA90 858=2 6AI8Q B31AJ 5FTOE PGITK X6D-4 JIYY7 2DA90 858=2 6AI8Q B31AJ 5FTOE SFTO2 PGITK X6D-4 JIYY7 2DA90 858=2 6AI8Q B31AJ SFTO2 PGITK X6D-4 JIYY7 2DA90 858=2 6AI8Q B31AJ B31AJ SFTO2 PGITK X6D-4 JIYY7 2DA90 858=2 6AI8Q B31AJ SFTO2 PGITK X6D-4
margin25mm
margin25mm
20 - 30 mm skip
20 - 30 mm skip
space as requiredto adjust margins
Figure C.3 — Example of the test pattern for a line length greater than 110 characters
Table C.2 — Number of characters to be used
Available line length in characters
Number of characters to be used
40 50 % of maximum line length between margins
40-59 20 characters
60-110 30 characters
110 40 characters
C.3.4 Measurement time interval
The time-averaged sound pressure level shall be measured for at least the measurement time interval specified in 6.7.2, 7.7.2 or 8.7.2 as applicable, during the following operations:
a) Single-page form: measure during continuous printing over at least 60 % of the page length; if the printer
has an automatic paper feed mechanism, at least three pages shall be printed.
b) Folded stationery: measure during continuous printing over at least three pages.
c) Rolled stationery: measure during continuous printing over a length equal to at least the paper width.
d) Passbook: measure during printing of a single line on the middle pages during a complete operation cycle
from insertion to ejection (for details see C.17).

© Ecma International 2018 57
C.4 Equipment category: Teleprinters
C.4.1 Description
This category covers equipment operating as a send/receive machine basically comprising a keyboard, a printing unit, a mechanical or electronic send/receive unit (line control unit) and (integrated or optional) a memory unit (electronic, paper tape punch or reader, magnetic tape, disk or cassette).
Two typical uses are:
a) Keyboard operation (when in local or transmission mode): the information is keyed-in by manual typing
and immediately printed on paper and/or stored in the memory.
b) Automatic operation (when in local or on-line mode): the machine prints automatically the information
received from line network or from the memory unit.
When a teleprinter is fitted with an auxiliary unit which produces noise (e.g. paper tape punch/reader, magnetic tape, disk or cassette), the machine shall be tested with and without the unit in operation.
In some cases a teleprinter can be available in receive-only configuration (without keyboard). That machine is considered to be a character or line printer (in accordance with C.3).
C.4.2 Installation
C.4.2.1 General
For keyboard operation of the teleprinter, the general installation conditions for typewriters shall apply (see C.2).
For automatic operation of the teleprinter, the general installation conditions for printers shall apply (see C.3).
C.4.2.2 Paper
Either single sheets of paper of grammage 70 g/m2 to 80 g/m2 or continuous, folded or rolled stationery of grammage 50 g/m2 to 60 g/m2 shall be used, unless the printer is designed for special paper having a different grammage. In this latter case, the special paper shall be used. The quantity of paper available for printing shall be as close as possible to the maximum capacity of the printer. The form width shall be the widest that is commonly available for the printer and shall be described in the test report. For special applications (e.g. when the material to be printed is a passbook or cheque) the material shall be typical for customer usage and shall be described in the test report.
If in typical use, multi-part stationery is employed, an additional test with such stationery shall be carried out and described in the test report.
Paper storage and unpacking shall be carried out in accordance with the machine manufacturer's instructions. If there are no such instructions, paper shall have been stored unpacked and exposed to the environmental conditions specified in 6.3.2, 7.3.2 or 8.3.2 as applicable, for at least 24 h immediately prior to the test.
C.4.3 Operation
C.4.3.1 Idle mode
The power shall be switched on and paper shall be inserted.

58 © Ecma International 2018
NOTE If the teleprinter has both standby and ready modes, the idle mode corresponds to the standby mode.
C.4.3.2 Operating mode (Print mode)
For keyboard operation of the teleprinter, the operating conditions specified for keyboards shall apply (see C.5).
For automatic operation of the teleprinter, the operating conditions specified for printers shall apply (see C.3).
C.4.4 Measurement time interval
The time-averaged sound pressure level shall be measured for at least the measurement time interval specified in 6.7.2, 7.7.2 or 8.7.2 as applicable.
For keyboard operation of the teleprinter, the requirements specified for typewriters shall apply (see C.2.4).
For automatic operation of the teleprinter, the requirements specified for printers shall apply (see C.3.4).
C.5 Equipment category: Keyboards
C.5.1 Description
This category covers equipment for manual data entry fixed or connected (via a cable or other data transmission means) to other units, e.g. visual display units, computer console, hand-held calculator, etc.
C.5.2 Installation
Keyboards shall be installed in accordance with the relevant clauses of this Standard, except for measurements in accordance with Clause 6 or Clause 7. The keyboard may be placed in the centre of the top plane of the standard test table if required for operation, provided this is reported.
C.5.3 Operation
C.5.3.1 Operating mode (keying-in)
Keying-in shall be performed at a rate of five characters per second.
A suitable robot (see A.2) should be used to simulate manual keystrokes. The noise level due to the operation of the robot alone shall be at least 6 dB and preferably more than 10 dB below the level of operation.
If the keyboard has acoustical feedback, the minimum volume setting shall be used for the test.
NOTE If a typing robot is not available, manual keying-in may be used.
C.5.3.2 Test pattern
a) For alphanumeric keyboards, the test pattern shall be as specified for typewriters (see C.2.3.2.3).
b) For numeric keyboards, the test pattern shall be four digits plus function key, the keys selected shall be
reported.

© Ecma International 2018 59
C.5.4 Measurement time interval
The time-averaged sound pressure level shall be measured for at least the measurement time interval specified in 6.7.2, 7.7.2 or 8.7.2 as applicable; the requirements specified for typewriters shall apply (C.2.4).
C.5.5 Measurement uncertainty
The measurement uncertainty for determining noise emission levels for keyboard operation has not yet been verified and may be greater than those given in 6.2, 7.2 and 8.2.
C.6 Equipment category: Copiers (duplicators)
C.6.1 Description
This category covers equipment which can produce one or more copies from a master. Such equipment can be coupled with one or more additional attachments and features. These may be in the form of input, output or internal devices for a variety of copying needs. Input devices can be in the form of master document loading, handling and registering, or special paper feeders for continuous stationery or label printing. Output devices can be in the form of copy handlers such as sorters, automatic staplers, stackers and binders. The equipment may have an internal reversing device(s) for handling two-sided originals and producing two-sided copies; i.e. automatic duplexing. The copier may also offer full colour copying from full colour masters, or highlight colour copying.
For equipment which offers print and any one or more of the following functions, follow the procedures in C.21 instead of the procedures in C.6:
scan
copy
facsimile
C.6.2 Installation
C.6.2.1 General
Due to the nature of product operation, noise emitted by the copier in operating mode(s) may fluctuate significantly with time. Therefore, for this category of equipment, sound power level determination in accordance with Clause 6 (reverberation test room) may have restrictions to achieve reliable test results: only sound power level of repeated, or cyclic operations will be determined with the uncertainty stated, and a measurement time interval longer than that in free field over a reflecting plane may be required.
Floor-standing copiers shall be installed on the hard reflecting floor.
Copiers which are normally placed on a special stand or table shall be installed on such a stand or table on the reflecting floor. Copiers which are placed on a normal office table or desk and which take paper from, or stack paper on, the floor, shall, if possible, be placed in the centre of the standard test table, using the floor to support the paper. For such measurements in accordance with Clause 7, the measurement surface terminates on the reflecting floor.
Table-top copiers, which do not use the floor for the paper supply or exit stack, shall be placed on the hard reflecting floor for measurements in accordance with Clause 6 or Clause 7, and on the standard test table for measurements in accordance with Clause 8.

60 © Ecma International 2018
The same installation conditions shall be followed when the copier has attachments.
C.6.2.2 Paper
Either single sheets of paper of grammage 60 g/m2 to 80 g/m2 or continuous, folded or rolled stationery of grammage 50 g/m2 to 60 g/m2 shall be used, unless the copier is designed for special paper having a different grammage. In this latter case, the special paper shall be used. The quantity of paper available for copying shall be as close as possible to the maximum capacity of the copier. The form width shall be the widest that is commonly available for the copier and shall be described in the test report. For special applications (e.g. when the material to be printed is a passbook or cheque) the material shall be typical for customer usage and shall be described in the test report.
Paper storage and unpacking shall be carried out in accordance with the machine manufacturer's instructions. If there are no such instructions, paper shall have been stored unpacked and exposed to the environmental conditions specified in 6.3.2, 7.3.2 or 8.3.2 as applicable, for at least 24 h immediately prior to the test.
C.6.3 Operation
C.6.3.1 Idle mode
Power shall be switched on and the copier shall be loaded with a suitable paper supply.
C.6.3.2 Operating mode
C.6.3.2.1 General
The nominal speed for which the copier has been designed shall be used; if several speeds are provided, the one which is typical for the majority of the uses shall be employed. The copier shall be adjusted to normal exposure, and tests shall be carried out without using any reduction/enlargement facility, if provided.
Additional machine set-up conditions may be considered, as follows.
a) Copying without additional attachments
An operation cycle shall consist of continuously copying a single master.
b) Copying with additional attachments: input and output devices
When a copying system combines several features/attachments, a "full system" operation cycle shall comprise the use of the maximum number of features/attachments allowable at least once. This may include using all the features/attachments on the copier or just some of them. Where all the features/attachments cannot be used together in one operation cycle, several different operating combinations should be considered. The combination which is typical of use shall be selected and described in the test report.
C.6.3.2.2 Input devices
a) Automatic loading of originals
An operation cycle shall consist of placing five masters in the device input tray and making five copies of each master. Copies are ejected into a single stationery output tray.
b) Copying from continuous stationery

© Ecma International 2018 61
An operation cycle shall consist of feeding five pages of continuous stationery through the registering device and making five copies of each master. Copies are ejected into a single stationery output tray.
C.6.3.2.3 Output devices
a) Sorting
The operation shall start with an empty sorter. An operation cycle shall comprise the registering of one master and making five copies ejected into five consecutive sorter bins. (Any copies made during additional operation cycles shall be sorted into the same five consecutive bins.)
b) Stacking
If the copier is equipped with an integral mechanism to separate copy sets generated sequentially, it will generally be fitted with an input master loading device. The operation cycle shall comprise the placing of five originals into the device input tray and one copy of each shall be ejected into the stacker.
c) Automatic stapling
Automatic stapling may be provided in the form of a separate output device, or being fitted as integral to a sorter or stacker. Copiers equipped with this device will generally be fitted with an input master loading device. The operation cycle shall comprise the stapling of a set of copies from five masters for a total of five stapled sets, and ejected into the output tray.
d) Copying on continuous stationery
An operation cycle shall comprise copying one master on five pages for folded stationery or a 2-m length for rolled stationery.
e) Auxiliary equipment
If a copier is supplied with an accessory or integral equipment (e.g. a binder), the tests shall be carried out with and without the use of this equipment in the operation cycle.
f) Two-sided copying
Copiers equipped with this feature can either
1) handle two-sided masters and produce from them one-sided or two-sided copies, or
2) handle one-sided masters only, and produce from them one-sided or two-sided copies.
Copiers equipped with this device will generally be fitted with an input master loading device.
An operation cycle for type 1) above shall comprise the making of two one-sided copies (one of each of the sides of the master) or one two-sided copy from one two-sided master. This operation cycle is to be repeated five times. An operation cycle for type 2) above shall comprise the making of one two-sided copy from two one-sided masters, this operation cycle is to be repeated five times.
g) Colour copying
The operation cycle for copiers fitted with this feature shall be the copying from one one-sided full colour master; one copy is made and automatically ejected into a single stationery output tray.
h) Highlight-colour copying

62 © Ecma International 2018
The operation cycle for copiers fitted with this feature shall be as for monochrome. (Copies should contain highlight-colour from a full text master, e.g. four lines in highlight-colour using the test pattern as specified in C.3).
C.6.4 Measurement time interval
The time-averaged sound pressure level shall be measured for at least five operation cycles and for at least the measurement time interval specified in 6.7.2, 7.7.2 or 8.7.2 as applicable.
C.7 Equipment category: Card readers and card punches
C.7.1 Description
The category covers equipment which may perform a single function, such as reading the information from, or punching it into, a punched card. The two functions may also be combined in one machine which allows the use of both functions in one process or to use them separately. The number of cards processed per unit time depends for readers mainly on the nominal processing speed; for punches it may be significantly influenced by the total number of columns to be punched per card.
For equipment which performs similar functions such as card duplicating machines, card verifiers, card or document sorters and collators, code interpreters (with printing features), paper tape readers and punches, the following installation and operating conditions may also be applied.
C.7.2 Installation
The equipment shall be installed in accordance with the relevant clauses of this Standard.
C.7.3 Operation
C.7.3.1 Idle mode
The power shall be switched on and the equipment shall be ready for reading or punching cards.
C.7.3.2 Operating mode (Reading or punching mode)
If equipment of this category is capable of both reading and punching in one process, the operating mode shall consist of both punching and reading cards as specified below. If equipment allows only the use of these functions separately, the operating mode shall be punching.
The specified character pattern shall be read from, or punched into and/or read from, each card; approximately 40 % of the maximum number of columns (usually 80) shall contain information. The specified character pattern shall be arranged in groups of five characters followed by five spaces:
J1YY7 2DA90 8S8=2 6AI8Q B31AJ 5FTOE PG1TK X6D-4
C.7.4 Measurement time interval
The time-averaged sound pressure level shall be measured for at least the measurement time interval specified in 6.7.2, 7.7.2 or 8.7.2 as applicable during processing of a random card deck of at least 10 cards.

© Ecma International 2018 63
C.8 Equipment category: Magnetic tape units
C.8.1 Description
This category covers equipment for writing on, and reading from, a magnetic tape wound on reels or within a cassette or a cartridge. A unit may contain one or more separately operable tape drives.
C.8.2 Installation
Installation shall be in accordance with the relevant clauses of this Standard.
C.8.3 Operation
C.8.3.1 Idle mode
C.8.3.1.1 Idle unloaded mode
The power shall be switched on and the tape shall not be in the tape path.
C.8.3.1.2 Idle loaded mode
The power shall be switched on and the tape shall be loaded and the equipment shall be ready to receive and respond to control line commands to any drive. In multiple drive units, all drives shall be loaded and ready.
C.8.3.2 Operating modes
C.8.3.2.1 General
One of the modes specified below shall be used as applicable.
In multiple drive units, only one drive shall be in operating mode; all other drives shall be in the idle loaded mode.
C.8.3.2.2 Read/Write mode
Start, read or write, stop — with command timing for capstan (or equivalent) operation as follows.
Capstan on-time, in milliseconds, is set at the time needed to pass 130 mm of tape at the rated tape speed, s, defined as
mssm
mm130
s
rounded to the nearest millisecond.
The off-time is equal to 0,7 to 1 times the on-time.
NOTE For a magnetic tape of 12,7 mm width, 130 mm of tape corresponds to a block length of 4 096 bytes at 32 bpmm. Higher densities should use correspondingly larger block sizes, such that the total on-time for all density
machines will be approximately equal. At 63 bpmm, use a block length of 8 192 bytes; at 246 bpmm, use a block of 32 768 bytes.

64 © Ecma International 2018
C.8.3.2.3 Streaming mode
Logical forward run while writing.
C.8.4 Measurement time interval
The time-averaged sound pressure level shall be measured, for at least the measurement time interval specified in 6.7.2, 7.7.2 or 8.7.2 as applicable, for at least twenty consecutive start/stop operations in accordance with C.8.3.2.2 or streaming operations in accordance with C.8.3.2.3.
C.9 Equipment category: Disk units and storage subsystems
C.9.1 Description
This category covers equipment for writing on, and reading from, one or more rotating magnetic or optical disks. Disks may be removable or non-removable. Magnetic disks may be flexible or rigid. A unit may contain one or more separately operable disk drives.
NOTE For read-only optical disk drives (e.g. CD- and DVD-ROM drives), see C.19.
C.9.2 Installation
Installation shall be in accordance with 5.1 and 8.5. Disk units which form part of a personal computer, rack-mounted equipment, or hand-held computing and media playback device shall be tested in accordance with C.15, C.18 or C.22 as appropriate. Disk units which are tested as sub-assemblies shall be installed as sub-assemblies in accordance with 5.1.7.
C.9.3 Operation
C.9.3.1 Idle mode
C.9.3.1.1 Idle ready
Disk(s) shall be loaded, power on, unit ready to receive and respond to control link commands with spindle up to speed and read/write heads in track-following mode.
For systems having a single drive, the drive shall be as described above. For systems with multiple drives or for storage subsystems, the number of drives that are simultaneously operable by the host CPU shall be operated as specified above. All other drives shall be in the idle mode typical of normal use for the system.
C.9.3.1.2 Idle standby
If power-saving modes are available, such modes may be tested and if tested shall be described in the report.
C.9.3.2 Operating mode
For units having a single drive, the drive shall be operating as described below.
For units with multiple drives, or for storage subsystems, the number of drives that are simultaneously operable by the host CPU shall be operated as specified below. All other drives shall be in the idle mode, typical of normal use for the system.

© Ecma International 2018 65
Randomly select a cylinder/track to be sought in such a way that every cylinder/track has equal probability of being selected. (If the drive incorporates an algorithm to perform seeks in a more efficient non-random order, then this algorithm may be used. In this case the drive should be given a command or commands to read or write a random selection of files, and the drive algorithm will decide the order in which the commands are executed. The file length shall be adjusted to achieve the seek rate defined below). Seek to that track, then
delay for a time period tD achieving the required seek rate ns within 10 % in accordance with the following formula:
ns = 0,4 / (tT + tL)
tD = 1,5 tT + 2,5 tL
where
ns is the average seek rate, expressed in seeks per second;
tT is the manufacturer's published time, in seconds, to seek from one random track to another without including rotational latency;
tL is the time, in seconds, for the drive to rotate by half a revolution.
Repeat the seek process. No other intentional delay while selecting the cylinder is allowed. The average number of seeks per second along with the seek algorithm shall be reported with the acoustical data.
If the drive is operating in a system and if the system is not capable of achieving the required seek rate, the drive shall be operated at the maximum seek rate achievable.
If the drive is operating in a multiple drive system in a Redundant Array of Inexpensive Disks (RAID) environment, the drive shall be operated at the maximum seek rate achievable compatible with the system RAID level in use.
C.9.4 Measurement time interval
The time-averaged sound pressure level shall be measured for at least the measurement time interval specified in 6.7.2, 7.7.2 or 8.7.2 as applicable.
NOTE Acoustical “beating” in multi-drive arrays can occur over periods of time that are long relative to the
requirements of 6.7.2, 7.7.2 or 8.7.2. The resulting variation in sound pressure level at microphone positions can have a significant effect on the variability of A-weighted sound power level determined for the equipment. This variability can be
reduced by increasing the measurement time to include several beating cycles.
C.10 Equipment category: Visual display units and terminals
C.10.1 Description
This category covers equipment which displays information on a screen, and which may be equipped with a keyboard for information entry. The keyboard may be fixed to the display unit or connected to it by means of a cable or other means of data transmission.
The units in this category may emit significant noise in the 16 kHz octave band. For equipment which emits sound in the 16 kHz octave band, the procedures specified in ECMA-108 for reporting sound power levels shall be used (see Table 4).

66 © Ecma International 2018
C.10.2 Installation
Installation shall be in accordance with the relevant clauses of this Standard.
C.10.3 Operation
C.10.3.1 Idle mode
The power shall be switched on and the equipment shall be in a steady-state condition, with air-moving device(s), if any, running and the representative pattern shall be displayed on the screen. The keyboard shall not be operated.
Preliminary tests should be run to determine if the emissions are significantly sensitive to the pattern displayed on the screen. If so, a pattern representative of maximum emission values for a typical user shall be determined. If not, the representative pattern shall be defined to be a full character set displayed on the screen and repeated until all positions on the screen are used. The representative pattern used shall be documented and reported.
C.10.3.2 Operating mode (Typing mode), if applicable
The typing mode consists of keying-in the information specified for keyboards (see C.5).
C.10.3.3 Power saving mode
If power saving modes are available, such modes may be tested in addition to the modes defined in C.10.3.1, described and reported.
C.10.4 Measurement time interval
The time-averaged sound pressure level shall be measured for at least the measurement time interval specified in 6.7.2, 7.7.2 or 8.7.2 as applicable.
C.11 Equipment category: Electronic units
C.11.1 Description
This category covers equipment such as processors, electronic memories and controllers, containing only electronic circuits, power supplies but no moving mechanical parts except those associated with cooling.
C.11.2 Installation
Installation shall be in accordance with the relevant clauses of this Standard.
C.11.3 Operation
C.11.3.1 Operating mode
Operate in the steady-state condition with normal load on all cooling devices, power supplies, and distributed power supply elements. For electronic units, the idle and operating modes are deemed to be the same.

© Ecma International 2018 67
C.11.3.2 Power saving mode
If power saving modes are available, such modes may be tested in addition to the modes defined in C.11.3.1, described and reported.
C.11.4 Measurement time interval
The time-averaged sound pressure level shall be measured for at least the measurement time interval specified in 6.7.2, 7.7.2 or 8.7.2 as applicable.
C.12 Equipment category: Microform readers
C.12.1 Description
This category covers equipment to display micro-images. Microform readers may differ from each other, depending on the different types of microforms to be used, such as microfiche, aperture cards and rollfilm.
C.12.2 Installation
Installation shall be in accordance with the relevant clauses of this Standard.
C.12.3 Operation
C.12.3.1 Idle mode
The power shall be switched on and the equipment shall be ready to display.
C.12.3.2 Operating mode
The microform shall be inserted and the micro-image adjusted and displayed.
The following two operations may be performed with partial or full automation.
a) Equipment for microfiche and aperture cards: the micro-image shall be adjusted in two diagonal corners
by moving its support; an image shall be kept stationary.
b) Equipment for rollfilm with a full reel of microfilm loaded into the device: the image approximately in the
middle of the film shall be sought and adjusted; the rollfilm shall be transported automatically.
The operation used during the test shall be described in the test report.
C.12.4 Measurement time interval
The time-averaged sound pressure level shall be measured for a minimum of three operation cycles and for at least the measurement time interval specified in 6.7.2, 7.7.2 or 8.7.2 as applicable.

68 © Ecma International 2018
C.13 Equipment category: Facsimile machines (telecopiers) and page scanners
C.13.1 Description
C.13.1.1 Facsimile machines
This category covers equipment operating as a send/receive machine, basically comprising a numeric keyboard, a paper feeding device, a scanner, a print unit and an electronic send/receive control unit. Telecopiers are used for transmitting text, drawings and graphic information via public transmission networks.
C.13.1.2 Page scanners
This category covers equipment operating as a scanner which detects text, drawing and graphical information from full sheets of paper and comprises a paper feeding device and a scanning mechanism.
For equipment capable of print and any one or more of the following functions, follow the procedures in C.21 instead of the procedures in C.13:
scan
copy
facsimile
C.13.2 Installation
C.13.2.1 General
Floor-standing machines shall be installed on the hard reflecting floor.
Machines which are normally placed on a special stand shall be installed on such a stand on the reflecting floor. Machines which are placed on an office table or desk and which take paper from, or stack paper on, the floor, shall, if possible, be placed in the centre of the top plane of the standard test table, using the floor to support the paper. For such measurements in accordance with Clause 7, the measurement surface terminates on the reflecting floor.
Table-top machines, which do not use the floor for the paper supply or exit stack, shall be placed on the hard reflecting floor for measurements in accordance with Clause 6 or Clause 7, and on the standard test table for measurements in accordance with Clause 8.
C.13.2.2 Paper
For sheet stationery operations, sheet stationery of grammage 60 g/m2 to 80 g/m2 shall be used in accordance with machine manufacturer’s instructions. A4 sheets shall be used whenever possible; otherwise, a sheet size characteristic of typical use shall be used.
For continuous stationery operations, continuous folded or rolled stationery of grammage 50 g/m2 to 60 g/m2 characteristic of typical use shall be used in accordance with machine manufacturer’s instructions.
Paper storage and unpacking shall follow the machine manufacturer's instructions. If there are no such instructions, paper shall be unpacked and exposed to the environmental conditions specified in 6.3.2, 7.3.2 or 8.3.2 as applicable, for at least 24 h immediately prior to the test.
The paper tray shall be filled as close as possible to its maximum capacity.

© Ecma International 2018 69
C.13.3 Operation
C.13.3.1 Idle mode
Idle mode is a steady state condition that occurs after completion of sending, receiving or scanning. Facsimile machines and page scanners may have several idle modes, each with unique noise and duration, for example, step-down or variable speed cooling fan operation.
Idle noise shall be measured after send, receive or scan job completion with the power switch of the machine remaining on. The idle mode lasting at least one minute with highest noise emissions shall be measured and reported.
The measurement time interval of idle noise measurement shall be in accordance with C.13.4.
C.13.3.2 Operating modes
C.13.3.2.1 General
Machines shall be operated in monochrome mode using the pattern of Figure C.5b. Colour capable machines shall additionally be operated in colour mode using the same pattern.
NOTE The pattern in Figure C.5b is based on JBMS-74-1:2005[14]. Figure C.5a, present in the 10th and 11th editions,
was eliminated in the 12th edition.
The default resolution and the default speed shall be used for all functions, whether monochrome or colour.
Operation of facsimile machine or page scanner shall begin after warm-up periods have expired and all moving parts are located in their home position.
C.13.3.2.2 Operating modes
Send and receive operations shall be measured and reported for facsimile machines. Printing of transmission receipts shall be included if such printing is the default for send operation. Scan operation shall be measured for page scanners.
C.13.3.2.3 Single sheet machines
One-sided sheet operation shall be measured unless two-sided operation is the default, in which case two-sided operation shall be measured.
C.13.3.2.4 Continuous folded or rolled stationery machines
One-sided operation shall be measured. A page shall consist of the test pattern of Figure C.5b scaled to fit to the maximum printable or scannable area of the machine, as appropriate to the operation.
C.13.4 Measurement time interval
The time-averaged sound pressure level shall be measured for at least the measurement time interval specified in 6.7.2, 7.7.2 or 8.7.2 as applicable.
Single-sheet machines (equipped with feeding device): at least three (3) sheets
Continuous folded or rolled stationery machines: at least one (1) page

70 © Ecma International 2018
These measurement time intervals are applicable to both send and receive operations of facsimile machines and scan operations of page scanners.
C.13.5 Reporting
Noise emissions of idle and default operations shall be reported. Noise emissions of operations other than the default operations may be reported. The description “idle” shall accompany noise emissions reported for idle. The following shall accompany the noise emissions reported for operations other than idle:
Operation: “scan”, " facsimile send", “facsimile receive”
Rendering: “mono” or “colour”
Quality: “best”, “normal”, “draft”, etc.
Sidedness: "simplex" or "duplex"
Input method: "ADF" or “flatbed”
Media: format (“folded”, “rolled” or “sheet”), “paper size” and “grammage”
C.14 Equipment category: Cheque processors
C.14.1 Description
The category covers equipment which may perform a single function such as printing (or encoding) information onto cheques, reading information from cheques, printing lists, storing/retrieving information from a flexible disk cartridge, or sorting cheques.
C.14.2 Installation
C.14.2.1 General
The equipment shall be installed in accordance with the relevant clauses of this Standard.
C.14.2.2 Paper
C.14.2.2.1 Cheque stock
Typically, a large variety of cheque sizes and grammage of paper are used. To allow a standard method, the following specification defines the properties of the cheques to be used.
a) Length: 140 mm to 160 mm.
b) Height: 70 mm to 90 mm.
c) Grammage: 90 g/m2 to 100 g/m2.
C.14.2.2.2 Printer paper
If in typical use, multiple-part stationery is employed, an additional test with such stationery shall be performed and reported.

© Ecma International 2018 71
C.14.3 Operation
C.14.3.1 Idle mode
The power shall be switched on and the equipment ready for use (i.e. stand-by mode).
C.14.3.2 Operating mode
When a cheque-processing system combines several features, a full system operation cycle shall comprise the use of each of those features at least once as described below under their respective operation cycle.
a) Reading
Random alpha-numeric data shall be read from the cheques in this mode and any additional operations which typically form part or are a result of this mode shall be performed (e.g. autofeed, listing, storing on flexible disk cartridge and sorting cheques). Repeated read cycles shall be performed at a rate typical of that expected in use.
b) Printing (or encoding)
Equipment of the type described in this category will in some cases contain a number of print mechanisms within one piece of equipment. The equipment shall be operated in a manner most typical of the expected use, with all print mechanisms operating in the proper sequence. Any additional operation which typically form part or result from this mode of operation shall be performed (e.g. autofeed, listing, storing on flexible disk cartridge and sorting cheques). The information to be printed by each type of printing mechanism (where appropriate) is defined in Table C.3.
Repeated print cycle shall be performed at a rate typical of that expected in use.
c) Printing (listing)
Repeated cycles of the character pattern shown below shall be printed at a rate typical of that expected in use. The full content of a 40-character pattern is given; if the line contains fewer characters, the left-most ones shall be used.
The characters shall be arranged in groups of five followed by five spaces and each subsequent line shall be rotated five spaces to the right.
J1YY7 2DA90 8S8=2 6AI8Q B31AJ 5FTOE PG1TK X6D-4
Any additional operations which typically form part or are a result of this mode shall be performed.
d) Storing/retrieving from disk
Consecutive seeks shall be carried out to a random track. Any additional operations which typically form part or are a result of this mode shall be performed.
e) Sorting
The cheques shall be sorted sequentially from the lowest numbered pocket to the highest numbered pocket and this sort pattern repeated as necessary for the measurement time interval.

72 © Ecma International 2018
Table C.3 — Cheque processor printer types and corresponding print patterns
Printer type
Characters to be printed Print details
Encoder *0000000085124* (amount field only)
Programmable endorser J1YY7 2DA90 8S8=2 6AI8Q
Fixed endorser any character
C.14.4 Measurement time interval
The time-averaged sound pressure level shall be measured for at least the measurement time interval specified in 6.7.2, 7.7.2 or 8.7.2 as applicable. For the operating mode, the measurement time interval shall be at least that of eight complete operation cycles.
C.15 Equipment category: Personal computers and workstations
C.15.1 Description
This category covers small systems such as personal computers, workstations and word processors, which include a keyboard, visual display unit, and a processor unit which itself may contain combinations of one or more flexible, rigid and/or optical disk drives, magnetic tape units or printers.
For equipment which emits sound in the 16 kHz octave band, the procedures specified in ECMA-108 for sound power levels shall be used (see Table 4).
C.15.2 Installation
The constituent units of the system may be tested individually and reported accordingly. In this case the installation conditions are as in 5.1, 8.5 and the relevant clauses of this annex.
Alternatively the equipment may be tested as a complete system. In this case for the measurement of sound power levels, the equipment shall be mounted on the hard reflecting floor and the setup used recorded.
For the measurement of emission sound pressure levels at operator position, the separate enclosures which comprise the system shall be arranged in a set-up that is typical of actual use. Solely table-top systems shall be installed on the standard test table with all equipment front faces parallel to the front edge of the table. A “flat” table-top system (i.e. the system’s width is greater than its height) shall be centred left to right on the test table (Figure C.4a).
A small tower table-top system (system’s height is greater than its width) shall be placed 0,05 m from the right edge of the test table (Figure C.4b). If a monitor is placed on the table alongside the small tower, then a gap of 0,05 m shall be left between the monitor and the small tower. The keyboard shall be 0,05 m from the front edge of the table. If the system has a detachable keyboard, the system shall be 0,30 m from the front edge of the table. The operator position microphone then is 0,25 m in front of the keyboard or 0,50 m from a system with a detachable keyboard in accordance with 8.6.1.
Notebook computers shall be centred left to right on the test table and placed 0,05 m from the front edge of the test table. It is recommended that the screens of notebook computers be adjusted to be perpendicular to an imaginary line passing from the microphone at the operator’s position to the centre of the screen.

© Ecma International 2018 73
If parts of the system are floor-standing and others are table-top, the floor-standing equipment shall be installed on the floor to the operator’s right of the test table and oriented such that the front face of the equipment is parallel to the front edge of the table and even with the table and in the same vertical plane (Figure C.4c). Equipment adjacent to the table shall be spaced 0,075 m away from the vertical plane formed by the edge of the top of the table. The table-top equipment shall be installed on the test table with all front faces parallel to the front edge of the table. For non-parallelepiped equipment, the orientation shall represent typical use and shall be documented in detail. If the processor is tested individually without the presence of keyboard or monitor, the processor shall be installed in accordance with this paragraph and Figure C.4a, C.4b, or C.4c.
All-in-one systems, where the display, processor, and storage functions are contained within a single unit, shall be placed on the test table in accordance with Figure C.4c and Figure C.4d; in the case of Figure C.4c, the all-in-one system shall be placed at the monitor position. The screen of an all-in-one system shall be aligned according to Figure C.4d or as close thereto as allowed by the design of the unit. The distance to the operator position shall be measured from the farthest forward portion of the system when the screen is aligned according to Figure C.4d.
0,2
5m
0,5
m
0,0
5m
Test tableCentre line
0,3
m
operator position
Monitor
Keyboard
Desktop
processor
Microphone at
X
Figure C.4a — Installation for system comprising “flat” table-top equipment

74 © Ecma International 2018
0,3
m
0,05m
0,05m0,5
m
0,2
5m
0,0
5m
Microphone at
operator position
Keyboard
Monitor
Test table
Centre line
Sm
all
tow
er
Figure C.4b — Installation for a small tower table-top system
0,2
5m
0,5
m
0,0
5m
Test tableCentre line
0,3
m
0,075m
operator position
Monitor
Keyboard
pro
ce
sso
r F
loo
r sta
nd
ing
Microphone at
X
Figure C.4c — Installation for a floor standing system or all-in-one system (at the monitor location)

© Ecma International 2018 75
P3
0,25 m
0,50 m
10° ± 3°
Figure C.4d — Screen angle for all-in-one system
C.15.3 Operation
C.15.3.1 General
Operation of the equipment shall be in accordance with 5.3 and 8.5 for the following modes of operation.
C.15.3.2 Idle mode
Power shall be switched on, the equipment shall be in a steady-state condition, with air-moving device(s) running, disk drives in the idle mode, the user has logged in with, the screen displayed in its default settings and all other devices idling.
If power saving modes are available, such modes may be tested in addition to the above idle mode, and shall be described in the test report.
C.15.3.3 Operating mode(s)
The operating modes for the equipment covered by C.15.1 are defined as follows. One or more of the following operating modes shall be used where applicable. Noise due to keyboard operation shall not be included.
a) For equipment with flexible disk drives as specified in C.9.
b) For equipment with rigid disk drives as specified in C.9.
c) For combinations of rigid and flexible disk drives, the operating mode is defined as one rigid disk drive
operating and all other drives idle as specified in C.9.
d) For equipment with magnetic tape units as specified in C.8.

76 © Ecma International 2018
e) For equipment with built-in character and line printers as specified in C.3; equipment with page printers as
specified in C.16.
f) For equipment with optical drives as specified in C.19.
g) For equipment with a central processing unit: the operating mode shall be the typical workloads described
below to best represent the noise levels that a majority of customers may encounter. The central
processing unit may include microprocessors, memory modules and add-in cards (for example, graphics
card), herein referred to as “subsystems” of the central processing unit. If operation of a particular
subsystem below does not result in an increase in fan speed(s) or an otherwise increase in noise level,
that subsystem does not need to be tested. Operating of each subsystem shall follow:
1) Microprocessors subsystems: Typical workload of all microprocessors shall be taken as half of the
maximum load using microprocessor centric performance testing applications. If multiple
microprocessors are included in a central processing unit, this typical workload shall be evenly
distributed across all microprocessors, as far as practical.
NOTE 1 If load-scalable microprocessor-centric performance testing applications, such as Specpower, MaxPower or
ThermNow are used, then the acoustic measurement should be done at the 50 % of the maximum load setting as specified above. However, if load non-scalable applications, such as Linpack and Prime95 are used, the manufacturer
may modulate the load between maximum and idle to approximate the 50% typical workload condition. Modulation should be adjusted such that a steady-state noise emission condition is measured.
2) Memory subsystem: A memory subsystem consists of all memory modules within the central
processing unit, whether installed on a motherboard, or via multiple riser cards. Typical workload for
the memory subsystem shall be taken as half of the attainable platform performance bandwidth of the
memory subsystem, with bandwidth equally distributed over all memory modules, as far as practical.
NOTE 2 Attainable platform performance bandwidth may be obtained by running a load-scalable memory performance
application at the maximum performance bandwidth setting. The acoustical testing should then be done at 50 % of this maximum performance bandwidth setting.
3) Add-in card subsystem: typical workload of add-in cards shall be taken as half of the maximum
performance as specified by the manufacturers of the card. If multiple cards from different vendors are
part of the central processing unit, each card shall be operated and reported separately.
4) Other identified subsystems: The workload for any other subsystem of the central processing unit not
described above shall be representative of the typical end-use workload for that subsystem and
clearly defined and documented in the report, if tested.
h) For equipment with other components not listed above, the operating mode shall be representative of
typical end-use operation for that component and clearly defined and documented in the report.
C.15.4 Measurement time interval
The time-averaged sound pressure level shall be measured for at least the measurement time interval specified in 6.7.2, 7.7.2 or 8.7.2 as applicable.
C.16 Equipment category: Page printers
C.16.1 Description
This category covers equipment which produces printed output from computers and includes but is not limited to inkjet and laser printers. Page printers usually are graphic capable, may be duplex capable, and may have peripheral equipment such as staplers, binders, cutters, envelope feeders, sorters, and special paper feeders.

© Ecma International 2018 77
For equipment capable of print and any one or more of the following functions, follow the procedures in C.21 instead of the procedures in C.16:
scan
copy
facsimile
C.16.2 Installation
C.16.2.1 General
Floor-standing printers shall be installed on the hard reflecting floor. Printers which are normally placed on a special stand or table shall be installed on such a stand or table on the reflecting floor. Printers which are placed on a normal table or desk and which take paper from, or stack paper on, the floor, shall, if possible, be placed in the centre of the top plane of the standard test table, using the floor to support the paper. For such measurements in accordance with Clause 7, the measurement surface terminates on the reflecting floor.
Table-top printers, which do not use the floor for the paper supply or exit stack, shall be placed on the hard reflecting floor for measurements in accordance with Clause 6 or Clause 7, and on the standard test table for measurements in accordance with Clause 8.
C.16.2.2 Paper
Sheet stationery of grammage 60 g/m2 to 80 g/m2 shall be used in accordance with machine manufacturer’s instructions. ISO A4 sheets shall be used whenever possible; otherwise, a sheet size characteristic of typical use shall be used.
Paper storage and unpacking shall follow the machine manufacturer's instructions. If there are no such instructions, paper shall be unpacked and exposed to the environmental conditions specified in 6.3.2, 7.3.2, or 8.3.2 as applicable, for at least 24 h immediately prior to the test.
The paper tray shall be filled as close as possible to its maximum capacity.
C.16.3 Operation
C.16.3.1 Idle mode
Idle mode is a steady state condition that occurs after completion of print operation. Page printers may have several idle modes, each with unique noise and duration, for example, step-down or variable speed cooling fan operation.
Idle noise shall be measured after print job completion with the power switch of the printer remaining on. The idle mode lasting at least one minute with highest noise emissions shall be measured and reported.
The measurement time interval of idle noise measurement shall be in accordance with C.16.4.
C.16.3.2 Operating mode (Print mode)
C.16.3.2.1 General
Printers shall be operated in monochrome using the pattern of Figure C.5b. Colour capable printers shall be operated in colour using the same pattern.

78 © Ecma International 2018
NOTE The pattern in Figure C.5b is based on JBMS-74-1:2005[14]. Figure C.5a, present in the 10th and 11th editions,
was eliminated in the 12th edition.
The nominal default resolution and the nominal default speed shall be used for all functions, whether monochrome or colour.
One-sided printing shall be measured unless two-sided printing is the default, in which case two-sided printing shall be measured.
C.16.3.2.2 Operation cycle with features
When a printing system combines several features, a full system operation cycle shall comprise the use of each of the features at least once as described under the respective operation cycle.
a) Sorter
The sorting operation shall start with an empty sorter. An operation cycle shall comprise the sorting of one page in one bin. Pages printed during additional cycles shall be sorted into consecutive bins.
b) Stacking
If the printer is equipped with an accessory or integral mechanism to separate jobs generated sequentially, an operation cycle shall comprise two jobs and print one page for each of them.
c) Auxiliary equipment
If the printer is supplied with auxiliary equipment (e.g. a mechanism for cutting continuous forms), the tests shall be carried out with and without the use of such equipment in the operation cycle.
C.16.4 Measurement time interval
For each set-up the time-averaged sound pressure level shall be measured, for at least the measurement time interval specified in 6.7.2, 7.7.2 or 8.7.2 as applicable, and as follows:
Single sheet printers: at least three sheets (three pages) for one-sided simplex printing; at least three
sheets (six pages) for two-sided duplex printing.
Printing with auxiliary features: at least one (1) sheet.
C.16.5 Reporting
Noise emissions of idle and default operations shall be reported. Noise emissions of operations other than the default operations may be reported. The description “idle” shall accompany noise emissions reported for idle. The following shall accompany the noise emissions reported for operations other than idle:
Operation: “print”
Rendering: “mono” or “colour”
Quality: “best”, “normal”, “draft”, etc.
Sidedness: "simplex" or "duplex"
Media: “paper size” and “grammage”
© Ecma International 2018 79
C.17 Equipment category: Self-service automatic teller machines
C.17.1 Description
The category covers equipment mainly used in banking environments and provides various services to customers, such as cash dispense, funds transfer between accounts, account balance inquiry, balance statement issuing and envelope deposit.
Depending on the purpose of the equipment, a variety of different functions can be performed and combined in one machine. Typical examples for operating modes are specified in C.17.3; it is not assumed that these conditions apply to all cases, therefore, the test conditions used shall be described in the test report.
C.17.2 Installation
The equipment shall be installed in accordance with the relevant clauses of this Standard.
C.17.3 Operation
C.17.3.1 Idle mode
The power shall be switched on and the equipment shall be ready for use.
C.17.3.2 Operating mode
The operating mode which is typical for average customer usage shall be defined and reported. For some equipment, examples are defined as follows:
a) Money dispenser
Operation comprises card insertion, key-in personal identification number (PIN), task selection (e.g. cash issue), selection of amount of money, issue card, open cash gate, issue cash, issue receipt and close cash gate.
b) Passbook operation
Operation comprises
insert passbook, read magnetic stripe data, key-in PIN, print one line in passbook, write and verify
magnetic stripe data and issue passbook, or
insert passbook, read magnetic stripe data, key-in PIN, task selection (e.g. cash issue), selection of
amount, write and verify magnetic stripe data, issue passbook and issue cash.
c) Banking information print-out
Operation comprises check card insertion, key-in PIN, task selection (e.g. statement of account), issue card, print output and issue output.
d) Cash envelope deposit
Operation comprises card insertion, key-in PIN, task selection (e.g. cash deposit), key-in amount of deposit, insert envelope into depository device, remove card and receipt.

80 © Ecma International 2018
C.17.4 Measurement time interval
The time-averaged sound pressure level shall be measured for at least the measurement time interval specified in 6.7.2, 7.7.2 or 8.7.2 as applicable. For the operating mode, an average value shall be determined for at least three typical transactions, during which manual access may be needed, which however shall not be intentionally delayed.
C.18 Equipment category: Rack-mountable units and rack-enclosed systems
C.18.1 Description
This category covers both rack-mountable units (see 3.1.12) and rack-enclosed systems (see 3.1.13).
For rack-enclosed systems that are available in more than one configuration of rack-mountable units, the particular configuration to be measured is usually governed by the purposes of the test and is thus not specified in this Standard. However, if the configuration has not been otherwise specified prior to the test, and if practical, it is recommended that a typical configuration be measured as a minimum, possibly supplemented by other identifiable configurations (e.g., minimum configuration or maximum configuration, or both). In any event, the configuration(s) of the system shall be described in the test report in sufficient detail to uniquely identify the unit under test.
C.18.2 Installation
In general, the requirements of 5.1.1 and 5.1.5 shall be met. Specific installation requirements are given below.
Rack-mountable units that are not designed for a specific rack-enclosed system (e.g., units that may be used in a variety of industry-standard racks) shall be tested outside of a rack and treated as “sub-assemblies” for the purposes of this Standard (see 3.1.11 and 5.1.7).
NOTE In addition to the above requirements, such units may optionally be tested installed in a rack in accordance with the following paragraphs.
Rack-mountable units that are designed as part of, or intended to be installed in, a specific rack-enclosed system shall be tested in that specific rack enclosure. The unit shall be installed as specified by the manufacturer or requestor of the test, including the vertical position in the rack enclosure. If no position is specified, the unit shall be mounted at approximately the same height as that required for sub-assemblies (see 5.1.7). If the specific rack enclosure is fully- or partially-enclosed, then all other positions in the rack shall either be filled with blank rack panels or populated with unpowered rack-mountable units. If the specific rack enclosure is of an open-frame design, then this is not required and the unit may be installed alone in the rack. Only the rack-mountable unit under test shall be powered on, and only the noise emission levels of this unit shall be reported, together with its position in the rack enclosure.
If the above rack-mountable unit requires power, cooling, or other facilities from other units in the rack enclosure for its operation, then one of the following approaches shall be used.
(i) The rack-mountable unit shall be measured along with the other units required for its operation and the results reported as the overall noise emission levels for the units taken together. The report shall describe the units that were tested together.
(ii) The rack-mountable unit shall be measured along with the other units required for its operation and the results reported as an upper bound for the noise emission levels for the particular unit under test (e.g., when the levels of the auxiliary units are much lower than the unit under test). The report shall describe the units that were tested together.

© Ecma International 2018 81
(iii) If practical, first the auxiliary units shall be measured together by themselves with the rack-mountable unit under test powered off, and second the measurement shall be repeated with the rack-mountable unit powered on. Appropriate computations (e.g., similar to the corrections for background noise in ISO 3741) shall be carried out to “subtract out” the noise level of the auxiliary units, and the results reported as an estimate for the noise emission levels for the particular unit under test. The report shall describe the units that were tested together and the procedure used to determine the estimated noise levels of the unit under test.
C.18.3 Operation
In general, the requirements of 5.3 shall be met. Specific operating requirements are given below for the following modes of operation.
C.18.3.1 Idle mode
The power shall be switched on, and all rack-mountable units shall be in idle mode ready to receive command signals from the system CPU.
C.18.3.2 Operating mode
The operating modes for the equipment covered by C.18.1 are defined as follows. One or more of the following operating modes shall be used as applicable:
For equipment with rigid and flexible disk drives as specified in C.9;
For equipment with magnetic tape units as specified in C.8;
For equipment with built-in character and line printers as specified in C.3; equipment with page printers as
specified in C.16;
For equipment with a central processing unit: the operating mode shall be the typical workloads described
below to best represent the noise levels that a majority of customers may encounter. The central
processing unit may include microprocessors, memory modules and add-in cards (for example, graphics
card), herein referred to as “subsystems” of the central processing unit. If operation of a particular
subsystem below does not result in an increase in fan speed(s) or an otherwise increase in noise level,
that subsystem does not need to be tested. Operating of each subsystem shall follow:
1) Microprocessors subsystems: Typical workload of all microprocessors shall be taken as half of the
maximum load using microprocessor centric performance testing applications. If multiple
microprocessors are included in a central processing unit, this typical workload shall be evenly
distributed across all microprocessors, as far as practical.
NOTE 1 If load-scalable microprocessor-centric performance testing applications, such as Specpower, MaxPower or ThermNow are used, then the acoustic measurement should be done at the 50 % of the maximum load setting as
specified above. However, if load non-scalable applications, such as Linpack and Prime95 are used, the manufacturer may modulate the load between maximum and idle to approximate the 50% typical workload condition. Modulation should
be adjusted such that a steady-state noise emission condition is measured.
2) Memory subsystem: A memory subsystem consists of all memory modules within the central
processing unit, whether installed on a motherboard, or via multiple riser cards. Typical workload
for the memory subsystem shall be taken as half of the attainable platform performance bandwidth
of the memory subsystem, with bandwidth equally distributed over all memory modules, as far as
practical.

82 © Ecma International 2018
NOTE 2 Attainable platform performance bandwidth may be obtained by running a load-scalable memory performance
application at the maximum performance bandwidth setting. The acoustical testing should then be done at 50 % of this maximum performance bandwidth setting.
3) Other identified subsystems: The workload for any other subsystem of the central processing unit
not described above shall be representative of the typical end-use workload for that subsystem
and clearly defined and documented in the report, if tested.
For equipment with other components not listed above, the operating mode shall be representative of
typical end-use operation for that component and clearly defined and documented in the report.
NOTE 3 Measurements on individual disk drives should be made at the seek rate typical of the multiple-drive configuration if system limitations do not allow the seek rate specified in C.9. This is necessary so as not to overestimate
the system noise emission levels as calculated in accordance with C.18.5 from individual measurements.
C.18.4 Measurement time interval
The time-averaged sound pressure level shall be measured for at least the measurement time interval specified in 6.7.2, 7.7.2 or 8.7.2 as applicable, and as further required in this annex for the operation of the rack-mountable units.
C.18.5 Calculation of the system A-weighted sound power level and system A-weighted emission sound pressure level from individual rack-mountable unit sound levels
The system A-weighted sound power level shall be calculated using the following formula:
dB10lg10
1sysA,
A1,0
n
i
WiWL
L
where
LWA,sys is the system A-weighted sound power level, in decibels;
LWAi is the A-weighted sound power level of the i-th rack-mountable unit installed in a rack enclosure;
n is the number of rack-mountable units.
The system A-weighted emission sound pressure level shall be calculated using the following formula:
dB10lg10
1sysA,
A1,0
n
i
pipL
L
where
LpA,sys is the system A-weighted emission sound pressure level, in decibels;
LpAi is the A-weighted emission sound pressure level of the i-th rack-mountable unit installed in a rack enclosure;
n is the number of rack-mountable units installed and tested.

© Ecma International 2018 83
NOTE The calculations in C.18.5 may be used by enclosures other than “rack enclosed systems”, such as, a server,
PC, or storage arrays. In this case the individual units are “sub-assemblies” instead of “individual rack-mountable units” in C.18.5.
C.18.6 Calculation of A-weighted sound power level and A-weighted emission sound pressure level for low noise level rack-mountable units
In some cases the noise level of rack-mountable units may be within 6 dB of the background noise level which would preclude an accurate value if measured individually. In this case enough identical rack-mountable units shall be tested and measured in the enclosure, so that the noise level of the n rack-mountable units is sufficiently greater than the background noise level (it may be convenient to test the maximum number allowed).
The rack-mountable unit A-weighted sound power level shall be calculated from the following formula:
LWA,s= LWA,sn 10 lg n dB
where
LWA,s is the averaged individual rack-mountable unit A-weighted sound power level, in decibels;
LWA,sn is the total A-weighted sound power level for n identical installed rack-mountable units, in decibels;
n is the number of rack-mountable units installed and tested.
The rack-mountable unit A-weighted emission sound pressure level shall be calculated from the following formula:
LpA,s = LpA,sn 10 lg n dB
where
LpA,s is the rack-mountable unit A-weighted emission sound pressure level, in decibels;
LpA,sn is the total A-weighted sound pressure level for n identical installed rack-mountable units, in decibels;
n is the number of rack-mountable units installed and tested.
NOTE The calculations in C.18.6 may be used by enclosures other than “rack enclosed systems”, such as, a server, PC, or storage arrays. In this case the individual units are “sub-assemblies” instead of “individual rack-mountable units” in
C.18.6.
C.19 Equipment category: CD-and DVD-ROM drives
C.19.1 Description
The category covers equipment for reading electronic information from a rotating read-only optical disk (for example, CD-ROM or DVD-ROM) or other optical media operated in a substantially sequential access manner.
84 © Ecma International 2018
C.19.2 Installation
C.19.2.1 General
Installation shall be in accordance with 5.1 and 8.5. A drive which forms part of a personal computer or rack mounted equipment shall be installed in accordance with C.15 or C.18 as appropriate. A drive which is tested as a sub-assembly shall be installed as a sub-assembly in accordance with 5.1.7.
C.19.2.2 Media
The unbalance Ud of test media, defined in the following formula, shall be 2,5 g·mm ± 10 %.
Ud = md · r
where
md is the mass of the disk, in grams (g),
r is the distance between the centre of gravity and the geometrical centre of the disk, in millimetres (mm)
NOTE 1 More detailed and specific information on the disk media is available in Reference [25]. Since (1) the measurement of unbalance is not an objective of this Standard, (2) test media satisfying this requirement is commercially
available from several sources2, and (3) it is not possible for most users of this Standard to adjust media to meet the criteria for unbalance, while they can only measure the value, it is recommended to use a dedicated test media which has
the unbalance specified above.
NOTE 2 This media unbalance requirement is based on several considerations as follows: C.1 requires that the
operation be “typical of average end use”. Conditions are to be “specified with a view to facilitate the operation of the
equipment and to enhance the reliability of the acoustical measurements”. The disk unbalance of 2,5 g-mm 10 % is
specified as “typical of average end use” and is also consistent with reliable acoustical measurements, since this degree of
unbalance avoids causing some drives to slow down. Technical details justifying this are contained in Reference [26].
C.19.3 Operation
C.19.3.1 Idle mode
Except for short-duration transients, idle modes are considered non-rotational and inaudible. Therefore measurement of the idle mode is not required.
In cases where the drive under test incorporates cooling assemblies for its normal operation, the cooling noise shall be measured as a part of noise of the drive.
C.19.3.2 Operating mode
For units having a single drive, the drive shall be operating as described below.
For units with multiple drives the number of drives that are simultaneously operable by the host CPU shall be operated as specified below. All other drives shall be in the idle mode, typical of normal use for the system.
2 For instance, Almedio, 2-32-13 Sakae-cho, Higashimurayama, Tokyo, Japan, offers such disks (http://www.almedio.co.jp).

© Ecma International 2018 85
Start sequential read at the inner radius of the disk (or media) such that the disk spins continuously at the fastest speed sustainable with the specified media. Repeat the above read process until the measurement time interval specified in C.19.4 elapses.
C.19.4 Measurement time interval
The time-average sound pressure level shall be measured for at least the measurement time interval specified in 6.7.2, 7.7.2 or 8.7.2 as applicable.
C.20 Equipment category: Data projectors
C.20.1 Descriptions
This category covers equipment driven by a computer input signal, for making an image projection, and by using a built-in light valve (see Definition C.1) or other technology.
This category does not cover equipment that is intended or designed for permanent outdoor installation.
The equipment may also have video input, but equipment having only video input is excluded.
Definition C.1 light valve
a sub-system or key component of a projector which builds up an optical image from that produced electrically within the image displaying element, by casting light from another light source
NOTE Still-projectors for film media (e.g. slide, OHP etc.) are covered by ISO 10996[26].
C.20.2 Installation
C.20.2.1 General
The equipment shall be installed in accordance with the relevant clauses of this Standard (i.e., 5.1 and 8.5 as applicable).
If the projector under test can make both front and rear screen projection (see Definitions C.2 and C.3), front screen projection configuration is applicable.
Definition C.2 front screen projection
image projected on the audience side of a light-reflecting screen
Definition C.3 rear screen projection
image projected through a light transmitting screen to the audience side of the screen
NOTE Definitions C.2 and C.3 above are consistent with those specified in IEC 61947-1:2002 and IEC 61947-2:2001,
respectively.

86 © Ecma International 2018
C.20.2.2 Warm up time
The equipment shall be operated for a sufficient period of time before proceeding with the acoustical test to allow the temperature to stabilize. If this time is unknown, the equipment shall be operated at least 30 min before the acoustical test.
C.20.2.3 Special considerations for test personnel safety
Due to the nature of these products, a data projector emits a strong light beam. Therefore, it is necessary to pay special attention to protect the test personnel’s eyes.
For the purposes of this Standard, it is strongly recommended to switch the lamp off while positioning the microphones.
C.20.3 Operation
C.20.3.1 General
For the operation of this category of equipment (including idle mode), the lamp on or off are expressions based on light valve technology. For projectors based on other technology, the corresponding operations are to be defined in a similar manner to those contained below.
C.20.3.2 Idle mode
A stable condition in which the equipment is powered, but the lamp is not on. Transient periods, such as that immediately after switching the lamp off, are excluded. For some projectors, operation during idle mode may not be possible in which case noise measurements are not required.
C.20.3.3 Operating mode
A stable condition in which the equipment is powered with the lamp on. For the purposes of this Standard, if the noise emissions are dependent upon the image projected, the equipment shall project the image of Figure A.1 of IEC 61947-1:2002 or of Figure A.1 of IEC 61947-2:2001, as applicable.
NOTE IEC 61947-1 and IEC 61947-2 are applicable to projectors with fixed and variable resolution respectively.
Transient periods, such as those immediately after switching the lamp on, are excluded.
C.20.4 Measurement time interval
The time-averaged sound pressure levels shall be measured for at least the measurement time interval specified in 6.7.2, 7.7.2 or 8.7.2 as applicable.
C.21 Equipment category: Multi-function devices (MFD)
C.21.1 Description
This category covers equipment capable of print and any one or more of copy, scan and facsimile functions defined in C.3, C.6, C.13 and C.16. MFD may be monochrome or colour capable, or both, and may be duplex capable. MFD may have an automatic document feeder (ADF) for loading masters and output devices such as stackers, sorters, staplers, binders and cutters, which are either included in the standard product configuration or are optionally purchased.

© Ecma International 2018 87
C.21.2 Installation
C.21.2.1 General
The MFD shall be installed in accordance with its standard product configuration. Optionally purchased peripheral devices are not considered to be part of the standard product configuration.
Floor-standing MFD shall be installed on the hard reflecting floor.
MFD which are normally placed on a special stand or table shall be installed on such a stand or table on the reflecting floor. MFD which are placed on a normal table or desk and which take paper from, or stack paper on, the floor, shall, if possible, be placed in the centre of the top plane of the standard test table, using the floor to support the paper. For such measurements in accordance with Clause 7, the measurement surface terminates on the reflecting floor.
Table-top MFD, which do not use the floor for the paper supply or exit stack, shall be placed on the hard reflecting floor for measurements in accordance with Clause 6 or Clause 7, and on the standard test table for measurements in accordance with Clause 8.
C.21.2.2 Paper
For sheet stationery operations, the paper of grammage 60 g/m2 to 80 g/m2 shall be selected in accordance with the machine manufacturer's instructions. ISO A4 sheets shall be used whenever possible; otherwise, a sheet size characteristic of typical use shall be used.
Paper storage and unpacking shall follow the machine manufacturer’s instructions. If there are no such instructions, paper shall be unpacked and exposed to the environmental conditions specified in 6.3.2, 7.3.2 or 8.3.2 as applicable, for at least 24 h immediately prior to the test.
The paper tray shall be filled as close as possible to its maximum capacity.
C.21.3 Operation
C.21.3.1 Idle mode
Idle mode is a steady state condition that occurs after completion of print or copy operation. MFD may have several idle modes, each with unique noise and duration, for example, step-down or variable speed cooling fan operation.
Idle noise shall be measured after print or copy job completion with the power switch of the MFD remaining on. The idle mode lasting at least one minute with highest noise emissions shall be measured and reported.
The measurement time interval of idle noise shall be in accordance with C.21.4.
C.21.3.2 Operating modes
C.21.3.2.1 General
MFD functions shall be operated in monochrome mode using the pattern of Figure C.5b. Colour capable MFD shall be operated in colour mode using the same pattern.
NOTE The pattern in Figure C.5b is based on JBMS-74-1:2005[14]. Figure C.5a, present in the 10th and 11th editions,
was eliminated in the 12th edition.

88 © Ecma International 2018
The nominal default resolution and the nominal default speed shall be used for all functions, whether monochrome or colour.
Operation of MFD shall begin after warm-up periods have expired and all moving parts are located in their home position.
C.21.3.2.2 Output devices
Standard output devices shall be included in the standard product configuration for measurement.
Output devices shall be empty at the start of the measured operation.
Standard output devices representative of typical use shall be operated. If several output devices are standard, the combination of output devices representative of typical use shall be used. Output devices are used as follows:
Binder (Stapler): An operation involves the binding (stapling) of a set of pages.
Sorter: An operation involves ejecting pages into consecutive sorter bins.
Stacker: An operation involves ejecting pages into a stacker.
C.21.3.2.3 Modes of operation
At least, mode a) shall be measured.
The remaining mode(s) are optional and may be measured at the discretion of the equipment manufacturer.
a) Print
One-sided printing shall be measured unless two-sided printing is the default mode, in which case two-sided printing shall be measured.
b) ADF copy
ADF copy shall be measured only if scanning and printing are simultaneous over some part of the copy operation. For ADF equipped MFD that simultaneously scan masters and print copies, the making of one-sided copies from one-sided masters shall be measured unless two-sided copying is the default, in which case default two-sided copying mode shall be measured. In either case, one copy shall be made for each master.
c) ADF scan
The ADF shall be operated while scanning. The registration of one-sided masters shall be measured unless two-sided registration is the default, in which case two-sided scanning shall be measured. The default scan resolution and the default electronic output format shall be used.
d) Flatbed copy
The making of a single one-sided copy from a single master involves placing a master on the flatbed of the MFD with cover closed against the master. The flatbed copy operation includes all events related to registration of the master and generation of a single copy, from start of registration to delivery of the copy.

© Ecma International 2018 89
e) Flatbed scan
The making of a single one-sided scan from a single master involves placing the master on the flatbed of the MFD with cover closed against the master. The flatbed scan operation includes all events related to registration of the master, from start to finish.
f) Miscellaneous operations
Various operations may be measured at the discretion of the test requestor. Examples include:
Alternative media, e.g. heavy paper, envelopes and transparencies
Duplex printing, copying and scanning
Standard output devices not representative of typical use
Optional (non-standard) output devices
Optional (non-standard) input devices like high capacity input trays
C.21.4 Measurement time interval
The time-averaged sound level shall be measured at least for the measurement time interval specified in 6.7.2, 7.7.2 or 8.7.2 as applicable for the modes of operation described in C.21.3, as follows.
Print, ADF copy, and ADF scan: at least three sheets (three pages) for one-sided simplex operations; at
least three sheets (six pages) for two-sided duplex operations.
Flatbed copy and Flatbed scan: at least one (1) sheet. When a flatbed operation involving one sheet does
not fulfill the measurement time interval, additional flatbed operations shall be measured such that the
sum of the durations of the individual operations fulfills the required measurement time interval. Flatbed
noise emission levels, L are computed as follows:
k
i
L
iiT
TL
1
1,0
tot
101
lg10
where
Ti and Li are the duration and noise emission level (sound power level or emission sound pressure level) of i-th individual flatbed copy operation,
k is the number of repeated flatbed operations (i = 1, 2, …k), which satisfies the measurement time interval requirement of 6.7.2, 7.7.2 or 8.7.2 as applicable,
Ttot is the total measurement time interval of repeated flatbed operations;
k
i
iTT1
tot .
Miscellaneous operations involving output devices: five (5) sets of “N” sheets, where “N” is at least three
and enough to fulfill the required measurement time interval.

90 © Ecma International 2018
C.21.5 Reporting
Noise emissions of the idle and default operations shall be reported. Noise emissions of operations other than the default operation may be reported. For the idle operation, only the operation description “idle” need be provided. For operations other than idle, the following information shall accompany the noise emissions:
Operation: “print”, “copy” or “scan”
Rendering: “mono” or “colour”
Quality: “best”, “normal”, “draft”, etc.
Sidedness: “simplex” or “duplex”
Input method: “ADF”, “flatbed”, “high-capacity”, etc.
Output devices: “binder”, “stapler”, “sorter”, “stacker”, etc.
Media: format (“folded”, “rolled” or “sheet”), “paper size” and “grammage”
b) Colour
(http://www.ecma-international.org/memento/Colour_%20pattern_FigC5b.pdf )
Figure C.5: — Monochrome/colour pattern for noise emission testing of MFD (not to scale)

© Ecma International 2018 91
C.22 Equipment category: Hand-held computing and media playback devices
C.22.1 Description
This category covers hand-held equipment for computing, office productivity software, internet browsing, digital media playback, and similar functions. Devices may run a general purpose operating system or be optimized solely for one or more of the functions listed above. Devices may be held in one or both hands during typical usage, and do not have a keyboard large enough for touch-typing.
Ultra-mobile PCs (UMPC), hand-held MP3 players, tablet or slate devices, and hand-held digital video players come under the scope of this category. Hand-held optical disk players do not come under the scope of this category.
Equipment lacking both air-moving devices and hard disk (rotating media) storage need not be measured or reported.
C.22.2 Installation
The device shall be installed in accordance with 5.1.6, 8.5 and 8.6.1.
C.22.3 Operation
C.22.3.1 General
Operation of the equipment shall be in accordance with 5.3 and 8.5 for the following modes of operation.
Intentional sound, such as music, speech, or user interface sounds, shall not be included in equipment operations.
C.22.3.2 Idle mode
Power shall be switched on, and the equipment shall be in a steady-state condition, including thermal equilibrium with the environment. Disk drives shall be in the idle ready mode as defined in C.9.3.1.1, and the standard user interface shall be displayed on the screen. Any air-moving device(s) shall be running as needed to cool the steady-state condition.
If power saving modes are available, such modes may be tested in addition to the above idle mode, and shall be described in the test report, if measured.
C.22.3.3 Operating mode(s)
One or more of the following operating modes shall be used where applicable. Noise due to keyboard operation shall not be included. Any air-moving device(s) shall be running as needed to cool the operating mode at steady state.
a) Equipment with rigid disk drives as specified in C.9.3.2.
b) Running a typical workload. For computing devices this may be running office productivity software or rendering web pages. For digital media playback devices, this may be playing a video file (if capable of doing so) or audio file, but with no intentional sound output.

92 © Ecma International 2018
C.22.4 Measurement time interval
The time-averaged sound pressure level shall be measured for at least the measurement time interval specified in 6.7.2, 7.7.2 or 8.7.2 as applicable.
C.23 Equipment category: Digital media recorders and playback units for consumer use
C.23.1 Description
This category covers systems used to record digital media contents in the form of audio visual signals from a commercial source such as (but not limited to) cable TV or satellite TV providers. Such systems can be referred to as Personal Video Recorders (PVR), Digital Video Recorder (DVR), or Time Shifting Entertainment System.
Such systems can, and usually do incorporate some form of digital storage device for recording of programming e.g. HDD, SSD, or other future storage methods. When use of storage sub-systems and cooling fans is incorporated, the unit shall be tested as in 5.1, 8.5 and the relevant clauses of this annex.
For equipment which emits sound in the 16 kHz octave band, the procedures specified in ECMA-108 for sound power levels shall be used (see Table 4).
C.23.2 Installation
The constituent units of the system may be tested individually and reported accordingly. In this case the installation conditions are as in 5.1, 8.5 and the relevant clauses of this annex.
Alternatively the equipment may be tested as a complete system. In this case for the determination of sound power levels, the equipment shall be mounted on the hard reflecting floor and the setup used recorded.
C.23.3 Operation
C.23.3.1 General
Operation of the equipment shall be in accordance with 5.3 and 8.5 for the following modes of operation.
C.23.3.2 Idle mode
Power shall be switched on, the equipment shall be in a steady-state condition, with air-moving device(s) running, if any, optical drives, if any, in idle mode as in C.19, system operating disk drives in a “pass through” manner (neither explicitly recording nor explicitly playing back).
C.23.3.3 Operating mode(s)
One or more of the following operating modes shall be used where applicable.
a) Equipment with rigid disk drives:
1) Operating condition shall be determined in accordance with C.9.3.2 where ns shall be:
12Mb/s (HD) or 2Mb/s (SD), divided by the number of user data bits per track on the HDD multiplied by the total number of read/write video streams.

© Ecma International 2018 93
If complete information for the previous paragraph is not available, the user can determine the number of tuners incorporated within the system. Once determined, simulate explicit recording of the same number of media streams as there are tuners while simultaneously explicitly playing back one media stream or however many media streams are the system’s advertised capacity.
2) With air-moving device(s) running
b) Equipment with optical drives.
1) Operate optical drives as described in C.19.
2) With air-moving device(s) running
c) Equipment with other parts with operating modes not described above: name and operating conditions shall be included in the report if a measurement is performed.
C.23.4 Measurement time interval
The time-averaged sound pressure level shall be measured for at least the measurement time interval specified in 6.7.2, 7.7.2 or 8.7.2 as applicable.

94 © Ecma International 2018

© Ecma International 2018 95
Annex D (informative)
Identification and evaluation of prominent discrete tones
D.1 Scope
This annex describes two procedures for determining whether or not noise emissions contain prominent discrete tones: the tone-to-noise ratio method and the prominence ratio method.
Annex D concerns discrete tones, one cause of tonality. Annex G concerns tonality, which can arise not only from discrete tones but also from other phenomena and conjunctions of phenomena. Annex G is based on the hearing model in Annex F, but Annex D is not based on Annex F.
Discrete tones occurring at any frequency within the one-third-octave bands having centre frequencies from 100 Hz to 10 000 Hz can be evaluated by the procedures in this annex (i.e., discrete tones between 89,1 Hz and 11 220 Hz), referred to the discrete tone frequency range of interest, hereafter).
All of the requirements of the test environment (see 8.3) apply. However, for the purposes of this annex, corrections neither for background noise, K1, nor for test environment, K2 apply.
NOTE 1 Since some ITT equipment emit discrete tones in the 16 kHz octave band, the tone-to-noise ratio or the
prominence ratio can be computed for these discrete tones in accordance with the procedures in this annex in an attempt to quantify their relative levels. However, the prominence criteria in either D.9.5 or D.10.6 cannot be applied, since there is
no supporting psychoacoustical data on such high-frequency discrete tones.
Declaration of product noise emissions in accordance with ECMA-109 offers the option of stating whether or not there are prominent discrete tones in the noise emissions of a product, as determined by this annex. Other standards, or other test codes relating to products besides ITT equipment, can also refer to this annex for the declaration of prominent discrete tones. For the purposes of such declarations, either the tone-to-noise ratio method or the prominence ratio method, or the psychoacoustic tonality calculation method (G.5) can be used, unless otherwise specified in the standard or test code.
NOTE 2 The tone-to-noise ratio method may prove to be more accurate than the prominence ratio method for multiple
tones in adjacent critical bands, for example when strong harmonics exist. The prominence ratio method can be more effective for multiple discrete tones within the same critical band, and is more readily automated to handle such cases.
NOTE 3 The Tone-to-Noise Ratio may underestimate prominence of discrete tones that overlap with elevated or sloped
noise spectra. The Prominence Ratio may be applicable to tonalities like discrete tones and noise with narrow or sloped
spectra, to the degree that critical bands adjacent to the tonalities of interest are free of such tonalities. The measurement
of tonality, which includes tones, is described in Annex G.
D.2 Annex status
Although this annex is informative, it contains requirements for fulfilment when its procedures are referenced normatively by another standard or test code. These requirements are generally identified through the use of the prescriptive word “shall”.

96 © Ecma International 2018
D.3 Psychoacoustical background
A discrete tone which occurs together with broad-band noise is partially masked by that part of the noise contained in a relatively narrow frequency band, called the critical band, that is centred at the frequency of the tone. Noise at frequencies outside the critical band does not contribute significantly to the masking effect. The width of a critical band is a function of frequency (see D.8). In general, a discrete tone is just audible in the presence of noise when the sound pressure level of the tone is about 4 dB {2 dB to 6 dB, depending on frequency (Reference [15])} below the sound pressure level of the masking noise contained in the critical band centred around the tone. This is sometimes referred to as the threshold of detectability. For the purposes of this annex, a discrete tone is classified as prominent when using the tone-to-noise ratio method if the sound pressure level of the tone exceeds the sound pressure level of the masking noise in the critical band by 8 dB for discrete tone frequencies of 1 000 Hz and higher, and by a greater amount for discrete tones at lower frequencies. This corresponds, in general, to a discrete tone being prominent when it is more than 10 dB to 14 dB above the threshold of detectability. When using the prominence ratio method, a discrete tone is classified as prominent if the difference between the level of the critical band centred on the tone and the average level of the adjacent critical bands is equal to or greater than 9 dB for tone frequencies of 1 000 Hz and higher, and by a greater amount for tones at lower frequencies. Reference [16] provides the basis for these criterion values.
D.4 Microphone position(s)
If the equipment has an operator position, the measurements shall be performed at the operator position defined in 8.6.1. If there is more than one operator position, the measurements described in the following shall be performed at the operator position with the highest A-weighted sound pressure level.
If the equipment has no operator position, the measurements to determine the tone-to-noise ratios or prominence ratios shall be performed at the bystander position defined in 8.6.2 with the highest A-weighted sound pressure level and at all other bystander positions having A-weighted sound pressure levels within 0,5 dB of the highest one.
When the methods of this annex are to be applied to sub-assemblies, the conditions in the next two paragraphs shall be used.
For sub-assemblies intended for use in equipment with a defined operator position, the measurement shall be performed at the operator position (see 8.6.1).
For sub-assemblies intended for use in equipment which does not require operator attention while in the operating mode, the measurements shall be performed at the bystander position (see 8.6.2) with the highest A-weighted sound pressure level and at all other bystander positions having A-weighted sound pressure levels within 0,5 dB of the highest one. For small, low-noise sub-assemblies needing a hemispherical measurement surface with a radius equal to or less than 1 m (see 5.1.7 and B.1), the signal-to-noise ratio may not be sufficient at the bystander position(s). In such cases, the measurements may be performed at selected microphone positions from Table B.1 on the hemispherical measurement surface itself (even if the sound power determination is done without fixed positions). In such cases, the radius of the hemisphere, the coordinates of the microphone positions from Table B.1, and enough information to uniquely identify the equipment orientation relative to the microphone positions shall be reported.
If multiple microphone positions are used to perform the measurements described in this annex, the highest values computed for tone-to-noise ratio (see D.9.4) and prominence ratio (see D.10.5), and the corresponding microphone position for each, shall be reported.

© Ecma International 2018 97
D.5 Instrumentation
A digital fast Fourier transform (FFT) analyser capable of measuring the power spectral density of the microphone signal shall be used for the measurements of this annex.
The analyser must have rms averaging (linear averaging, rather than exponential averaging) capabilities, a Hanning time window function, an upper frequency limit high enough to allow computing the quantities required herein for the particular discrete tone under investigation, and an FFT resolution less than 1 % of the frequency of the tone.
NOTE For the tone-to-noise ratio procedure (see D.9), experience has shown that an FFT resolution of 1 % of the frequency of the tone under investigation is occasionally insufficient to properly resolve the tone. Therefore, for application
to the tone-to-noise ratio procedure, an FFT resolution of 0,25 % or better is recommended (see Reference [17]).
The microphone output signal fed to an FFT analyser shall meet the requirements for sound level meters specified in IEC 61672-1, class 1. Because the procedures of this annex include the option of working directly in terms of sound pressure levels, the FFT analyser (or, alternatively, the software used for post-processing of the FFT data) should allow calibration directly in terms of sound pressure levels in decibels (reference: 20 µPa).
No frequency weighting function (e.g., A-weighting) shall be applied to the analyser input signal.
The FFT analysis shall use a sufficient number of averages to provide an analysis time satisfying the requirements of 8.7.2.
D.6 Initial screening tests
D.6.1 General
Before proceeding with either the tone-to-noise ratio method (see D.9) or the prominence ratio method (see D.10), one of the tests specified in D.6.2 and D.6.3 shall be conducted, as applicable.
D.6.2 Screening test for audibility of discrete tone(s) in noise generally well above the threshold of hearing
Discrete tones should only be classified as prominent if they are, in fact, audible in the noise emissions of the equipment under test. For the purposes of the screening test, it is assumed that the level of the noise being measured is well above the threshold of hearing. Discrete tones or tonal components that might be present in the noise emissions may not be audible due to masking by the noise, itself, or due to some other reason (e.g., the tones may be harmonics of a lower fundamental tone and not individually audible). Therefore, an initial aural examination of the noise emitted from the equipment under test shall be made at the specified microphone position, with the following cases applied.
a) If one or more discrete tones are audible, then the measurement procedures of this annex for either the tone-to-noise ratio or prominence ratio, or both, shall be carried out for each audible tone.
b) If no discrete tones are audible in the noise emissions, and there is a high degree of confidence in this conclusion, the procedures of this annex need not be carried out and a statement such as “no audible discrete tones” or “no prominent discrete tones” may be included in the test report.
c) If there is doubt as to whether discrete tone is audible in the noise emissions (e.g., if the test engineer has a hearing loss or is not a trained or experienced listener), then other, more objective evidence should be sought. For this purpose, a preliminary FFT analysis shall be taken of the noise emissions at the

98 © Ecma International 2018
specified microphone position(s). If the spectrum indicates the presence of potentially audible discrete tones or tonal components (i.e., if the spectrum shows one or more sharp spikes), then the measurement procedures of this annex for either the tone-to-noise ratio or prominence ratio, or both, shall be carried out for each potentially audible tone.
NOTE The aural examination in cases a) and b) can be bypassed, and the preliminary FFT analysis of case c) used directly as this screening test for the audibility of discrete tones.
Any discrete tone that is determined to be prominent in accordance with the either the tone-to-noise ratio method or the prominence ratio method shall also meet the audibility requirements of D.9.8 or D.10.8, respectively.
D.6.3 Screening test for audibility of discrete tone(s) in noise near the threshold of hearing
If the noise emissions to be analysed for the presence of prominent discrete tones are extremely low in level such that either the noise itself, or any discrete tone occurring in the noise is near or below the threshold of hearing, the following screening test shall be applied. An FFT spectrum of the noise emissions at the specified microphone position(s) shall be acquired in accordance with either D.9.1 or D.10.1, as applicable. The FFT spectrum shall be calibrated in terms of sound pressure level in decibels (reference: 20 μPa) following the machine manufacturer’s instructions for the particular FFT analyser in use. The following cases apply.
a) If the sound pressure level, Lt (see D.9.2, and if applicable, D.9.6), of a discrete tone or tonal component to be evaluated for prominence falls below the lower threshold of hearing (LTH), P1(f), as defined in D.7.1 and calculated at the frequency of the tone by Formula (D.1), it is assumed to be inaudible, and the procedures of this annex need not be carried out. A statement such as "no audible discrete tones" or "no prominent discrete tones" may be included in the test report.
b) If the sound pressure level, Lt (see D.9.2, and if applicable, D.9.6), of a discrete tone or tonal component to be evaluated for prominence is less than or equal to P1(f) + 10 dB, as calculated at the frequency of the tone by Formula (D.1), it is assumed to be "not prominent", and the procedures of this annex need not be carried out. A statement such as "no audible discrete tones" or "no prominent discrete tones" may be included in the test report. Figure D.1 shows both the P1(f) and P1(f) + 10 dB curves.
NOTE For most ITT equipment that contain cooling fans, even for small, relatively quiet products, the noise levels will be well above the threshold of hearing. However, for certain components evaluated separately from their end-use
product, such as small disk drives, the levels can, in fact, be below the threshold of hearing and the above screening procedure is applicable.
D.7 Discrete tones and noise emissions near the threshold of hearing
D.7.1 Lower threshold of hearing
Studies of normal hearing thresholds have shown that the measured thresholds vary about a mean level in approximately a normal distribution. The 50-percentile distribution values have been standardized in ISO 389-7[1], as a function of frequency and termed the “reference threshold of hearing”.
For the purposes of this annex, the threshold of hearing that corresponds to the 1-percentile distribution (essentially, the “lower limit” of the hearing threshold) is more suitable. This may be termed the lower threshold of hearing (LTH). The sound pressure level at frequency f corresponding to this LTH is calculated from Formula (D.1).
51
42
33
24
11 '''')( afafafafafP dB (D.1)

© Ecma International 2018 99
where
std
mean'f
fff
is the non-dimensional parameter calculated from the values in Table D.1
a1 to a5 are polynomial coefficients given in Table D.1.
Table D.1 — Parameters for calculation of P1(f)
f fmean
Hz
fstd
Hz
a1
dB
a2
dB
a3
dB
a4
dB
a5
dB
30520 f 167,5 87,3212 1,415532 -2,451068 1,498869 -6,983224 8,621226
2230305 f 1157,5 488,582 0,397994 -0,891839 -0,815138 -1,221319 -7,600754
000142302 f 7250,0 3033,25 1,584978 -2,766599 -6,906192 10,138553 -3,149339
0502200014 f 16990,0 4049,0 -5,775593 -9,200034 26,59115 52,16712 15,61552048
NOTE The sound pressure level P1(f) defined in Formula (D.1) represents the threshold of hearing that only 1 % of
individuals, having normal hearing would be expected to hear. Formula (D.1) represents a 4th-order polynomial fit to data collected and tabulated in References [29] to estimate the LTH at a given frequency for the purposes of this annex. To
improve the fit over a wide frequency range, 4 different polynomials are used to cover the range of frequencies between 20 Hz to 22 kHz (Reference [20]).
-40
-30
-20
-10
0
10
20
0 2000 4000 6000 8000 10000 12000 14000 16000
So
un
d p
res
su
re le
ve
l (d
B r
e 2
0 m
Pa
)
Frequency (Hz)
FFT
LTH (P1)
LTH (P1) + 10 dB
Figure D.1 — The Lower Threshold of Hearing (LTH) and the LTH + 10 dB curves illustrated for the analysis of low-level discrete tones.
100 © Ecma International 2018
D.7.2 Normalization of noise near threshold of hearing
For low level sound, the sound pressure level of one or more data points in the FFT spectrum may fall below the LTH, as defined by Formula (D.1). If calculations are performed using the as-measured sound pressure levels, very high values of tone-to-noise ratio or prominence ratio can be obtained, which may not correspond to subjective impressions of the sound. If, however, the sound pressure level at each data point is adjusted to be equal to the value of the LTH, the total sound pressure level in each critical band can be overstated, leading to unrealistically low values of tone-to-noise ratio or prominence ratio. For such low level sounds, a normalization of the FFT spectrum is required so that the masking noise level (for tone-to-noise ratio) or the total levels in the lower, middle, and upper critical bands (for prominence ratio) reflects the correct psychoacoustic value. The threshold of hearing based on one-third octave bands of white or pink noise may be more appropriate for this normalization, rather than the LTH defined above, which is based on pure tones. Such a normalization procedure is yet to be defined for the purposes of this annex.
D.8 Critical bandwidths
The width of the critical band fc, centred at any frequency f0, in hertz, can be calculated from Formula (D.2):
fc = 25,0 + 75,0×[1,0 +1,4×( f0 1000)2 ] 0,69
(D.2)
EXAMPLE fc = 162,2 Hz for f0 = 1 000 Hz and fc = 117,26 Hz for f0 = 500 Hz. (See Reference [21])
For the purposes of this annex, the critical band is modelled as an ideal rectangular filter with centre frequency f0, lower band-edge frequency f1, and upper band-edge frequency f2, where
c12 fff (D.3)
For 089,1Hz 500 Hz,f the critical band approximates a constant-bandwidth filter, and the band-edge
frequencies are computed as follows:
2/c01 fff (D.4)
and
2/c02 fff . (D.5)
For 0500 Hz 11 200 Hz,f the critical band approximates a constant-percentage bandwidth filter, where
f f f0 1 2 . (D.6)
and the band-edge frequencies are computed from Formulae (D.3) and (D.6) as follows:
2
4
2
2
0
2
cc1
ffff
(D.7)
and
c12 fff . (D.8)
NOTE Although Formula (D.2) for the width of the critical band is well-known and widely used, formulae for
the corresponding band-edge frequencies have not been formally derived. Given the behaviour of the critical band below and above 500 Hz, however, the assignment of the band-edge frequencies in accordance with the above

© Ecma International 2018 101
Formulae (D.7) and (D.8) seems to be logical. That is, for constant-bandwidth filters, the lower and upper band-
edge frequencies are arithmetically related to the centre frequency, whereas for constant-percentage bandwidth filters, they are geometrically related.
For the purposes of determining the tone-to-noise ratio of the discrete tone frequency range of interest (see D.1), the procedure of this Annex permits using FFT data f1 < 89,1 Hz and f2 > 11 200 Hz.
D.9 Tone-to-noise ratio method
D.9.1 FFT measurement
The operating procedures for the FFT analyser shall be followed to acquire the power spectral density (or sound pressure level) of the signal at the microphone position (see D.4), for the same mode(s) of operation and measurement conditions as used for the measurements in 8.7, employing the Hanning time window and rms averaging (linear averaging). No frequency weighting, such as A-weighting, shall be applied to the signal fed to the FFT analyser. The FFT analysis shall use a sufficient number of averages to provide an analysis time satisfying 8.7.2. Zoom analysis should be used with the centre frequency of the zoom band corresponding, approximately, to the frequency of the discrete tone, and the width of the zoom band at least equal to, and preferably slightly greater than, the width of the critical band.
NOTE The power spectral density of a signal is usually calculated and displayed as a mean-square value per cycle of some quantity (e.g., a mean-square voltage per cycle, in volts squared per hertz, or a mean-square sound pressure per
cycle, X, in pascals squared per hertz, versus frequency). For the purposes of determining the tone-to-noise ratio, LT, the
units of the measured power spectral density are not important, and absolute calibration of the analyser to some reference
value (such as 1 V or 20 mPa) is unnecessary. However, calibration of the instrument in pascals squared enables sound
pressure level quantities to be readily obtained. The procedures in this annex assume this calibration and the text is written in terms of the “mean-square sound pressure,” but to indicate that any quantity can be used, the symbol has been chosen as “X”.
D.9.2 Determination of discrete tone level
The mean-square sound pressure of the discrete tone, Xt, (or the sound pressure level of the discrete tone, Lt)
is determined from the FFT spectrum measured as in D.9.1 by computing the mean-square sound pressure in
the narrow band that “defines” the tone. The width of this frequency band, ∆ft, in hertz, is equal to the number
of discrete data points (“the number of spectral lines”) included in the band, times the resolution bandwidth (“line spacing”). If the width of the frequency band selected for the purpose of computing Xt (or Lt) is greater than 15 % of the width of the critical band centred at the frequency of the discrete tone, the FFT analysis should be repeated with a smaller resolution bandwidth. A discrete tone bandwidth that remains greater than 15 % of the critical band through repeated FFT analyses with smaller resolution bandwidths indicate that the tone is not steady in frequency, or some other phenomenon. In this case, the following procedure may proceed with the discrete tone bandwidth greater than 15 % of the critical band.
For the determination of the mean-square sound pressure of the discrete tone (or the sound pressure level of the discrete tone) for multiple tones in a single critical band, see D.9.6.
CAUTION — Too narrow a bandwidth selected for ∆ft to delineate the discrete tone, especially when automated procedures are being used, may result in underestimation of the mean-square sound pressure of the tone (or the sound pressure level of the tone) and overestimation of the mean-square sound pressure of the noise (or the sound pressure level of the noise). See D.9.3. If the band is too wide, masking noise or secondary tones may be erroneously included with the discrete tone computations and omitted from the noise computation.

102 © Ecma International 2018
D.9.3 Determination of masking noise level
For the purposes of this annex, the mean-square sound pressure of the masking noise, Xn, (or the sound pressure level of the masking noise, Ln) is taken as the value determined using the following two-step procedure.
The first step is to compute the total mean-square sound pressure (or the total sound pressure level) in the critical band. The width of the critical band is determined from Formula (D.2) with f0 set equal to the frequency of the discrete tone under investigation, ft, and with lower band-edge frequency f1 and upper band-edge frequency f2 as given in either Formula (D.4) and Formula (D.5) or Formula (D.7) and Formula (D.8).
From the FFT spectrum, the total mean-square sound pressure of the critical band, Xtot, (or the total sound pressure level of the critical band, Ltot) is computed. Depending on the particular instrumentation used, this may be performed on the FFT analyser itself using band cursors, on an external computer using appropriate software, or by some other means. In any event, the width of the frequency band used to compute this value, ∆ftot, in hertz, is equal to the number of discrete FFT data points included in the band times the resolution bandwidth.
The second step is to calculate the masking noise mean-square sound pressure, Xn, (or the sound pressure level of the masking noise, Ln) from the following formulae:
ttot
cttotn )(
ff
fXXX
(D.9A)
or, when working with sound pressure levels, Formula (D.9A) becomes:
dB lg101010lg10ttot
c1,01,0
nttot
ff
fL
LL (D.9B)
For the determination of the mean-square sound pressure of the masking noise (or the sound pressure level of the masking noise) for multiple tones in a critical band, see D.9.6.
NOTE Formula (D.9A) [or Formula (D.9B)] accounts for both the fact that the FFT analyser bandwidth, ftot, used to
compute Xtot (or Ltot) may not be exactly equal to the critical bandwidth, fc, and the fact that the calculated mean-square
sound pressure (Xtot ‒ Xt), [or the calculated sound pressure level, ttot 1,01,01010lg10
LL dB] does not include the noise
contained in the narrow band ∆ft.
D.9.4 Determination of the tone-to-noise ratio
The tone-to-noise ratio, ∆LT, in decibels, is calculated from one of the following formulae:
tT
n
10lg dBX
LX
(D.10A)
or, when working with sound pressure levels, Formula (D.10A) becomes:
ntT LLL dB (D.10B)
For the determination of the tone-to-noise ratio for multiple tones in a critical band, see D.9.6.

© Ecma International 2018 103
D.9.5 Prominent discrete tones criteria for tone-to-noise ratio method
A discrete tone is classified as prominent in accordance with the tone-to-noise ratio method if one of the following conditions is met:
LT 8,0 8,33 lg(1 000/ft) dB for 89,1 Hz ft 1 000 Hz (D.11A)
LT 8,0 dB for 11 200 Hz > ft > 1 000 Hz (D.11B)
and the discrete tone meets the audibility requirement of D.9.8. The criteria in Formulae (D.11A) and (D.11B) are illustrated graphically in Figure D.5.
D.9.6 Multiple tones in a critical band.
The noise emitted by a machine may contain multiple tones, and several of these may fall within a single critical band. If one or more discrete tones are audible, the procedure above is followed for each tone, with the following differences. The discrete tone with the highest amplitude in the critical band is identified as the primary tone, and its frequency is denoted as fp. For the critical band centred on this primary tone, the discrete tone with the second highest level is identified as the secondary tone and its frequency denoted as fs.
If the secondary tone is sufficiently close in frequency to the primary tone, then the two are considered to be perceived as a single discrete tone and the prominence is determined by combining their mean-square sound pressures (or sound pressure levels). Two discrete tones may be considered sufficiently close or “proximate” if
their spacing psps, fff is less than the proximity spacing, fprox, in hertz, defined Formula (D.12):
Hz,10218,1]|)212/
plg(|[2,1
prox
ff
for 89,1 Hz ≤ fp < 1000 Hz (D.12)
EXAMPLE fprox = 23 Hz for fp = 150 Hz; fprox = 63,8 Hz for fp = 850 Hz).
If the proximity criterion fs,p < fprox is met, then the mean-square sound pressure of the secondary tone, Xt,s, is added to the mean-square sound pressure of the primary tone, Xt,p, when calculating the mean-square sound pressure of the discrete tone, Xt, and subtracted from the total mean-square sound pressure, Xtot, before calculating the tone-to-noise ratio ∆LT
When working with sound pressure levels for this case, the sound pressure level of the secondary tone, Lt,s, is combined on an energy basis with the sound pressure level of the primary tone, Lt,p, and subtracted on an energy basis from the total sound pressure level of the noise, Ltot. For discrete tone frequencies higher than
1 000 Hz, the proximity spacing, fprox exceeds half the width of the critical band, so the criterion is always met. See Reference [22]. Thus, in equation form:
)( st,pt,t XXX (D.13A)
or, when working with sound pressure levels, Formula (D.13A) becomes:
0,1 0,1t, p t, st 10lg 10 10 dB
L LL
(D.13B)
and

104 © Ecma International 2018
)( st,pt,tot
cst,pt,totn
fff
fXXXX
(D.14A)
or, when working with sound pressure levels, Formula (D.14A) becomes:
t, p t, stot
0,1 0,10,1 cn
tot t, p t, s
10lg 10 10 10 10lg dBL LL f
Lf f f
(D.14B)
With the above values for Xn and Xt, (or Ln and Lt), Formula (D.10) is used to compute the tone-to-noise ratio.
If the proximity criterion is not met, then the discrete tones are considered to be perceived as separate discrete tones and are treated individually. In this case, the mean-square sound pressure of the secondary tone is still removed from the mean-square sound pressure of the masking noise (but otherwise ignored; i.e., not added to the mean-square value of the primary tone) before calculating the tone-to-noise ratio of the
primary tone. In this case, Formula (D.14A) is again used for Xn, but Formula (D.13A) simply becomes Xt Xt, p. These values of Xn and Xt are then used in Formula (D.10A) to compute the tone-to-noise ratio for the primary tone.
When working with sound pressure levels for this case, the sound pressure level of the secondary tone is still subtracted on an energy basis from the sound pressure level of the noise, but it is not added to the sound pressure level of the primary tone, before calculating the tone-to-noise ratio of the primary tone. In this case,
Formula (D.14B) is again used for Ln, but Formula (D.13B) simply becomes Lt 10lg(100,1Lt, p) dB. These values of Ln and Lt are then used in Formula (D.10B) to compute the tone-to-noise ratio for the primary tone.
When the proximity criterion is not met and it is desired to compute the tone-to-noise ratio for the secondary tone individually, then the above procedure may be repeated with the secondary tone considered as the primary tone. The critical band is then centred on this discrete tone, with all quantities being recomputed.
D.9.7 Complex tones containing harmonic components (tone-to-noise ratio method)
Although laboratory-generated discrete tones may be pure sinusoids, most of the discrete tones that occur in the noise emissions from real machinery and equipment are not. As such, the FFT spectrum will generally show a series of tonal components (called harmonics, or partials) at integral multiples of some fundamental frequency. Usually the fundamental is the strongest component, but this is not always the case. For the purposes of this annex, each tonal component in the harmonic series shall be screened for audibility in accordance with D.6 and, depending on the outcome, evaluated independently in accordance with the procedures of this annex. Alternatively, since presumably the presence of harmonics has already been determined from inspecting an FFT spectrum of the noise emissions, the procedures of this annex may be applied to each tonal component without the initial audibility screening. In this case, any tonal component that meets the prominence criteria of D.9.5 shall also meet the audibility requirements of D.9.8 before it can be classified as prominent.
NOTE For the cases of noise emissions from small fans consisting of many harmonic components and other discrete
tones, a new evaluation parameter, Total Tone-To-Noise Ratio which is based on tone-to-noise ratio, is under development. See Reference [31].
D.9.8 Audibility requirements
A discrete tone should not be classified as prominent if it is not, in fact, audible. Therefore, for each discrete tone identified as prominent in D.9.5, an aural examination of the noise emitted from the equipment under test shall be made at the microphone position, or positions, used for the analysis. If the discrete tone is audible in the noise emissions, then it shall be reported as prominent, as determined. If the discrete tone is clearly not

© Ecma International 2018 105
audible in the noise emissions, and there is a high degree of confidence in this conclusion, then it need not be reported as prominent. If there is any doubt as to whether or not a discrete tone is audible in the noise emissions (e.g., if the test engineer has a hearing loss or is not a trained or experienced listener), then the following listening test shall be conducted to help make the determination whether or not the tone is audible.
A sinusoidal signal corresponding to the frequency of the discrete tone in question shall be reproduced audibly, and compared by the listener to the noise from the product, noting whether or not a discrete tone at the same frequency is audible in the product noise emissions. If the discrete tone is now audible in the noise emissions, then it shall be reported as prominent, as determined. If the discrete tone is not audible in the noise emissions even with the help of the comparison tone, then it need not be reported as prominent.
D.9.9 Example (tone-to-noise ratio method)
Figure D.2 shows how a single tone in a critical band is analyzed using the tone-to-noise ratio method. Figure D.3 shows how the tone-to-noise ratio method is used when multiple tones exist in a critical band.
1.0E-07
1.0E-06
1.0E-05
1.0E-04
1.0E-03
1000 1500 2000 2500 3000
So
un
d p
res
su
re le
ve
l (d
B r
e 2
0 m
Pa
)
Me
an
-sq
uare
so
un
d p
res
su
re (
Pa
2)
Frequency (Hz)
f1 f2
ft = 1600 Hzf1 = 1485 Hzf2 = 1724 Hzftot = 244 Hz
fc = 239,45 Hz
ft = 20 Hz
Xt = 6,7710-4 Pa2
Xtot=7,3110-4 Pa2
Xn = 5,7610-5 Pa2
LT = 10,7 dBProminent discete tone!
ft
10-7
10-6
10-5
10-4
10-3 64
54
44
34
24
Lt = 62,3 dBLtot = 62,6 dBLn = 51,6 dBLT = 10,7 dBProminent discrete tone!
Figure D.2 — Tone-to-noise ratio method applied to a single tone in a critical band

106 © Ecma International 2018
1.E-07
1.E-06
1.E-05
1.E-04
1.E-03
1.E-02
500 600 700 800 900 1000 1100 1200
So
un
d p
res
su
re le
ve
l (d
B r
e 2
0 m
Pa
)
Me
an
-sq
uare
so
un
d p
res
su
re (
Pa
2)
Frequency (Hz)
f1 fp fs f2
10-7
10-6
10-5
10-4
10-3
10-2
Primary tonefp = 800 Hzf1 = 732 Hzf2 = 874 Hz
ftot = 144 Hz
fc = 141,62 Hz
ft,p = 10 Hz
Xt,p = 6,1710-4 Pa2
fprox = 59 Hz
fs,p = 54 HzProximate tones!
Xt = 1,04-3 Pa2
Xtot = 1,10-3 Pa2
Xn = 6,92-5 Pa2
LT = 11,8 dBProminent discrete tone!
Secondary tonefs = 854 Hz
ft,s = 10 Hz
Xt,s = 4,1910-4 Pa264
74
54
44
34
24
Lt,p = 61,9 dBLt,s = 60,2 dBLt = 64,1 dBLtot = 64,4 dBLn = 52,4 dB
LT = 11,8 dBProminent discrete tone!
Figure D.3 — Tone-to-noise ratio method applied to multiple tones in a critical band
D.10 Prominence ratio method
D.10.1 Measurement using FFT analyser
The operating procedures for the FFT analyser shall be followed to acquire the power spectral density (or sound pressure level) of the signal at the measurement position (see D.4), for the same mode(s) of operation and measurement conditions as used for the measurements in 8.7, employing the Hanning time window and rms averaging (linear averaging). No frequency weighting, such as A-weighting, shall be applied to the signal fed to the FFT analyser. The FFT analysis shall use a sufficient number of averages to provide an analysis time satisfying the requirements of 8.7.2. Zoom analysis should be used with the centre frequency of the zoom band corresponding, approximately, to the frequency of the discrete tone, and the width of the zoom band equal to about four times the width of the critical band.
NOTE The power spectral density of a signal is usually calculated and displayed as a mean-square value per cycle of some quantity (e.g., a mean-square voltage per cycle, in volts squared per hertz, or a mean-square sound pressure per
cycle, in pascals squared per hertz, versus frequency). For the purposes of determining the prominence ratio, LP , the
units of the measured power spectral density are not important, and absolute calibration of the analyser to some reference
values (such as 1 V or 20 mPa) is unnecessary. However, calibration of the instrument in pascals squared per hertz
enables sound pressure level quantities to be readily obtained. The procedures in this annex assume this calibration and

© Ecma International 2018 107
the text is written in terms of the “mean-square sound pressure,” but to indicate that any quantity can be used, the symbol has been chosen as “X”.
D.10.2 Determination of the level of the middle critical band
The mean-square sound pressure of the middle critical band, XM, is defined as the total mean-square sound
pressure contained in the critical band centred on the discrete tone under investigation (When working with sound pressure levels, this quantity becomes the sound pressure level of the middle critical band, LM.). The
width of the middle critical band, fM, as well as the lower and upper band-edge frequencies, f1,M and f2,M are determined from the relationships in D.8 with f0 set equal to the frequency of the discrete tone under investigation, ft. The band-edge frequencies then become:
For Hz500t f :
M1, M t
2
ff f
(D.15)
and
M2, M t
2
ff f
(D.16)
For Hz500t f :
2
4
2
2
t
2
MMM,1
ffff
(D.17)
and
f2,M = f1,M + fM (D.18)
EXAMPLE f1,M = 922,2 Hz and f2,M = 1084,4 Hz when ft = 1 000 Hz.
The value of XM (or LM) is determined from the FFT spectrum by bracketing the data points lying between f1,M and f2,M and computing the mean-square sound pressure of the middle critical band (or the sound pressure level of the middle critical band). Depending on the particular instrumentation used, this may be performed on the FFT analyser itself using band cursors, on an external computer using appropriate software, or by some other means.
D.10.3 Determination of the level of the lower critical band
The mean-square sound pressure of the lower critical band, XL, is defined as the total mean-square sound pressure contained in the critical band immediately below, and contiguous with, the middle critical band defined in D.10.2 (When working with sound pressure levels, this quantity becomes the sound pressure level of the lower critical band, LL.). The relationships in D.8 govern this lower critical band, with centre frequency
f0,L, bandwidth fL, and lower and upper band-edge frequencies f1,L and f2,L, respectively. Since this lower
critical band must be contiguous with the middle critical band, it follows that f2,L = f1,M. However, because f0,L is
not known a priori, Formulae (D.2) to (D.8) cannot be used directly to determine the value of f1,L, and an
iterative method of solution would ordinarily have to be used. For the purposes of this annex, the value of f1,L
shall be computed from Formula (D.19) (which has been derived from an iterative solution through the use of curve fitting).

108 © Ecma International 2018
2
tL,2tL,1L,0L1, fCfCCf (D.19)
where
ft is the frequency of discrete tone under investigation;
CL,0, CL,1, CL,2 are constants given in Table D.2.
Table D.2 — Parameters for calculation of f1, L
Frequency range
Hz
C L,0
Hz C L,1 C L,2
Hz
89,1 ≤ ft 171,4 20,0 0,0 0,0
171,4 < ft 1600 -149,5 1,001 -6,90×10
11 200 Hz > ft 1 600 6,8 0,806 -8,20×10
For discrete tone frequencies less than or equal to 171,4 Hz, the lower band-edge frequency for the lower critical band would compute to less than 20 Hz, the accepted lower limit of human hearing. For such cases, the lower band-edge frequency shall be set equal to 20 Hz (so that the band used for the determination of XL
extends from 20 Hz up to f2,L). The width of this lower band, fL, will now be less than the width of the true critical band, and the determination of the prominence ratio takes this into account (see D.10.5).
The value of XL (or LL) is determined from the FFT spectrum by bracketing the data points lying between f1,L and f2,L and computing the mean-square sound pressure (or the sound pressure level) of the lower critical band. Depending on the particular instrumentation used, this may be performed on the FFT analyser itself using band cursors, on an external computer using appropriate software, or by some other means. Care should be taken to ensure that the lower critical band and the middle critical band do not overlap computationally; i.e., that the FFT data points closest to the common band edge are assigned uniquely to one band or the other, and not to both.
For the purposes of determining prominence ratio of the discrete tone frequency range of interest (see D.1), the procedure of this Annex permits using FFT data, f1,L < 89,1 Hz.
D.10.4 Determination of the level of the upper critical band
The mean-square sound pressure of the upper critical band, XU, is defined as the total mean-square sound pressure contained in the critical band immediately above, and contiguous with, the middle critical band defined in D.10.2 (When working with sound pressure levels, this quantity becomes the sound pressure level of the upper critical band, LU.). The relationships in D.8 govern this upper critical band, with centre frequency
f0,U, bandwidth fU, and lower and upper band-edge frequencies f1,U and f2,U, respectively. Since this upper critical band must be contiguous with the middle critical band, it follows that f1,U = f2,M. However, because f0,U is
not known a priori, Formulae (D.2) to (D.8) cannot be used directly to determine the value of f2,U, and an
iterative method of solution would ordinarily have to be used. For the purposes of this annex, the value of f2,U
shall be computed from Formula (D.20) (which has been derived from an iterative solution through the use of curve fitting).

© Ecma International 2018 109
22, U U,0 U,1 t U,2 tf C C f C f (D.20)
where
ft is the frequency of discrete tone under investigation;
CU,0, CU,1, CU,2 are constants given in Table D.3.
Table D.3 — Parameters for calculation of f2, U
Frequency range
Hz
CU,0
Hz CU,1
CU,2
Hz-1
89,1 ≤ ft 1 600 149,5 1,035 7,70×10
11 200 > ft 1 600t 3,3 1,215 2,16×10
The value of XU (or LU) is determined from the FFT spectrum by bracketing the data points lying between f1,U and f2,U and computing the mean-square sound pressure (or the sound pressure level) of the upper critical band. Depending on the particular instrumentation used, this may be performed on the FFT analyser itself using band cursors, on an external computer using appropriate software, or by some other means. Care should be taken to ensure that the upper critical band and the middle critical band do not overlap computationally; i.e., that the FFT data point(s) closest to the common band edge is (are) assigned uniquely to one band or the other, and not to both.
For the purposes of determining prominence ratio of the discrete tone frequency range of interest (see D.1), the procedure of this Annex permits using FFT data, f2,U > 11 200 Hz.
D.10.5 Determination of prominence ratio
The prominence ratio, ∆LP in decibels, is calculated as follows (for discrete tone frequencies greater than 171,4 Hz):
5,0lg10
UL
MP
XX
XL dB for ft 171,4 Hz
(D.21A)
or, when working with sound pressure levels, Formula (D.21A) becomes:
M1,0
P 10lg10 LL ,,
lg ,UL 0 10 110 10 10 0 5LL
dB for ft 171,4 Hz (D.21B)
For discrete tone frequencies less than or equal to 171,4 Hz, the lower critical band becomes truncated (see D.9.3) so that its width is less than what would be calculated from Formula (D.2). Therefore, for the purposes of computing the prominence ratio for discrete tone frequencies less than or equal to 171,4 Hz, the level in the lower band is normalized to a bandwidth of 100 Hz (the width of a full critical band at these frequencies), so that the above formulae are modified as follows.

110 © Ecma International 2018
Hz4,171fordB
5,0/100lg10 t
ULL
MP
f
XfX
XL (D.22A)
or, when working with sound pressure levels, Formula (D.22A) becomes:
Hz4,171for
dB5,01010]/100[lg1010lg10
t
1,01,0L
1,0P
ULM
f
fLLLL
(D.22B)
D.10.6 Prominent discrete tone criterion for prominence ratio method
A discrete tone is classified as prominent in accordance with the prominence ratio method if:
Pt
10009,0 10lg dBL
f
for 89,1 Hz ft 1 000 Hz (D.23A)
LP 9,0 dB for 11 200 Hz > ft > 1 000 Hz (D.23B)
and the discrete tone meets the audibility requirement of D.10.8. The criteria in Formulae (D.23A) and (D.23B) are illustrated graphically in Figure D.5.
D.10.7 Complex tones containing harmonic components (prominence ratio method)
Although laboratory-generated discrete tones may be pure sinusoids, most of the discrete tones that occur in the noise emissions from real machinery and equipment are not. As such, the FFT spectrum will generally show a series of tonal components (called harmonics, or partials) at integral multiples of some fundamental frequency. Usually the fundamental is the strongest component, but this is not always the case. For the purposes of this annex, each tonal component in the harmonic series shall be screened for audibility in accordance with D.6.1 and, depending on the outcome, evaluated independently in accordance with the procedures of this annex. Alternatively, since presumably the presence of harmonics has already been determined from inspecting an FFT spectrum of the noise emissions, the procedures of this annex may be applied to each tonal component without the initial audibility screening. In this case, any tonal component that meets the prominence criteria of D.10.6 shall also meet the audibility requirements of D.10.8 before it can be classified as prominent.
NOTE For the cases of noise emissions from small fans, consisting of many harmonic components and other
discrete tones, a new evaluation parameter, Total Prominence Ratio which is based on prominence ratio, is under development. See Reference [31].
D.10.8 Audibility requirements
A discrete tone should not be classified as prominent if it is not, in fact, audible. Therefore, for each discrete tone identified as prominent in D.10.6, an aural examination of the noise emitted from the equipment under test shall be made at the microphone position, or positions, used for the analysis. If the discrete tone is audible in the noise emissions, then it shall be reported as prominent, as determined. If the discrete tone is clearly not audible in the noise emissions, and there is a high degree of confidence in this conclusion, then it need not be reported as prominent. If there is any doubt as to whether or not a discrete tone is audible in the noise emissions (e.g., if the test engineer has a hearing loss or is not a trained or experienced listener), then the following listening test shall be conducted to help make the determination whether or not the tone is audible.
A sinusoidal signal corresponding to the frequency of the discrete tone in question shall be reproduced audibly, and compared by the listener to the noise from the product, noting whether or not a tone at the same

© Ecma International 2018 111
frequency is audible in the product noise emissions. If the discrete tone is now audible in the noise emissions, then it shall be reported as prominent, as determined. If the discrete tone is not audible in the noise emissions even with the help of the comparison tone, then it need not be reported as prominent.
D.10.9 Example (prominence ratio method)
The prominence ratio method is illustrated graphically in Figure D.4. The prominence ratio was calculated in
accordance with D.10.5 and was found to be LP = 12,1 dB for the 1 600 Hz discrete tone. Because the result is more than 9,0 dB, which is the prominence ratio criterion at 1 600 Hz, the discrete tone is classified as prominent.
1.E-07
1.E-06
1.E-05
1.E-04
1.E-03
1.E-02
750 1250 1750 2250 2750
So
un
d p
res
su
re le
ve
l (d
B r
e 2
0 m
Pa
)
Me
an
-sq
uare
so
un
d p
res
su
re (
Pa
2)
Frequency (Hz)
f1,M
f1,L
f2,M
f1,U
f2,U
f2,L
Lower critical bandf1,L = 1276 Hzf2,L = 1485 HzXL = 5,0710-5 Pa2
LL = 51,0 dB
Upper critical bandf1,U = 1724 Hzf2,U = 2002 HzXU = 4,0310-5 Pa2
LU = 50,0 dB
Middle critical bandft = 1600 Hzf1,M = 1485 Hzf2,M = 1724 Hz
XM = 7,3110-4 Pa2
LM = 62,6 dB
LP = 12,1 dBProminent discrete tone!
ft
10-2
10-3
10-4
10-5
10-6
10-7
64
74
54
44
34
24
Figure D.4 — Illustration of the prominence ratio method for prominent discrete tone identification
D.11 Information to be recorded for prominent discrete tones
For each discrete tone that has been identified as prominent in accordance with this annex, the following information shall be recorded:
a) the frequency, ft, in hertz, of the discrete tone;
b) details of the method used to evaluate the discrete tone (D.9 tone-to-noise ratio or D.10 prominence ratio), together with a reference to this Standard;

112 © Ecma International 2018
c) if the tone-to-noise ratio method was used, the tone-to-noise ratio, LT, in decibels or if the prominence
ratio procedure was used, the prominence ratio LP, in decibels;
d) if the noise emissions under investigation include more than one identified prominent discrete tone, the
frequency of each tone, and either LT or LP for each tone.
NOTE It can be useful to record the A-weighted sound pressure level of the prominent discrete tone.
Figure D.5 — Criteria for prominence for both tone-to-noise ratio (D.9.5) and prominence ratio (D.10.6) as a function of frequency

© Ecma International 2018 113
Annex E (informative)
Detection of impulsive noise
Since its publication of the 1st edition of 1981 September, this Standard had provided an objective test method for determining whether the noise emissions are impulsive in character, or not. The method had relied on time-weighting I specified in the well-known sound level meter’s International Standard, IEC 61672-1 (or IMPULSE mode of its predecessor standards).
By the update of IEC 61672-1:2013, however, the technical specifications of time-weighting I has been removed. It is also noted that, by the previous update of IEC 61672-1 in 2002, this IEC standard, in its Annex C, mentioned as follows:
“Various investigations have concluded that time-weighting I is not suitable for rating impulsive sounds with respect to their loudness. Time-weighting I is also not suitable for assessing the risk of hearing impairment, nor for determining the “impulsiveness” of a sound. Because of the possibility of obtaining misleading results, time-weighting I is not recommended for the purposes described above.”
Therefore, it was a matter of time to withdraw the specification. Eventually, the method of this Annex E became unable to maintain, and the technical contents of this Annex had been removed. The 12th Edition ECMA-74 is the last edition to contain Annex E with an objective method for the detection of impulsive noise using the time-weighting I.
For such historical reasons and also for the possibility of future development of another method for impulsive noise detection, this informative Annex E remains with the same title, at least, in this edition.

114 © Ecma International 2018

© Ecma International 2018 115
Annex F (informative)
A hearing model approach to calculate psychoacoustic parameters
F.1 Scope
This annex describes a perception-model-based procedure for determining the specific loudness of a sound. This result can be used as basis for further psychoacoustic analyses. The described psychoacoustic hearing model transforms calibrated sound pressure data into psychoacoustic loudness[32], from which subsequent calculations can be made.
F.2 Annex status
Although this annex is informative, it contains requirements for fulfilment when its procedures are referenced normatively by another standard or test code. These requirements are generally identified through the use of the prescriptive word “shall”.
F.3 Psychoacoustic hearing model
F.3.1 Overview
Figure F.1 displays the basic hearing model structure for calculating specific loudness as the basis for determining other psychoacoustic sensations. Subsequently, the different signal processing blocks of the
hearing model are briefly explained. The input signal is a discrete time signal containing sound pressure
values with a sampling rate of kHz3.
3The common sampling rate kHz is chosen to ensure that the entire audible frequency range is covered. In the
following, the coefficients of some of the digital filters are given only for the sampling rate kHz. If input data is
sampled at a different rate, resampling to 48 kHz needs to be performed.

116 © Ecma International 2018
Figure F.1 — Basic hearing model structure.
F.3.2 Outer and middle ear filtering
F.3.2.1 Theory
The pre-processing consists of filtering the input signal with outer and middle ear transfer functions. The
transfer function of the filter is chosen such that the filtering together with the loudness threshold (as
explained in Section F.3.7) leads to a loudness estimation emulating the equal-loudness contours from 20 to
90 phon (with a step size of 10 phon) and the lower threshold of hearing.4 The filter is optimized on the equal-loudness contours of ISO 226:2003 for frequencies higher than 1 kHz. For lower frequencies, the equal-loudness contours of ISO 226:1987 are chosen as target because there is a large uncertainty of the experimental data at low frequencies[34] and in addition recent studies showed that the less noise-sensitive curves of ISO 226:2003 do underestimate low-frequency noise issues[35],[36]. Thus, the more sensitive curves are preferred.
4 In Zwicker’s loudness model[33] the influence of the outer and middle ear transfer functions is considered by the ear’s transmission characteristic .

© Ecma International 2018 117
Figure F.2 — Mixed equal loudness contours (ISO 226:1987 for f ≤ 1 kHz, ISO 226:2003 for f > 1 kHz) used as target for the filter transfer function.
The lower threshold of hearing is taken from ISO 226:2003 for all frequencies as the minimum of both versions of ISO 226 to be more sensitive to tonal noise. This corresponds also to the data of the lower threshold of hearing published in ISO 389-7:2005. The target equal-loudness contours are illustrated in Figure F.2. An evaluation of the hearing model showing the emulated equal-loudness contours is given in Section F.3.8.
F.3.2.2 Implementation
The transfer function of the resulting filter is shown in Figure F.3. For numerical reasons, it is recommended to
implement this high-order filter as serially-cascaded second-order filters . The filter function
is then defined as
(F.1)
Each second-order filter can be implemented using the recursive Formula (F.2)
(F.2)
with input and output . The corresponding filter coefficients are given in Table F.1.
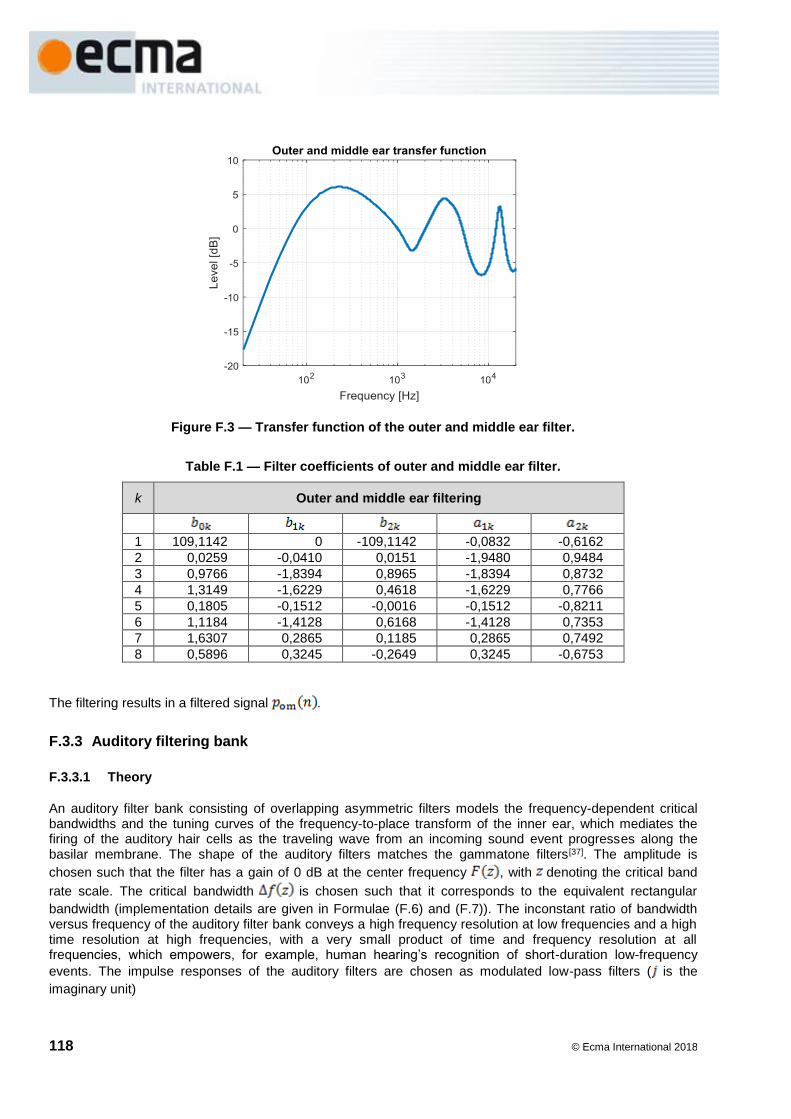
118 © Ecma International 2018
Figure F.3 — Transfer function of the outer and middle ear filter.
Table F.1 — Filter coefficients of outer and middle ear filter.
k Outer and middle ear filtering
1 109,1142 0 -109,1142 -0,0832 -0,6162
2 0,0259 -0,0410 0,0151 -1,9480 0,9484
3 0,9766 -1,8394 0,8965 -1,8394 0,8732
4 1,3149 -1,6229 0,4618 -1,6229 0,7766
5 0,1805 -0,1512 -0,0016 -0,1512 -0,8211
6 1,1184 -1,4128 0,6168 -1,4128 0,7353
7 1,6307 0,2865 0,1185 0,2865 0,7492
8 0,5896 0,3245 -0,2649 0,3245 -0,6753
The filtering results in a filtered signal .
F.3.3 Auditory filtering bank
F.3.3.1 Theory
An auditory filter bank consisting of overlapping asymmetric filters models the frequency-dependent critical bandwidths and the tuning curves of the frequency-to-place transform of the inner ear, which mediates the firing of the auditory hair cells as the traveling wave from an incoming sound event progresses along the basilar membrane. The shape of the auditory filters matches the gammatone filters [37]. The amplitude is
chosen such that the filter has a gain of 0 dB at the center frequency , with denoting the critical band
rate scale. The critical bandwidth is chosen such that it corresponds to the equivalent rectangular
bandwidth (implementation details are given in Formulae (F.6) and (F.7)). The inconstant ratio of bandwidth versus frequency of the auditory filter bank conveys a high frequency resolution at low frequencies and a high time resolution at high frequencies, with a very small product of time and frequency resolution at all frequencies, which empowers, for example, human hearing’s recognition of short-duration low-frequency
events. The impulse responses of the auditory filters are chosen as modulated low-pass filters ( is the
imaginary unit)

© Ecma International 2018 119
(F.3)
The filters are calculated using the low-pass function
(F.4)
where is the filter order5, is the unit step function and the exclamation mark denotes the factorial
operation. is a time constant, related to by
(F.5)
The center frequencies and corresponding bandwidths of the filter bank are calculated as
(F.6)
and
(F.7)
with denoting the critical band rate scale. Values for are chosen from 0,5 to 26,5 with a step size of
Hz and . These functions and settings lead to a better
matching to the Bark table by Zwicker[33] than other existing formulae, as documented in detail in Reference [32].
As discrete approximation of the low-pass filter,
(F.8)
with time index and is used6; depends on the filter order and is given below for a
specific value of .The band-pass filtering using can be implemented using the discrete approximation
of the band-pass filter
(F.9)
5 Filter order is used.
6 kHz is the sampling rate.

120 © Ecma International 2018
F.3.3.2 Implementation
In the following, instructions for the implementation of the auditory filters are given: Digital filtering can be implemented using the recursive Formula (F.10)
(F.10)
For the discrete low-pass filter as described in Formula (F.8), the real-valued filter coefficients are
(F.11)
and
(F.12)
With a used filter order of the coefficients in Formula (F.8) and in Formula (F.12) are given as
and . As explained above, with as defined in
Formula (F.5).
The coefficients and can be used for the implementation of the discrete approximation of the low-pass
function given in Formula (F.4)(F.8). However, to obtain the discrete approximation of the band-pass filter in Formula (F.9), the filter coefficients of the low-pass filter must be modified to:
(F.13)
and
(F.14)
with a sampling rate of kHz. Using these modified filter coefficients in the recursive Formula (F.10)
results in a discrete implementation of the auditory filters. The filter results in a complex-valued band-pass signal with a single-sided spectrum. Two times the even part of the spectrum of this signal corresponds to the real-valued band-pass signal. Thus, the real-valued band-pass signal can be determined as the double real part of the complex result.
The auditory filter bank results in band-pass signals centered around the critical band rate
scale values ranging from 0,5 to 26,5, thus leading to an extension of the Bark scale to higher frequencies
using 53 critical band filters with an overlap of 50 %.
F.3.4 Rectification
Subsequent half-wave rectification accounts for the fact that the auditory nerves fire only when the basilar membrane vibrates in a specific direction[38]. The resulting band-pass signals are calculated as

© Ecma International 2018 121
(F.15)
F.3.5 Calculation of root-mean-square values
For further processing, segmentation into blocks needs to be performed and blockwise root-mean-square
(RMS) values need to be calculated. For the segmentation, the band-dependent block size and the hop
size7 can be chosen depending on the application. Values for and for the calculation of the
psychoacoustic tonality are given in Annex G (Section G.5.2, Table G.1).
The segmentation can be described as
(F.16)
with , where the time index describes the block number of each block, starting with
(corresponding to a time of 0 ms). With this definition, each block ranges from
to . For negative time indices , is set to zero.
With the segmented blocks , the RMS-values are calculated for each block as
(F.17)
The factor of 2 is necessary to compensate for the signal energy, which was lost due to the half-wave
rectification. The dependency on the time index is dropped in the following, since the further processing
steps are applied to each time block in the same way.
F.3.6 Nonlinearity to transform sound pressure into specific loudness
The compressive nonlinearity of the auditory system is significant for the loudness perception. The specific loudness distribution, resulting from the application of this nonlinearity to the excitation pattern, also forms the basis for calculating other psychoacoustic parameters such as tonality, roughness or fluctuation. Such a nonlinearity function has proven applicable to predict many phenomena like ratio loudness, just-noticeable amplitude differences and modulation thresholds as well as the level dependence of roughness.
The nonlinearity between specific loudness and sound pressure was reconsidered in the hearing model according to results of many listening tests[39]. Further improvements for higher levels above approximately 80 dB were achieved by introducing a nonlinearity function according to Formula (F.18)
(F.18)
7 The hop size is the time shift to the next calculation block, smaller than block size if overlapping is used. It is related to the percent overlap by

122 © Ecma International 2018
with root-mean-square values of sound pressure and thresholds in Pa, µPa. The thresholds
can be derived from Table F.2; is set to 1,5; is a normalization constant with the unit
sone/Bark to assure that the total loudness of a sinusoid having a frequency of 1 kHz and a sound pressure
level of 40 dB equals 1 sone. The exponents as given in Table F.2 were achieved by applying a
nonlinear-optimization procedure in order to minimize the root-mean-square error between the results of the
loudness matching experiment and the results of the model calculation. The initial exponent is set to 1.
Table F.2 — thresholds and exponents for the nonlinearity function according to Formula (F.18)
dB]
I
The nonlinearity is applied to in each band . The resulting variable
(F.19)
can be interpreted as the specific loudness of the signal without consideration of the threshold in quiet.
The function according to Formula (F.18) results from an optimization procedure to fit the experimental data with the lowest root-mean-square error[39]. It has a steep slope at high levels, which agrees with results of experiments from Buus et al.[40] and Epstein et al.[41].
F.3.7 Consideration of threshold in quiet
The specific loudness in each band is zero if it is at or below a critical-band-dependent specific loudness
threshold . The band-specific loudness threshold is given for each used band number from
0.5 to 26.5 in Table F.3. Figure F.4 shows the loudness threshold in dependency of the frequency of
the bands.
Table F.3 — Specific loudness threshold for each used value of .
0.5 0.6861954 6.0 0.0361308 11.5 0.0072384 17.0 0.0070092 22.5 0.0405832
1.0 0.3265776 6.5 0.0307362 12.0 0.0069740 17.5 0.0073169 23.0 0.0548518 1.5 0.2132888 7.0 0.0260436 12.5 0.0070014 18.0 0.0080579 23.5 0.0774839
2.0 0.1567351 7.5 0.0219612 13.0 0.0071200 18.5 0.0093904 24.0 0.0968910
2.5 0.1223881 8.0 0.0184365 13.5 0.0072377 19.0 0.0114193 24.5 0.1458987
3.0 0.0990509 8.5 0.0154568 14.0 0.0073111 19.5 0.0141831 25.0 0.3201426
3.5 0.0819856 9.0 0.0130697 14.5 0.0073226 20.0 0.0176473 25.5 0.6030267
4.0 0.0688422 9.5 0.0114783 15.0 0.0072715 20.5 0.0216684 26.0 1.0467875
4.5 0.0583246 10.0 0.0113849 15.5 0.0071709 21.0 0.0259394 26.5 1.8246805
5.0 0.0496615 10.5 0.0113818 16.0 0.0070509 21.5 0.0300498
5.5 0.0423689 11.0 0.0083464 16.5 0.0069663 22.0 0.0341089

© Ecma International 2018 123
Figure F.4 — Specific loudness threshold
The lower threshold of hearing is applied by subtraction and a limiter:
(F.20)
The result is the specific loudness of the signal. The specific loudness can be used as basis for other
psychoacoustic parameters such as tonality (see Annex G).
A signal is taken to be audible when its total loudness value exceeds 0,01 sone, where total loudness is
calculated summing all specific loudness values, using as
(F.21)
Consideration of both total and specific loudness has the benefit of allowing loudness summation of sounds consisting of multiple components near threshold. This approach must be studied and perhaps optimized later
together with different weighting of the loudness of tonal and non-tonal components.8
F.3.8 Evaluation
The psychoacoustic loudness calculation is evaluated by comparison with the target equal-loudness contours as shown in Figure F.2. The loudness was calculated for sinusoidal signals with a frequency of 1000 Hz and a sound pressure level of 20 to 90 dB with a step size of 10 dB. For other frequencies, the level was varied to match the loudness calculated for the 1000 Hz tone. The same procedure was performed for the lower threshold of hearing. The results are shown in Figure F.5. The target equal-loudness contours are emulated well by the results of the hearing model.
8 Recent investigations showed that the existing loudness procedures underestimate the loudness of tonal signals [42].

124 © Ecma International 2018
Figure F.5 — Results for the equal-loudness contours. The dotted lines show the target equal-loudness contours, the solid lines are the equal-loudness contours obtained with the hearing model.

© Ecma International 2018 125
Annex G (informative)
Identification and evaluation of prominent tonalities using a
psychoacoustic tonality calculation method
G.1 Scope
This annex describes a perception-model-based procedure for determining whether or not noise emissions contain prominent tonalities, and if present, their strengths: the psychoacoustic tonality calculation method. A similar approach was published in 1998 for the determination of “pitch salience” [43]. The calculation is based on the specific loudness as described in Annex F.
Prominent perceived tonalities arise from a variety of causes including but not limited to prominent discrete tones: discrete tones, non-pure tones, narrow elevated noise bands, combinations of tones and narrow elevated noise bands, band-edges of various slopes terminating elevated noise bands of various bandwidths, and combinations of these. This annex defines a procedure for identifying and ranking tonalities from any causes.
G.2 Annex status
Although this annex is informative, it contains requirements for fulfilment when its procedures are referenced normatively by another standard or test code. These requirements are generally identified through the use of the prescriptive word “shall”.
G.3 Psychoacoustic background
G.3.1 Tone-to-Noise Ratio (TNR), Prominence Ratio (PR) (both Annex D), and Psychoacoustic Tonality Calculation Method (Annex G), comparative basis
The discrete-tone tonality methods described in Annex D may be considered hybrids, as they apply a psychoacoustic concept (the critical bandwidth) but operate with conventional sound pressure level information rather than perception-based level information (loudness) as input data. Thus, they do not inherently consider loudness-based perceptual tonal masking variation and the threshold of hearing, though an auxiliary procedure for hearing threshold compensation has been described.
G.3.2 Rationale for a pure-psychoacoustic method
By operating entirely in the psychoacoustic domain using the well-established Zwicker specific loudness procedure and then a hearing model to separate the loudness of tonal and non-tonal components, a unitary basis is established inherently considering the hearing threshold, loudness-level-dependent masking, and frequency-dependent masking. In this way, the psychoacoustic tonality calculation method provides an objective means for evaluating perceivable tonalities due to individual and combined tonal features at any loudness values.
Single-critical-band tonality calculation methods such as the tone-to-noise ratio method can misrepresent the perceived tonality of a situation involving, for example, a narrow-elevated noise band in close conjunction with

126 © Ecma International 2018
a discrete tone, where a majority of the level of the narrow noise band, as well as the discrete tone, both occupy the critical bandwidth centered on the discrete tone. Because a single-critical-bandwidth method cannot recognize when a non-tonal noise level inside a centered band is not continued outside that critical band, it assigns any noise level inside the centered critical bandwidth as a masker, whereas in a case as described it is a source of perceived tonality which adds to the perceived tonality due to the discrete tone.
G.4 Determination of tonality
G.4.1 Tonalities and their relationships to the threshold of hearing
Discrete tones or other tonalities should only be classified as prominent if they are, in fact, audible in the noise emissions of the equipment under test. For the tonality calculation methods as described in Annex D, a pre-calculation screening test is recommended concerning audibility of the tonality. From calibrated acoustical measurement time-data, this step is not required with the psychoacoustic tonality calculation method regardless of proximity to the threshold of hearing because the method inherently considers the threshold of hearing and the psychoacoustic loudness of tonal and non-tonal components.
NOTE Normalization of noise near threshold of hearing is not required as described in Annex D.7 if the evaluation with the psychoacoustic tonality calculation method is performed.
G.4.2 Multiple tones in a critical band, and time-variation of tonality due to their interaction
The noise emitted by a machine may contain multiple tones or narrowband tonalities, several of which may fall within a single critical band. Besides the likelihood of increased overall tonality strength due to a plurality of tones within one critical bandwidth, there is a strong likelihood of beating interference between or among the plural tonalities causing time structure (amplitude modulation): periodic additions and cancellations affecting the strength of the perceived tonality within that critical band.
G.5 Psychoacoustic tonality calculation method
G.5.1 Overview
Tonality perceptions arising from spectrally-elevated noise bands of various widths and slopes and from non-pure tones as well as from discrete (pure) tones, and from combinations of these, can be mis-measured or escape measure in “hybrid” sound pressure based tools and tools sensitive only to discrete tones. To address such issues, a new psychoacoustically-based tonality calculation method based on the hearing model in Annex F[44] was developed. The applicability of the model was investigated for technical sounds and compared to established methods of tonality calculation[45]-[47]. The method automatically considers the threshold of hearing because the hearing threshold is built into the hearing model[47].
Recent research results show a strong correlation between tonality perception and the partial loudness of tonal sound components[48]-[50]. Therefore, the new hearing model approach to tonality on the basis of the perceived loudness of tonal content has been developed. The new model evaluates the nonlinear and time-dependent specific loudness of both tonal and broadband components, which are separated using the autocorrelation function. This model has been validated by many sound situations and listening tests [45].
In early publications, Licklider assumed that human pitch perception is based on both spectral and temporal cues[51]. According to Licklider, the neuronal processing in human hearing applies a running autocorrelation analysis of the critical band signals. Under this assumption, psychoacoustic tonality phenomena like difference-tone perception or the missing-fundamental phenomenon can be explained.

© Ecma International 2018 127
This work inspired the idea to use the sliding autocorrelation function as a processing block in the hearing model for the calculation of roughness and fluctuation strength[44],[52],[53] and later for other psychoacoustic quantities like tonality[45] and loudness[32]. The psychoacoustic tonality calculation is based on scaled ACFs
(see Section G.5.2, with denoting the critical band rate scale and denoting the lag), which are
calculated using the specific loudness (see Formula (F.20)) and the rectified band-pass
signals (see Section F.3.4) as described in Annex F.
The further processing for tonality calculation is performed similarly as published in References [45]-[47] as shown in Figure G.1 and described in detail as follows:
Figure G.1 — Calculation of tonality based on the scaled ACFs as described in Reference [45], but with frequency-dependent analysis window borders.
G.5.2 Autocorrelation function
Recently, it was proposed to use the autocorrelation function of the band-pass signals to separate tonal content from noise[32]. The autocorrelation function of white Gaussian noise is characterized by a Dirac impulse. Any broadband noise signal has at least a non-periodic autocorrelation function with high values at low lags, whereas the autocorrelation function (ACF) of periodic signals shows also a periodic structure [54]. Thus, the loudness of the tonal component can be estimated by analyzing the ACF at a certain range with
respect to the lag , and also the loudness of the remaining (noisy) part.The calculation of the sliding ACF is
time-consuming. Therefore, the sliding ACF is calculated block-wise using the DFT to shorten computing time. An overlap of 75% is used for neighboring blocks. There is a low-pass effect due to averaging over the block
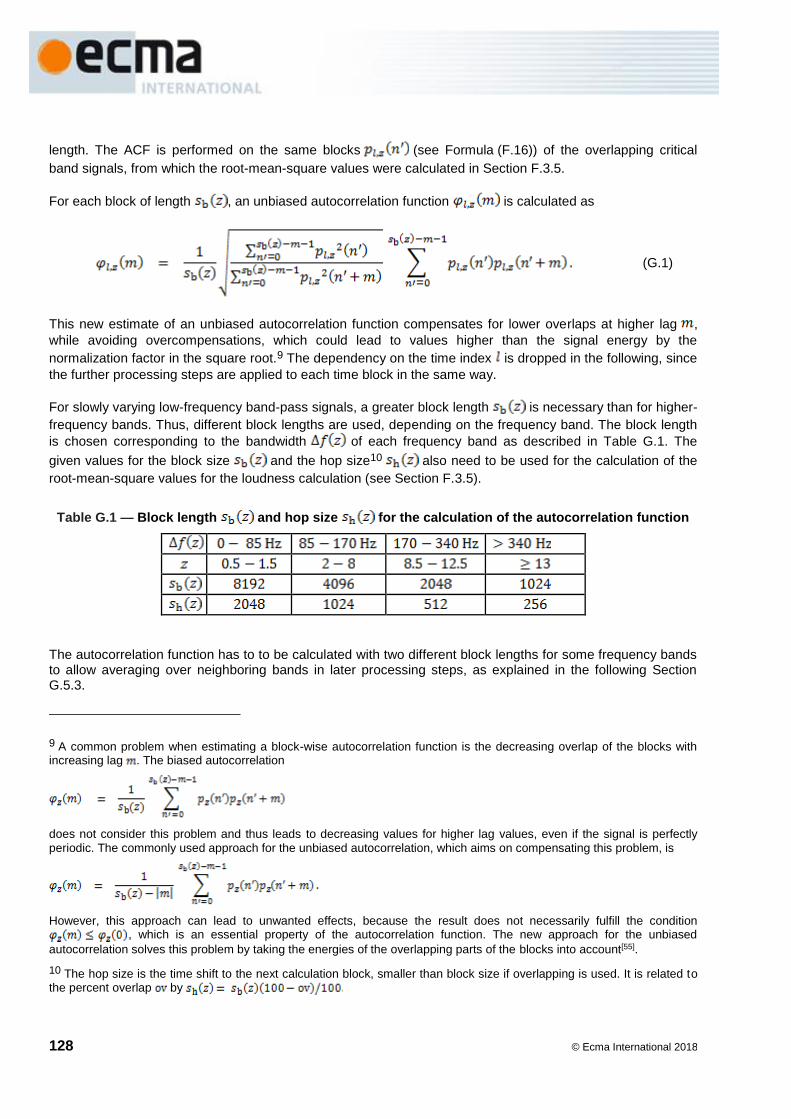
128 © Ecma International 2018
length. The ACF is performed on the same blocks (see Formula (F.16)) of the overlapping critical
band signals, from which the root-mean-square values were calculated in Section F.3.5.
For each block of length , an unbiased autocorrelation function is calculated as
(G.1)
This new estimate of an unbiased autocorrelation function compensates for lower overlaps at higher lag ,
while avoiding overcompensations, which could lead to values higher than the signal energy by the
normalization factor in the square root.9 The dependency on the time index is dropped in the following, since
the further processing steps are applied to each time block in the same way.
For slowly varying low-frequency band-pass signals, a greater block length is necessary than for higher-
frequency bands. Thus, different block lengths are used, depending on the frequency band. The block length
is chosen corresponding to the bandwidth of each frequency band as described in Table G.1. The
given values for the block size and the hop size10 also need to be used for the calculation of the
root-mean-square values for the loudness calculation (see Section F.3.5).
Table G.1 — Block length and hop size for the calculation of the autocorrelation function
The autocorrelation function has to to be calculated with two different block lengths for some frequency bands to allow averaging over neighboring bands in later processing steps, as explained in the following Section G.5.3.
9 A common problem when estimating a block-wise autocorrelation function is the decreasing overlap of the blocks with increasing lag . The biased autocorrelation
does not consider this problem and thus leads to decreasing values for higher lag values, even if the signal is perfectly
periodic. The commonly used approach for the unbiased autocorrelation, which aims on compensating this problem, is
However, this approach can lead to unwanted effects, because the result does not necessarily fulfill the condition , which is an essential property of the autocorrelation function. The new approach for the unbiased
autocorrelation solves this problem by taking the energies of the overlapping parts of the blocks into account[55].
10 The hop size is the time shift to the next calculation block, smaller than block size if overlapping is used. It is related to the percent overlap by

© Ecma International 2018 129
The entire ACF is normalized and multiplied with the specific loudness of the signal11:
(G.2)
resulting in scaled12 ACFs which can be used for further analysis of the tonality.
G.5.3 Averaging of ACFs
First, ACFs of neighboring bands are averaged in order to reduce noise. Averaging is performed over
bands, i.e., each band is averaged with the neighboring lower and higher frequency bands.
The value is chosen depending on the block size as described in Table G.2. Since averaging needs to be
performed with identical block size, it needs to be ensured that the autocorrelation function of neighboring bands is available in the same block size. Thus, for frequency bands close to block size changes, the autocorrelation function needs to be calculated with two different block sizes. If not enough neighboring
frequency bands exist (for the lower frequency bands), is reduced such that averaging is still performed
symmetrically centered around the particular frequency band. An exception is made for the lowest frequency band, which is averaged only with the second-lowest frequency band. This is necessary, because a symmetric averaging is not possible because of the missing lower band. No averaging on the other hand results in high noise artifacts.
Table G.2 — Number of bands to average depending on block size
In a next step, ACFs are averaged over neighboring blocks in time for further reduction of noise. This block
averaging is done only for the block sizes and in which case the ACF in a given block
is averaged with the ACFs in the preceding and the subsequent blocks.
The outcome of the two averaging steps is a modified, noise reduced scaled ACF .
G.5.4 Application of ACF window
A lag window with frequency-dependent limits ( and ) according to Formulae (G.3) and (G.4)
is applied to the ACF to separate tonal from noisy content:
(G.3)
(G.4)
Here is the bandwidth of the critical band centered at , is 2 ms.
11 is the specific loudness calculated in Formula (F.20).
12 The ACF is scaled such that represents the specific loudness .

130 © Ecma International 2018
It can be shown that the autocorrelation function of a periodic signal is itself periodic [54]. In the case of a pure tone, the period of the ACF equals the period of the tone. Consequently, the signal energy of a pure tone can be identified at multiples of the signal period. For white Gaussian noise, the autocorrelation function is a Dirac impulse, weighted by the power spectral density of the noise[54]. In case of broadband white noise, the autocorrelation function converges towards a Dirac impulse.
0 20 40 60 80
-8
-4
0
4
8ACF window
t0
tstart tend
t / ms
Figure G.2 — Positioning of the ACF window for tonal content separation. This example shows the autocorrelation function of a tone in pink background noise.
Figure G.2 visualizes the placement of the ACF window for the autocorrelation function of a tone in pink
background noise.13
G.5.5 Estimation of tonal loudness
The specific loudness of the tonal component is estimated by evaluating the spectrum of the ACF inside the
lag window whose length depends on the sample rate and the lag limits of Formulae (G.3) and (G.4). First,
the mean value of the windowed ACF is removed. This windowed ACF with removed mean is named
in the following. Second, a -point DFT14 of the samples is performed by zero padding, where is the
block size given in Table G.1:
(G.5)
Next, a frequency range is defined for a maximum search in the spectrum:
(G.6)
13 The motivation for the limits given in Formulae (G.3) and (G.4) is as follows: In Figure G.2, the energy distribution at small lags results from the noisy background and is disregarded by appropriately choosing the lower window border.
Nevertheless, narrow-band noise also causes a perception of tonality when the bandwidth is kept comparatively low (i.e. few critical bands). This effect leads to a compromise for the placement of the window borders: For a lower bandwidth, the
effect of the low-pass filtered noise on the ACF reaches higher lags than for a larger bandwidth. Thus the window needs to be moved to higher lags for a lower bandwidth. On the other hand, higher lags are less reliable, since they are calculated
from a smaller number of samples. Therefore, the upper limit of the window should not be chosen too large.
14 The N-point DFT is defined as .

© Ecma International 2018 131
The maximum of the spectrum in the defined frequency range is searched, meaning, that the largest tonal content is extracted:
(G.7)
is a first estimation of the specific loudness of the tonal component. The frequency of this
component in the critical band centered around can be estimated by first finding the DFT index
corresponding to the maximum of .
(G.8)
and calculating the corresponding frequency
(G.9)
While this approach is capable of analyzing tonalities with a rather high frequency resolution, it might underestimate tonal content when the corresponding frequency changes quickly inside of one block. This should be considered, even though the adaptive block size with smaller blocks for high frequencies aims on reducing this problem, since quickly varying frequencies usually occur at high frequencies.
G.5.6 Resampling to common time basis
For the further processing, the dependency of the time of each processed block becomes important. Thus, the
time index (introduced in Section G.5.2) needs to be considered. Since the results of different bands are in a
different time basis at this stage of the processing due to a different block length, the bands with a higher block size are resampled to correspond to the time basis of the blocks calculated with the smallest block size
of 1024. The time index corresponding to this block size is used in the following. Thus, denotes
the estimation of the specific loudness of the tonal component in the critical band centered around at time
index . The sampling rate of these estimations is .
G.5.7 Noise reduction
is a first estimation of the specific loudness of the tonal component. However, the specific
loudness of the tonal component is usually overestimated at this stage of the estimation process due to the tonal character of noise in the narrow-band filtered bands. Thus, further noise reduction is necessary. This is
done by application of nonlinear sigmoid weighting of tonal vs. noise components. is the tonal part
of the specific loudness of the complete band-pass signal. The corresponding specific loudness of the complete band-pass signal is given by the autocorrelation function at zero lag:
(G.10)
A first approximation of the signal-to-noise ratio in the band of interest can be derived as

132 © Ecma International 2018
(G.11)
Since the estimation of the tonal component might contain unsteady parts, low-pass filtering is performed over
the temporal dimension of and . A cutoff frequency of 3,5 Hz is used. The filter defined in
Formula (F.8) is used with order . The filter coefficients of the low-pass filter can be calculated
according to formulae (F.11) and (F.12).15 The filtered signals are then
(G.12)
and
(G.13)
where denotes the convolution. These filtered signals are used for further processing in Formulae (G.14)
and (G.16).
Band-dependent noise reduction is achieved by weighting the filtered specific loudness of the
tonal component by a sigmoid function
(G.14)
with parameters and as given in Table G.3. Sigmoidal weighting significantly reduces wrongly-detected
specific loudness of tonal components for broadband signals. The frequency dependent factor is
calculated as
(G.15)
where the parameters and are chosen depending on the blocksize (see Table G.1). This function
mitigates frequency-dependent overestimations of the tonality estimation (due to the different block sizes)
such that is approximately constant over for pink noise signals.
The specific loudness of the tonal component, , is then modelled as
(G.16)
The parameters , , are given in Table G.3, and are given in Table G.4.
15 For Formula (F.12) the following factors have to be used for a filter order of : .

© Ecma International 2018 133
Table G.3 — Parameters for the noise reduction function (Formula (G.14)).
Parameter
Value 20 0,07
Table G.4 — Parameters for the frequency dependent factor (Formula (G.15)).
G.5.8 Calculation of time-dependent specific tonality
The perceived tonality is not only dependent on the tonal content in each band, but also on the signal-to-noise
ratio over all bands at each time instance . Thus, to finally model the tonality of the signal, the overall
loudness signal-to-noise ratio is evaluated across all bands. First, a new estimation of the specific loudness of the noise component is calculated, using the final estimation of the specific loudness of the tonal component:
(G.17)
The overall loudness signal-to-noise ratio is calculated as
(G.18)
A scaling factor
(G.19)
is applied multiplicatively. The parameters and are given in Table G.5.
Table G.5 — Parameters for the scaling factor (Formula (G.19)).
Parameter
Value 35 0,003
Thus, the final estimation of the time-dependent specific tonality is given as
(G.20)
where is a calibration factor.
The unit of the tonality calculated by the psychoacoustic tonality method is given in tuHMS (tonality units according to the hearing model of Sottek described in Annex F). The psychoacoustic tonality method is calibrated using a 1 kHz tone with a sound pressure level of 40 dB. The tonality value shall be for this signal 1 tuHMS.

134 © Ecma International 2018
G.5.9 Calculation of representative values
The specific tonality is taken by averaging the time-dependent specific tonality . The averaging is
performed as follows:
1. The first tonality values for (approximately corresponding to the first 300 ms of the
input signal) are discarded due to the transient responses of the digital filters.
2. Only values that exceed a specific tonality value of 0,02 tuHMS are used for averaging. This step
ensures that the single value is independent of parts of the signal without noticeable tonal
components.
This averaging can be described mathematically as
(G.21)
with
(G.22)
using set notation16. The frequencies are calculated by accordingly averaging the frequency
over corresponding time indices:
(G.23)
G.5.10 Calculation of time-dependent tonality
The time-dependent tonality is taken as the maximum of the time-dependent specific tonalities
over all bands . If the user is only interested in one specific tonal event, a user defined frequency range
can be specified. In this case, only critical bands centered around with the properties
(G.24)
and
(G.25)
are considered. The resulting critical bands between and are used for the maximum search:
(G.26)
16 In set notation, denotes all elements with the property . denotes the cardinality (i.e. the
number of elements) of a set .

© Ecma International 2018 135
The corresponding frequency is given as
(G.27)
where is the band in which the maximum of the time-dependent specific tonality was found for
a given time instance .
G.5.11 Calculation of representative values
The single value of the tonality of the signal is taken by averaging the time-dependent overall tonality .
The averaging is performed in the same way as described in Formula (G.21)
(G.28)
with
(G.29)
G.5.12 Application example
Figure G.3 shows analysis results for a frequency-modulated signal with a low modulation rate of 2 Hz, a modulation index of 150 at a frequency of 2 kHz and with very low sound pressure (L = 30 dB).
From top to bottom, it shows:
1. the spectrum (FFT size 65536, sampling rate 48 kHz), a smoothed spectrum (1/24th octave smoothed FFT: the “background noise”, useful to show general shapes while not resolving pure tones), and a 1-critical-bandwidth peak-hold spectrum as “critical bandwidth ruler”;
2. the Tone-to-Noise Ratio results along with the TNR tolerance line (Annex D); 3. the Prominence Ratio (PR) calculated as a full spectrum for each frequency of interest (Specific
Prominence Ratio, SPR), both with and without recognition only of pure tones, along with the PR tolerance line (Annex D).
TNR and PR fail since the corresponding tolerance lines are not exceeded. Only SPR shows a marginal value for a signal with a clearly prominent tonality (even though at a very low sound pressure level).

136 © Ecma International 2018
Figure G.3 — Top: Different spectral representations (FFT and smoothed FFT) of a frequency-modulated tone; Middle: corresponding TNR results (scale gives dB of tonal audibility); Bottom:
corresponding PR values tones-only (according to Annex D) using critical bands (CB) and complete SPR not constrained only to pure tones results.

© Ecma International 2018 137
Figure G.4 depicts the specific psychoacoustic tonality analysis of the same sound as shown in Figure G.3 with a distinct tonal content: The location of the maximum of the specific tonality is changing over time, but the magnitude is almost constant, leading to a stable tonality prediction based on the assumption that the perceived tonality is taken as the maximum of the specific tonality. This corresponds well to the auditory impression.
Figure G.4 — Specific psychoacoustic tonality analysis of the same sound used as source for the results of the analyses shown in Figure G.3.
G.5.13 Evaluation
The psychoacoustic tonality is evaluated by comparison with listening test results. As a reference, PR is also added to the comparison. TNR values were also calculated. However, since they were very similar to the results of the PR, they are not displayed in the results for reasons of clarity.
For the listening tests, mixtures of a sinusoidal tone with a frequency of 1000 Hz with different levels and pink noise with different levels were used. Thus, the effect of different signal-to-noise-ratios can be evaluated for different levels. Five different tests were performed. In all five tests, the level of the pink noise was varied from 40 dB SPL to 80 dB SPL with a step size of 5 dB SPL. The tests differed in the level of the sinusoidal tone, which was chosen from 55 dB SPL to 75 dB SPL with a step size of 5 dB SPL.
The tests were performed with 16 test subjects. The test subjects were asked to rate the tonality of each sound on a 13-pt categorical scale (ranging from “0 - not tonal” to “12 - extremely tonal”). To compare the results of the listening tests with the results of the psychoacoustic model, a linear scaling factor was used for the results of the listening tests. Another scaling factor was used to map the results of the listening tests to the results of the PR. The scaling factors were derived by minimizing the root-mean-square error between the mean ratings of all participants and the calculated psychoacoustic tonality (or the PR, respectively) of all five experiments.
The results of the evaluation are shown in Figure G.5. The results illustrate one problem of the PR: it decreases linearly for decreasing SNR. The tonality perception however does not decrease linearly according to the experimental results. The results of the psychoacoustic hearing model fit much better to the perceived tonality.

138 © Ecma International 2018
Figure G.5 — Psychoacoustic tonality and Prominence Ratio compared to results of listening tests.
Since experimental results are subject to statistical uncertainty, the variance of the results need to be considered. Thus, an error measure was defined, taking into account the 95 % confidence interval of the results. First, the results of the psychoacoustic tonality were scaled such that they are comparable to the tonality ratings of the listening tests. The experimental results are compared to the scaled psychoacoustic tonality. If the psychoacoustic tonality lies within the 95 % confidence interval, no error is assumed. If it is outside of the confidence interval, the error is taken as the difference to the confidence interval. The root-mean-square error of this value is calculated. An error for the PR was calculated in the same way, scaling the PR to make it comparable with the results of the listening tests.
The better performance of the psychoacoustic hearing model is also reflected in this error measure. For the psychoacoustic tonality, the error measure over all five experiments (related to the 13-pt categorical scale) was 0,21, for the PR it was 0,70, for the TNR (not shown in the figures) it was 0,74.
Further application examples related to IT equipment can be found in Reference [56].

© Ecma International 2018 139
G.6 Information to be recorded for prominent tonalities
For stationary sounds, a tonal component in the critical band is identified as prominent, if the specific
tonality exceeds a value of 0,4 tuHMS. For each tonal component that has been identified as
prominent according to this annex, the following information shall be recorded:
a) the user defined frequency range for searching prominent tonalities (Formulae (G.24) and
(G.25));
b) the frequency, , in hertz, of the tonality in the corresponding critical band (see Formula
(G.23));
c) details of the method used to evaluate the tonality (G.5 psychoacoustic tonality calculation method), together with a reference to this Standard;
d) the psychoacoustic tonality value (see Formula (G.21)).
For non-stationary sounds, a signal is considered to contain prominent tonalities, if the time-independent
single value of the time-dependent tonality exceeds a value of 0,4 tuHMS (see Formula (G.28) If the
signal has been identified to contain prominent tonalities according to this annex, the following information shall be recorded:
a) the user defined frequency range for searching prominent tonalities (Formulae (G.24) and
(G.25));
b) the time-dependent frequency, , in hertz (see Formula (G.27)) of the time-dependent tonality ;
c) details of the method used to evaluate the tonality (G.5 psychoacoustic tonality calculation method), together with a reference to this Standard;
d) the time-dependent psychoacoustic tonality value (see Formula (G.26)).
e) the time-independent single value (see Formula (G.28)).
NOTE The criterion for prominence of tonalities for the psychoacoustic tonality calculation method (G.5) is
independent of frequency 0,4 tuHMS (tonality units according to the hearing model of Sottek described in Annex F).
140 © Ecma International 2018

© Ecma International 2018 141
Bibliography
[1] ISO 389-7, Acoustics — Reference zero for the calibration of audiometric equipment — Part 7:
Reference threshold of hearing under free-field and diffuse-field listening conditions
[2] ISO 12001:1996, Acoustics — Noise emitted by machinery and equipment — Rules for the drafting
and presentation of a noise test code
[3] ISO 80000-8:2007, Quantities and units — Part 8: Acoustics
[4] ECMA TR/27, Method for the prediction of installation noise levels. Available (2010-07-14) at:
http://www.ecma-international.org/publications/files/ECMA-TR/TR-027.pdf
[5] (Intentionally blanked)
[6] (Intentionally blanked)
[7] FEIERFEIL, P.-J., SCHAFFERT, E. Geräuschemission von Geräten der Büro- und Informationstechnik [Noise
emission by office and information technology equipment]. Wirtschaftsverlag NW, Verlag für neue
Wissenschaft, Bremerhaven. (Schriftenreihe der Bundesanstalt für Arbeitsschutz [Federal Institute for
Industrial Safety publications series], Report 481, Vol. 1.)
[8] DUNENS, E.K. Measurement of the sound power emitted by small sound sources with a reduced radius
hemispherical surface. In: Proceedings of Inter-Noise 2002 [CD-ROM], Dearborn, MI, 2002-08-19/21,
N374. International Institute of Noise Control Engineering, Notre Dame, IN, 2002
[9] XU, Y., LIU, Y., OLIVER, D., PARKER, J. Evaluation of smaller hemispheric measurement surface for sound
power measurement of very quiet hard disk drives. In: Proceedings of Inter-Noise 2002 [CD-ROM],
Dearborn, MI, 2002-08-19/21, N278. International Institute of Noise Control Engineering, Notre
Dame, IN, 2002
[10] BAUGH, E., GREEN, K. Numerical and experimental investigations for hard disk drive sound power level
measurements in hemianechoic rooms. In: Proceedings of Inter-Noise 2002 [CD-ROM], Dearborn, MI,
2002-08-19/21, N422. International Institute of Noise Control Engineering, Notre Dame, IN, 2002
[11] NOBILE, M.A., SHAW, J.A. The cylindrical microphone array for measuring sound power levels of noise
sources. In: Proceedings of Inter-Noise 99: The 1999 International Congress on noise control
engineering, Fort Lauderdale, FL, 1999-12, pp. 1535-1540. Institute of Noise Control Engineering of
the USA, Indianapolis, IN, 1999
[12] NOBILE, M.A., DONALD, B., SHAW, J.A. The cylindrical microphone array: A proposal for use in
international standards for sound power level measurements. In: Proceedings of Noise-Con 2000
[CD-ROM], Newport Beach, CA, 2000-12, 1PNSc2. Institute of Noise Control Engineering of the USA,
Indianapolis, IN, 2000
[13] NOBILE, M.A., SHAW, J.A., BOYES, R.A. The cylindrical microphone array for the measurement of sound
power level: Number and arrangement of microphones. In: Proceedings of Inter-Noise 2002 [CD-

142 © Ecma International 2018
ROM], Dearborn, MI, 2002-08-19/21, N318. International Institute of Noise Control Engineering,
Notre Dame, IN, 2002
[14] JBMS-74-1:2005, Measurement of airborne noise emitted by information technology and
telecommunications ─ Part 1: Colour pattern for measurement of airborne noise emitted from
printers, copiers, and their multi-functional devices.
[15] ZWICKER, E., FASTL, H. 6.3 Critical-band level and excitation level. In: Psychoacoustics: Facts and
models, pp. 165-173. Springer, Berlin, 1990. (Springer series in information sciences; 22)
[16] HELLWEG, R.D., NOBILE, M.A. Modification to procedures for determining prominent discrete tones. In:
Proceedings of Inter-Noise 2002 [CD-ROM], Dearborn, MI, 2002-08-19/21, N473. International
Institute of Noise Control Engineering, Notre Dame, IN, 2002gg
[17] UPTON, R. Possibility for errors in tone-to-noise ratio calculation arising from insufficient FFT
resolution. In: Proceedings of the 22nd National Conference on Noise Control Engineering (Noise-Con
2007) [CD-ROM], Reno, NV, 2007-10-22/24, NC07_110. Curran, Red Hook, NY, 2007
[18] KURAKATA, K., MIZUNAMI, T., MATSUSHITA, K., ASHIHARA, K. Statistical distribution of normal hearing
thresholds under free-field listening conditions. Acoust. Sci. Technol. 2005, 26, pp. 440-446
[19] KURAKATA, K., MIZUNAMI, T., MATSUSHITA, K. Percentiles of normal hearing-threshold distribution under
free-field listening conditions in numerical form. Acoust. Sci. Technol. 2005, 26, pp. 447-449
[20] ASHIHARA, K. Hearing thresholds for pure tones above 16 kHz. J. Acoust. Soc. Am. 2007, 122, pp. EL52-
EL57
[21] ZWICKER, E., TERHARDT, E. Analytical expression for critical-band rate and critical bandwidth as a
function of frequency. J. Acoust. Soc. Am. 1980, 68, pp. 1523-1525
[22] PLOMP, R. The ear as a frequency analyzer. J. Acoust. Soc. Am. 1964, 36, pp. 1628-1636
[23] ISO/TR 25417, Acoustics — Definitions of basic quantities and terms
[24] ISO 11201:1995, Acoustics — Noise emitted by machinery and equipment — Measurement of
emission sound pressure levels at a work station and at other specified positions — Engineering
method in an essentially free field over a reflecting plane
[25] Recordable Compact Disk Systems, Part III: CD-RW, Version 2.0, System Description, 1998,
Sony/Philips.
[26] Kimizuka, I, “Development of ISO 7779 Amendment 1 “Noise measurement specification for CD/DVD-
ROM drives”, INTER-NOISE 2002, N575, 2002.
[27] ISO 10996, First edition, 1999-03-01, Photography — Still-picture projectors — Determination of
noise emissions.
[28] Nobile, M. A., “Prominence Ratio Method for Discrete Tones in Noise: Computation of Adjacent
Bands”, NOISE-CON 94, 1994, p. 729 – 734.

© Ecma International 2018 143
[29] ISO 28961, Acoustics – Statistical distribution of hearing thresholds of otologically normal persons in
the age range from 18 years to 25 years under free-field listening conditions
[30] JBMIA-TR-28:2014, Recommended verification method for calibration conditions in multi-channel
simultaneous acoustical noise measurement system at: http://hyojunka.jbmia.or.jp/hyojun2/upload-
v3.2/archive/TR-28(E).pdf
[31] Nakano, T., Minorikawa, G., “Study on Evaluation Method of the tonal noise components for small
fan”, FAN2018, Darmstadt, Germany, 2018
[32] R. Sottek: A Hearing Model Approach to Time-Varying Loudness, Acta Acustica united with Acustica,
vol. 102, no. 4, pp. 725-744, 2016.
[33] H. Fastl, E. Zwicker: Psychoacoustics. Facts and Models, Springer, Berlin, Heidelberg, New York, 2006.
[34] Y. Suzuki, H. Takeshima: Equal-loudness-level contours for pure tones, J. Acoust. Soc. Am., vol. 116(2),
pp. 918-933, 2004.
[35] R. Sottek: Loudness models applied to technical sounds. Proc. Noise-Con, 2010 Baltimore, 2010.
[36] R. Sottek, F. Kamp, A. Fiebig: Perception of loudness and roughness of low-frequency sounds. Proc.
Inter-Nnoise 2012, New York, 2012.
[37] A. M. H. J. Aertsen and P. I. M. Johannesma: Spectro-Temporal Receptive-Fields of Auditory Neurons
in the Grassfrog .1. Characterization of Tonal and Natural Stimuli, Biological Cybernetics, vol. 38, no.
4, pp. 223-234, 1980.
[38] B. C. Moore: Basic auditory processes involved in the analysis of speech sounds. Philosophical
Transactions of the Royal Society of London B: Biological Sciences, 363. Jg., Nr. 1493, S. 947-963,
2008.
[39] T. Bierbaums, R. Sottek: Modellierung der zeitvarianten Lautheit mit einem Gehörmodel, Proc. DAGA
2012, Darmstadt, pp. 591-592, 2012.
[40] S. Buus, M. Florentine: Modifications to the power function for loudness. In: E. Summerfield, R.
Kompass, T. Lachmann (eds), Fechner Day 2001. Proceedings of the 17th Annual Meeting of the
International Society for Psychophysics. Berlin: Pabst, pp. 236-241, 2001.
[41] M. Epstein, M. Florentine: A test of the Equal-Loudness-Ratio hypothesis using cross-modality
matching functions, J. Acoust. Soc. Am., vol. 118(2), pp. 907-913, 2005.
[42] R. Sottek: Improvements in calculating the loudness of time varying sounds. Proc. Inter-Noise 2014,
Melbourne, 2014.
[43] M. Slaney: Auditory toolbox. Interval Research Corporation, Tech. Rep 10 (1998), 1998.
[44] R. Sottek: Modelle zur Signalverarbeitung im menschlichen Gehör, dissertation, RWTH Aachen, 1993.
[45] R. Sottek, F. Kamp, A. Fiebig: A new hearing model approach to tonality, Proc. Inter-Noise 2013,
Innsbruck, 2013.

144 © Ecma International 2018
[46] R. Sottek: Progress in calculating tonality of technical sounds, Proc. Inter-Noise 2014, Melbourne,
2014.
[47] R. Sottek: Calculating tonality of IT product sounds using a psychoacoustically-based model, Proc.
Inter-Noise 2015, San Francisco, 2015.
[48] H. Hansen, J.L. Verhey, R. Weber: The Magnitude of Tonal Content. A Review, Acta Acustica united
with Acustica, 97(3), pp. 355-363, 2011.
[49] H. Hansen, R. Weber: Zum Verhältnis von Tonhaltigkeit und der partiellen Lautheit der tonalen
Komponenten in Rauschen, Proc. DAGA 2010, Berlin, pp. 597-598, 2010.
[50] J.L. Verhey, S. Stefanowicz: Binaurale Tonhaltigkeit, Proc. DAGA 2011, Düsseldorf, pp. 827-828, 2011.
[51] J.C.R. Licklider: A Duplex Theory of Pitch Perception, Cellular and Molecular Life Sciences, vol. 7(4),
pp. 128-134, 1951.
[52] R. Sottek: Gehörgerechte Rauhigkeitsberechnung, Proc. DAGA 1994, Dresden, pp. 1197-1200, 1994.
[53] R. Sottek, P. Vranken, H.-J. Kaiser: Anwendung der gehörgerechten Rauhigkeitsberechnung, Proc.
DAGA 1994, Dresden, pp. 1201-1204, 1994.
[54] R. N. Bracewell: The Fourier transform and its applications. McGraw-Hill, New York,1986.
[55] J. Becker, R. Sottek: Psychoacoustic Tonality Analysis, Proc. Inter-Noise 2018 (to be published),
Chicago, 2018.
[56] HEAD Acoustics GmbH: Using the new psychoacoustic tonality analyses Tonality (Hearing Model),
Application Note, 2018.

© Ecma International 2018 145

© Ecma International 2018


![[MS-WPE376]: WordPad ECMA 376 Standards Support · WordPad ECMA 376 Standards Support](https://img.dokumen.tips/doc/110x75/5fab533dea0e1c27ad282e55/ms-wpe376-wordpad-ecma-376-standards-support-wordpad-ecma-376-standards-support.jpg)