Embed Size (px)
Citation preview
Measurement, Modeling, and Analysisof a Peer-to-Peer File-Sharing Workload
Krishna P. Gummadi, Richard J. Dunn, Stefan Saroiu,Steven D. Gribble, Henry M. Levy, and John Zahorjan
Department of Computer Science and EngineeringUniversity of Washington
Seattle, WA 98195
{gummadi,rdunn,tzoompy,gribble,levy,zahorjan}@cs.washington.edu
ABSTRACTPeer-to-peer (P2P) file sharing accounts for an astonishingvolume of current Internet traffic. This paper probes deeplyinto modern P2P file sharing systems and the forces thatdrive them. By doing so, we seek to increase our under-standing of P2P file sharing workloads and their implica-tions for future multimedia workloads. Our research usesa three-tiered approach. First, we analyze a 200-day traceof over 20 terabytes of Kazaa P2P traffic collected at theUniversity of Washington. Second, we develop a model ofmultimedia workloads that lets us isolate, vary, and explorethe impact of key system parameters. Our model, which weparameterize with statistics from our trace, lets us confirmvarious hypotheses about file-sharing behavior observed inthe trace. Third, we explore the potential impact of locality-awareness in Kazaa.
Our results reveal dramatic differences between P2P filesharing and Web traffic. For example, we show how theimmutability of Kazaa’s multimedia objects leads clientsto fetch objects at most once; in contrast, a World-WideWeb client may fetch a popular page (e.g., CNN or Google)thousands of times. Moreover, we demonstrate that: (1)this “fetch-at-most-once” behavior causes the Kazaa popu-larity distribution to deviate substantially from Zipf curveswe see for the Web, and (2) this deviation has significantimplications for the performance of multimedia file-sharingsystems. Unlike the Web, whose workload is driven by doc-ument change, we demonstrate that clients’ fetch-at-most-once behavior, the creation of new objects, and the additionof new clients to the system are the primary forces that drivemultimedia workloads such as Kazaa. We also show thatthere is substantial untapped locality in the Kazaa workload.Finally, we quantify the potential bandwidth savings thatlocality-aware P2P file-sharing architectures would achieve.
Permission to make digital or hard copies of all or part of this work forpersonal or classroom use is granted without fee provided that copies arenot made or distributed for profit or commercial advantage and that copiesbear this notice and the full citation on the first page. To copy otherwise, torepublish, to post on servers or to redistribute to lists, requires prior specificpermission and/or a fee.SOSP’03, October 19–22, 2003, Bolton Landing, New York, USA.Copyright 2003 ACM 1-58113-757-5/03/0010 ...$5.00.
Categories and Subject DescriptorsC.4 [Performance of Systems]: Modeling Techniques;C.2.4 [Computer-Communication Networks]: Distrib-uted Systems—Distributed applications
General TermsMeasurement, performance, design
KeywordsPeer-to-peer, multimedia workloads, Zipf’s law, modeling,measurement
1. INTRODUCTIONA decade after its birth, the Internet continues its rapid
and often surprising evolution. Recent studies have showna dramatic shift of Internet traffic away from HTML textpages and images and towards multimedia file sharing. Forexample, a March 2000 study at the University of Wisconsinfound that the bandwidth consumed by Napster had edgedahead of HTTP bandwidth [28]. Only two years later, a Uni-versity of Washington study showed that peer-to-peer filesharing dominates the campus network, consuming 43% ofall bandwidth compared to only 14% for WWW traffic [29].When comparing these bandwidth consumption statisticsto those in a 1999 study of a similar campus workload [37],the portion of network bytes ascribed to audio and videoincreased by 300% and 400%, respectively, over a 3-year pe-riod. Without question, multimedia file sharing has becomea dominant factor in today’s Internet. In all likelihood, itwill dominate the Internet of the future, barring a chillingeffect from legal assaults.
Two traits of today’s file-sharing systems distinguish themfrom Web-based content distribution. First, current file-sharing systems use a “peer-to-peer” design: peers volun-tarily provide resources as well as consume them. Becauseof this, the system must dynamically adapt to maintain ser-vice continuity as individual peers come and go. Second,file-sharing is being used predominantly to distribute mul-timedia files, and as a result, file-sharing workloads differsubstantially from Web workloads [29]. Multimedia files arelarge (several megabytes or gigabytes, compared to severalkilobytes for typical Web pages), they are immutable, andthere are currently far fewer distinct multimedia files than

Web pages. Video-on-demand (VoD) systems also distributemultimedia files; we contrast our Kazaa measurements andanalysis with related work on VoD systems in Section 3.
This paper presents an in-depth analysis of a modern P2Pmultimedia file-sharing workload, considering the “peer-to-peer” and the “multimedia” aspects of the workload inde-pendently. Our goals are:
1. to understand the fundamental properties of multime-dia file-sharing systems, independent of the design ofthe delivery system,
2. to explore the forces driving P2P file-sharing work-loads so we can anticipate the potential impacts offuture change, and
3. to demonstrate that significant opportunity exists tooptimize performance in current file-sharing systemsby exploiting untapped locality in the workload.
To meet these goals, we employ several approaches. First,we analyze a 200-day trace of Kazaa [19] traffic that wecollected at the University of Washington between May andDecember of 2002. We traced over 20 terabytes of trafficduring that period, from which we distill several key lessonsabout the Kazaa workload. Second, we derive a model ofthis multimedia traffic based on our analysis. The modelhelps to explain the root causes of many of the trends shownby Kazaa and to predict how the trends may change as theworkload evolves. Third, we use trace-driven simulation toquantify the significant potential that exists to improve theperformance of multimedia file-sharing in our environment.
Our analysis reveals that the Kazaa workload is drivenby considerably different forces than the Web. Kazaa ob-jects are immutable, and as a result, the vast majority ofits objects are fetched at most once per client; in contrast,Web pages (e.g., Google or CNN) can be fetched thousandsof times per client. Our measurements show that the pop-ularity distribution of Kazaa objects deviates substantially
from the Zipf curves we commonly see for the Web, andour model confirms that the “fetch-at-most-once” behaviorof Kazaa clients is the cause. Our model demonstrates an-other consequence of object immutability: unlike the Web,whose workload is driven by document change, the primaryforces in Kazaa are the creation of new objects and the addi-tion of new users. Without these forces, fetch-at-most-oncebehavior would drive the system to stagnation.
The structure of this paper follows the multi-tiered ap-proach cited above. Section 2 describes our trace method-ology and presents our trace-based analysis of Kazaa. InSection 3, we analyze the popularity distribution of Kazaarequests and the forces that shape it. Section 4 uses ourobservations and analysis to develop an analytical model;we then use the model to explore the processes that driveKazaa’s behavior in greater depth. Section 5 considers theperformance potential of bandwidth-saving techniques sug-gested by our modeling and analysis. We describe researchrelated to our study in Section 6, while Section 7 summarizesour results and presents conclusions.
2. THE MEASURED PROPERTIES OF P2PFILE-SHARING WORKLOADS
This section uses our trace data to identify key propertiesof the Kazaa multimedia file-sharing system. Recent stud-
trace length 203 days, 5 hours, 6 minutes # of requests 1,640,912 # of transactions 98,997,622 # of unsuccessful transactions 65,505,165 (66.2%)
average transaction size 252KB (all transactions) 752KB (successful transactions only)
# of users 24,578 # of unique objects 633,106 (totaling 8.85TB) bytes transferred 22.72TB content demanded 43.87TB
Table 1: Kazaa trace summary statistics, 5/28/02 to
12/17/02. A transaction refers to a single Kazaa HTTP
transfer; a request refers to the set of transactions a
client issues while downloading an object, potentially
in pieces from many servers. Clients are identified by
Kazaa username. We only present statistics for down-
loads made by university-internal clients for data on
university-external peers.
ies have described high-level characteristics of P2P work-loads [6, 29, 30, 32]. Our goals in this section are to: (1)dig beneath these high-level studies to uncover the processesthat drive the workloads, and (2) demonstrate ways in whichthese processes fundamentally differ from those of the Web.
2.1 Trace MethodologyThe data in this section are based on a 200-day trace
of Kazaa peer-to-peer file-sharing traffic collected at theUniversity of Washington between May 28th and December17th, 2002. The University of Washington (UW) is a largecampus with over 60,000 faculty, students, and staff. Table 1describes the trace, which saw over 20 terabytes of incomingdata resulting from 1.6 million requests. Our trace was longenough for us to observe seasonal traffic variations, includ-ing the end of spring quarter in June, the summer months,and the start and end of the fall quarter. We also observedthe impact of bandwidth rate-limiting instituted by the uni-versity’s networking organization midway through the tracein an attempt to control the cost of Kazaa traffic.1
We collected our trace using hardware and software in-stalled at the network border between the university andthe Internet. Our hardware consists of a 2.0 GHz Pentium-III workstation that monitored traffic flowing between theuniversity and the Internet. Our workstation had sufficientCPU and network capacity to ensure that no packets weredropped, even during peak load. An adjacent workstationacted as a one-terabyte file store for archiving trace data.Our software used a kernel packet filter [24] to deliver TCPpackets to a user-level process, which identified HTTP re-quests within the TCP flows. Throughout our trace, thepacket filter reported packet drop rates of less than 0.0001%.We made all sensitive information anonymous – includingIP addresses, URLs, usernames, and object names – beforecompressing and storing the trace. Overall, our tracing andanalysis software consists of over 30,000 lines of code.
Our hardware monitored all incoming and outgoing traf-fic. However, the data presented in this paper (includingTable 1) are for one direction only: requests made by uni-versity-internal peers to download data stored on university-
1The imposed rate limits bounded upload traffic out of theuniversity’s dormitory population and had little effect ondownload traffic (to the dorms or to the university as awhole), which is the focus of our research.
external peers. This unidirectional trace captures all re-quests issued by a stable, complete user population over aperiod of time. Kazaa control traffic, which consists primar-ily of queries and their responses, is encrypted and was notcaptured as part of our trace.
Throughout this paper, the term “user” refers to a personand “client” refers to the application instance running on be-half of a user. We assume there is largely a one-to-one corre-spondence between users and specific application instancesin our environment (although this may not always be true);therefore, we draw conclusions about users based on observa-tions of clients in our trace. Note, however, that client-sidecaches may absorb some requests from users, meaning thatthe client request rate, which we observe in our trace, maybe lower than the true user request rate, which we cannotdirectly observe.
Kazaa clients supply Kazaa-specific “usernames” as anHTTP header in each transaction. We use these usernames(rather than IP addresses) to distinguish between differ-ent users in our trace. Unfortunately, an unofficial ver-sion of Kazaa, called “KazaaLite,”2 became popular dur-ing our tracing period and is compiled with a predefinedusername embedded in the application itself. We “special-case” requests from KazaaLite, resorting to distinguishingbetween KazaaLite users by their IP addresses. AlthoughDHCP is used in portions of our campus, and identifyingusers by IP address is known to have issues when DHCP ispresent [6], only 5.7% of transactions in our trace were fromKazaaLite clients. Furthermore, KazaaLite clients did notappear within the first 59 days of our 203 day trace.
Kazaa file-transfer traffic consists of unencrypted HTTPtransfers; all transfers include Kazaa-specific HTTP head-ers (e.g., “X-Kazaa-IP”). These headers make it simple todistinguish between Kazaa activity and other HTTP activ-ity. They also provide enough information for us to identifyprecisely which object is being transferred in a given trans-action. When a client attempts to download an object, thatobject may be downloaded in pieces (often called “chunks”)from several sources over a long period of time. We define a“transaction” to be a single HTTP transfer between a clientand a server, and a “request” to be the set of transactions aclient participates in to download an entire object. A failedtransaction occurs when a client successfully contacts a re-mote peer, but that remote peer does not return any data,instead returning an HTTP 500 error code.
A single request may span many minutes, hours, or evendays, since the Kazaa client software will continue to at-tempt to download the object long after the user has askedfor it. Occasionally, a client may download only a subset ofthe entire object (either because the user gives up or becausethe object becomes permanently inaccessible in the middleof a request). We call this a “partial request.”
The Kazaa application has an auto-update feature, mean-ing that a running instance of Kazaa will periodically checkfor updated versions of itself. If found, it downloads the newexecutable over the Kazaa network. We chose to filter outthese auto-update transactions from our logs, as they arenot representative of multimedia requests from users. Such
2Many more unofficial versions of Kazaa that use genericusernames have appeared since our trace period finished;precisely distinguishing between peer-to-peer users will be-come very difficult, given that neither IP addresses norapplication-specific usernames are unique.
0
0.1
0.2
0.3
0.4
0.5
0.6
0.7
0.8
0.9
1
-3download latency
% o
f req
uest
s (C
DF
)
5 mins 1 hour 1 week1 day 150 days
100MB+ objects
<10MB objects
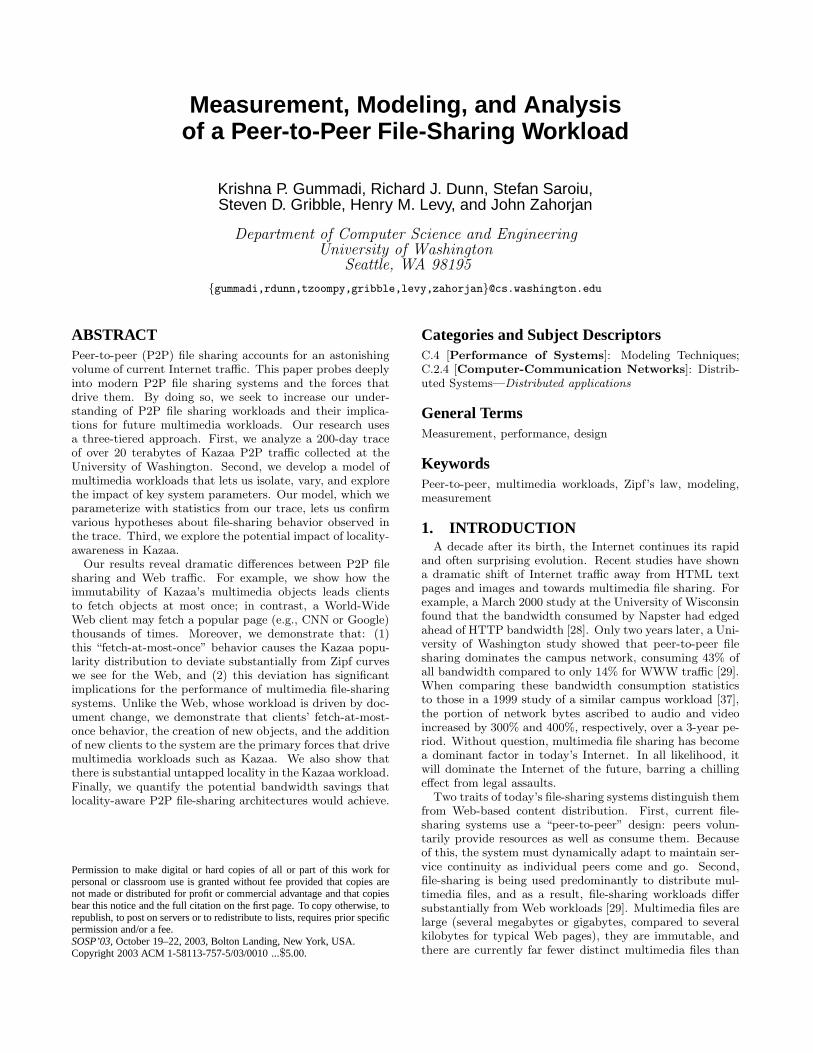
Figure 1: Users are patient. A CDF of object transfer
times in Kazaa for small (<10 MB) and large (100 MB+)
objects. The X-axis is on a log-scale.
filtering removed 0.4% of total transactions (0.3% of bytes)from our trace.
2.2 User CharacteristicsOur first slice through the trace data focuses on the prop-
erties of Kazaa users. Previous studies [29, 2] have shownthat peer-to-peer users in general are “greedy” (i.e., mostusers consume data but provide little in return) and havepoor availability [30]. We confirm some of these character-istics, but we also explore others, such as user activity.
2.2.1 Kazaa Users Are PatientAs any Web-based enterprise knows, users are very sensi-
tive to page-fetch latency. Beyond a certain small threshold(measured in seconds), they will abandon a site and moveto another, possibly competing, site. For this reason, manyonline businesses engage services such as Keynote [20] to tellthem quickly if their servers are not sufficiently responsive.In the world of the Web, users expect instant gratificationand are unforgiving if they do not receive it.
In this context, the behavior of Kazaa users is surprising.Figure 1 shows the distribution of transfer times in Kazaa;transfer time is defined as the difference between the starttime of the first transaction and the end time of the lasttransaction of a given user request. We filtered out partialrequests (i.e., we only counted transfers for which the usereventually obtained the entire object). To deal with edgeeffects, we ignored requests for which at least one transac-tion occurred during the first month of the trace; note thatthis will tend to result in an underestimate of user patience.We present our results in terms of requests for “small” ob-jects (less than 10MB, typically audio files) and requests for“large” objects (more than 100MB, typically video files). Aswe will show in Section 2.3.1, this is a natural and represen-tative way to decompose the overall workload.
The results show incredible patience on the part of Kazaausers. Even for small objects, 30% of the requests take overan hour, and 10% take nearly a day. For large requests, lessthan 10% complete in an hour, 50% take more than a day,and nearly 20% of users are willing to wait a week for theirdownloads to complete! From this graph, it is clear that thedynamics of multimedia downloads differ totally from Webusage. The Web is an interactive system where users wantan immediate response. Kazaa is a batch-mode delivery sys-tem, where downloads are made in the background and the
0
1
2
3
4
5
6
7
8
1 2 3 4 5 6 7 8 9 10 11week
TB
req
uest
ed
0
1000
2000
3000
4000
5000
6000
popu
latio
n si
ze
TB requestedpopulation size
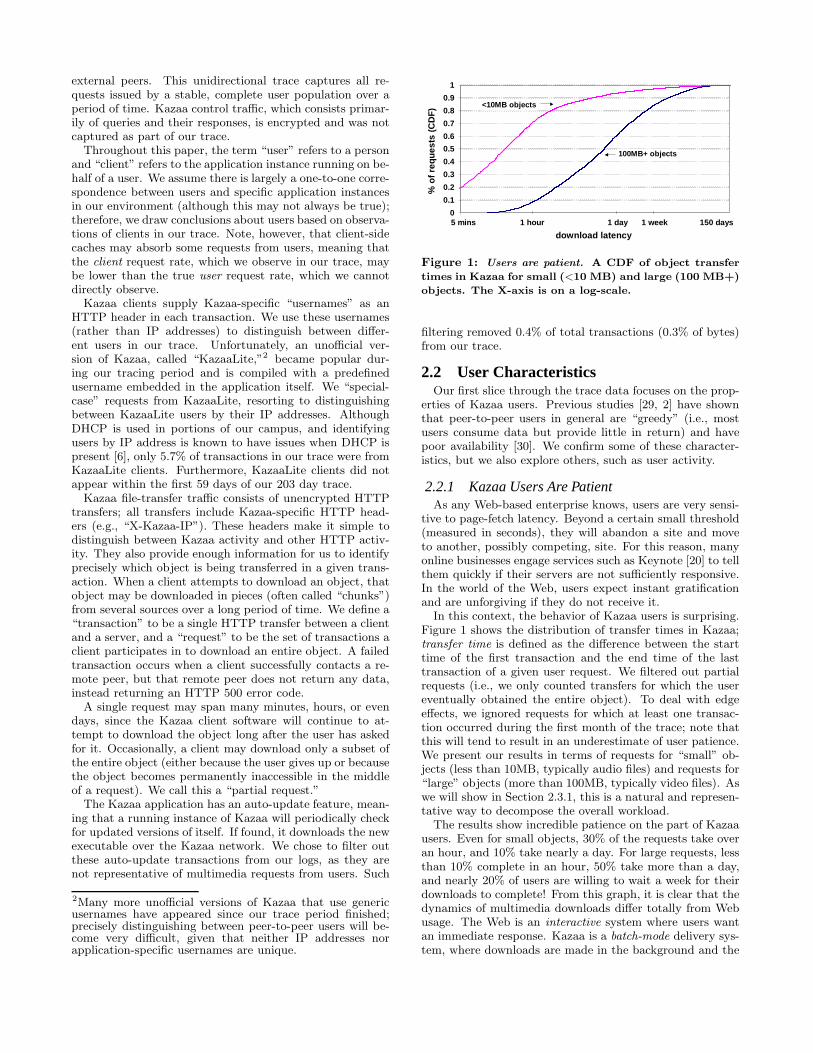
Figure 2: Bytes requested by the population and attrition
as a function of age. “Older” clients request a smaller
fraction of bytes than newer clients. There are fewer old
clients than young clients, but attrition occurs at a more
gradual rate than the slowdown in bytes requested.
content is examined later. Users do not wait for their con-tent to arrive. They go about their business and eventuallyreturn to review the content after it has been received.
2.2.2 Users Slow Down As They AgeAn interesting question we explored is how user interest
in Kazaa varies over time. Do users become hungrier forcontent as they gain experience with Kazaa? Are their re-quest rates relatively constant? Do they lose interest overtime? The answer to such questions significantly affects thegrowth of the system.
To understand user behavior over time, we first calcu-lated the average number of bytes consumed by clients as afunction of age. The methodology for this measurement iscomplex: our trace has finite length, so we must avoid endeffects that would overcount short-lived or undercount long-lived users. We compensate, first, by counting transferredbytes only from clients whose “births” we could observe. Be-cause there are no detectable birth events in our trace, weused the heuristic of treating the first observed downloadfrom a client as a birth event if at least a full month hadelapsed in our trace before seeing that first download. Tocompensate at the end of the trace, we counted bytes onlyfrom clients born prior to the last 11 weeks of the trace.Because of this “end threshold,” we could draw definitiveconclusions about clients’ behavior only during the first 11weeks of their lifetimes.
Figure 2 shows the total number of bytes requested bythe population as a function of its age. From this graph, wecan see that older clients consume fewer bytes than newerclients. There are two reasons for this effect: (1) attritionreduces the number of older clients, since clients may “die”(i.e., leave the system forever) over time, and (2) some clientsmay continue to issue requests but do so at a slower rate asthey age. We explore each of these in turn.
Attrition. To understand attrition in the system, we an-alyzed the number of clients that remain alive as a functionof age (also shown in Figure 2). Population size declines ata more gradual rate than bytes requested, at least over thefirst 11 weeks of clients’ lifetimes. Attrition therefore onlypartially explains why older clients demand less in aggregatefrom the system. To fully explain this phenomenon, clientsmust also slow down their request rates as they age.
Slowing down over time. Older clients may have slower
0
0.2
0.4
0.6
0.8
1
1.2
1.4
1 2 3 4 5 6 7 8 9 10 11week
data
req
uest
ed p
erliv
e cl
ient
(G
B)
0
0.2
0.4
0.6
0.8
1
prob
abilt
y a
clie
ntm
akes
>0
requ
ests
data requestedprobability of request
Figure 3: Older clients have slower request rates. On av-
erage, clients use the system equally often as they age
(having approximately a 50% chance of using the system
any given week), but they request less data per session
as they age. Note that the point corresponding to new
clients (week 1) is artificially high, since by definition
every new client requests an object immediately.
request rates for two reasons: (1) they may use the systemless often, or (2) they may ask for less when they use thesystem. Figure 3 shows that clients are equally likely to usethe system regardless of age: on average, clients have abouta 50% chance of making a request on any given week. Olderclients slow down because they ask for less each time theyuse the system, not because they use the system less often.
In summary, new clients generate most of the load inKazaa, and older clients consume fewer bytes as they age.In part, this is because of attrition: clients leave the systempermanently as they grow older. Also, older clients tend tointeract with the system at a constant rate, but ask for lessduring each interaction.
2.2.3 Client ActivityQuantifying the availability of clients in a peer-to-peer sys-
tem is notoriously difficult [6]: no one metric can accuratelycapture availability in this environment, since any individ-ual client might exist only for a fraction of the traced timeperiod. Given our passive tracing methodology, we facedan additional methodological problem: we can detect thatusers are participating in the system only when their clientstransfer data (either by downloading or uploading files). If aclient is on-line but not active, we could not observe them.Because of this, we report statistics about client activity
only, which is a lower bound on availability.3
We use two specific metrics to quantify the amount ofclient transfer activity: (1) activity fraction, which measuresthe fraction of time a client is transferring content over theclient’s lifetime or over the duration of the entire trace, and(2) average session length, in which a session is defined asan unbroken period of time during which a client has one ormore active transactions. Average session length measuresthe typical duration of the periods during which a client isreceiving or transmitting data. Our measurements indicatethat the distributions of average session length and activityfraction over the measured population are heavy-tailed.
3P2P software is often designed to make it difficult to closethe program once it starts, “fooling” users into making theirclients more available than intended. Accordingly, we sug-gest that client activity is a more universally comparableand stable indicator of “availability” than other metrics.
(a) (b)
0
0.1
0.2
0.3
0.4
0.5
0.6
0.7
0.8
0.9
1
<= 10 10-100 >100
object size (MB)
% o
f req
uest
s/by
tes
requestsbytes transferred
00.10.20.30.40.50.60.70.80.9
1
0.1 1 10 100 1000object size (MB)
(CD
F)
% requests
% bytes consumed
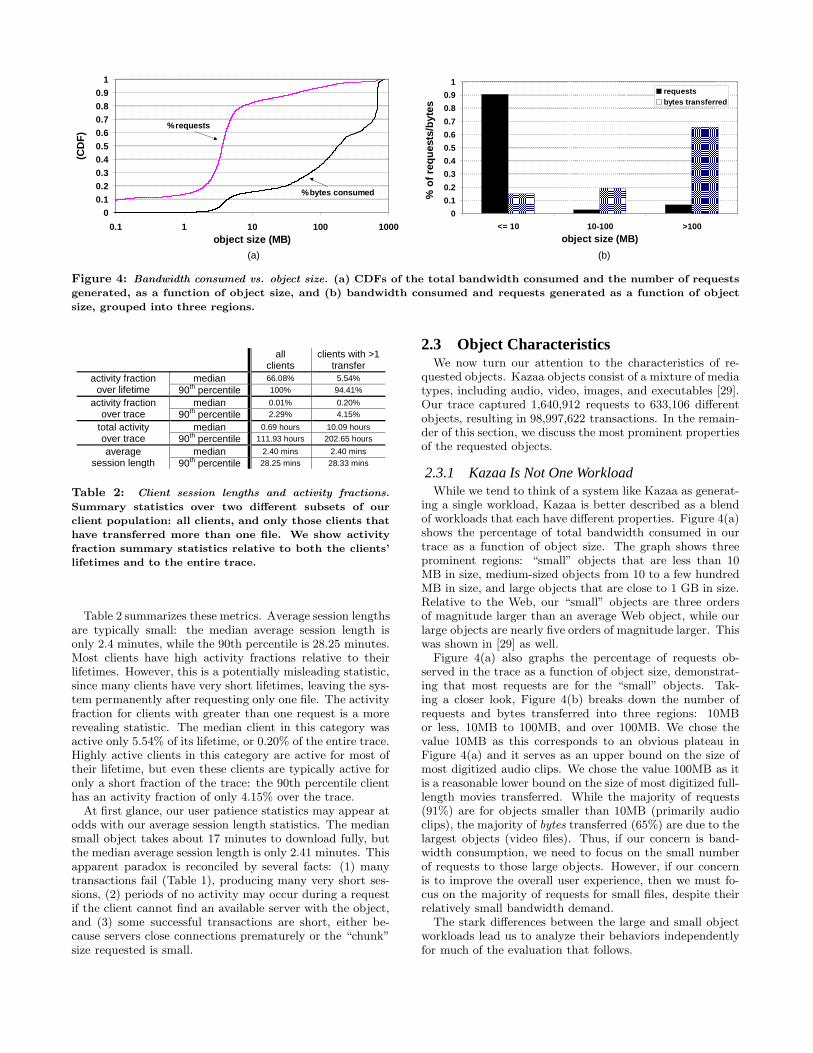
Figure 4: Bandwidth consumed vs. object size. (a) CDFs of the total bandwidth consumed and the number of requests
generated, as a function of object size, and (b) bandwidth consumed and requests generated as a function of object
size, grouped into three regions.
all clients
clients with >1 transfer
median 66.08% 5.54% activity fraction over lifetime 90th percentile 100% 94.41%
median 0.01% 0.20% activity fraction over trace 90th percentile 2.29% 4.15%
median 0.69 hours 10.09 hours total activity over trace 90th percentile 111.93 hours 202.65 hours
median 2.40 mins 2.40 mins average session length 90th percentile 28.25 mins 28.33 mins
Table 2: Client session lengths and activity fractions.
Summary statistics over two different subsets of our
client population: all clients, and only those clients that
have transferred more than one file. We show activity
fraction summary statistics relative to both the clients’
lifetimes and to the entire trace.
Table 2 summarizes these metrics. Average session lengthsare typically small: the median average session length isonly 2.4 minutes, while the 90th percentile is 28.25 minutes.Most clients have high activity fractions relative to theirlifetimes. However, this is a potentially misleading statistic,since many clients have very short lifetimes, leaving the sys-tem permanently after requesting only one file. The activityfraction for clients with greater than one request is a morerevealing statistic. The median client in this category wasactive only 5.54% of its lifetime, or 0.20% of the entire trace.Highly active clients in this category are active for most oftheir lifetime, but even these clients are typically active foronly a short fraction of the trace: the 90th percentile clienthas an activity fraction of only 4.15% over the trace.
At first glance, our user patience statistics may appear atodds with our average session length statistics. The mediansmall object takes about 17 minutes to download fully, butthe median average session length is only 2.41 minutes. Thisapparent paradox is reconciled by several facts: (1) manytransactions fail (Table 1), producing many very short ses-sions, (2) periods of no activity may occur during a requestif the client cannot find an available server with the object,and (3) some successful transactions are short, either be-cause servers close connections prematurely or the “chunk”size requested is small.
2.3 Object CharacteristicsWe now turn our attention to the characteristics of re-
quested objects. Kazaa objects consist of a mixture of mediatypes, including audio, video, images, and executables [29].Our trace captured 1,640,912 requests to 633,106 differentobjects, resulting in 98,997,622 transactions. In the remain-der of this section, we discuss the most prominent propertiesof the requested objects.
2.3.1 Kazaa Is Not One WorkloadWhile we tend to think of a system like Kazaa as generat-
ing a single workload, Kazaa is better described as a blendof workloads that each have different properties. Figure 4(a)shows the percentage of total bandwidth consumed in ourtrace as a function of object size. The graph shows threeprominent regions: “small” objects that are less than 10MB in size, medium-sized objects from 10 to a few hundredMB in size, and large objects that are close to 1 GB in size.Relative to the Web, our “small” objects are three ordersof magnitude larger than an average Web object, while ourlarge objects are nearly five orders of magnitude larger. Thiswas shown in [29] as well.
Figure 4(a) also graphs the percentage of requests ob-served in the trace as a function of object size, demonstrat-ing that most requests are for the “small” objects. Tak-ing a closer look, Figure 4(b) breaks down the number ofrequests and bytes transferred into three regions: 10MBor less, 10MB to 100MB, and over 100MB. We chose thevalue 10MB as this corresponds to an obvious plateau inFigure 4(a) and it serves as an upper bound on the size ofmost digitized audio clips. We chose the value 100MB as itis a reasonable lower bound on the size of most digitized full-length movies transferred. While the majority of requests(91%) are for objects smaller than 10MB (primarily audioclips), the majority of bytes transferred (65%) are due to thelargest objects (video files). Thus, if our concern is band-width consumption, we need to focus on the small numberof requests to those large objects. However, if our concernis to improve the overall user experience, then we must fo-cus on the majority of requests for small files, despite theirrelatively small bandwidth demand.
The stark differences between the large and small objectworkloads lead us to analyze their behaviors independentlyfor much of the evaluation that follows.
small objects (primarily audio)
large objects (primarily video)
top 10 top 100 top 10 top 100
overlap in the most popular objects
between first and last 30 days of trace
0 of 10 5 of 100 1 of 10 44 of 100
# of newly popular objects that are
recently born 6 of 10 73 of 95 2 of 9 47 of 56
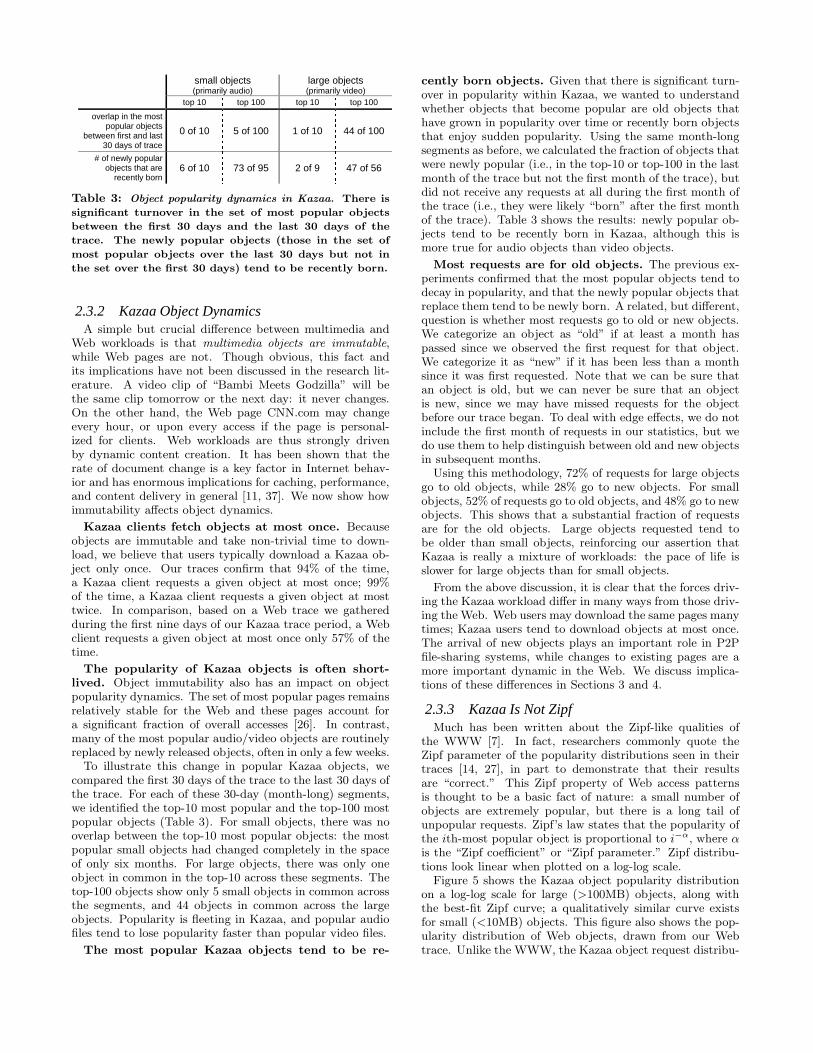
Table 3: Object popularity dynamics in Kazaa. There is
significant turnover in the set of most popular objects
between the first 30 days and the last 30 days of the
trace. The newly popular objects (those in the set of
most popular objects over the last 30 days but not in
the set over the first 30 days) tend to be recently born.
2.3.2 Kazaa Object DynamicsA simple but crucial difference between multimedia and
Web workloads is that multimedia objects are immutable,while Web pages are not. Though obvious, this fact andits implications have not been discussed in the research lit-erature. A video clip of “Bambi Meets Godzilla” will bethe same clip tomorrow or the next day: it never changes.On the other hand, the Web page CNN.com may changeevery hour, or upon every access if the page is personal-ized for clients. Web workloads are thus strongly drivenby dynamic content creation. It has been shown that therate of document change is a key factor in Internet behav-ior and has enormous implications for caching, performance,and content delivery in general [11, 37]. We now show howimmutability affects object dynamics.
Kazaa clients fetch objects at most once. Becauseobjects are immutable and take non-trivial time to down-load, we believe that users typically download a Kazaa ob-ject only once. Our traces confirm that 94% of the time,a Kazaa client requests a given object at most once; 99%of the time, a Kazaa client requests a given object at mosttwice. In comparison, based on a Web trace we gatheredduring the first nine days of our Kazaa trace period, a Webclient requests a given object at most once only 57% of thetime.
The popularity of Kazaa objects is often short-
lived. Object immutability also has an impact on objectpopularity dynamics. The set of most popular pages remainsrelatively stable for the Web and these pages account fora significant fraction of overall accesses [26]. In contrast,many of the most popular audio/video objects are routinelyreplaced by newly released objects, often in only a few weeks.
To illustrate this change in popular Kazaa objects, wecompared the first 30 days of the trace to the last 30 days ofthe trace. For each of these 30-day (month-long) segments,we identified the top-10 most popular and the top-100 mostpopular objects (Table 3). For small objects, there was nooverlap between the top-10 most popular objects: the mostpopular small objects had changed completely in the spaceof only six months. For large objects, there was only oneobject in common in the top-10 across these segments. Thetop-100 objects show only 5 small objects in common acrossthe segments, and 44 objects in common across the largeobjects. Popularity is fleeting in Kazaa, and popular audiofiles tend to lose popularity faster than popular video files.
The most popular Kazaa objects tend to be re-
cently born objects. Given that there is significant turn-over in popularity within Kazaa, we wanted to understandwhether objects that become popular are old objects thathave grown in popularity over time or recently born objectsthat enjoy sudden popularity. Using the same month-longsegments as before, we calculated the fraction of objects thatwere newly popular (i.e., in the top-10 or top-100 in the lastmonth of the trace but not the first month of the trace), butdid not receive any requests at all during the first month ofthe trace (i.e., they were likely “born” after the first monthof the trace). Table 3 shows the results: newly popular ob-jects tend to be recently born in Kazaa, although this ismore true for audio objects than video objects.
Most requests are for old objects. The previous ex-periments confirmed that the most popular objects tend todecay in popularity, and that the newly popular objects thatreplace them tend to be newly born. A related, but different,question is whether most requests go to old or new objects.We categorize an object as “old” if at least a month haspassed since we observed the first request for that object.We categorize it as “new” if it has been less than a monthsince it was first requested. Note that we can be sure thatan object is old, but we can never be sure that an objectis new, since we may have missed requests for the objectbefore our trace began. To deal with edge effects, we do notinclude the first month of requests in our statistics, but wedo use them to help distinguish between old and new objectsin subsequent months.
Using this methodology, 72% of requests for large objectsgo to old objects, while 28% go to new objects. For smallobjects, 52% of requests go to old objects, and 48% go to newobjects. This shows that a substantial fraction of requestsare for the old objects. Large objects requested tend tobe older than small objects, reinforcing our assertion thatKazaa is really a mixture of workloads: the pace of life isslower for large objects than for small objects.
From the above discussion, it is clear that the forces driv-ing the Kazaa workload differ in many ways from those driv-ing the Web. Web users may download the same pages manytimes; Kazaa users tend to download objects at most once.The arrival of new objects plays an important role in P2Pfile-sharing systems, while changes to existing pages are amore important dynamic in the Web. We discuss implica-tions of these differences in Sections 3 and 4.
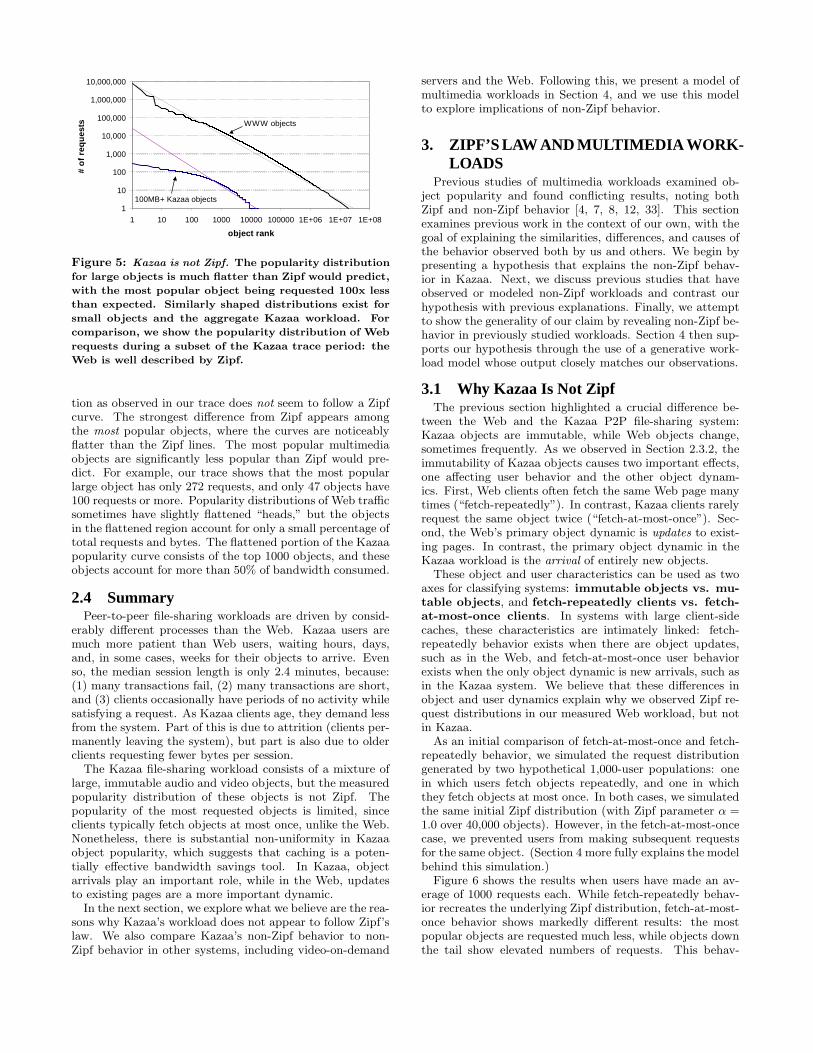
2.3.3 Kazaa Is Not ZipfMuch has been written about the Zipf-like qualities of
the WWW [7]. In fact, researchers commonly quote theZipf parameter of the popularity distributions seen in theirtraces [14, 27], in part to demonstrate that their resultsare “correct.” This Zipf property of Web access patternsis thought to be a basic fact of nature: a small number ofobjects are extremely popular, but there is a long tail ofunpopular requests. Zipf’s law states that the popularity ofthe ith-most popular object is proportional to i−α, where α
is the “Zipf coefficient” or “Zipf parameter.” Zipf distribu-tions look linear when plotted on a log-log scale.
Figure 5 shows the Kazaa object popularity distributionon a log-log scale for large (>100MB) objects, along withthe best-fit Zipf curve; a qualitatively similar curve existsfor small (<10MB) objects. This figure also shows the pop-ularity distribution of Web objects, drawn from our Webtrace. Unlike the WWW, the Kazaa object request distribu-
1
10
100
1,000
10,000
100,000
1,000,000
10,000,000
1 10 100 1000 10000 100000 1E+06 1E+07 1E+08
object rank
# of
req
uest
s
100MB+ Kazaa objects
WWW objects
Figure 5: Kazaa is not Zipf. The popularity distribution
for large objects is much flatter than Zipf would predict,
with the most popular object being requested 100x less
than expected. Similarly shaped distributions exist for
small objects and the aggregate Kazaa workload. For
comparison, we show the popularity distribution of Web
requests during a subset of the Kazaa trace period: the
Web is well described by Zipf.
tion as observed in our trace does not seem to follow a Zipfcurve. The strongest difference from Zipf appears amongthe most popular objects, where the curves are noticeablyflatter than the Zipf lines. The most popular multimediaobjects are significantly less popular than Zipf would pre-dict. For example, our trace shows that the most popularlarge object has only 272 requests, and only 47 objects have100 requests or more. Popularity distributions of Web trafficsometimes have slightly flattened “heads,” but the objectsin the flattened region account for only a small percentage oftotal requests and bytes. The flattened portion of the Kazaapopularity curve consists of the top 1000 objects, and theseobjects account for more than 50% of bandwidth consumed.
2.4 SummaryPeer-to-peer file-sharing workloads are driven by consid-
erably different processes than the Web. Kazaa users aremuch more patient than Web users, waiting hours, days,and, in some cases, weeks for their objects to arrive. Evenso, the median session length is only 2.4 minutes, because:(1) many transactions fail, (2) many transactions are short,and (3) clients occasionally have periods of no activity whilesatisfying a request. As Kazaa clients age, they demand lessfrom the system. Part of this is due to attrition (clients per-manently leaving the system), but part is also due to olderclients requesting fewer bytes per session.
The Kazaa file-sharing workload consists of a mixture oflarge, immutable audio and video objects, but the measuredpopularity distribution of these objects is not Zipf. Thepopularity of the most requested objects is limited, sinceclients typically fetch objects at most once, unlike the Web.Nonetheless, there is substantial non-uniformity in Kazaaobject popularity, which suggests that caching is a poten-tially effective bandwidth savings tool. In Kazaa, objectarrivals play an important role, while in the Web, updatesto existing pages are a more important dynamic.
In the next section, we explore what we believe are the rea-sons why Kazaa’s workload does not appear to follow Zipf’slaw. We also compare Kazaa’s non-Zipf behavior to non-Zipf behavior in other systems, including video-on-demand
servers and the Web. Following this, we present a model ofmultimedia workloads in Section 4, and we use this modelto explore implications of non-Zipf behavior.
3. ZIPF’S LAW AND MULTIMEDIA WORK-LOADS
Previous studies of multimedia workloads examined ob-ject popularity and found conflicting results, noting bothZipf and non-Zipf behavior [4, 7, 8, 12, 33]. This sectionexamines previous work in the context of our own, with thegoal of explaining the similarities, differences, and causes ofthe behavior observed both by us and others. We begin bypresenting a hypothesis that explains the non-Zipf behav-ior in Kazaa. Next, we discuss previous studies that haveobserved or modeled non-Zipf workloads and contrast ourhypothesis with previous explanations. Finally, we attemptto show the generality of our claim by revealing non-Zipf be-havior in previously studied workloads. Section 4 then sup-ports our hypothesis through the use of a generative work-load model whose output closely matches our observations.
3.1 Why Kazaa Is Not ZipfThe previous section highlighted a crucial difference be-
tween the Web and the Kazaa P2P file-sharing system:Kazaa objects are immutable, while Web objects change,sometimes frequently. As we observed in Section 2.3.2, theimmutability of Kazaa objects causes two important effects,one affecting user behavior and the other object dynam-ics. First, Web clients often fetch the same Web page manytimes (“fetch-repeatedly”). In contrast, Kazaa clients rarelyrequest the same object twice (“fetch-at-most-once”). Sec-ond, the Web’s primary object dynamic is updates to exist-ing pages. In contrast, the primary object dynamic in theKazaa workload is the arrival of entirely new objects.
These object and user characteristics can be used as twoaxes for classifying systems: immutable objects vs. mu-
table objects, and fetch-repeatedly clients vs. fetch-
at-most-once clients. In systems with large client-sidecaches, these characteristics are intimately linked: fetch-repeatedly behavior exists when there are object updates,such as in the Web, and fetch-at-most-once user behaviorexists when the only object dynamic is new arrivals, such asin the Kazaa system. We believe that these differences inobject and user dynamics explain why we observed Zipf re-quest distributions in our measured Web workload, but notin Kazaa.
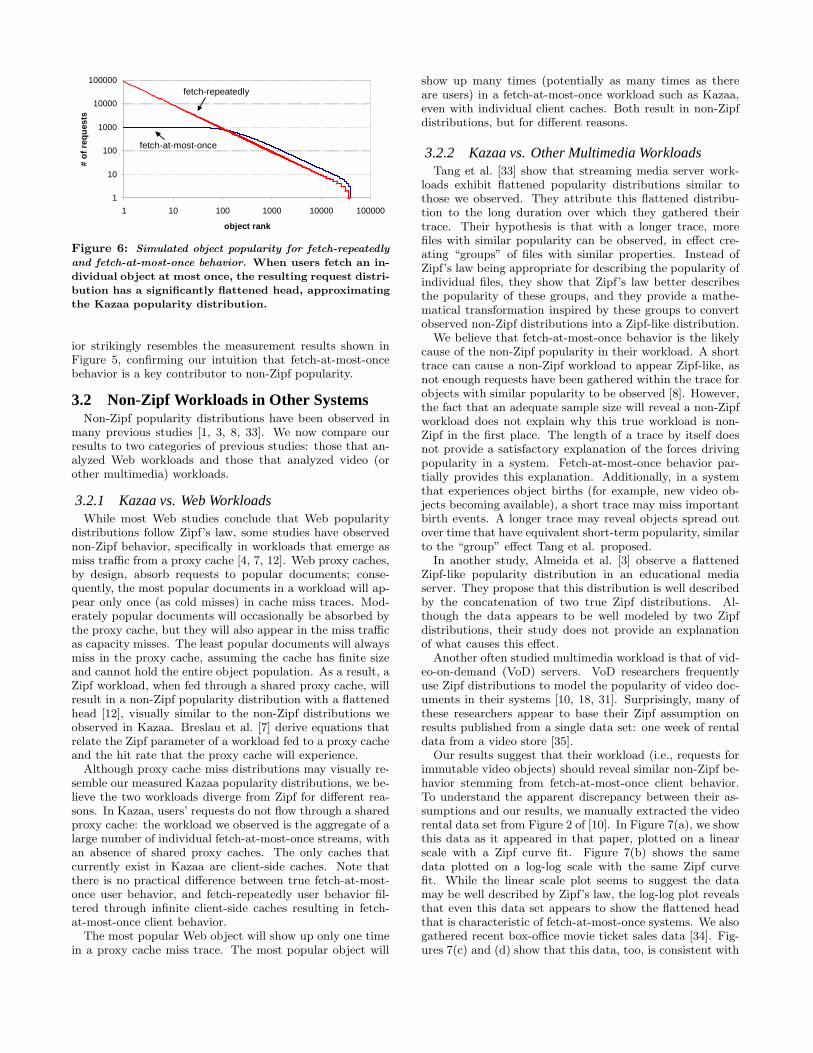
As an initial comparison of fetch-at-most-once and fetch-repeatedly behavior, we simulated the request distributiongenerated by two hypothetical 1,000-user populations: onein which users fetch objects repeatedly, and one in whichthey fetch objects at most once. In both cases, we simulatedthe same initial Zipf distribution (with Zipf parameter α =1.0 over 40,000 objects). However, in the fetch-at-most-oncecase, we prevented users from making subsequent requestsfor the same object. (Section 4 more fully explains the modelbehind this simulation.)
Figure 6 shows the results when users have made an av-erage of 1000 requests each. While fetch-repeatedly behav-ior recreates the underlying Zipf distribution, fetch-at-most-once behavior shows markedly different results: the mostpopular objects are requested much less, while objects downthe tail show elevated numbers of requests. This behav-
1
10
100
1000
10000
100000
1 10 100 1000 10000 100000
object rank
# of
req
uest
s
fetch-at-most-once
fetch-repeatedly
Figure 6: Simulated object popularity for fetch-repeatedly
and fetch-at-most-once behavior. When users fetch an in-
dividual object at most once, the resulting request distri-
bution has a significantly flattened head, approximating
the Kazaa popularity distribution.
ior strikingly resembles the measurement results shown inFigure 5, confirming our intuition that fetch-at-most-oncebehavior is a key contributor to non-Zipf popularity.
3.2 Non-Zipf Workloads in Other SystemsNon-Zipf popularity distributions have been observed in
many previous studies [1, 3, 8, 33]. We now compare ourresults to two categories of previous studies: those that an-alyzed Web workloads and those that analyzed video (orother multimedia) workloads.
3.2.1 Kazaa vs. Web WorkloadsWhile most Web studies conclude that Web popularity
distributions follow Zipf’s law, some studies have observednon-Zipf behavior, specifically in workloads that emerge asmiss traffic from a proxy cache [4, 7, 12]. Web proxy caches,by design, absorb requests to popular documents; conse-quently, the most popular documents in a workload will ap-pear only once (as cold misses) in cache miss traces. Mod-erately popular documents will occasionally be absorbed bythe proxy cache, but they will also appear in the miss trafficas capacity misses. The least popular documents will alwaysmiss in the proxy cache, assuming the cache has finite sizeand cannot hold the entire object population. As a result, aZipf workload, when fed through a shared proxy cache, willresult in a non-Zipf popularity distribution with a flattenedhead [12], visually similar to the non-Zipf distributions weobserved in Kazaa. Breslau et al. [7] derive equations thatrelate the Zipf parameter of a workload fed to a proxy cacheand the hit rate that the proxy cache will experience.
Although proxy cache miss distributions may visually re-semble our measured Kazaa popularity distributions, we be-lieve the two workloads diverge from Zipf for different rea-sons. In Kazaa, users’ requests do not flow through a sharedproxy cache: the workload we observed is the aggregate of alarge number of individual fetch-at-most-once streams, withan absence of shared proxy caches. The only caches thatcurrently exist in Kazaa are client-side caches. Note thatthere is no practical difference between true fetch-at-most-once user behavior, and fetch-repeatedly user behavior fil-tered through infinite client-side caches resulting in fetch-at-most-once client behavior.
The most popular Web object will show up only one timein a proxy cache miss trace. The most popular object will
show up many times (potentially as many times as thereare users) in a fetch-at-most-once workload such as Kazaa,even with individual client caches. Both result in non-Zipfdistributions, but for different reasons.
3.2.2 Kazaa vs. Other Multimedia WorkloadsTang et al. [33] show that streaming media server work-
loads exhibit flattened popularity distributions similar tothose we observed. They attribute this flattened distribu-tion to the long duration over which they gathered theirtrace. Their hypothesis is that with a longer trace, morefiles with similar popularity can be observed, in effect cre-ating “groups” of files with similar properties. Instead ofZipf’s law being appropriate for describing the popularity ofindividual files, they show that Zipf’s law better describesthe popularity of these groups, and they provide a mathe-matical transformation inspired by these groups to convertobserved non-Zipf distributions into a Zipf-like distribution.
We believe that fetch-at-most-once behavior is the likelycause of the non-Zipf popularity in their workload. A shorttrace can cause a non-Zipf workload to appear Zipf-like, asnot enough requests have been gathered within the trace forobjects with similar popularity to be observed [8]. However,the fact that an adequate sample size will reveal a non-Zipfworkload does not explain why this true workload is non-Zipf in the first place. The length of a trace by itself doesnot provide a satisfactory explanation of the forces drivingpopularity in a system. Fetch-at-most-once behavior par-tially provides this explanation. Additionally, in a systemthat experiences object births (for example, new video ob-jects becoming available), a short trace may miss importantbirth events. A longer trace may reveal objects spread outover time that have equivalent short-term popularity, similarto the “group” effect Tang et al. proposed.
In another study, Almeida et al. [3] observe a flattenedZipf-like popularity distribution in an educational mediaserver. They propose that this distribution is well describedby the concatenation of two true Zipf distributions. Al-though the data appears to be well modeled by two Zipfdistributions, their study does not provide an explanationof what causes this effect.
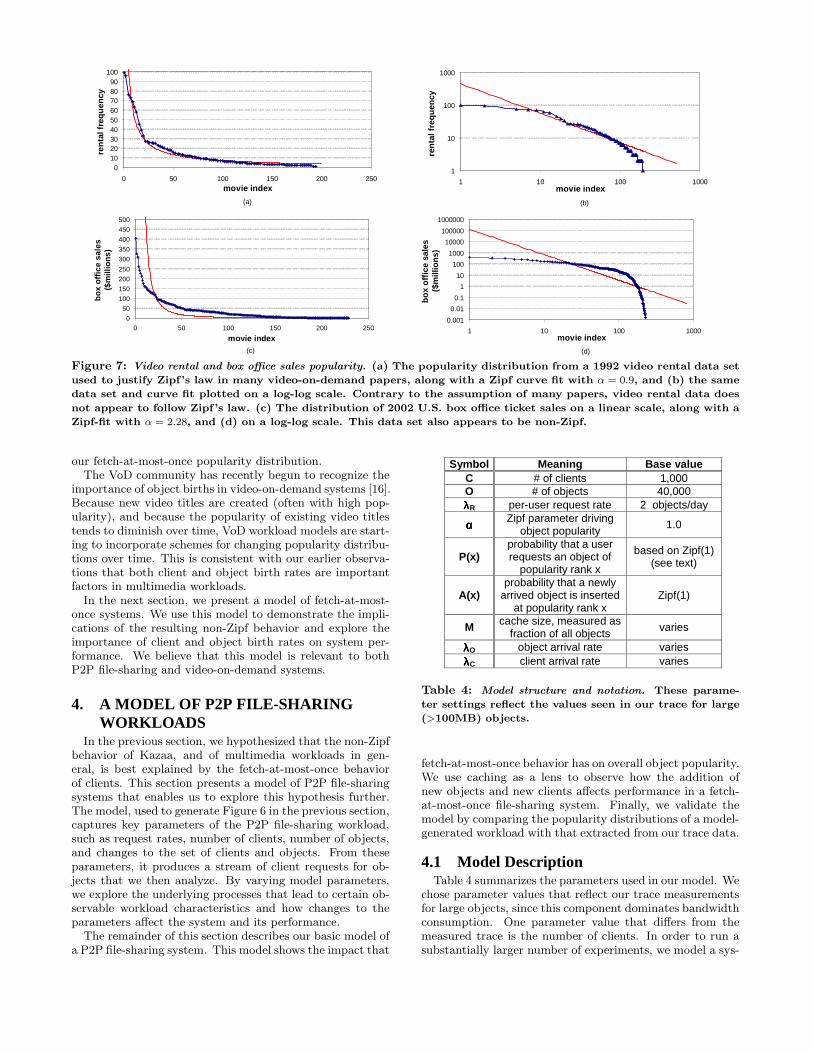
Another often studied multimedia workload is that of vid-eo-on-demand (VoD) servers. VoD researchers frequentlyuse Zipf distributions to model the popularity of video doc-uments in their systems [10, 18, 31]. Surprisingly, many ofthese researchers appear to base their Zipf assumption onresults published from a single data set: one week of rentaldata from a video store [35].
Our results suggest that their workload (i.e., requests forimmutable video objects) should reveal similar non-Zipf be-havior stemming from fetch-at-most-once client behavior.To understand the apparent discrepancy between their as-sumptions and our results, we manually extracted the videorental data set from Figure 2 of [10]. In Figure 7(a), we showthis data as it appeared in that paper, plotted on a linearscale with a Zipf curve fit. Figure 7(b) shows the samedata plotted on a log-log scale with the same Zipf curvefit. While the linear scale plot seems to suggest the datamay be well described by Zipf’s law, the log-log plot revealsthat even this data set appears to show the flattened headthat is characteristic of fetch-at-most-once systems. We alsogathered recent box-office movie ticket sales data [34]. Fig-ures 7(c) and (d) show that this data, too, is consistent with
(a) (b)
(c) (d)
0.001
0.01
0.1
1
10
100
1000
10000
100000
1000000
1 10 100 1000movie index
box
offic
e sa
les
($m
illio
ns)
0
50
100
150
200
250
300
350
400
450
500
0 50 100 150 200 250
movie index
box
offic
e sa
les
($m
illio
ns)
0102030405060708090
100
0 50 100 150 200 250movie index
rent
al fr
eque
ncy
1
10
100
1000
1 10 100 1000movie index
rent
al fr
eque
ncy
Figure 7: Video rental and box office sales popularity. (a) The popularity distribution from a 1992 video rental data set
used to justify Zipf’s law in many video-on-demand papers, along with a Zipf curve fit with α = 0.9, and (b) the same
data set and curve fit plotted on a log-log scale. Contrary to the assumption of many papers, video rental data does
not appear to follow Zipf’s law. (c) The distribution of 2002 U.S. box office ticket sales on a linear scale, along with a
Zipf-fit with α = 2.28, and (d) on a log-log scale. This data set also appears to be non-Zipf.
our fetch-at-most-once popularity distribution.The VoD community has recently begun to recognize the
importance of object births in video-on-demand systems [16].Because new video titles are created (often with high pop-ularity), and because the popularity of existing video titlestends to diminish over time, VoD workload models are start-ing to incorporate schemes for changing popularity distribu-tions over time. This is consistent with our earlier observa-tions that both client and object birth rates are importantfactors in multimedia workloads.
In the next section, we present a model of fetch-at-most-once systems. We use this model to demonstrate the impli-cations of the resulting non-Zipf behavior and explore theimportance of client and object birth rates on system per-formance. We believe that this model is relevant to bothP2P file-sharing and video-on-demand systems.
4. A MODEL OF P2P FILE-SHARINGWORKLOADS
In the previous section, we hypothesized that the non-Zipfbehavior of Kazaa, and of multimedia workloads in gen-eral, is best explained by the fetch-at-most-once behaviorof clients. This section presents a model of P2P file-sharingsystems that enables us to explore this hypothesis further.The model, used to generate Figure 6 in the previous section,captures key parameters of the P2P file-sharing workload,such as request rates, number of clients, number of objects,and changes to the set of clients and objects. From theseparameters, it produces a stream of client requests for ob-jects that we then analyze. By varying model parameters,we explore the underlying processes that lead to certain ob-servable workload characteristics and how changes to theparameters affect the system and its performance.
The remainder of this section describes our basic model ofa P2P file-sharing system. This model shows the impact that
Symbol Meaning Base value C # of clients 1,000 O # of objects 40,000 λλλλR per-user request rate 2 objects/day
αααα Zipf parameter driving
object popularity 1.0
P(x) probability that a user requests an object of
popularity rank x
based on Zipf(1) (see text)
A(x) probability that a newly
arrived object is inserted at popularity rank x
Zipf(1)
M cache size, measured as fraction of all objects
varies
λλλλO object arrival rate varies λλλλC client arrival rate varies
Table 4: Model structure and notation. These parame-
ter settings reflect the values seen in our trace for large
(>100MB) objects.
fetch-at-most-once behavior has on overall object popularity.We use caching as a lens to observe how the addition ofnew objects and new clients affects performance in a fetch-at-most-once file-sharing system. Finally, we validate themodel by comparing the popularity distributions of a model-generated workload with that extracted from our trace data.
4.1 Model DescriptionTable 4 summarizes the parameters used in our model. We
chose parameter values that reflect our trace measurementsfor large objects, since this component dominates bandwidthconsumption. One parameter value that differs from themeasured trace is the number of clients. In order to run asubstantially larger number of experiments, we model a sys-
tem with 1,000 clients rather than the roughly 7,000 large-object clients in our trace. We verified that the predictionsof our model were not affected by this difference. To simplifyour model, we also assumed that all objects in the systemwere of equal size.
Our model captures key aspects of our P2P file-sharingworkload, in particular, the differences between file-sharingand Web workloads. In a Web workload, clients select ob-jects from a Zipf distribution, P (x), in an independent andidentically distributed fashion. In contrast, the object selec-tion process in a file-sharing system depends on three fac-tors: (1) the Zipf distribution, P (x), (2) the way in whichnew objects are inserted into that distribution, A(x), and(3) the clients’ fetch-at-most-once behavior.
Our model generates requests as follows. On average, aclient requests two objects per day, choosing which object tofetch from a Zipf probability distribution with parameter 1.0(“Zipf(1)”).4 We hypothesize that the underlying popularityof objects in a fetch-at-most-once file-sharing system is still
driven by Zipf’s law, even though the observed workloadbecomes non-Zipf because of fetch-at-most-once clients. Inour model, subsequent requests from the same client obeydistributions obtained by removing already fetched objectsfrom the candidate object set and re-scaling so the totalprobability is 1.0. Given two previously unrequested objects,the ratio of the probabilities that the client will request theseobjects next is identical to their ratio in the original Zipfdistribution. For fetch-repeatedly systems, each request ismade according to the original Zipf distribution.
When modeling fetch-at-most-once systems, λO > 0 is theobject arrival rate. When an object is born in a fetch-at-most-once system, its popularity rank is determined by se-lecting randomly from the Zipf(1) distribution. Pre-existingobjects of equal or lesser popularity are “pushed down” oneZipf position, and the resulting distribution is re-normalizedso the total probability is again 1.0. In fetch-repeatedly sys-tems, we set the object arrival rate to 0. Objects may beupdated, but for simplicity we ignore the second-order effectof completely new objects on request behavior.
While our trace shows all requested objects, it cannot ob-serve the total object population, since many available ob-jects were never accessed. However, total object populationis a key parameter of our model, as it influences the amountof overlap that will likely occur in requests from differentclients. We therefore estimated a base value for total objectpopulation by back-inference: how many large objects aremost likely to have existed in total, given that we saw about18,000 distinct large objects requested in the trace? We findthat a total population of about 40,000 large-media objectsis consistent with the trace data; therefore, we use this num-ber as the base value. This number is also comparable tostatistics that describe commercial movie releases: the In-ternet Movie Database reports between 50,000 and 60,000movie releases world-wide over the past 20 years [34].
To quantify file-sharing effectiveness, we use the hit ratethat the aggregate workload experiences against a 100%available shared cache with LRU replacement, whose sizewe vary in each experiment. Selected experiments usingoptimal replacement showed no qualitative differences fromLRU results, and quantitative differences varied by only afew percent. For Web (fetch-repeatedly) scenarios, we make
4Attempting to best-fit a Zipf curve to our measured non-Zipf distribution resulted in a Zipf parameter of 0.98.
0
0.2
0.4
0.6
0.8
1
0 200 400 600 800 1000
days
hit r
ate
fetch-repeatedly
40002000 1000
fetch-at-most-once
1000 40002000
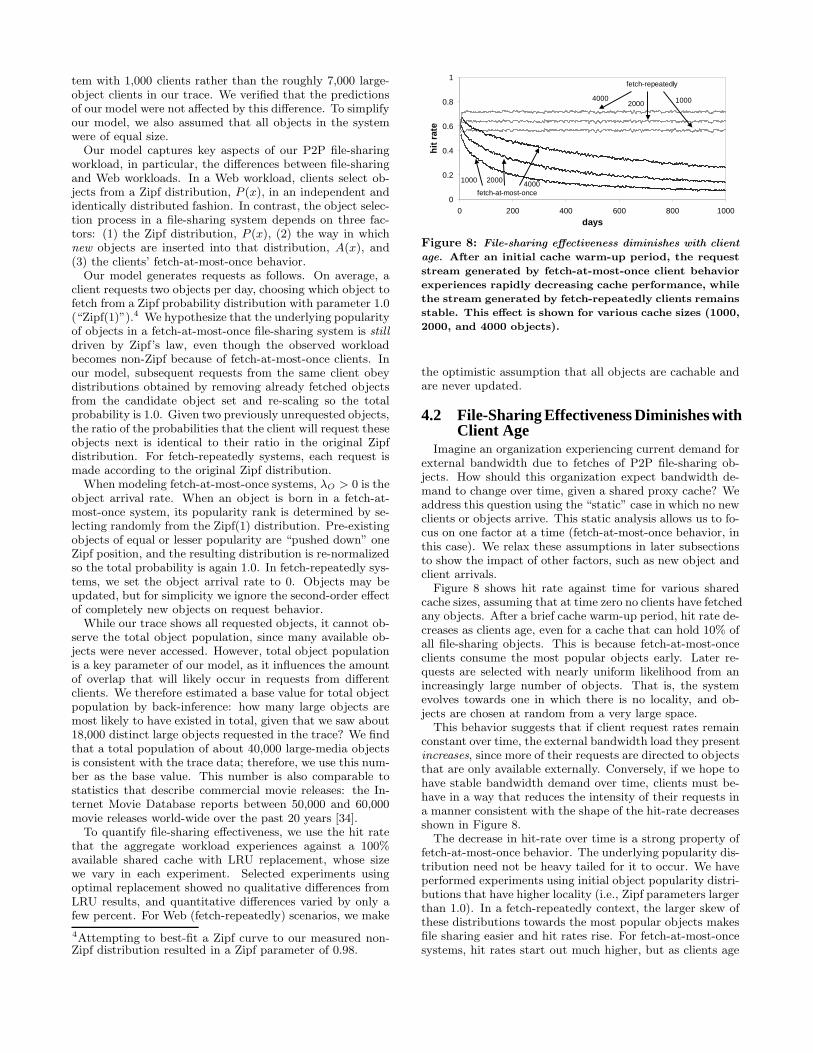
Figure 8: File-sharing effectiveness diminishes with client
age. After an initial cache warm-up period, the request
stream generated by fetch-at-most-once client behavior
experiences rapidly decreasing cache performance, while
the stream generated by fetch-repeatedly clients remains
stable. This effect is shown for various cache sizes (1000,
2000, and 4000 objects).
the optimistic assumption that all objects are cachable andare never updated.
4.2 File-Sharing Effectiveness Diminishes withClient Age
Imagine an organization experiencing current demand forexternal bandwidth due to fetches of P2P file-sharing ob-jects. How should this organization expect bandwidth de-mand to change over time, given a shared proxy cache? Weaddress this question using the “static” case in which no newclients or objects arrive. This static analysis allows us to fo-cus on one factor at a time (fetch-at-most-once behavior, inthis case). We relax these assumptions in later subsectionsto show the impact of other factors, such as new object andclient arrivals.
Figure 8 shows hit rate against time for various sharedcache sizes, assuming that at time zero no clients have fetchedany objects. After a brief cache warm-up period, hit rate de-creases as clients age, even for a cache that can hold 10% ofall file-sharing objects. This is because fetch-at-most-onceclients consume the most popular objects early. Later re-quests are selected with nearly uniform likelihood from anincreasingly large number of objects. That is, the systemevolves towards one in which there is no locality, and ob-jects are chosen at random from a very large space.
This behavior suggests that if client request rates remainconstant over time, the external bandwidth load they presentincreases, since more of their requests are directed to objectsthat are only available externally. Conversely, if we hope tohave stable bandwidth demand over time, clients must be-have in a way that reduces the intensity of their requests ina manner consistent with the shape of the hit-rate decreasesshown in Figure 8.
The decrease in hit-rate over time is a strong property offetch-at-most-once behavior. The underlying popularity dis-tribution need not be heavy tailed for it to occur. We haveperformed experiments using initial object popularity distri-butions that have higher locality (i.e., Zipf parameters largerthan 1.0). In a fetch-repeatedly context, the larger skew ofthese distributions towards the most popular objects makesfile sharing easier and hit rates rise. For fetch-at-most-oncesystems, hit rates start out much higher, but as clients age
0
0.2
0.4
0.6
0.8
1
1 2 3 4 5 6 7 8 9# object arrivals per user request
hit r
ate
cache size = 8000cache size = 4000cache size = 2000cache size = 1000cache size = 500
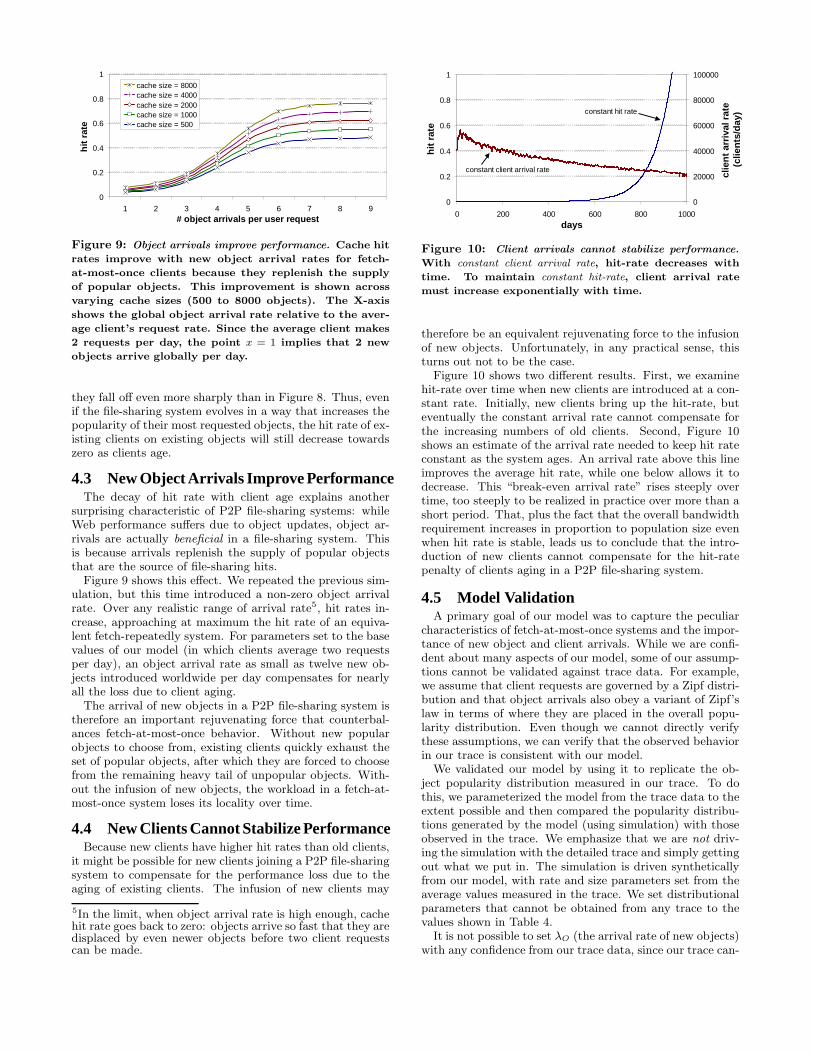
Figure 9: Object arrivals improve performance. Cache hit
rates improve with new object arrival rates for fetch-
at-most-once clients because they replenish the supply
of popular objects. This improvement is shown across
varying cache sizes (500 to 8000 objects). The X-axis
shows the global object arrival rate relative to the aver-
age client’s request rate. Since the average client makes
2 requests per day, the point x = 1 implies that 2 new
objects arrive globally per day.
they fall off even more sharply than in Figure 8. Thus, evenif the file-sharing system evolves in a way that increases thepopularity of their most requested objects, the hit rate of ex-isting clients on existing objects will still decrease towardszero as clients age.
4.3 New Object Arrivals Improve PerformanceThe decay of hit rate with client age explains another
surprising characteristic of P2P file-sharing systems: whileWeb performance suffers due to object updates, object ar-rivals are actually beneficial in a file-sharing system. Thisis because arrivals replenish the supply of popular objectsthat are the source of file-sharing hits.
Figure 9 shows this effect. We repeated the previous sim-ulation, but this time introduced a non-zero object arrivalrate. Over any realistic range of arrival rate5, hit rates in-crease, approaching at maximum the hit rate of an equiva-lent fetch-repeatedly system. For parameters set to the basevalues of our model (in which clients average two requestsper day), an object arrival rate as small as twelve new ob-jects introduced worldwide per day compensates for nearlyall the loss due to client aging.
The arrival of new objects in a P2P file-sharing system istherefore an important rejuvenating force that counterbal-ances fetch-at-most-once behavior. Without new popularobjects to choose from, existing clients quickly exhaust theset of popular objects, after which they are forced to choosefrom the remaining heavy tail of unpopular objects. With-out the infusion of new objects, the workload in a fetch-at-most-once system loses its locality over time.
4.4 New Clients Cannot Stabilize PerformanceBecause new clients have higher hit rates than old clients,
it might be possible for new clients joining a P2P file-sharingsystem to compensate for the performance loss due to theaging of existing clients. The infusion of new clients may
5In the limit, when object arrival rate is high enough, cachehit rate goes back to zero: objects arrive so fast that they aredisplaced by even newer objects before two client requestscan be made.
0
0.2
0.4
0.6
0.8
1
0 200 400 600 800 1000days
hit r
ate
0
20000
40000
60000
80000
100000
clie
nt a
rriv
al r
ate
(clie
nts/
day)
constant client arrival rate
constant hit rate
Figure 10: Client arrivals cannot stabilize performance.
With constant client arrival rate, hit-rate decreases with
time. To maintain constant hit-rate, client arrival rate
must increase exponentially with time.
therefore be an equivalent rejuvenating force to the infusionof new objects. Unfortunately, in any practical sense, thisturns out not to be the case.
Figure 10 shows two different results. First, we examinehit-rate over time when new clients are introduced at a con-stant rate. Initially, new clients bring up the hit-rate, buteventually the constant arrival rate cannot compensate forthe increasing numbers of old clients. Second, Figure 10shows an estimate of the arrival rate needed to keep hit rateconstant as the system ages. An arrival rate above this lineimproves the average hit rate, while one below allows it todecrease. This “break-even arrival rate” rises steeply overtime, too steeply to be realized in practice over more than ashort period. That, plus the fact that the overall bandwidthrequirement increases in proportion to population size evenwhen hit rate is stable, leads us to conclude that the intro-duction of new clients cannot compensate for the hit-ratepenalty of clients aging in a P2P file-sharing system.
4.5 Model ValidationA primary goal of our model was to capture the peculiar
characteristics of fetch-at-most-once systems and the impor-tance of new object and client arrivals. While we are confi-dent about many aspects of our model, some of our assump-tions cannot be validated against trace data. For example,we assume that client requests are governed by a Zipf distri-bution and that object arrivals also obey a variant of Zipf’slaw in terms of where they are placed in the overall popu-larity distribution. Even though we cannot directly verifythese assumptions, we can verify that the observed behaviorin our trace is consistent with our model.
We validated our model by using it to replicate the ob-ject popularity distribution measured in our trace. To dothis, we parameterized the model from the trace data to theextent possible and then compared the popularity distribu-tions generated by the model (using simulation) with thoseobserved in the trace. We emphasize that we are not driv-ing the simulation with the detailed trace and simply gettingout what we put in. The simulation is driven syntheticallyfrom our model, with rate and size parameters set from theaverage values measured in the trace. We set distributionalparameters that cannot be obtained from any trace to thevalues shown in Table 4.
It is not possible to set λO (the arrival rate of new objects)with any confidence from our trace data, since our trace can-
1
10
100
1000
10000
1 10 100 1000 10000 100000
object rank
# re
ques
ts
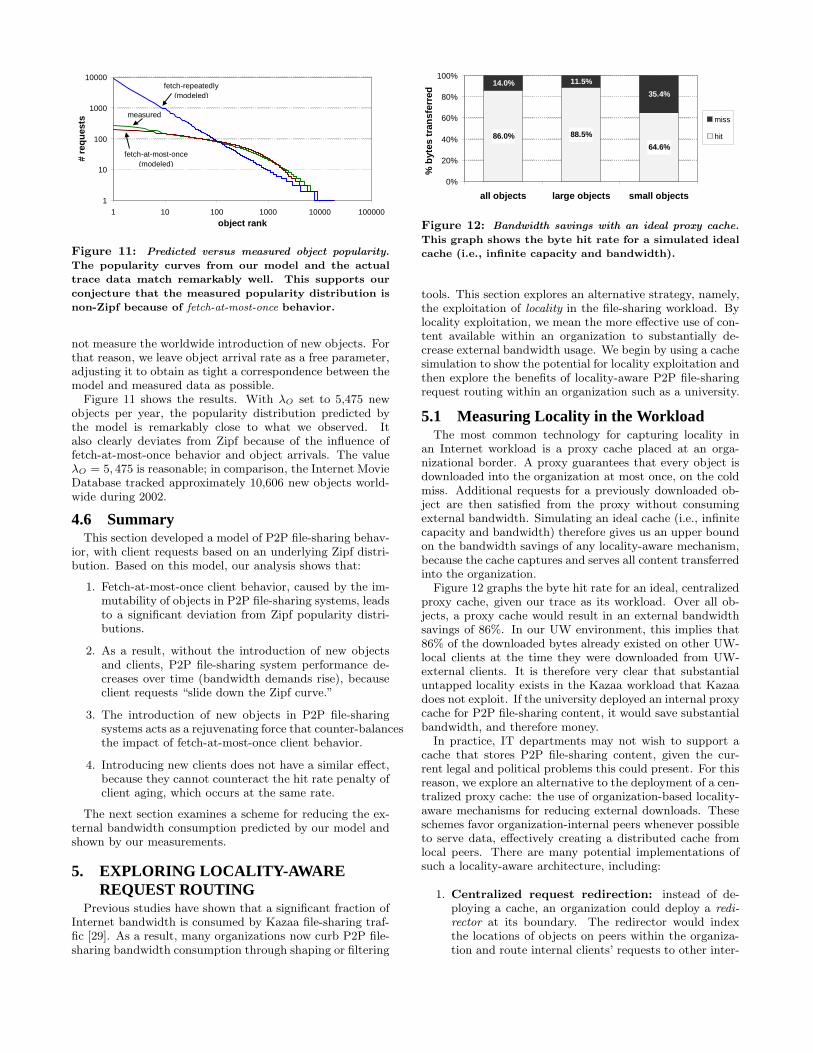
measured
fetch-at-most-once (modeled)
fetch-repeatedly (modeled)
Figure 11: Predicted versus measured object popularity.
The popularity curves from our model and the actual
trace data match remarkably well. This supports our
conjecture that the measured popularity distribution is
non-Zipf because of fetch-at-most-once behavior.
not measure the worldwide introduction of new objects. Forthat reason, we leave object arrival rate as a free parameter,adjusting it to obtain as tight a correspondence between themodel and measured data as possible.
Figure 11 shows the results. With λO set to 5,475 newobjects per year, the popularity distribution predicted bythe model is remarkably close to what we observed. Italso clearly deviates from Zipf because of the influence offetch-at-most-once behavior and object arrivals. The valueλO = 5, 475 is reasonable; in comparison, the Internet MovieDatabase tracked approximately 10,606 new objects world-wide during 2002.
4.6 SummaryThis section developed a model of P2P file-sharing behav-
ior, with client requests based on an underlying Zipf distri-bution. Based on this model, our analysis shows that:
1. Fetch-at-most-once client behavior, caused by the im-mutability of objects in P2P file-sharing systems, leadsto a significant deviation from Zipf popularity distri-butions.
2. As a result, without the introduction of new objectsand clients, P2P file-sharing system performance de-creases over time (bandwidth demands rise), becauseclient requests “slide down the Zipf curve.”
3. The introduction of new objects in P2P file-sharingsystems acts as a rejuvenating force that counter-balancesthe impact of fetch-at-most-once client behavior.
4. Introducing new clients does not have a similar effect,because they cannot counteract the hit rate penalty ofclient aging, which occurs at the same rate.
The next section examines a scheme for reducing the ex-ternal bandwidth consumption predicted by our model andshown by our measurements.
5. EXPLORING LOCALITY-AWAREREQUEST ROUTING
Previous studies have shown that a significant fraction ofInternet bandwidth is consumed by Kazaa file-sharing traf-fic [29]. As a result, many organizations now curb P2P file-sharing bandwidth consumption through shaping or filtering
88.5%
64.6%
14.0% 11.5%
35.4%
86.0%
0%
20%
40%
60%
80%
100%
all objects large objects small objects
% b
ytes
tran
sfer
red
miss
hit
Figure 12: Bandwidth savings with an ideal proxy cache.
This graph shows the byte hit rate for a simulated ideal
cache (i.e., infinite capacity and bandwidth).
tools. This section explores an alternative strategy, namely,the exploitation of locality in the file-sharing workload. Bylocality exploitation, we mean the more effective use of con-tent available within an organization to substantially de-crease external bandwidth usage. We begin by using a cachesimulation to show the potential for locality exploitation andthen explore the benefits of locality-aware P2P file-sharingrequest routing within an organization such as a university.
5.1 Measuring Locality in the WorkloadThe most common technology for capturing locality in
an Internet workload is a proxy cache placed at an orga-nizational border. A proxy guarantees that every object isdownloaded into the organization at most once, on the coldmiss. Additional requests for a previously downloaded ob-ject are then satisfied from the proxy without consumingexternal bandwidth. Simulating an ideal cache (i.e., infinitecapacity and bandwidth) therefore gives us an upper boundon the bandwidth savings of any locality-aware mechanism,because the cache captures and serves all content transferredinto the organization.
Figure 12 graphs the byte hit rate for an ideal, centralizedproxy cache, given our trace as its workload. Over all ob-jects, a proxy cache would result in an external bandwidthsavings of 86%. In our UW environment, this implies that86% of the downloaded bytes already existed on other UW-local clients at the time they were downloaded from UW-external clients. It is therefore very clear that substantialuntapped locality exists in the Kazaa workload that Kazaadoes not exploit. If the university deployed an internal proxycache for P2P file-sharing content, it would save substantialbandwidth, and therefore money.
In practice, IT departments may not wish to support acache that stores P2P file-sharing content, given the cur-rent legal and political problems this could present. For thisreason, we explore an alternative to the deployment of a cen-tralized proxy cache: the use of organization-based locality-aware mechanisms for reducing external downloads. Theseschemes favor organization-internal peers whenever possibleto serve data, effectively creating a distributed cache fromlocal peers. There are many potential implementations ofsuch a locality-aware architecture, including:
1. Centralized request redirection: instead of de-ploying a cache, an organization could deploy a redi-
rector at its boundary. The redirector would indexthe locations of objects on peers within the organiza-tion and route internal clients’ requests to other inter-
nal peers whenever possible. The redirector should betransparent to the P2P file-sharing protocols.
2. Decentralized request redirection: today’s P2Pfile-sharing systems often employ the use of supern-
odes, distinguished peers that index content on otherpeers. Current architectures such as Kazaa are locality-unaware, as our data shows. Through the use of topo-logical distance estimation techniques such as GNP [25],IDMaps [13], or King [17], it may be possible to infusesupernodes with locality awareness, resulting in a fullydistributed redirection architecture.
The following sections use trace-based simulation to assessthe potential benefits of these locality-aware mechanisms.
5.2 MethodologyWe use trace-based simulation to evaluate a locality-aware
scheme in which all requests from clients in the University ofWashington are redirected (when possible) to other univer-sity peers. Our simulated locality-aware mechanism is ideal,in that it has perfect knowledge about which peers are cur-rently up and which objects each peer is willing to serve.We assume that: (1) all peers have infinite storage capacity,(2) once a peer downloads an object, it makes that objectavailable to other peers when it is up, and (3) each peer canserve at most 12 concurrent downloads, a number chosen toapproximate the behavior of many P2P file-sharing systems,including Kazaa and Gnutella. In our model, each peer hasa finite upload bandwidth of 500 Kb/s that is shared acrossall of that peer’s concurrent uploads; each external transferhas a bandwidth of 100 Kb/s. These values approximate thetypical values we saw in our trace. However, we verified thatthe qualitative results and conclusions of our experiments donot differ across a wide range of simulated internal and ex-ternal bandwidth settings.
Unlike a proxy cache, a locality-aware mechanism cannotdirectly control the availability of content. Instead, it re-lies on peers to make content available. As a result, if anobject exists on only one local peer, the object becomes un-available whenever that peer is disconnected. Effectivenessis therefore limited by object availability. Given the cru-cial importance of availability, we provide a lower bound onthe benefits of locality awareness by making an extremelyconservative assumption, namely, that peers are available asservers only during periods in which our trace shows themto be actively transferring objects. In reality, peers will bemuch more available than we simulate, so a locality-awarearchitecture should be able to achieve at least the perfor-mance benefits that we show below.
The rest of this section explores whether a locality-awarescheme using internal peers can realize object availability,and therefore external bandwidth savings, competitive witha dedicated, centralized proxy cache.
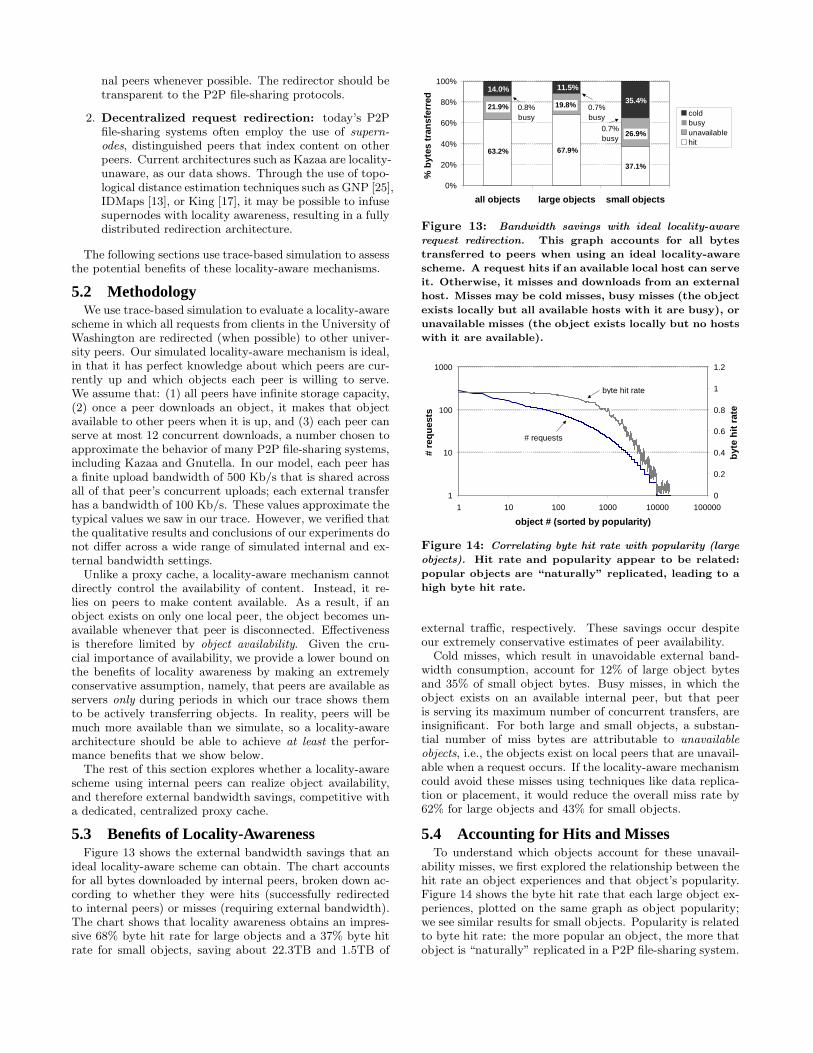
5.3 Benefits of Locality-AwarenessFigure 13 shows the external bandwidth savings that an
ideal locality-aware scheme can obtain. The chart accountsfor all bytes downloaded by internal peers, broken down ac-cording to whether they were hits (successfully redirectedto internal peers) or misses (requiring external bandwidth).The chart shows that locality awareness obtains an impres-sive 68% byte hit rate for large objects and a 37% byte hitrate for small objects, saving about 22.3TB and 1.5TB of
0%
20%
40%
60%
80%
100%
all objects large objects small objects
% b
ytes
tran
sfer
red
coldbusyunavailablehit
67.9%
11.5%
19.8%
0.7%busy
37.1%
35.4%
26.9%
0.7%busy
0.8%busy
63.2%
14.0%
21.9%
Figure 13: Bandwidth savings with ideal locality-aware
request redirection. This graph accounts for all bytes
transferred to peers when using an ideal locality-aware
scheme. A request hits if an available local host can serve
it. Otherwise, it misses and downloads from an external
host. Misses may be cold misses, busy misses (the object
exists locally but all available hosts with it are busy), or
unavailable misses (the object exists locally but no hosts
with it are available).
1
10
100
1000
1 10 100 1000 10000 100000
object # (sorted by popularity)
# re
ques
ts
0
0.2
0.4
0.6
0.8
1
1.2
byte
hit
rate
byte hit rate
# requests
Figure 14: Correlating byte hit rate with popularity (large
objects). Hit rate and popularity appear to be related:
popular objects are “naturally” replicated, leading to a
high byte hit rate.
external traffic, respectively. These savings occur despiteour extremely conservative estimates of peer availability.
Cold misses, which result in unavoidable external band-width consumption, account for 12% of large object bytesand 35% of small object bytes. Busy misses, in which theobject exists on an available internal peer, but that peeris serving its maximum number of concurrent transfers, areinsignificant. For both large and small objects, a substan-tial number of miss bytes are attributable to unavailable
objects, i.e., the objects exist on local peers that are unavail-able when a request occurs. If the locality-aware mechanismcould avoid these misses using techniques like data replica-tion or placement, it would reduce the overall miss rate by62% for large objects and 43% for small objects.
5.4 Accounting for Hits and MissesTo understand which objects account for these unavail-
ability misses, we first explored the relationship between thehit rate an object experiences and that object’s popularity.Figure 14 shows the byte hit rate that each large object ex-periences, plotted on the same graph as object popularity;we see similar results for small objects. Popularity is relatedto byte hit rate: the more popular an object, the more thatobject is “naturally” replicated in a P2P file-sharing system.
0.0
0.1
0.2
0.3
0.4
0.5
0.6
0.7
0.8
0.9
1.0
0 1000 2000 3000 4000 5000 6000 7000 8000
peers (ranked by availability)
% o
f byt
es (
CD
F)
bytes consumed
bytes served
Figure 15: Highly available peers carry the load. A CDF
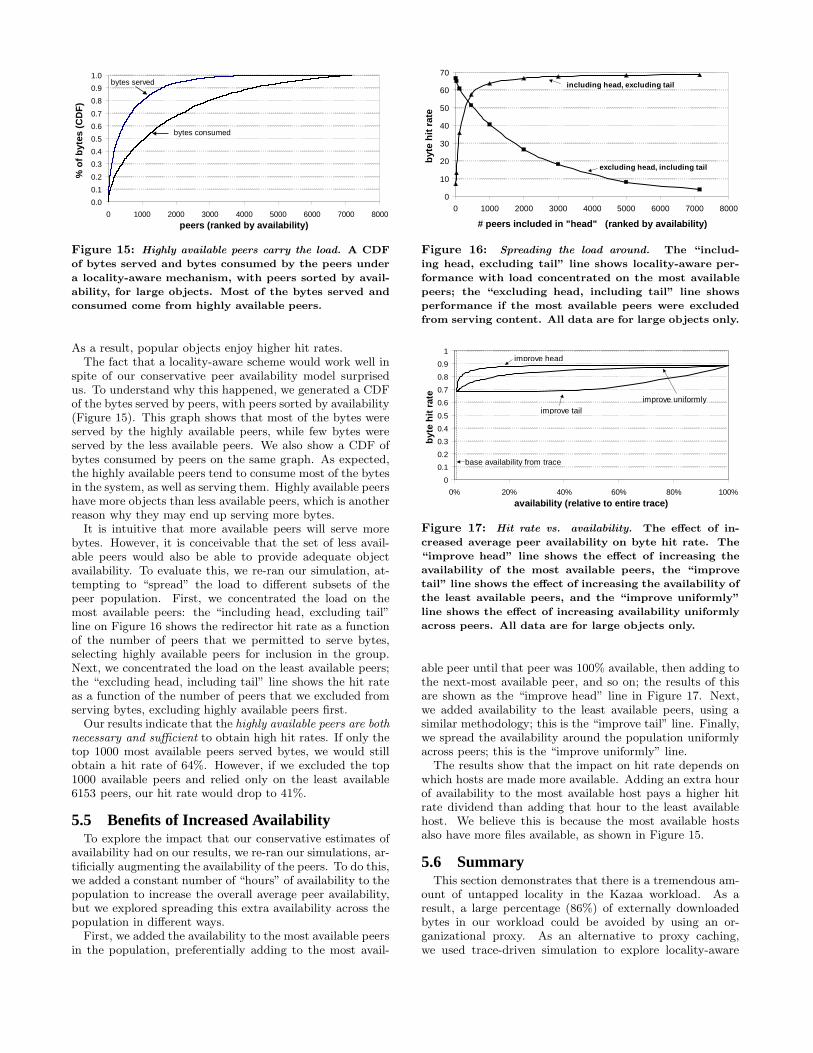
of bytes served and bytes consumed by the peers under
a locality-aware mechanism, with peers sorted by avail-
ability, for large objects. Most of the bytes served and
consumed come from highly available peers.
As a result, popular objects enjoy higher hit rates.The fact that a locality-aware scheme would work well in
spite of our conservative peer availability model surprisedus. To understand why this happened, we generated a CDFof the bytes served by peers, with peers sorted by availability(Figure 15). This graph shows that most of the bytes wereserved by the highly available peers, while few bytes wereserved by the less available peers. We also show a CDF ofbytes consumed by peers on the same graph. As expected,the highly available peers tend to consume most of the bytesin the system, as well as serving them. Highly available peershave more objects than less available peers, which is anotherreason why they may end up serving more bytes.
It is intuitive that more available peers will serve morebytes. However, it is conceivable that the set of less avail-able peers would also be able to provide adequate objectavailability. To evaluate this, we re-ran our simulation, at-tempting to “spread” the load to different subsets of thepeer population. First, we concentrated the load on themost available peers: the “including head, excluding tail”line on Figure 16 shows the redirector hit rate as a functionof the number of peers that we permitted to serve bytes,selecting highly available peers for inclusion in the group.Next, we concentrated the load on the least available peers;the “excluding head, including tail” line shows the hit rateas a function of the number of peers that we excluded fromserving bytes, excluding highly available peers first.
Our results indicate that the highly available peers are both
necessary and sufficient to obtain high hit rates. If only thetop 1000 most available peers served bytes, we would stillobtain a hit rate of 64%. However, if we excluded the top1000 available peers and relied only on the least available6153 peers, our hit rate would drop to 41%.
5.5 Benefits of Increased AvailabilityTo explore the impact that our conservative estimates of
availability had on our results, we re-ran our simulations, ar-tificially augmenting the availability of the peers. To do this,we added a constant number of “hours” of availability to thepopulation to increase the overall average peer availability,but we explored spreading this extra availability across thepopulation in different ways.
First, we added the availability to the most available peersin the population, preferentially adding to the most avail-
0
10
20
30
40
50
60
70
0 1000 2000 3000 4000 5000 6000 7000 8000
# peers included in "head" (ranked by availabilit y)
byte
hit
rate
including head, excluding tail
excluding head, including tail
Figure 16: Spreading the load around. The “includ-
ing head, excluding tail” line shows locality-aware per-
formance with load concentrated on the most available
peers; the “excluding head, including tail” line shows
performance if the most available peers were excluded
from serving content. All data are for large objects only.
0
0.1
0.2
0.3
0.4
0.5
0.6
0.7
0.8
0.9
1
0% 20% 40% 60% 80% 100%
availability (relative to entire trace)
byte
hit
rate
improve head
improve tailimprove uniformly
base availability from trace
Figure 17: Hit rate vs. availability. The effect of in-
creased average peer availability on byte hit rate. The
“improve head” line shows the effect of increasing the
availability of the most available peers, the “improve
tail” line shows the effect of increasing the availability of
the least available peers, and the “improve uniformly”
line shows the effect of increasing availability uniformly
across peers. All data are for large objects only.
able peer until that peer was 100% available, then adding tothe next-most available peer, and so on; the results of thisare shown as the “improve head” line in Figure 17. Next,we added availability to the least available peers, using asimilar methodology; this is the “improve tail” line. Finally,we spread the availability around the population uniformlyacross peers; this is the “improve uniformly” line.
The results show that the impact on hit rate depends onwhich hosts are made more available. Adding an extra hourof availability to the most available host pays a higher hitrate dividend than adding that hour to the least availablehost. We believe this is because the most available hostsalso have more files available, as shown in Figure 15.
5.6 SummaryThis section demonstrates that there is a tremendous am-
ount of untapped locality in the Kazaa workload. As aresult, a large percentage (86%) of externally downloadedbytes in our workload could be avoided by using an or-ganizational proxy. As an alternative to proxy caching,we used trace-driven simulation to explore locality-aware
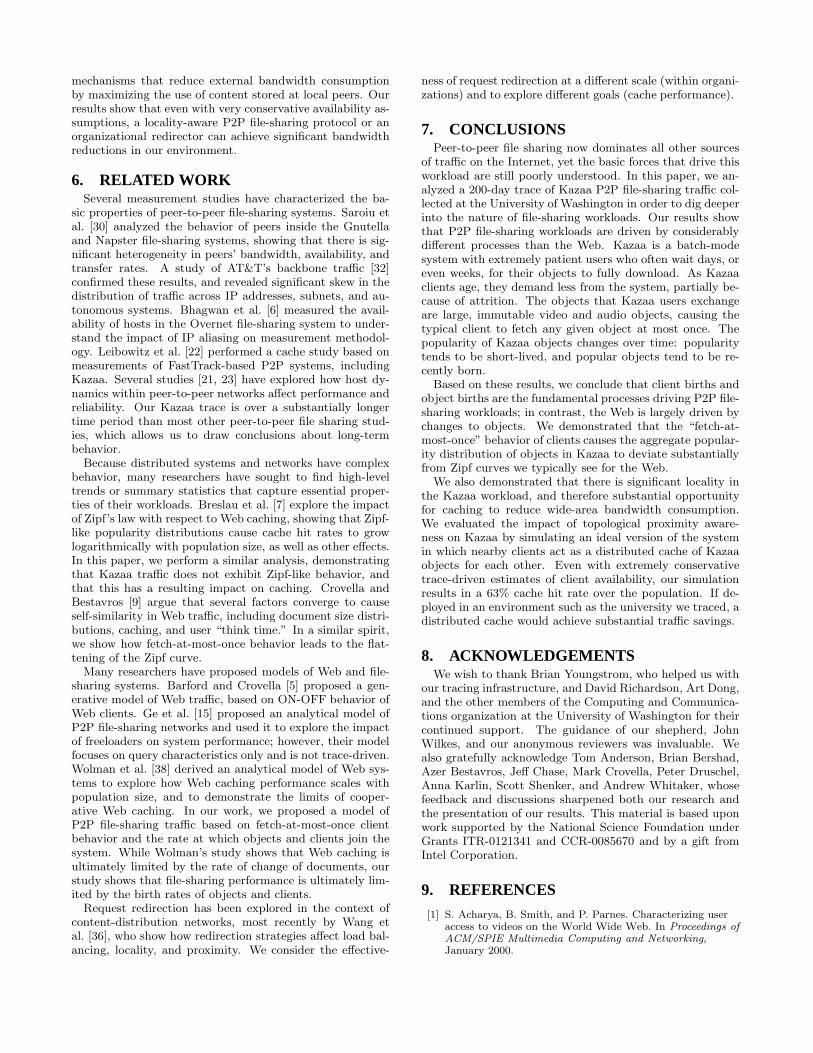
mechanisms that reduce external bandwidth consumptionby maximizing the use of content stored at local peers. Ourresults show that even with very conservative availability as-sumptions, a locality-aware P2P file-sharing protocol or anorganizational redirector can achieve significant bandwidthreductions in our environment.
6. RELATED WORKSeveral measurement studies have characterized the ba-
sic properties of peer-to-peer file-sharing systems. Saroiu etal. [30] analyzed the behavior of peers inside the Gnutellaand Napster file-sharing systems, showing that there is sig-nificant heterogeneity in peers’ bandwidth, availability, andtransfer rates. A study of AT&T’s backbone traffic [32]confirmed these results, and revealed significant skew in thedistribution of traffic across IP addresses, subnets, and au-tonomous systems. Bhagwan et al. [6] measured the avail-ability of hosts in the Overnet file-sharing system to under-stand the impact of IP aliasing on measurement methodol-ogy. Leibowitz et al. [22] performed a cache study based onmeasurements of FastTrack-based P2P systems, includingKazaa. Several studies [21, 23] have explored how host dy-namics within peer-to-peer networks affect performance andreliability. Our Kazaa trace is over a substantially longertime period than most other peer-to-peer file sharing stud-ies, which allows us to draw conclusions about long-termbehavior.
Because distributed systems and networks have complexbehavior, many researchers have sought to find high-leveltrends or summary statistics that capture essential proper-ties of their workloads. Breslau et al. [7] explore the impactof Zipf’s law with respect to Web caching, showing that Zipf-like popularity distributions cause cache hit rates to growlogarithmically with population size, as well as other effects.In this paper, we perform a similar analysis, demonstratingthat Kazaa traffic does not exhibit Zipf-like behavior, andthat this has a resulting impact on caching. Crovella andBestavros [9] argue that several factors converge to causeself-similarity in Web traffic, including document size distri-butions, caching, and user “think time.” In a similar spirit,we show how fetch-at-most-once behavior leads to the flat-tening of the Zipf curve.
Many researchers have proposed models of Web and file-sharing systems. Barford and Crovella [5] proposed a gen-erative model of Web traffic, based on ON-OFF behavior ofWeb clients. Ge et al. [15] proposed an analytical model ofP2P file-sharing networks and used it to explore the impactof freeloaders on system performance; however, their modelfocuses on query characteristics only and is not trace-driven.Wolman et al. [38] derived an analytical model of Web sys-tems to explore how Web caching performance scales withpopulation size, and to demonstrate the limits of cooper-ative Web caching. In our work, we proposed a model ofP2P file-sharing traffic based on fetch-at-most-once clientbehavior and the rate at which objects and clients join thesystem. While Wolman’s study shows that Web caching isultimately limited by the rate of change of documents, ourstudy shows that file-sharing performance is ultimately lim-ited by the birth rates of objects and clients.
Request redirection has been explored in the context ofcontent-distribution networks, most recently by Wang etal. [36], who show how redirection strategies affect load bal-ancing, locality, and proximity. We consider the effective-
ness of request redirection at a different scale (within organi-zations) and to explore different goals (cache performance).
7. CONCLUSIONSPeer-to-peer file sharing now dominates all other sources
of traffic on the Internet, yet the basic forces that drive thisworkload are still poorly understood. In this paper, we an-alyzed a 200-day trace of Kazaa P2P file-sharing traffic col-lected at the University of Washington in order to dig deeperinto the nature of file-sharing workloads. Our results showthat P2P file-sharing workloads are driven by considerablydifferent processes than the Web. Kazaa is a batch-modesystem with extremely patient users who often wait days, oreven weeks, for their objects to fully download. As Kazaaclients age, they demand less from the system, partially be-cause of attrition. The objects that Kazaa users exchangeare large, immutable video and audio objects, causing thetypical client to fetch any given object at most once. Thepopularity of Kazaa objects changes over time: popularitytends to be short-lived, and popular objects tend to be re-cently born.
Based on these results, we conclude that client births andobject births are the fundamental processes driving P2P file-sharing workloads; in contrast, the Web is largely driven bychanges to objects. We demonstrated that the “fetch-at-most-once” behavior of clients causes the aggregate popular-ity distribution of objects in Kazaa to deviate substantiallyfrom Zipf curves we typically see for the Web.
We also demonstrated that there is significant locality inthe Kazaa workload, and therefore substantial opportunityfor caching to reduce wide-area bandwidth consumption.We evaluated the impact of topological proximity aware-ness on Kazaa by simulating an ideal version of the systemin which nearby clients act as a distributed cache of Kazaaobjects for each other. Even with extremely conservativetrace-driven estimates of client availability, our simulationresults in a 63% cache hit rate over the population. If de-ployed in an environment such as the university we traced, adistributed cache would achieve substantial traffic savings.
8. ACKNOWLEDGEMENTSWe wish to thank Brian Youngstrom, who helped us with
our tracing infrastructure, and David Richardson, Art Dong,and the other members of the Computing and Communica-tions organization at the University of Washington for theircontinued support. The guidance of our shepherd, JohnWilkes, and our anonymous reviewers was invaluable. Wealso gratefully acknowledge Tom Anderson, Brian Bershad,Azer Bestavros, Jeff Chase, Mark Crovella, Peter Druschel,Anna Karlin, Scott Shenker, and Andrew Whitaker, whosefeedback and discussions sharpened both our research andthe presentation of our results. This material is based uponwork supported by the National Science Foundation underGrants ITR-0121341 and CCR-0085670 and by a gift fromIntel Corporation.
9. REFERENCES
[1] S. Acharya, B. Smith, and P. Parnes. Characterizing useraccess to videos on the World Wide Web. In Proceedings ofACM/SPIE Multimedia Computing and Networking,January 2000.
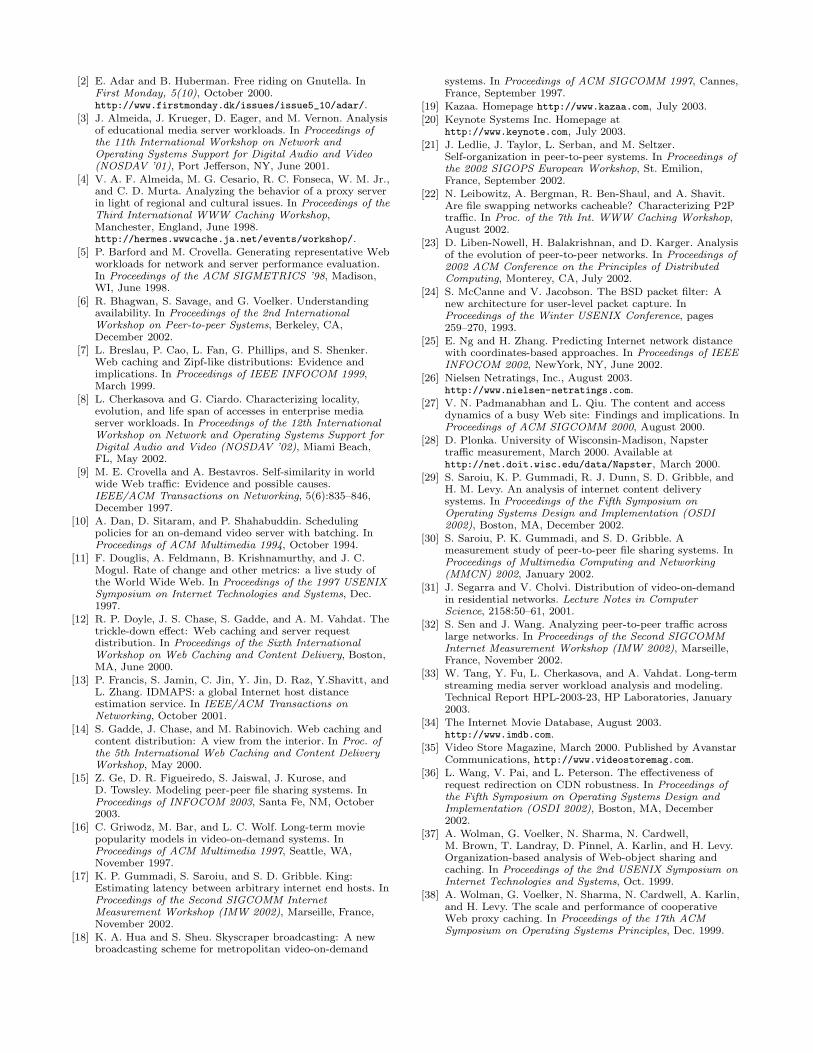
[2] E. Adar and B. Huberman. Free riding on Gnutella. InFirst Monday, 5(10), October 2000.http://www.firstmonday.dk/issues/issue5_10/adar/.
[3] J. Almeida, J. Krueger, D. Eager, and M. Vernon. Analysisof educational media server workloads. In Proceedings ofthe 11th International Workshop on Network andOperating Systems Support for Digital Audio and Video(NOSDAV ’01), Port Jefferson, NY, June 2001.
[4] V. A. F. Almeida, M. G. Cesario, R. C. Fonseca, W. M. Jr.,and C. D. Murta. Analyzing the behavior of a proxy serverin light of regional and cultural issues. In Proceedings of theThird International WWW Caching Workshop,Manchester, England, June 1998.http://hermes.wwwcache.ja.net/events/workshop/.
[5] P. Barford and M. Crovella. Generating representative Webworkloads for network and server performance evaluation.In Proceedings of the ACM SIGMETRICS ’98, Madison,WI, June 1998.
[6] R. Bhagwan, S. Savage, and G. Voelker. Understandingavailability. In Proceedings of the 2nd InternationalWorkshop on Peer-to-peer Systems, Berkeley, CA,December 2002.
[7] L. Breslau, P. Cao, L. Fan, G. Phillips, and S. Shenker.Web caching and Zipf-like distributions: Evidence andimplications. In Proceedings of IEEE INFOCOM 1999,March 1999.
[8] L. Cherkasova and G. Ciardo. Characterizing locality,evolution, and life span of accesses in enterprise mediaserver workloads. In Proceedings of the 12th InternationalWorkshop on Network and Operating Systems Support forDigital Audio and Video (NOSDAV ’02), Miami Beach,FL, May 2002.
[9] M. E. Crovella and A. Bestavros. Self-similarity in worldwide Web traffic: Evidence and possible causes.IEEE/ACM Transactions on Networking, 5(6):835–846,December 1997.
[10] A. Dan, D. Sitaram, and P. Shahabuddin. Schedulingpolicies for an on-demand video server with batching. InProceedings of ACM Multimedia 1994, October 1994.
[11] F. Douglis, A. Feldmann, B. Krishnamurthy, and J. C.Mogul. Rate of change and other metrics: a live study ofthe World Wide Web. In Proceedings of the 1997 USENIXSymposium on Internet Technologies and Systems, Dec.1997.
[12] R. P. Doyle, J. S. Chase, S. Gadde, and A. M. Vahdat. Thetrickle-down effect: Web caching and server requestdistribution. In Proceedings of the Sixth InternationalWorkshop on Web Caching and Content Delivery, Boston,MA, June 2000.
[13] P. Francis, S. Jamin, C. Jin, Y. Jin, D. Raz, Y.Shavitt, andL. Zhang. IDMAPS: a global Internet host distanceestimation service. In IEEE/ACM Transactions onNetworking, October 2001.
[14] S. Gadde, J. Chase, and M. Rabinovich. Web caching andcontent distribution: A view from the interior. In Proc. ofthe 5th International Web Caching and Content DeliveryWorkshop, May 2000.
[15] Z. Ge, D. R. Figueiredo, S. Jaiswal, J. Kurose, andD. Towsley. Modeling peer-peer file sharing systems. InProceedings of INFOCOM 2003, Santa Fe, NM, October2003.
[16] C. Griwodz, M. Bar, and L. C. Wolf. Long-term moviepopularity models in video-on-demand systems. InProceedings of ACM Multimedia 1997, Seattle, WA,November 1997.
[17] K. P. Gummadi, S. Saroiu, and S. D. Gribble. King:Estimating latency between arbitrary internet end hosts. InProceedings of the Second SIGCOMM InternetMeasurement Workshop (IMW 2002), Marseille, France,November 2002.
[18] K. A. Hua and S. Sheu. Skyscraper broadcasting: A newbroadcasting scheme for metropolitan video-on-demand
systems. In Proceedings of ACM SIGCOMM 1997, Cannes,France, September 1997.
[19] Kazaa. Homepage http://www.kazaa.com, July 2003.[20] Keynote Systems Inc. Homepage at
http://www.keynote.com, July 2003.[21] J. Ledlie, J. Taylor, L. Serban, and M. Seltzer.
Self-organization in peer-to-peer systems. In Proceedings ofthe 2002 SIGOPS European Workshop, St. Emilion,France, September 2002.
[22] N. Leibowitz, A. Bergman, R. Ben-Shaul, and A. Shavit.Are file swapping networks cacheable? Characterizing P2Ptraffic. In Proc. of the 7th Int. WWW Caching Workshop,August 2002.
[23] D. Liben-Nowell, H. Balakrishnan, and D. Karger. Analysisof the evolution of peer-to-peer networks. In Proceedings of2002 ACM Conference on the Principles of DistributedComputing, Monterey, CA, July 2002.
[24] S. McCanne and V. Jacobson. The BSD packet filter: Anew architecture for user-level packet capture. InProceedings of the Winter USENIX Conference, pages259–270, 1993.
[25] E. Ng and H. Zhang. Predicting Internet network distancewith coordinates-based approaches. In Proceedings of IEEEINFOCOM 2002, NewYork, NY, June 2002.
[26] Nielsen Netratings, Inc., August 2003.http://www.nielsen-netratings.com.
[27] V. N. Padmanabhan and L. Qiu. The content and accessdynamics of a busy Web site: Findings and implications. InProceedings of ACM SIGCOMM 2000, August 2000.
[28] D. Plonka. University of Wisconsin-Madison, Napstertraffic measurement, March 2000. Available athttp://net.doit.wisc.edu/data/Napster, March 2000.
[29] S. Saroiu, K. P. Gummadi, R. J. Dunn, S. D. Gribble, andH. M. Levy. An analysis of internet content deliverysystems. In Proceedings of the Fifth Symposium onOperating Systems Design and Implementation (OSDI2002), Boston, MA, December 2002.
[30] S. Saroiu, P. K. Gummadi, and S. D. Gribble. Ameasurement study of peer-to-peer file sharing systems. InProceedings of Multimedia Computing and Networking(MMCN) 2002, January 2002.
[31] J. Segarra and V. Cholvi. Distribution of video-on-demandin residential networks. Lecture Notes in ComputerScience, 2158:50–61, 2001.
[32] S. Sen and J. Wang. Analyzing peer-to-peer traffic acrosslarge networks. In Proceedings of the Second SIGCOMMInternet Measurement Workshop (IMW 2002), Marseille,France, November 2002.
[33] W. Tang, Y. Fu, L. Cherkasova, and A. Vahdat. Long-termstreaming media server workload analysis and modeling.Technical Report HPL-2003-23, HP Laboratories, January2003.
[34] The Internet Movie Database, August 2003.http://www.imdb.com.
[35] Video Store Magazine, March 2000. Published by AvanstarCommunications, http://www.videostoremag.com.
[36] L. Wang, V. Pai, and L. Peterson. The effectiveness ofrequest redirection on CDN robustness. In Proceedings ofthe Fifth Symposium on Operating Systems Design andImplementation (OSDI 2002), Boston, MA, December2002.
[37] A. Wolman, G. Voelker, N. Sharma, N. Cardwell,M. Brown, T. Landray, D. Pinnel, A. Karlin, and H. Levy.Organization-based analysis of Web-object sharing andcaching. In Proceedings of the 2nd USENIX Symposium onInternet Technologies and Systems, Oct. 1999.
[38] A. Wolman, G. Voelker, N. Sharma, N. Cardwell, A. Karlin,and H. Levy. The scale and performance of cooperativeWeb proxy caching. In Proceedings of the 17th ACMSymposium on Operating Systems Principles, Dec. 1999.