Embed Size (px)
Citation preview

The National Physical Laboratory is operated on behalf of the DTI by NPL Management Limited, a wholly owned subsidiary of Serco Group plc
The Scratch Test:Calibration,
Verification and theUse of a Certified
Reference Material
N M Jennett and S Owen-Jones
Measurement Good Practice Guide
No. 54
GPG cover 54 3/7/03 9:14 am Page 2

Measurement Good Practice Guide No 54
The Scratch Test: Calibration, Verification and the Use of a Certified Reference Material
N M Jennett and S Owen-Jones NPL Materials Centre
National Physical Laboratory Abstract The scratch test is a simple engineering test method used to assess adhesive bonding between coatings and substrates. This Guide aims to help you get the best out of your scratch tester. The Guide also explains the documents that you need to refer to if you want to carry out the test in a reproducible way. In particular, the Guide describes the new diamond-like carbon (DLC) coated certified reference material (CRM), BCR-692. Methods and strategies are described for using the CRM to compare results from different instruments and to enable the user to detect errors in the test, especially those caused by the tip of the stylus deviating from the required shape.

© Crown Copyright 2002 Reproduced by permission of the Controller of HMSO ISSN 1368�6550 December 2002
National Physical Laboratory Teddington, Middlesex, United Kingdom, TW11 0LW
Acknowledgements This guide has been produced as part of the Characterisation and Performance of Materials (CPM) programme, a programme of underpinning research financed by the United Kingdom Department of Trade and Industry. The authors gratefully acknowledge the many helpful discussions with Peter Harris of the NPL Centre for Mathematics and Scientific Computing and the advice of the Surface Technology Industrial Advisory Group. For further information on Characterisation and Performance of Materials contact the Materials Enquiry Point at the National Physical Laboratory: Tel: 020 8943 6701 Fax: 020 8943 7160 E-mail: [email protected] Website: www.npl.co.uk

The Scratch Test: Calibration, Verification and the Use of a Certified Reference Material Contents Foreword ............................................................................................................................................. i 1 Introduction...............................................................................................................................1
1.1 General Background to the Scratch Test .............................................................................1 1.1.1 Usual Procedure of the Scratch Test .............................................................................1 1.1.2 Measurement of Critical Load, Lc ................................................................................2
1.2 Calibration ...........................................................................................................................4 1.3 Why Use a Reference Material? ..........................................................................................5
2 BCR-692 Certified Reference Material...................................................................................5 2.1 Selection and Production .....................................................................................................6 2.2 Certification .........................................................................................................................6
2.2.1 Investigations Undertaken.............................................................................................6 2.2.2 Certified values and verification ranges........................................................................8
3 Use of the CRM in Scratch Tests.............................................................................................9 3.1 Calibration of the Scratch Test Instrument ........................................................................10 3.2 Test Procedure ...................................................................................................................11
3.2.1 Environment................................................................................................................11 3.2.2 Cleaning the stylus ......................................................................................................11 3.2.3 Cleaning the CRM ......................................................................................................11 3.2.4 Test Parameters ...........................................................................................................11 3.2.5 Measuring Critical Loads............................................................................................12
4 Interpretation of Results ........................................................................................................13 4.1 Is your scratch test instrument operating well?..................................................................13 4.2 Are your results in the right range? ...................................................................................14 4.3 Using the CRM to improve scratch test instrument performance .....................................15 4.4 Is it the stylus or the calibration? .......................................................................................18 4.5 Use of the CRM to compare results between two laboratories..........................................21
5 Test Report ..............................................................................................................................24 References .........................................................................................................................................25 List of Acronyms, Symbols and Abbreviations .............................................................................26 Annex A: Instrument Calibration – Mandatory Procedures .......................................................27 Annex B: Description of Failure Events.........................................................................................32


Measurement Good Practice Guide No. 54
List of Figures Figure 1: A simple diagram of the scratch test.....................................................................................2 Figure 2: Typical trace for acoustic emission and friction force ..........................................................3 Table 1: Certified values (CV), certified range (UNC) and verification ranges (VR 5) for an
average of five scratches and uncertainty components. Units are all in N. The coverage factor applied to UNC and VR(5) is k = 2 to calculate the 95% confidence interval. .................9
Figure 3: Suggested optimum layout of scratches on CRM...............................................................12 Table 2: Comparison table for standard deviation of five Lc values for each critical load................14 Table 3: Lower and upper limits of the verification range for each critical load for an average
of 5 scratches ..............................................................................................................................14 Figure 4: Example of how a combination of laboratory, sample and stylus offsets shifts the
value a laboratory is expected to produce. CV = Certified value for all CRM samples, CRM = the (unknown) Lc value for the particular CRM sample being used. ...........................16
Table 4: Expanded (95%) ranges of offsets due to each scratch test component...............................16 Figure 5 : Example of a control chart for Lc1 (average of 5 scratches) .............................................17 Figure 6: Decision Tree for Verification testing using BCR-692 CRM.............................................18 Figure 7: Flow Chart for diagnosis of control chart anomalies or verification failure using a
Master-stylus ..............................................................................................................................20 Figure 8: Strategy for CRM and Master stylus use in diagnosis of stylus or calibration failure.
Each vertical line represents a test using the linked stylus and CRM sample............................20 Figure 9: Schematic representation of the possible difference between two laboratories testing
a common CRM sample with a common stylus. The difference in Lc is an estimate of the difference in laboratory offsets...................................................................................................22
Table 5: (tn/√n) multiplication factor as a function of the number of measurements averaged. (The uncertainty in an average is the standard deviation of the values averaged multiplied by tn/√n). n is the number of measurements, tn is the 95% coverage factor from the t-statistic........................................................................................................................................22
Figure 10: Schematic representation of comparison between laboratories using a common CRM sample. The difference in Lc values is an estimate of the combined laboratory plus stylus offsets ...............................................................................................................................23
Figure A.1: Example of experimental setup for calibration of applied load ..................................28 Figure A.2: Example of experimental setup for calibration of horizontal displacement ...............30 Figure A.3: Schematic for determination of scratch displacement ................................................31 Figure B1: Micrograph of scratch track showing forward chevron tracks and Lc1. S.D.
indicates scratch direction ..........................................................................................................32 Figure B2: Micrograph of scratch track showing chevron tracks, local interfacial spallation
and Lc2. S.D. indicates scratch direction....................................................................................33 Figure B3: Micrograph of scratch track showing chevron tracks, gross interfacial spallation
and Lc2 .....................................................................................................................................33

Measurement Good Practice Guide No. 54
Figure B4: Micrograph of scratch track showing gross interfacial shell-shaped spallation and Lc3 measured at the edge nearest the scratch start at the track centre. ................................34
Figure B5: Micrograph of scratch track showing failure initiated at coating defect. The failure does not occur in a regular way and leads to a false value of critical load .....................34

Measurement Good Practice Guide No. 54
i
Foreword The purpose of this guide is to promote best practice in the scratch test and to provide strategies to help users exploit the CRM. The Certified Reference Material (CRM) BCR-692 has been designed to verify the correct function of scratch test instruments used to test hard coatings, of up to 20 µm thickness, by the increasing load scratch test method. The CRM may also be valuable for testing whether the equipment is working correctly when the scratch test is performed in a different mode or with different materials. This Guide is pitched at the level of the technician or researcher, who uses the scratch test as a measure of coating adhesion and who already has some knowledge of the use of scratch test instruments. The Guide is intended as a supplement to documents that already exist, which explain the scratch test method and describe the CRM, in particular the European Standard EN 1071-31 which details the scratch test method and the certification report for the BCR-692 certified reference material2. It is possible to read this Guide as a stand-alone document, as it explains the sections of these documents relevant to the test procedure and the use of the CRM, but the reader is encouraged to refer to the other documents for further information. Generally, a summary paragraph introduces each section so that if you are already familiar with the information or if you are not interested in the details you can skip ahead to the sections of most interest to you. The annexes give information that is more detailed.


Measurement Good Practice Guide No. 54
1
1 Introduction
1.1 General Background to the Scratch Test This is only a brief introduction to the scratch test because this Guide assumes that you already have some knowledge of the scratch test and are familiar with its use. Coatings are used in a wide variety of applications and whether they adhere sufficiently to the underlying substrate is of great importance. In many cases, the adhesion of a coating to its substrate is a limiting factor for its use in certain applications. The scratch test was developed as a quick and simple method to test coating adhesion. It can be used to test a wide range of coatings, from wear resistant coatings on cutting tools to organic coatings, such as paint. Multiple scratches in the same place can also be used as a tribological test to assess the wear resistance of surfaces, including bulk materials. The Certified Reference Material, BCR-692, that this Guide describes has been certified for the verification of scratch test instruments that are used generally to test hard coatings less than 20 µm thick.
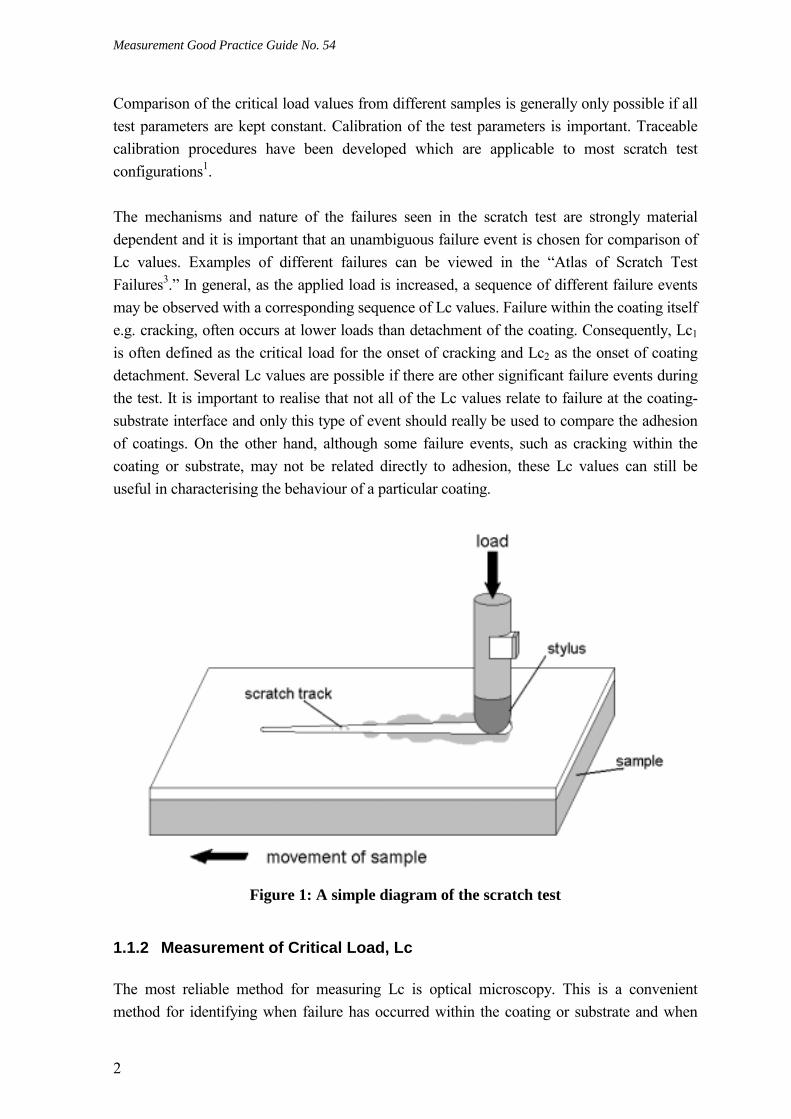
1.1.1 Usual Procedure of the Scratch Test The scratch test consists of pressing a diamond stylus onto the surface of the coating, using either a constant or an increasing load, whilst moving the sample at a constant speed (Figure 1). The test at constant load may be a single-pass scratch test or a multiple-pass scratch test. This Guide focuses on the single pass, increasing load scratch test as the CRM, BCR-692, is only certified for use in this mode. In the increasing load test, the load necessary to cause some readily identifiable coating failure is known as a critical normal load, Lc. These Lc values form the basis for comparing coating adhesion. The value of a particular Lc depends on a number of parameters, some of which are related to the coating/substrate system and some of which are related to the test itself. Coating/substrate parameters affecting Lc Test-specific parameters affecting Lc Substrate hardness, modulus and roughness; Sample planarity (flatness and levelness) Coating hardness, modulus and roughness; Loading rate;
Coating thickness; Stylus traverse speed; Friction coefficient between coating and stylus, Diamond stylus tip radius and shape (wear)
Internal stress in the coating. Instrument stiffness Environmental conditions
Measurement Good Practice Guide No. 54
2
Comparison of the critical load values from different samples is generally only possible if all test parameters are kept constant. Calibration of the test parameters is important. Traceable calibration procedures have been developed which are applicable to most scratch test configurations1. The mechanisms and nature of the failures seen in the scratch test are strongly material dependent and it is important that an unambiguous failure event is chosen for comparison of Lc values. Examples of different failures can be viewed in the �Atlas of Scratch Test Failures3.� In general, as the applied load is increased, a sequence of different failure events may be observed with a corresponding sequence of Lc values. Failure within the coating itself e.g. cracking, often occurs at lower loads than detachment of the coating. Consequently, Lc1 is often defined as the critical load for the onset of cracking and Lc2 as the onset of coating detachment. Several Lc values are possible if there are other significant failure events during the test. It is important to realise that not all of the Lc values relate to failure at the coating-substrate interface and only this type of event should really be used to compare the adhesion of coatings. On the other hand, although some failure events, such as cracking within the coating or substrate, may not be related directly to adhesion, these Lc values can still be useful in characterising the behaviour of a particular coating.
Figure 1: A simple diagram of the scratch test
1.1.2 Measurement of Critical Load, Lc The most reliable method for measuring Lc is optical microscopy. This is a convenient method for identifying when failure has occurred within the coating or substrate and when

Measurement Good Practice Guide No. 54
3
there has been a failure at the coating-substrate interface. In the ramped load scratch test, the distance between the start of the scratch and the specific damage events under investigation can be measured easily. The critical load can then be calculated from the scratch length by using the ratio of (loading rate / sample velocity). Many scratch testing systems are able to measure acoustic emission and the frictional force on the stylus during scratching. Typically, acoustic emission is picked up by a piezoelectric detector fixed next to the stylus. At the start of a scratch, the signal is normally small and relatively steady until a critical load is reached. As a critical load is passed, the acoustic emission increases rapidly and may saturate at a maximum value which does not increase any further even if the load increases further (see Figure 2). A critical load, LcAE may be defined as the load value at which the acoustic emission suddenly increases. There is usually good correlation between acoustic emission determined Lc values and those obtained by microscopy4. An advantage of acoustic emission is that it is more easily automated for quality control during the production of a large number of parts.
Figure 2: Typical trace for acoustic emission and friction force
The acoustic emission signal detected when the coating cracks through its thickness is negligible compared with that produced when the coating flakes off, so the very first failure may not always be detected by this method. The exact source of the acoustic emission is not always clear. Acoustic emission may result from elastic energy being rapidly released during

Measurement Good Practice Guide No. 54
4
the rupture of the coating (or the interface) and it may also result from the diamond stylus bumping over variable surface damage caused by coating failure5. Friction plays an important role in scratch tests. The friction force is stable when coating adhesion is good but becomes unstable when the adhesion is poor. Changes in friction force usually match changes in the acoustic emission signal. In friction force measurements Lc1 is indicated by an increase in friction force followed by signs of stick/slip behaviour. Lc2 is indicated by the friction force increasing suddenly to a maximum value5 (see Figure 2). Friction force signals have been found to be more sensitive than acoustic emission at detecting failures in very thin coatings (less than 1 µm)6. Lc values can therefore be defined using acoustic emission and/or frictional force. Usually two distinct Lc values can be assigned at transition points in the traces for both acoustic emission and friction force output. The lower transition is related to the onset of cracking within the coating and the higher one to coating penetration and detachment. These methods can provide continual recording of the test results and are particularly useful in testing transparent coatings or coatings the same colour as the substrate, where microscopy is difficult or useless. This Guide concentrates on microscopy of the scratch track as the most reliable method for measuring Lc values, as it is difficult to differentiate between cohesive and adhesive failures using acoustic emission or friction force signals alone. In addition, the CRM has not been certified for acoustic emission or friction force detection of Lc. In general, it is recommended that if your test instrument has facilities for measuring Lc by acoustic emission and/or friction force it is good practice to record the values and include them in any test reports but it is still best to confirm the Lc for failure events by optical microscopy.
1.2 Calibration Calibration of the scratch tester is the only way of knowing whether a change in the Lc values measured is due to a real change in the material or a shift in the instrument calibration. This is important if results are to be relied upon over time and is essential if results generated by different instruments are to be compared. �Traceable� calibration of the machine involves calibration by comparison with nationally agreed scales or instruments and, when done properly, not only guarantees correct calibration but usually provides an estimate of the uncertainty of the calibration as well. Standard methods for calibrating the scratch tester exist in EN 1071-3:2000 and are summarised in Annex A.
Measurement Good Practice Guide No. 54
5
1.3 Why Use a Reference Material? It has been shown that the dominant source of error in the scratch test is the stylus7. Worn or damaged styli can alter the scratch test result by a factor of 2 and many styli simply do not conform to ISO 6508 part 2. It is good practice only to use calibrated styli. It is best to use styli that are accompanied by a certificate and by measurement data to prove that they have the correct shape. Even for styli that comply with the standard, the scratch test results will be significantly different depending on the particular radius of stylus used within the allowable range. Wear and damage of a once good stylus is also common, particularly when scratching very hard and rough surfaces. It is therefore crucial to monitor the stylus shape. This can be done to some degree by optical microscopy. Cracks and gross wear or chipping of the stylus can be seen in this way. Regular shape measurement by an accredited laboratory is also possible, although costly and time consuming. Regular replacement of styli has similar drawbacks. The quickest and cheapest check for stylus damage in a calibrated instrument is to periodically perform a scratch test on a certified reference material (CRM) and maintain a chart of stylus performance. Such a control chart forms the basis of many useful strategies as will be explained later. In some circumstances an in-house reference material may be used to form the basis of control chart measurements. This may be useful if the properties of the material are very close to those of the samples being tested, there is an historical requirement for such comparisons (compatibility with previous best practice) or if very frequent tests are required. However, such an in-house material will not have been certified for stability or reproducibility or sensitivity and each control scratch will wear the stylus by the same amount as a test scratch. It may therefore be a false economy to adopt this method. The advantage of using a CRM instead of, or as well as, an in-house reference material is that your values for Lc can be directly compared with those of other operators of scratch test instruments.
2 BCR-692 Certified Reference Material The CRM �BCR-692� was developed and certified in the EC funded project � �REMAST�. Details of the certification process and results are to be found in the certification report provided with the CRM2. This section is a brief summary of the work done and the calculations behind the certification of the reference material.

Measurement Good Practice Guide No. 54
6
2.1 Selection and Production Initially, a feasibility study was undertaken on two candidate coating-types: TiN and DLC. The DLC coating system was chosen as the CRM was because:
• It showed higher sensitivity to changes in the stylus tip radius than did TiN. • It showed greater homogeneity between batches. • Scratches on the DLC coating caused less stylus wear than scratches on the TiN
Coating. The reference samples are 30 mm x 30 mm x 5 mm hardened tool steel coupons with a DLC coating applied by plasma-assisted chemical vapour deposition. The certified samples were produced in eleven batches of one hundred specimens. Each specimen has been labelled with a code REMAST 0001 to REMAST 1099. The first two digits represent the batch number 00 - 10 and the second two digits represent the sample number, 00 - 99. Each CRM sample is supplied in a box containing some desiccant. The CRM should be stored in this box or in a laboratory desiccator and only removed for the duration of the tests. Care must be taken to maintain the cleanliness of the test samples. In particular, finger marks must be avoided, as these are corrosive and/or lubricating.
2.2 Certification Certification of critical load values was carried out by nine laboratories, each using one of three different types of scratch testing instruments, calibrated according to EN1071-3. The calibration procedures included verification of sample flatness, load, loading rate, horizontal displacement and displacement rate. A traceably calibrated load cell and a traceably calibrated displacement transducer were circulated among the participants for traceable calibration of the load and displacement of all instruments. The participants reported the calibration data together with the test results.
2.2.1 Investigations Undertaken Homogeneity was investigated using a single laboratory and stylus so that only effects due to variation in sample properties would be observed. It was important to test the homogeneity of the samples, as it was possible that different deposition conditions might be found at different locations within the coating chamber. Likewise, each batch may have been subject to slightly different deposition settings. Three types of variation were therefore considered:

Measurement Good Practice Guide No. 54
7
i) between samples from different batches (denoted ubb), ii) between different samples taken from the same batch (denoted ubs), iii) between different areas on the same sample (denoted uws).
The Lc differences arising from these variations in properties were estimated for each failure event. The samples were tested for stability at a high temperature of +40 °C and a low temperature of -50°C after storage in a desiccator and in air. No instability was detected. Each participant was provided with two randomly chosen samples and a specially prepared Rockwell C diamond stylus. Each laboratory then made 40 scratches on each sample with a minimum (starting) load of 5 N; a maximum load of 45 N; a load rate of 100 N min-1, and a displacement rate of 100 mm min-1. Critical loads were reported for three different failure events. Lc1 for forward chevron cracks at the borders of the scratch track; Lc2 for forward chevron cracks at the borders of the scratch track with local or gross interfacial spallation, and Lc3 for gross interfacial shell-shaped spallation within the scratch track (Annex B). After these tests were completed, all of the samples and styli were returned to the �pilot� laboratory in order to perform control scratches. 5 scratches were made on each sample using the same stylus as the initial laboratory and 5 scratches using a �control stylus�. Styli of different radii will result in different Lc values, even if the same instrument and CRM sample are used. A specific stylus sensitivity test was therefore carried out to estimate the variation, uss, of Lc values arising from stylus effects. The pilot laboratory took eight styli with radii in the range 200 ± 10 µm (the range allowed by ISO 6508-2) and made nine scratches with each on the same CRM sample. The styli were assumed to be a random sample and so representative of all styli with radius 200 ± 10 µm that might be used in scratch testing. Even within the certification exercise, the discriminating and diagnostic power of the CRM became evident. Although all the scratch test instruments in the certification exercise were calibrated according to the requirements of EN 1071-3, the control experiments made it possible to show that there remained a systematic difference between Lc values obtained by different laboratories using the same stylus and sample. The range of offsets arising from different laboratories in the certification campaign, ul, was therefore estimated and included in calculations of the acceptable range of values. (Note, the ul offsets may include contributions from both the variations in scratch test instruments and variation in laboratory performance. These two effects cannot be separated).

Measurement Good Practice Guide No. 54
8
2.2.2 Certified values and verification ranges This section describes how, for each critical load, a certified value (CV) with certification range (UNC) and a verification range (VR(5)) have been calculated. These values are shown in Table 1. All three critical load values were certified. For each Lc, the single certified value for the CRM was taken to be the average of all acceptable certification results. This was obtained by taking the average of the 18 Lc values (themselves averages of 40 scratches) returned by the laboratories in the certification exercise. In the case of Lc3, the data from two labs was excluded as being outside the normal distribution of results from all labs and so the certified value was an average of 14 results. A single certification value has been assigned to all 1100 samples produced. Variations within sample, between samples and between batches will cause the actual Lc value to be obtained to be distributed about the certified value. This distribution can be estimated as an expanded uncertainty, UNC, according to the equation: UNC = ± k(s2
c/p + u2bb + u2
bs+ u2ws)1/2
where sc = the standard deviation of the Lc values in the certification data p = number of accepted data sets, sc/√p represents the uncertainty in measuring the average Lc value for all the data. ubb, ubs and uws are the variations in Lc values due to sample choice as (see Section 2.2.1), k is a coverage factor to expand the range to span 95% of possible results. This range is often called the �95% confidence interval� because you can be confident that in 95% of cases the value will be in this range. Putting this the other way round, there is only a 5% chance of a valid value falling outside this range. The certified value, range (UNC), and uncertainty components are given in Table 1. The certification range represents the uncertainty in measuring the CRM properties and the variation of those properties that may be expected over the 1100 possible samples. Essentially it represents the range in which 95% of Lc values would fall if measured by the �average stylus and instrument.� The certification range does not include any of the offsets that will be caused by using a different instrument and/or stylus. Comparison between different laboratories is always affected by these offsets and so the range of Lc values expected from all the calibrated instruments and all the styli possible is much larger than the certified range. It is therefore important to define a �verification range� so that laboratories can determine whether they have a properly working instrument. For a particular instrument and stylus, the offsets are a constant. It is therefore possible to define a verification range by simply including the stylus and laboratory offset distributions in the expanded uncertainty. However, a more accurate comparison is possible if more than one

Measurement Good Practice Guide No. 54
9
scratch is made and an average value is compared. The uncertainty in the average value is reduced by the square root of the number of scratches averaged. In practice, however, it is costly in both time and materials to average too many scratches and so a verification range based on averaging 5 scratches has been calculated. This is a combination of material effects (including sample choice), laboratory and stylus and has been calculated using the following formula: VR(5) = ± k.(sc
2/p + u2bb + u2
bs+ u2ws/5 + u2
ss+ u2l)1/2
Put in words, the VR(5) is the range of values about CV within which 95% of all averages of 5 scratches would fall, if they were made using any of the CRM samples with any properly calibrated instrument and any ISO6508-2 compliant stylus. Alternatively put, there is only a 5% chance that a valid average of 5 scratches would fall outside this range. The additional terms uss and ul are defined in Section 2.2.1 and are given in Table 1. ubb ubs uws sc p uss ul CV UNC VR (5)
Lc1 0.40 0.49 0.55 1.72 18 1.05 0.8 13.6 ± 1.9 ± 3.1 Lc2 0.44 0.49 0.53 2.31 18 2.26 1.11 17.0 ± 2.0 ± 5.4 Lc3 0.8 0.81 1.30 1.78 14 1.34 2.11 27.9 ± 3.6 ± 5.7
Table 1: Certified values (CV), certified range (UNC) and verification ranges (VR 5) for an average of five scratches and uncertainty components. Units are all in N. The coverage factor applied to UNC and VR(5) is k = 2 to calculate the 95% confidence interval. As can be seen from the listed �u� values in Table 1, the largest component of uncertainty for Lc1 and Lc2 is the stylus related term, uss. This confirms the high sensitivity of the test to stylus effects7. Machine/laboratory effects, ul , also play a major role. The verification range, VR(5), is useful for users of the CRM who need to verify their own scratch testing instruments and have no previous scratch testing history.
3 Use of the CRM in Scratch Tests This section gives a summary of how to calibrate a scratch tester, how to perform a test and how to calculate an Lc value. It is important however, to note a couple of limitations to the CRM. Note 1: Diamond does not form spheres very easily. Rockwell C styli are usually bumpy and have a radius that changes with depth and orientation. The certified values for the CRM �BCR-692� correspond to scratch track widths of 50 - 85 µm and Lc values

Measurement Good Practice Guide No. 54
10
13.6 - 27.9 N. Thus, although the CRM will usually give a good indication that scratch test equipment is working correctly, the test circumstances that it directly corresponds to are restricted to low depth scratch testing, e.g. of hard coatings, where deep penetration rarely occurs. In a softer material, penetration could be a lot deeper so that more than just the tip of the stylus is involved in making the scratch. In these circumstances, different parts of the indenter and even the cone angle may be the dominant feature of the stylus contact rather than the very tip as used when testing the CRM. Note 2: The CRM cannot be used to calibrate the scratch tester literally �from scratch.� The verification ranges are relatively wide (due to the combination of material and test-related offsets / uncertainties) and it is possible that the instrument and stylus may have significant, but counteracting defects, that artificially keep the measured critical load values within the verification ranges. For example, Lc values tend to increase as the stylus radius increases, thus a worn stylus and a poor force calibration may counteract each other. (This is a problem because the cancellation of errors will only happen for materials of a particular hardness. Change the hardness and the penetration depth will change and the balance of errors will shift). With regular calibration, the use of the CRM for verification, as described below, is a good guarantee that the scratch-test instrument is operating correctly but it is not foolproof or immune to deliberate fraud.
3.1 Calibration of the Scratch Test Instrument Before performing scratch tests on the reference material, the scratch test instrument should be calibrated according to EN 1071-3. This standard differentiates between mandatory and optional calibration procedures as follows: Mandatory:
1) The procedure to estimate sample flatness prior to testing. 2) The calibration of the load cell that measures applied load. 3) The calibration of the measurement of horizontal displacement of the stylus across
the sample. Optional:
4) The calibration of the load cell which measures frictional load. 5) The calibration of horizontal static stiffness parameters. 6) The calibration of the vertical static stiffness parameters. 7) The calibration of the measurement of vertical displacement of the stylus into the
sample. 8) A simple procedure that yields qualitative information on the dynamic stiffness
response of the scratch test system.

Measurement Good Practice Guide No. 54
11
9) A procedure for the evaluation of the mechanical impedance response of the scratch tester.
The mandatory procedures are outlined in Annex A, but for details on the optional calibration procedures refer to Annex B of EN 1071-3.
3.2 Test Procedure
3.2.1 Environment The temperature and relative humidity of the test environment should be recorded and controlled, if possible, to ensure repeatability. Tribology laboratory conditions are recommended whenever possible (22°C ± 2°C; 50 % ± 10 % RH).
3.2.2 Cleaning the stylus The stylus must be cleaned before each scratch. Clean it by wiping it with a soft tissue soaked in petroleum ether. If you can see debris stuck to the stylus using an optical microscope (recommended magnification: 200X), clean with #1200 and #2400 SiC or emery paper, and wipe with a soft tissue soaked in petroleum ether. Check the stylus regularly using an optical microscope to ensure that it is not chipped or cracked. Allow at least 1 minute equilibration time between cleaning and testing. Do not use ultrasonic cleaning for the stylus, as cavitation damage may occur. The effective radius and shape of the stylus will change with orientation in the instrument. Take care not to mis-orient the stylus in the holder when remounting it between inspection and scratch tests. Even a 180° rotation can change the results obtained. It is essential that the stylus body is marked to show the scratching direction. Each scratch must be made in the same direction normally with the mark �upstream� of the scratch.
3.2.3 Cleaning the CRM Clean the BCR-692 reference sample before each series of scratches and at least every day of use, using the following procedure: Place it in an ultrasonic bath of clean �pro analysi� (e.g. ANALAR® grade) petroleum ether for 5 minutes. After drying, allow at least 3 minutes equilibration time before testing. If drying stains are observed, wipe with a soft tissue soaked in petroleum ether, and allow at least a further 3 minutes equilibration time before testing. The sample surface and stylus tip must be kept free of fingerprints.
3.2.4 Test Parameters Set the test parameters to: start load = 5 N; maximum load = 45 N; load rate = 100 N min-1, and displacement rate = 100 mm min-1. Make five scratches on the sample, parallel to one another and to the edge of the sample so that the maximum number of scratches can be fitted

Measurement Good Practice Guide No. 54
12
on the specimen. The stylus should be cleaned between scratches as described in section 3.3.2. Leave a gap of 3 mm from the edge of the sample and 1 mm between scratches so that there are no edge effects or effects from previous scratch tests. If carefully done, this should enable at least 80 and up to 125 scratches per CRM sample (5 columns of 25 scratches).
Figure 3: Suggested optimum layout of scratches on CRM It is useful to keep a record of the location of the scratches made on the CRM, for example, by using a pro forma table or a labelled photograph. This helps if there is a need to refer back to previous scratches. Note, however, that ultrasonic cleaning of the sample will affect the damage/appearance of the scratch and re-measurement of Lc values thereafter will often yield slightly different results.
3.2.5 Measuring Critical Loads Examine the scratch tracks with an optical microscope (recommended magnification 200x) and determine the critical loads Lc1, Lc2 and Lc3 corresponding to the failure events defined in Annex B. Critical load values correspond to the start of regular occurrence of the associated failure event. Careful attention must be paid to the exact definition of each failure event. For example, the start of forward chevron cracks at the borders of the scratch track (Lc1) is sometimes hard to detect. After you have found the start of forward chevron cracking you should check the previous section of the scratch track again in case there are earlier occurrences, which would lead to a lower value of Lc1. In the unlikely event of a scratch track crossing a coating defect (see Annex B), a failure event may be initiated which would give a �false� value for critical load, so this value should be ignored and the scratch should be repeated. Critical load values must be determined before ultrasonic cleaning of the specimen. The following equation can be used to calculate critical load, Lc, values:
Lc = a. xm + Ls
3 mm border around
1 mm scratch separation
Expected scratch length
Measurement Good Practice Guide No. 54
13
where xm = the measured distance between the start of scratch track and the failure event. a = the calibrated loading rate divided by the calibrated sample velocity. Ls = is the calibrated actual starting load. The total length of the scratch should also be recorded as a check on the loading and sample movement rates.
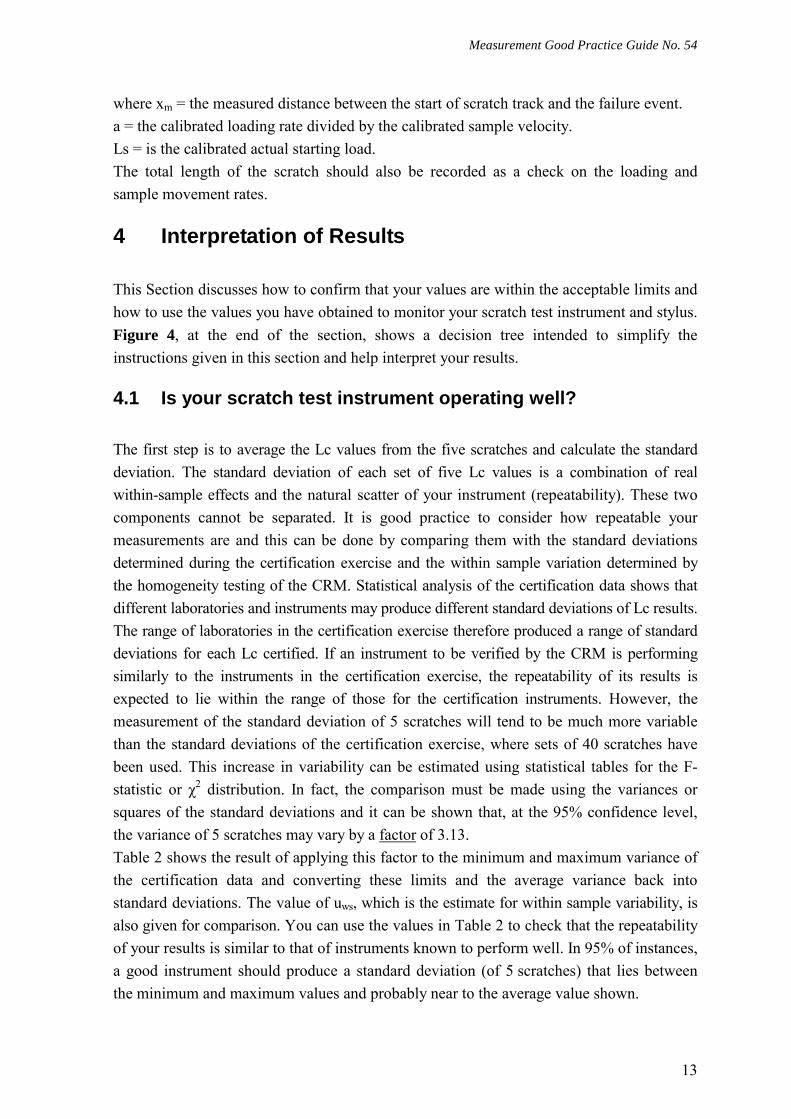
4 Interpretation of Results This Section discusses how to confirm that your values are within the acceptable limits and how to use the values you have obtained to monitor your scratch test instrument and stylus. Figure 4, at the end of the section, shows a decision tree intended to simplify the instructions given in this section and help interpret your results.
4.1 Is your scratch test instrument operating well? The first step is to average the Lc values from the five scratches and calculate the standard deviation. The standard deviation of each set of five Lc values is a combination of real within-sample effects and the natural scatter of your instrument (repeatability). These two components cannot be separated. It is good practice to consider how repeatable your measurements are and this can be done by comparing them with the standard deviations determined during the certification exercise and the within sample variation determined by the homogeneity testing of the CRM. Statistical analysis of the certification data shows that different laboratories and instruments may produce different standard deviations of Lc results. The range of laboratories in the certification exercise therefore produced a range of standard deviations for each Lc certified. If an instrument to be verified by the CRM is performing similarly to the instruments in the certification exercise, the repeatability of its results is expected to lie within the range of those for the certification instruments. However, the measurement of the standard deviation of 5 scratches will tend to be much more variable than the standard deviations of the certification exercise, where sets of 40 scratches have been used. This increase in variability can be estimated using statistical tables for the F-statistic or χ2 distribution. In fact, the comparison must be made using the variances or squares of the standard deviations and it can be shown that, at the 95% confidence level, the variance of 5 scratches may vary by a factor of 3.13. Table 2 shows the result of applying this factor to the minimum and maximum variance of the certification data and converting these limits and the average variance back into standard deviations. The value of uws, which is the estimate for within sample variability, is also given for comparison. You can use the values in Table 2 to check that the repeatability of your results is similar to that of instruments known to perform well. In 95% of instances, a good instrument should produce a standard deviation (of 5 scratches) that lies between the minimum and maximum values and probably near to the average value shown.

Measurement Good Practice Guide No. 54
14
Lc uws Av. standard deviation in
Certification (40 scratches)
Max. expected standard deviation for 5 scratches
Min. expected standard deviation
for 5 scratches Lc1 0.55 N 0.8 2.7 0.2 Lc2 0.53 N 1.2 3.2 0.3 Lc3 1.30 N 2.2 6.9 0.5
Table 2: Comparison table for standard deviation of five Lc values for each critical load. It is not necessarily a good thing if the standard deviation of your results is very low. If the standard deviation of your set of 5 scratches is lower than the minimum, for example, this could be due to a low resolution of measurement of the scratch distances and could therefore be an indication of bad performance. If the standard deviation of your scratches is above the maximum, it is likely that something is loose, or you have a very uncharacteristic scratch. You should check your instrument set up, calibration and scratches for defects. Objective criteria for rejecting a scratch are difficult to devise for such small data sets. It is suggested that a pragmatic solution to this problem is to allow a maximum of one scratch to be discarded and a new scratch substituted and the mean and standard deviation recalculated. If this does not bring the standard deviation within the limits of Table 2, a new set of 5 scratches may be performed. Ultimately, if recalibrating (including the stylus) and repeating the tests does not bring the standard deviation of five scratches below the maximum in Table 2 then your instrument performance is not within the 95% confidence limits of the CRM certification and this should be noted on any verification or test report.
4.2 Are your results in the right range? When you use the CRM in a scratch test for the first time, or with a new scratch tester or new stylus, the CRM may be used to show whether your instrument is working well. If the instrument repeatability is acceptable, the second step is to compare the average Lc value from the five scratches with the verification range of the CRM, determined during the certification exercise. The verification ranges and certified values are shown in Table 3 for each critical load.
Lc CV -VR(5) CV CV +VR(5) Lc1 10.5 13.6 16.7 Lc2 11.6 17.0 22.4 Lc3 22.2 27.9 33.6
Table 3: Lower and upper limits of the verification range for each critical load for an average of 5 scratches

Measurement Good Practice Guide No. 54
15
If the average of the five Lc values for each of the critical loads measured fall within the verification range, then you can be confident that your instrument and stylus are functioning well. If the average Lc value falls outside the range then the instrument has failed the verification and you should carefully check the instrument components, particularly the stylus, and the calibration. Upon a verification failure, the cheapest and quickest check is to perform the verification again using a new or freshly calibrated stylus to check whether the failure was due to an inadequate stylus. Lc1 and Lc2 are more susceptible than Lc3 to stylus variations. Alternatively and in all cases of a second verification failure with a new stylus, the instrument must be recalibrated and the verification procedure repeated.
4.3 Using the CRM to improve scratch test instrument performance
This section shows how the CRM can be used to monitor the instrument over time to watch for stylus or calibration failure. A number of strategies are explained. The simplest ones require that the same stylus and CRM sample be used for the duration of the monitoring. More sophisticated monitoring and fault diagnosis is possible if at least two calibrated styli and two CRM samples are available. Strategies for comparing results between two laboratories are also discussed and may be useful in understanding acceptance-testing discrepancies. Table 1 shows that the size of the verification range is dominated by the distributions of laboratory and stylus offsets. Conversely, the components due to the precision of the average scratch tester and the CRM variability are the smallest contributions to the overall expected range. Once you have chosen a particular instrument, stylus and CRM sample, however, the offsets that those choices generate are fixed until you change something. The repeatability over time of the instrument should therefore be good and approximately equal to the expected Lc variation within a single sample, uws or at least to the normal repeatability of your instrument as considered in 4.1. Graphically, the combination of the different offsets can be represented by stacking up the selections of particular values out of the bell curves of possibilities for each offset. Figure 4 shows graphically how each choice in the scratch test procedure picks a particular offset out of its distribution and shifts the Lc value that will be measured. If all the offsets remain the same, the combined offset will also remain constant and the repeatability over time of the system will be equal to the measurement repeatability of the instrument.
Measurement Good Practice Guide No. 54
16
Figure 4: Example of how a combination of laboratory, sample and stylus offsets shifts the value a laboratory is expected to produce. CV = Certified value for all CRM samples, CRM = the (unknown) Lc value for the particular CRM sample being used. You can therefore use your own instrument�s results to monitor its performance over time. This is achieved by using the first set of scratches on the CRM as a reference and comparing successive sets of results (obtained using the same combination of instrument, CRM sample and stylus). The simplest way to do this is to plot the results on a graph called a �control chart.� Typically the control chart should be a graph for each Lc, with the Lc scale on the y axis and time (or measurement number) along the x axis. In this way, each time a set of tests is performed, the value for each Lc can be plotted and easily compared with the results from previous tests. Verification failure can also be instantly spotted if the verification range is marked on the chart as an outer limit. An example is given in Figure 4. The control chart can be used to provide much better quality control than is possible by comparing CRM verification results only with the verification range. For example, consider the possible changes in Lc value due to changing each component part of the scratch test (Table 4).
Lc (N) Choice of batch
and Sample Instrument
Offset Stylus Offset
Lc1 ± 1.4 ± 1.6 ± 2.1 Lc2 ± 1.4 ± 2.2 ± 4.5 Lc3 ± 2.2 ± 4.2 ± 2.7
Table 4: Expanded (95%) ranges of offsets due to each scratch test component.
Offset due to Sample choice
Lab. offsetMeasurementrepeatability
CV
Verification 95% limit
Verification 95% limit
VR+
VR-
Lc[N]
Stylus offset
Combined offset due to Sample +
Lab. + Stylus choice
CRM
Measurement Good Practice Guide No. 54
17
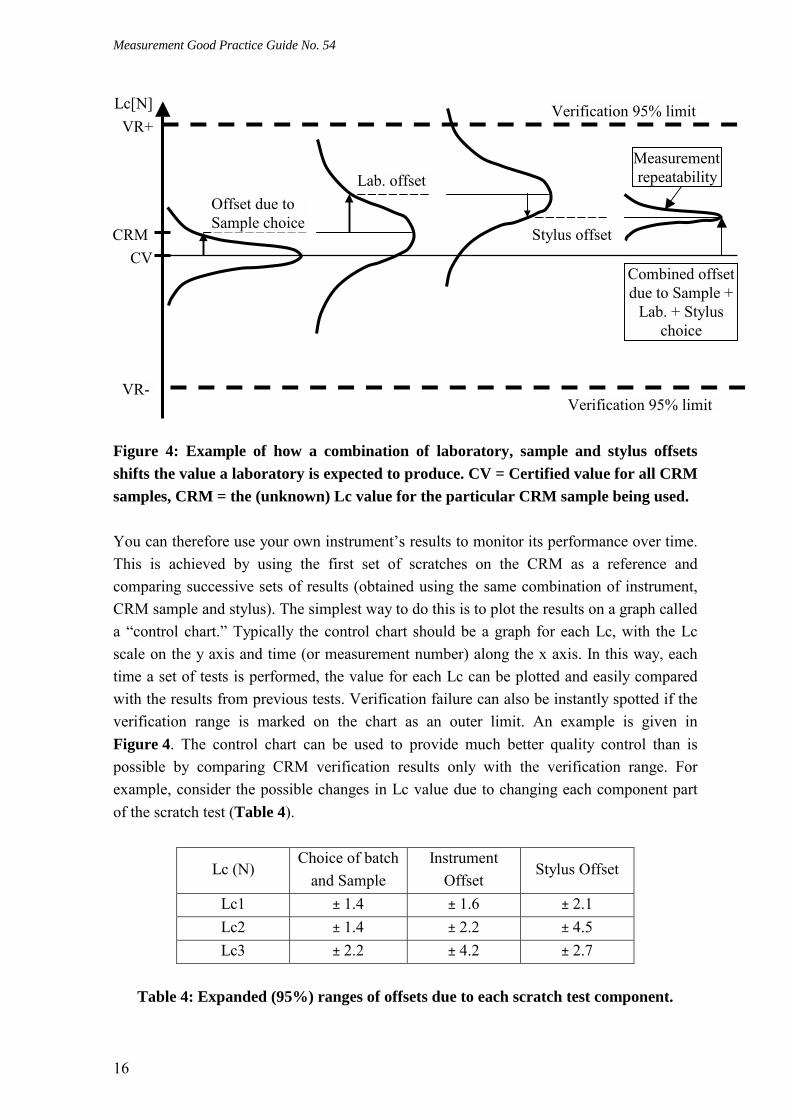
Figure 5 : Example of a control chart for Lc1 (average of 5 scratches) Consider a control chart for Lc1. If nothing changes, future verification values should be distributed close to this value and not differ by very much. E.g. one might expect Lc1 to vary by ± 1.1 N (i.e. uws expanded to a 95% confidence interval). If the same CRM sample is used, the only other changes likely are if the stylus wears (or is damaged) or if the calibration of the instrument changes. Taking the case of stylus wear first: Even with a certificate for the stylus, it is unlikely that the exact initial offset for the stylus can be known with any accuracy. However, even if we assume that the stylus is the ideal or average radius, then the expanded uncertainty that covers 95% of allowable styli is ± 2.1 N. If only stylus changes are considered, an Lc1 value outside this range is very significantly different to the original verification value and indicates that the stylus is outside calibration. Similarly, even if you allow the instrument calibration to drift by the same amount as the instrument offset distribution, then theoretically only ± 1.6 N is possible before something is clearly in need of investigation. The control limit can be set according to the users requirement of reproducibility. Clearly the more tolerant you are of performance drift, the wider the control limits can be. (e.g. if you are prepared to wait until the change is at the limit of a combination of both stylus and calibration effects, the Lc1 maximum deviation will be 2.7 N before it is evident that something is outside acceptable limits. This is almost the same as the verification range). It is possible that future standards will set guidelines. In the meantime it is suggested that good practice would be to set the control limit to the 95% interval of the smallest offset for each Lc range. In the case of Lc1 this would be ± 1.6 N for the laboratory offsets. So, if the initial value for Lc1 was 14.0 N, the control chart should be marked with action levels at 15.6 N and 12.4 N (see Figure 5). Notice that both these levels are well within the Verification range. Of course stricter limits could also be imposed. The principle is, however, the same. Once the action level is
time
Lc[N] verification max.
14
15.6
12.4
10.5 N verification min.
16.7 N
original verification
Controllimits
Calibration or Stylus failure
time
Lc[N] verification max.
14
15.6
12.4
10.5 N verification min.
16.7 N
original verification
time
Lc[N] verification max.
14
15.6
12.4
10.5 N verification min.
16.7 N
original verification
original verification
Controllimits
Calibration or Stylus failure
Controllimits
Controllimits
Calibration or Stylus failure

Measurement Good Practice Guide No. 54
18
reached, it is equivalent to failing the initial verification and action should be taken to investigate the cause. It should be noted that the over-riding control chart limits are those of the verification range. Once an average Lc value crosses these, action must be taken. A summary of the verification process using BCR-692 is given in Figure 6. The optimum frequency of the control chart measurements depends on the other uses of the scratch test instrument, bearing in mind that the expected stylus lifetime on the BCR-692 DLC coatings is about 400 scratches, and is likely to be less on higher friction coatings and at higher loads.
Figure 6: Decision Tree for Verification testing using BCR-692 CRM
4.4 Is it the stylus or the calibration? Stylus shape has a very significant effect on the scratch test result. Cleanliness is also important. This is just as true for a brand new stylus as it is for a regularly used one. It is important to examine the stylus regularly. There may be contamination on the stylus due to earlier scratches, in which case further cleaning will be necessary. There may be stylus damage or wear. Damage is usually in the form of cracks and wear usually occurs as ring
Follow procedure in section 3.3 to obtain 5 values for Lc1, Lc2, Lc3
Calculate the mean and standard deviation for each critical load
Is standard deviationOK (see Table 2)
Is mean within the verification range?
Reject and replace up to one scratch
Is standard deviationOK (see Table 2)
Is mean within the verification range?
Diagnose problem
orChange
stylusor
recalibrateand start
again
Plot resulton control chart
Yes
NoNo
Is mean within the
control chart limits?
YesVerificationsuccessful
No

Measurement Good Practice Guide No. 54
19
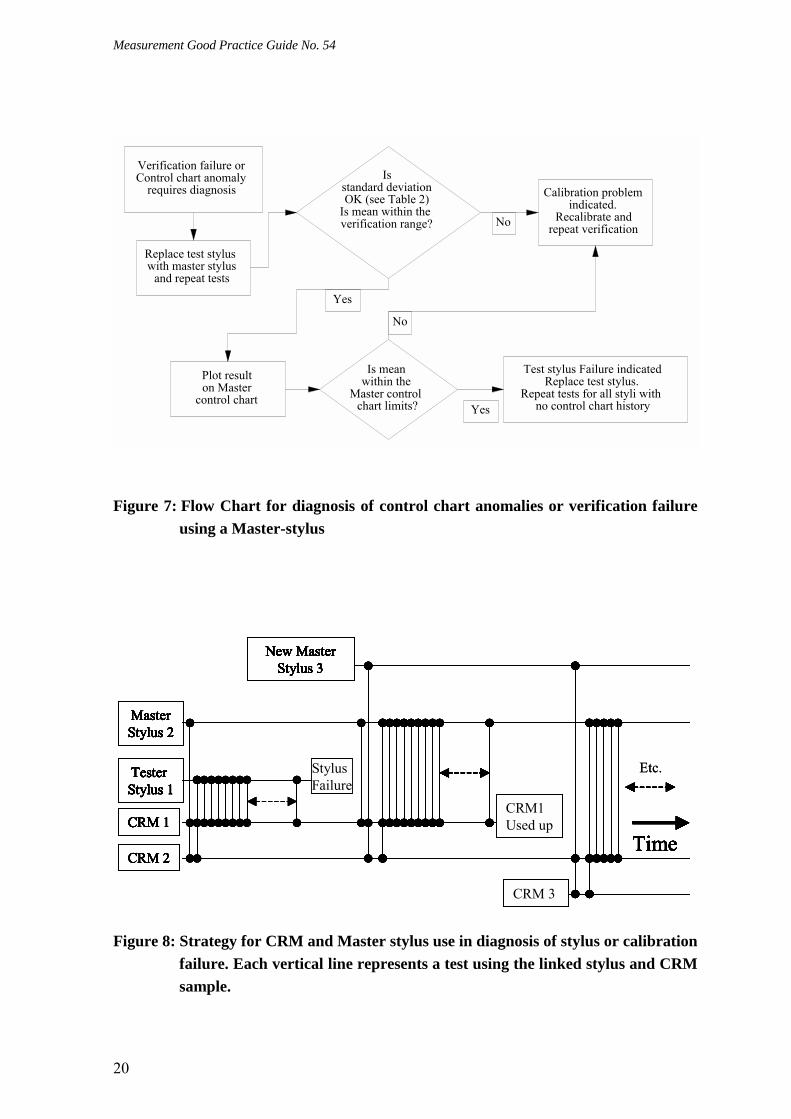
cracks or crater wear. If any of these are observed then the test results since the last inspection should be disregarded and the stylus should be replaced. The stylus should always be used in the same orientation and moved in the same direction during scratch tests. Because of imperfections in the stylus shape, a stylus turned through 180° often gives different values of Lc. A likely future development is the certification of Rockwell C styli for conformity to ISO6508:2. This should improve the calibration and verification of the scratch test instrument. The stylus is the most likely part of a scratch test instrument to fail or degrade. It is also the easiest to replace. It follows that the easiest action to take when an instrument fails the CRM verification test is therefore to change the stylus. It is possible to extend this strategy to improve the diagnosis of a verification failure. If a �master� stylus is kept, which is only used for verification failure diagnosis, it is possible to test if a verification failure is due to the stylus failing or the calibration changing, see Figure 7. To do this, the master stylus must also have made a series of scratches on each sample of the CRM to be used with an instrument. A control chart of the results recorded for the master stylus can then be compared with that for the test stylus. If the master stylus control chart is changing at the same time and in the same direction as that for the test stylus, it is likely that the instrument performance or calibration is changing. If only the test stylus control chart shows a change, then most likely the test stylus is at fault. It can be seen that the number of CRM samples being used in parallel and the number of master styli and their hierarchy will depend on the amount of control testing and the frequency of stylus failure expected. A reasonable strategy is to keep at least one master stylus and two CRM samples. If master-stylus wear is a concern, the master can be promoted to be the next test stylus and a new master stylus obtained when the current test stylus fails, see Figure 8. At least one set of scratches for each stylus should be made on each of the two CRM samples to ensure continuity of control chart history after a CRM sample is consumed.
Measurement Good Practice Guide No. 54
20
Figure 7: Flow Chart for diagnosis of control chart anomalies or verification failure
using a Master-stylus
Figure 8: Strategy for CRM and Master stylus use in diagnosis of stylus or calibration
failure. Each vertical line represents a test using the linked stylus and CRM sample.
CRM 2
MasterStylus 2
Tester Stylus 1
CRM 1CRM1Used up
New MasterStylus 3
CRM 3
Time
Stylus Failure
Etc.
CRM 2
MasterStylus 2
Tester Stylus 1
CRM 1CRM1Used up
New MasterStylus 3
CRM 3
Time
Stylus Failure
CRM 2
MasterStylus 2
Tester Stylus 1
CRM 1CRM1Used up
New MasterStylus 3
CRM 3
TimeCRM 2
MasterStylus 2
Tester Stylus 1
CRM 1CRM1Used up
New MasterStylus 3
CRM 3
TimeCRM 2
MasterStylus 2
Tester Stylus 1
CRM 1CRM1Used up
New MasterStylus 3
CRM 3
TimeCRM 2
MasterStylus 2
Tester Stylus 1
CRM 1CRM1Used up
New MasterStylus 3
CRM 3
TimeCRM 2
MasterStylus 2
Tester Stylus 1
CRM 1CRM1Used up
New MasterStylus 3
CRM 3
Time
MasterStylus 2
Tester Stylus 1Tester Stylus 1
CRM 1CRM1Used upCRM 1CRM1Used upCRM1Used up
New MasterStylus 3
CRM 3
New MasterStylus 3
CRM 3
TimeTime
Stylus FailureStylus Failure
Etc.
Replace test stylus with master stylus
and repeat tests
Verification failure orControl chart anomaly
requires diagnosisIs
standard deviationOK (see Table 2)
Is mean within the verification range?
Plot resulton Master
control chart
Is mean within the
Master control chart limits?
Yes
Test stylus Failure indicatedReplace test stylus.
Repeat tests for all styli with no control chart history
Calibration problemindicated.
Recalibrate andrepeat verificationNo
No
Yes

Measurement Good Practice Guide No. 54
21
4.5 Use of the CRM to compare results between two laboratories
This section aims to show how the CRM can be used to help compare scratch test results between laboratories. The strategies described here revolve around estimating the differences between the laboratories by exchanging test samples, CRM samples and styli. The primary capability of the CRM is to distinguish whether two scratch test instruments are operating within the acceptable bounds of normal scratch testing, i.e. that they both obtain results within the verification range. It is clear from the wide verification range that it is easily possible for two laboratories, both returning results within the verification range, to measure different results on the same sample. This is true, even if both instruments have been traceably calibrated. It may possibly be a shock to some scratch test users that two laboratories testing the same sample can get such different results. The existence of offsets between traceably calibrated laboratories was certainly not expected and was only discovered during the certification of BCR-692. It is the existence of the CRM that has allowed an estimation of the distributions of stylus and laboratory offsets. A simple strategy to help understand a difference between the results of two laboratories is for them to exchange a common stylus and CRM sample and perform verifications in each laboratory. All other things being equal, the difference in the results of the labs is an estimate of the difference in lab offsets for each Lc value, see Figure 9.

Measurement Good Practice Guide No. 54
22
Figure 9: Schematic representation of the possible difference between two laboratories testing a common CRM sample with a common stylus. The difference in Lc is an estimate of the difference in laboratory offsets. It should be noted that any estimate of such a difference will improve in reliability if more than 5 scratches are made by each laboratory. As the number of measurements averaged increases, the coverage factor will reduce according to the t-statistic and the uncertainty in the average will be reduced by the square root of the number of measurements. Also the standard deviation of the measurements will become less variable as the number of measurements increases. The uncertainty of the measured average Lc value is the standard deviation of the set of individual Lc values being averaged, divided by the square root of the number of values averaged and multiplied by a coverage factor defined by the t-statistic applicable for the number of scratches made. Table 5 shows the combined effect of these factors as a function of the number, n, of measurements averaged.
n 5 10 20 40 tn/√n 1.2 0.72 0.47 0.32
Table 5: (tn/√n) multiplication factor as a function of the number of measurements averaged. (The uncertainty in an average is the standard deviation of the values averaged multiplied by tn/√n). n is the number of measurements, tn is the 95% coverage factor from the t-statistic. It should be noted that the origin of laboratory offsets is not known. There appears to be some correlation with load. There is no guarantee that offsets measured on BCR-692 will
Verification 95% limit
Verification 95% limit
CV
VR+
VR-
Lc[N]
Stylus offset
Stylus offset
Lab. 1 offset
Lab. 2 offset
Lab. 1 result + repeatability
Lab. 2 result + repeatability
Estimate of difference in
laboratory offsets
CRM

Measurement Good Practice Guide No. 54
23
translate to a comparison of tests on another material, especially one with different properties. It may, however, act as an informative guide that is useful for laboratories who need to compare results, e.g. for acceptance testing. Figure 10: Schematic representation of comparison between laboratories using a common CRM sample. The difference in Lc values is an estimate of the combined laboratory plus stylus offsets In some cases, it may not be possible or practical to exchange styli. In this case, an exchange of CRM samples will generate an estimate of the difference in the combined (stylus + Laboratory) offsets of the two labs. See Figure 10. Again, this difference may not be directly compared to testing materials other than the CRM, but is a useful guide to the sort of discrepancy in results that is to be expected between the two laboratories. In principle, a combination of these strategies allows separation of the stylus and laboratory offsets to provide an estimate of the difference in both offsets. It should be noted, however, that Lc3 events are less susceptible to stylus differences and seem to be linked more to laboratory/instrument offsets. It is not possible to apply any determined offset difference directly as a correction to an Lc value. It is possible, however, for laboratories with a regular need to compare results (e.g. in a supply chain) to adopt a control chart approach to monitoring their differences. In this way, any difference observed on a test material may be at least compared to CRM performance and subsequent variations checked against the inter-lab control chart.
Verification 95% limit
Verification 95% limit
CV
VR+
VR-
Lc[N]
Stylus 1 offset
Stylus 2 offset
Lab. 1 offset
Lab. 2 offset
Lab. 1 result + repeatability
Estimate of combined inter-
laboratory + stylus offset
Lab. 2 result + repeatability

Measurement Good Practice Guide No. 54
24
5 Test Report Each time a scratch test is performed on the CRM a short test report should be written. The test report should include the following information:
• description of the scratch test apparatus • full description of the stylus used • code for the certified reference material used • record of number of tests performed • record of measured distance from start of scratch track to failure events (xm) and of
total length of scratch • date of test • temperature and humidity • If acoustic emission and friction force signals can be recorded during the
experiments, the critical loads corresponding to perturbations of these signals should be recorded. In that case, the acoustic emission and friction force plots against the normal load should also be included with the report.

Measurement Good Practice Guide No. 54
25
References 1. European Standard, prEN 1071-3:2002 E: Determination of Adhesion by a Scratch Test,
CEN Central Secretariat, Stassartstraat 36, 1000 Brussels, Belgium. 2. BCR Certification report (distributed with each sample of the CRM) 3. Atlas of Scratch Test Failure Modes (now contained within prEN 1071-3:2002) is
available in wall poster format from VITO - Vlaamse Instelling voor Technologisch Onderzoek, Materials Technology Centre, Boeretang 200, B - 2400 Mol, Belgium.
4. HINTERMANN, H.E. Thin solid films to combat friction, wear and corrosion. J. Vac.
Sci. Technol. 1984 B2 816-822. 5. HINTERMANN, H.E. Adhesion, friction and wear of thin hard coatings. Wear 1984 100
381-397. 6. VALLI, J., MÄKELÄ, U., MATTHEWS, A. and MURAWI, V. TiN coating adhesion
studies using the scratch test method. J. Vac. Sci. Technol. 1985 A3 2411-2414. 7. MENEVE, J. et al, Scratch adhesion testing of coated surfaces � challenges and new
directions. Adhesion Measurement of Films and Coatings, edited by K.L. Mittal, VSP, Utrecht, The Netherlands, 2001, Vol. 2, 79-106.

Measurement Good Practice Guide No. 54
26
List of Acronyms, Symbols and Abbreviations CRM certified reference material CV certified value dH known horizontal displacement dHO horizontal displacement offset calibration coefficient dHS horizontal displacement slope calibration coefficient DLC diamond-like carbon F1 flatness parameter k coverage factor Lc critical normal load for coating failure LNO load offset calibration coefficient LNS load slope calibration coefficient n number of Lc values averaged N known normal load p number of accepted sets of results PACVD plasma-assisted chemical vapour deposition Rockwell C standard stylus tip geometry as defined in ISO 6508 sc standard deviation of means of p sets of results tn t-statistic appropriate for a sample of n values TiN titanium nitride ubb �between-batch� uncertainty component ubs �between-samples� uncertainty component uws �within-sample� uncertainty component uss �between-styli� uncertainty component ul �between-machines� uncertainty component UNC expanded uncertainty of the certified value VdH output from the scratch tester horizontal displacement transducer VN output from scratch tester applied load cell VR(5) verification range for an Lc value averaged over 5 scratches VR+ upper limit of verification range VR- lower limit of verification range xm measured distance from start of scratch track to failure event
Measurement Good Practice Guide No. 54
27
Annex A: Instrument Calibration – Mandatory Procedures Prior to testing, each scratch test instrument should be calibrated according to the calibration guidelines established in the European Standard, prEN 1071-3. Procedures have been developed for calibrating displacement and force measurements, and the static and dynamic stiffness characteristics of a scratch test system. These procedures have been split into two categories: mandatory and optional. The mandatory calibration procedure consists of calibration of sample planarity, applied load and load rate, horizontal displacement and displacement rate. Optional calibration procedures include frictional force, horizontal and vertical static stiffness parameters, vertical displacement, dynamic stiffness response and mechanical impedance response. The mandatory procedures are described below. For further information and for details on the optional calibration procedures refer to prEN 1071-3. A1 Procedure for calibration of sample planarity Carrying out this procedure will ensure that the sample surface is parallel to the movement of the scratching tip. If it is not, there will be errors in assessment of load and positional data. The procedure is as follows : A1.1 First, check the levelness of the sample stage. Carry out a test at a constant load of 10 N and a displacement rate of 10 mm min-1 over 10 mm on a known plane parallel sample (for example, a silica or polished carbon steel plate). The deviation of the recorded normal load should be no greater than ± 0.5 N. If the sample stage does not meet these requirements then appropriate adjustments must be made until conformance is achieved. A1.2 Mount the test sample on the sample table and set the scratch tester to perform a 10 mm constant load test of 10 N at a rate of 10 mm min-1. A1.3 The sample can be considered level if the greatest deviation from the recorded normal load is no more than ± 0.5 N. A1.4 Record the greatest deviation from the normal recorded load, in N, which is known as the flatness parameter, F1.

Measurement Good Practice Guide No. 54
28
Alternatively, use an optical microscope to view the sample stage or mounted sample, at a magnification of 200X, and check that the object remains in focus for the length of the scratch. A2 Procedure for calibrating applied load The load cell which measures the applied load in the scratch tester is calibrated by comparing its output with the output from a load cell which has been calibrated and is traceable to national standards. This load cell needs to be small enough to fit between the stylus and sample holding plate. The procedure is as follows : A2.1 Place the calibrated load cell on the sample stage with a hardened steel plate on top of it for protection, such that the stylus will give axial loading to the load cell. (See Figure A.1)
Figure A.1: Example of experimental setup for calibration of applied load
A2.2 Increase the applied load incrementally using the normal loading mechanism. A2.3 Take a minimum of twenty readings from the calibrated load cell and the scratch tester load cell up to the maximum applied load of the scratch tester. Readings can be made with a chart recorder, digital voltmeter or computer based digital acquisition system. A2.4 Repeat this test cycle four times and discard the first set of measurements.

Measurement Good Practice Guide No. 54
29
A2.5 Convert the readings from the calibrated load cell into known applied loads (N). Use least squares linear regression analysis to fit a line to the data. The line will be of the form: L + VL = N NONNS VN is the output from the scratch tester applied load cell, which should be treated as the independent variable. The known normal load (N) should be treated as the dependent variable. Record the load slope (LNS) and load offset calibration (LNO) coefficients. A2.6 Carry out a continuous loading cycle (up to maximum load of 100 N) using the stylus and hardened steel sample, and plot against a time base. This will calibrate the loading rate. The loading rate is equal to the slope of the load-time graph. Adjust the loading rate until it is 100 ±1 N min-1. The load cell must be removed during adjustment of the load rate, since its compliance can modify the load rate. The time base used (e.g. recorder plot length) must be checked by means of a chronometer. A3 Procedure for calibrating horizontal displacement The inbuilt displacement transducer which measures the movement of the sample is calibrated by comparing its output with the output from a displacement transducer which has been calibrated and is traceable to national standards. The procedure is as follows : A3.1 Clamp the two displacement transducers together in parallel. Move the specimen stage incrementally over the full measurement range of the displacement transducer using the normal motion mechanism (See Figure A.2).

Measurement Good Practice Guide No. 54
30
Inbuilttransducer
Calibratingtransducer
Figure A.2: Example of experimental setup for calibration of horizontal displacement A3.2 Take a minimum of twenty readings of the output from the calibrated displacement transducer and the inbuilt horizontal displacement transducer. Readings can be made with a chart recorder, digital voltmeter or computer based digital acquisition system. A3.3 Repeat this test cycle four times and discard the first set of measurements. A3.4 Convert the readings from the calibrated displacement transducer into known horizontal displacement (dH). Use least squares linear regression analysis to fit a line to the data. The line will be of the form: d + Vd = d HOdHHSH VdH is the output from the scratch tester horizontal displacement transducer (VdH), which should be treated as the independent variable. The known horizontal displacement (dH) should be treated as the dependent variable. Record the horizontal displacement slope (dHS) and horizontal displacement offset calibration (dHO) coefficients. A3.5 Check the alignment of the transducer relative to the stage by measuring the length of a scratch made on a steel sample, and comparing this with the length calculated from the displacement transducer readings. If any discrepancies occur between the two measurements then the alignment of the transducer must be checked.

Measurement Good Practice Guide No. 54
31
A3.6 A time base should also be recorded to allow calibration of the velocity of the stage. The velocity is equal to the slope of the displacement-time graph. The velocity should be adjusted to 10 mm min-1, ± 0.1 mm min-1. Alternatively, if a second displacement transducer is not available, then a simple method of checking the inbuilt transducer can be performed by making a series of constant, low load scratches (10 N) of varying length in an easily marked substrate (e.g. hardened steel or ceramic). The total length of the scratches less the track widths should then be equal to the indicated scratch lengths measured by the in-built transducer (See Figure A.3). This procedure could be carried out whilst calibrating sample planarity (Procedure A1).
TOTAL scratch length
Scratch width
Scratch displacement = Total length - scratch width
Indicated scratch length
Figure A.3: Schematic for determination of scratch displacement A simple assessment of displacement rate can be obtained by performing a constant load scratch (10 N) and measuring the scratch length with a travelling microscope. A time base can be derived from the applied load trace which should be recorded. A4 Reporting of results Write a calibration report to include the parameters measured during calibration. If any of the optional calibration procedures have been carried out then the parameters relevant to those procedures should also be reported.

Measurement Good Practice Guide No. 54
32
Annex B: Description of Failure Events Lc(1) Description of failure events(2) Lc1 Shall be taken at the end nearest the scratch start of the first in the series of
forward chevron cracks at the borders of the scratch track. Figure B1. Lc2 Forward chevron cracks at the borders of the scratch track, with local
interfacial spallation or with gross interfacial spallation Lc2 shall be taken at the end nearest the scratch start of the failure event that occurs first. Figures B2, B3.
Lc3 Gross interfacial shell-shaped spallation Lc3 shall be taken in the centre of the track, at the edge nearest the scratch start, of the first shell-shaped failure to completely cross the scratch track (perpendicular to the scratch direction). Figure B4.
(1) The critical load value corresponds to the start of regular occurrence of the associated failure event. Irregular events can happen at coating defects � see Figure B5. (2) Based on The Scratch Test Atlas of Failure Modes � FASTE
Figure B1: Micrograph of scratch track showing forward chevron tracks and Lc1. S.D. indicates scratch direction

Measurement Good Practice Guide No. 54
33
Figure B2: Micrograph of scratch track showing chevron tracks, local interfacial spallation and Lc2. S.D. indicates scratch direction
Figure B3: Micrograph of scratch track showing chevron tracks, gross interfacial spallation and Lc2

Measurement Good Practice Guide No. 54
34
Figure B4: Micrograph of scratch track showing gross interfacial shell-shaped spallation and Lc3 measured at the edge nearest the scratch start at the track centre
Figure B5: Micrograph of scratch track showing failure initiated at coating defect. The failure does not occur in a regular way and leads to a false value of critical load

Recommended sale price: £25.00 4678
/PP
G/A
5181
/50/
0303
GPG cover 54 3/7/03 9:14 am Page 1