Embed Size (px)
Citation preview
MEASUREMENT AND VERIFICATION PLAN
FOR
DG/CHP SYSTEM AT 15 W 43RD ST. – PRINCETON CLUB
May 2012
Submitted to:
New York State Energy Research and Development Authority
17 Columbia Circle Albany, NY 12203-6399
Submitted by:
CDH Energy Corp. PO Box 641
2695 Bingley Rd Cazenovia, NY 13035
(315) 655-1063 www.cdhenergy.com

Project Team: NYSERDA Project Manager: Joanna A. Moore 518-862-1090 ext 3220 [email protected] Developer/Applicant: Larry Hines Princeton Club of New York 15 W 43rd Street New York, NY 10036 Phone: (212) 596-1269 Fax: (212) 596-1398 [email protected]
John Brogan Endurant Energy One Penn Plaza, Suite 4512 New York, NY 10119 Phone: (646) 786-1260 [email protected]
Bob Schultz Automated Logic New York/New Jersey 100 Delawanna Ave. Clifton, NJ 07014 862-377-5575 mobile [email protected]
NYSERDA QC Contractor: Dennis R. Landsberg L&S Energy Services, Inc. 58 Clifton Country Road Suite 203 Clifton Park, NY 12065 Phone: (518) 383-9405 Fax: (518) 383-9406 Email: [email protected] NYSERDA M&V Contractor: Hugh Henderson, CDH Energy PO Box 641 2695 Bingley Rd Cazenovia, NY 13035 315-655-1063 [email protected]
M&V Plan 15 W 43rd Street – Princeton Club
CDH Energy Corp. 1 May 2012
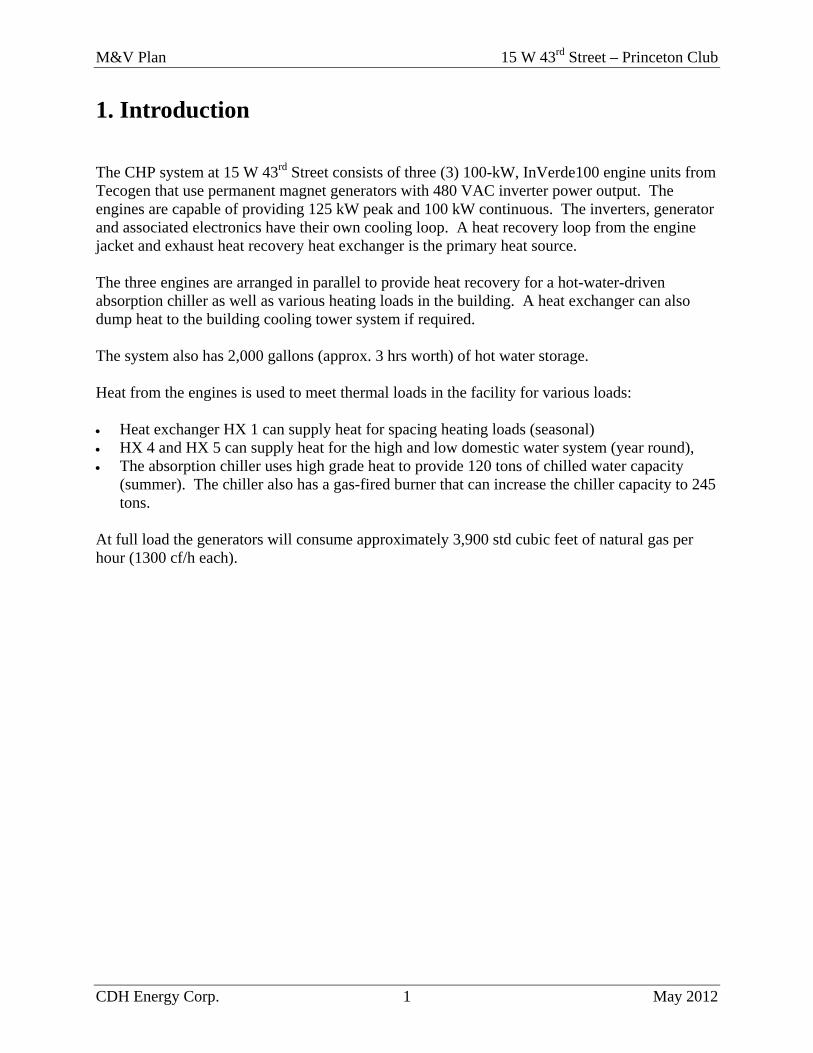
1. Introduction The CHP system at 15 W 43rd Street consists of three (3) 100-kW, InVerde100 engine units from Tecogen that use permanent magnet generators with 480 VAC inverter power output. The engines are capable of providing 125 kW peak and 100 kW continuous. The inverters, generator and associated electronics have their own cooling loop. A heat recovery loop from the engine jacket and exhaust heat recovery heat exchanger is the primary heat source. The three engines are arranged in parallel to provide heat recovery for a hot-water-driven absorption chiller as well as various heating loads in the building. A heat exchanger can also dump heat to the building cooling tower system if required. The system also has 2,000 gallons (approx. 3 hrs worth) of hot water storage. Heat from the engines is used to meet thermal loads in the facility for various loads: Heat exchanger HX 1 can supply heat for spacing heating loads (seasonal) HX 4 and HX 5 can supply heat for the high and low domestic water system (year round), The absorption chiller uses high grade heat to provide 120 tons of chilled water capacity
(summer). The chiller also has a gas-fired burner that can increase the chiller capacity to 245 tons.
At full load the generators will consume approximately 3,900 std cubic feet of natural gas per hour (1300 cf/h each).
M&V Plan 15 W 43rd Street – Princeton Club
CDH Energy Corp. 2 May 2012
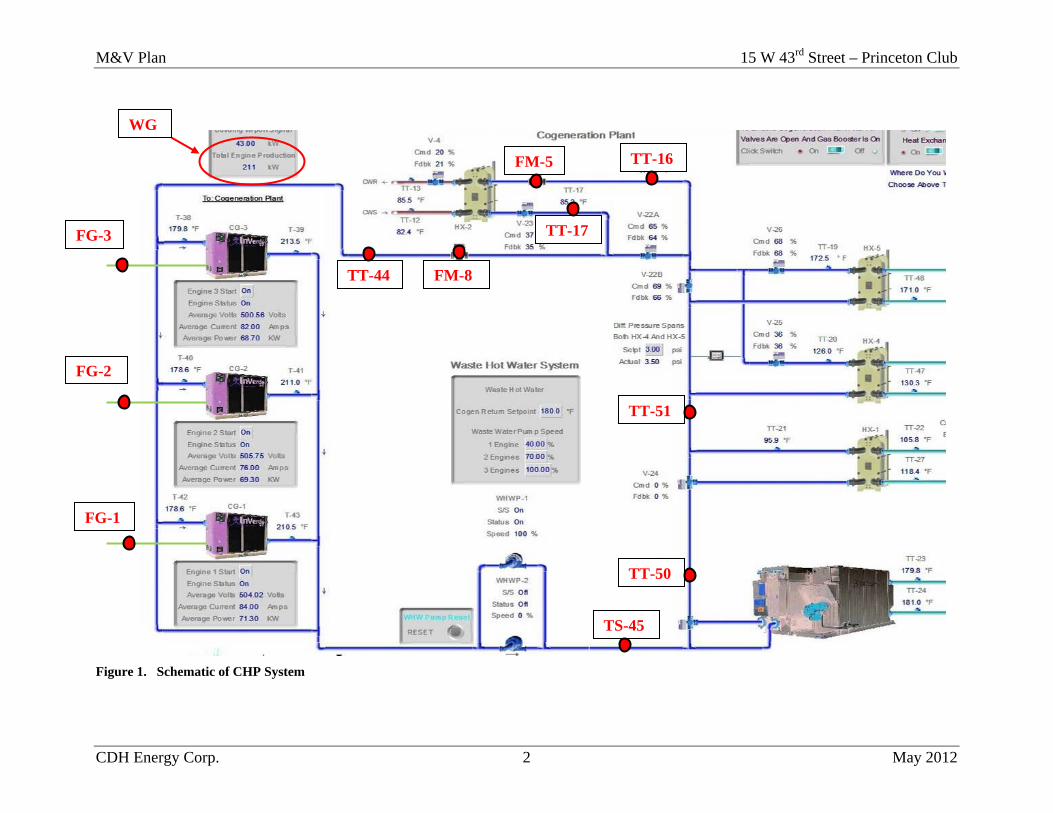
Figure 1. Schematic of CHP System
WG
FG-3
FG-2
FG-1
TS-45
TT-50
TT-51
TT-16FM-5
FM-8
TT-17
TT-44

M&V Plan 15 W 43rd Street – Princeton Club
CDH Energy Corp. 3 May 2012
Engine-Generator Enclosure
Main Loop Pumps
HX#5 - Plumbing Low Zone HX#1 - Space Heating Loads
Figure 2. Photos of CHP System
M&V Plan 15 W 43rd Street – Princeton Club
CDH Energy Corp. 4 May 2012
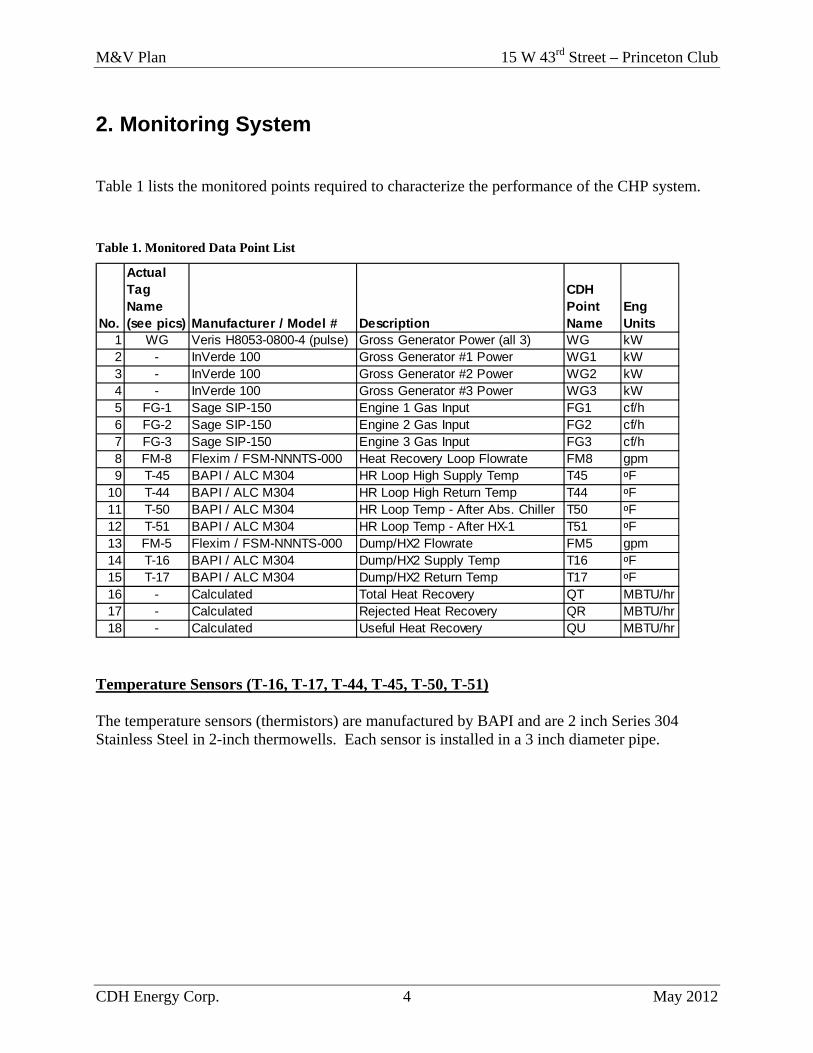
2. Monitoring System Table 1 lists the monitored points required to characterize the performance of the CHP system.
Table 1. Monitored Data Point List
No.
Actual Tag Name (see pics) Manufacturer / Model # Description
CDH Point Name
Eng Units
1 WG Veris H8053-0800-4 (pulse) Gross Generator Power (all 3) WG kW2 - InVerde 100 Gross Generator #1 Power WG1 kW3 - InVerde 100 Gross Generator #2 Power WG2 kW4 - InVerde 100 Gross Generator #3 Power WG3 kW5 FG-1 Sage SIP-150 Engine 1 Gas Input FG1 cf/h6 FG-2 Sage SIP-150 Engine 2 Gas Input FG2 cf/h7 FG-3 Sage SIP-150 Engine 3 Gas Input FG3 cf/h8 FM-8 Flexim / FSM-NNNTS-000 Heat Recovery Loop Flowrate FM8 gpm9 T-45 BAPI / ALC M304 HR Loop High Supply Temp T45 ⁰F
10 T-44 BAPI / ALC M304 HR Loop High Return Temp T44 ⁰F11 T-50 BAPI / ALC M304 HR Loop Temp - After Abs. Chiller T50 ⁰F12 T-51 BAPI / ALC M304 HR Loop Temp - After HX-1 T51 ⁰F13 FM-5 Flexim / FSM-NNNTS-000 Dump/HX2 Flowrate FM5 gpm14 T-16 BAPI / ALC M304 Dump/HX2 Supply Temp T16 ⁰F15 T-17 BAPI / ALC M304 Dump/HX2 Return Temp T17 ⁰F16 - Calculated Total Heat Recovery QT MBTU/hr17 - Calculated Rejected Heat Recovery QR MBTU/hr18 - Calculated Useful Heat Recovery QU MBTU/hr
Temperature Sensors (T-16, T-17, T-44, T-45, T-50, T-51) The temperature sensors (thermistors) are manufactured by BAPI and are 2 inch Series 304 Stainless Steel in 2-inch thermowells. Each sensor is installed in a 3 inch diameter pipe.

M&V Plan 15 W 43rd Street – Princeton Club
CDH Energy Corp. 5 May 2012
HR Return Temp (T-44) Back to Engines
Figure 3. Locations of Temperature Sensors
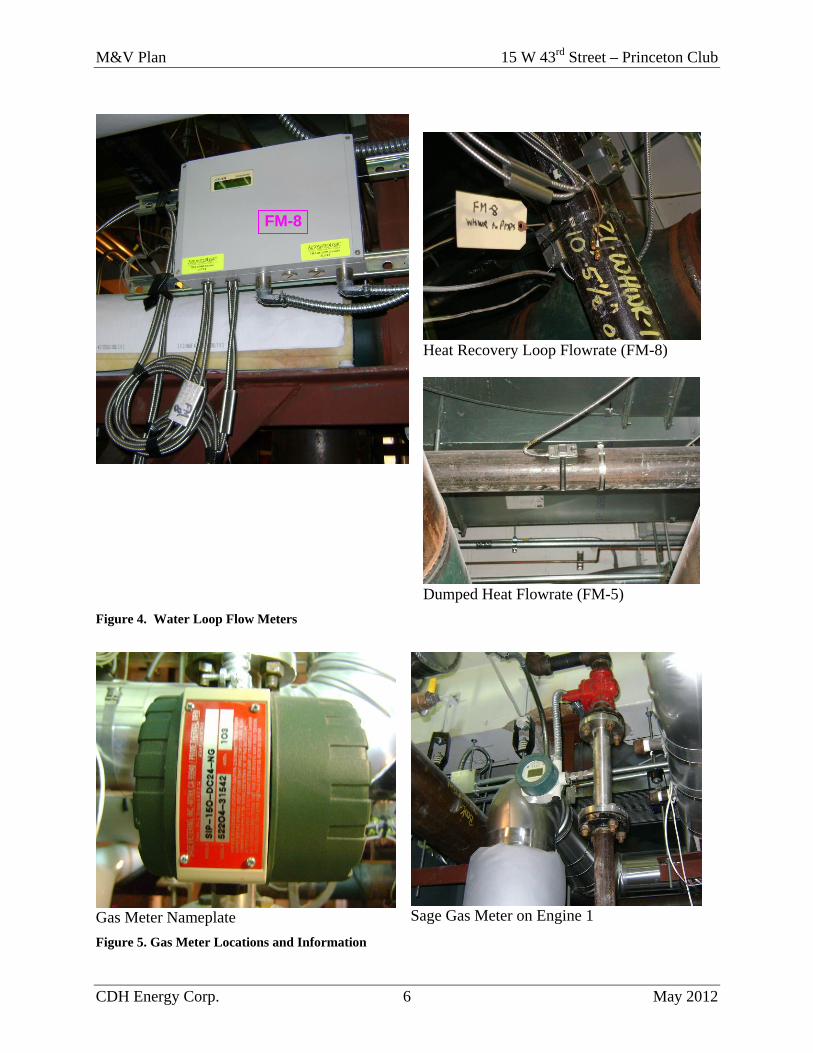
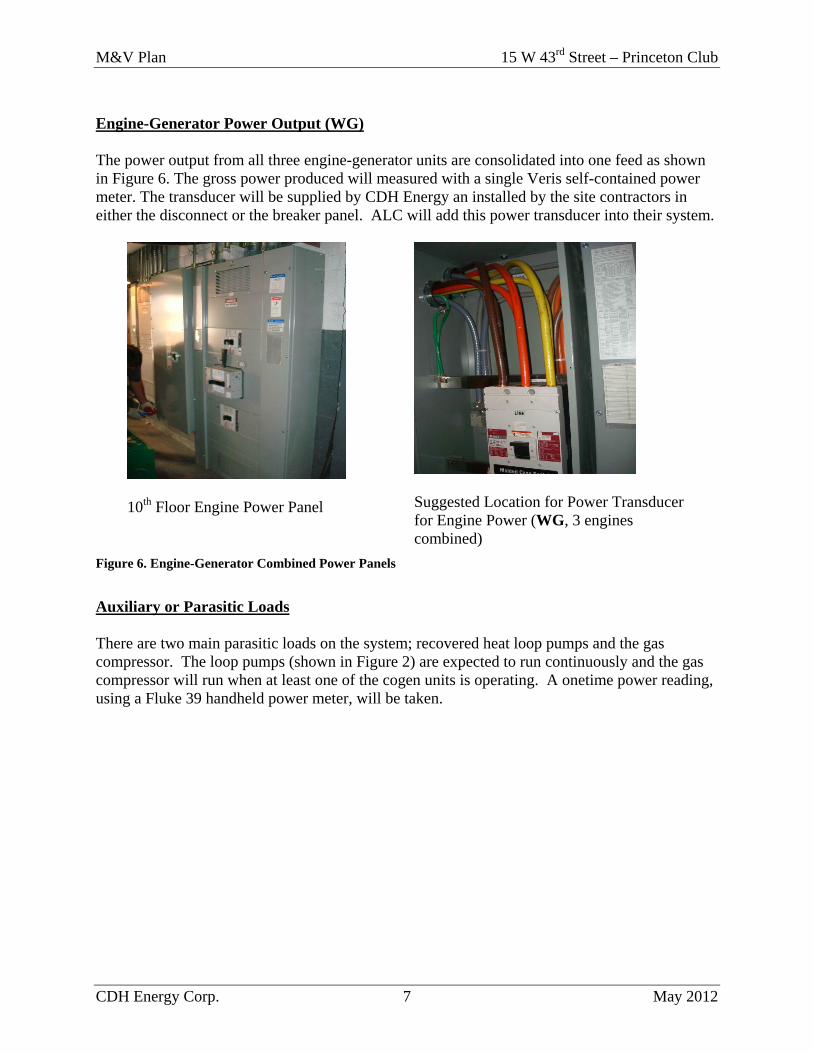
Fluid Flowmeters (FM-5, FM-8) The flowmeters used are manufactured by Flexim and are Type M clamp-on flow transducers. As see in Figure 4 each pair of flow transducers is attached with a metal strap securely to the 3 inch diameter pipes. Their orientation (on opposing sides and with distance between < dpipe) is set up for diagonal mode with one sound path. They have a range of 0.01 to 25 m/s with an accuracy of ±1.6% with standard calibration and as good as ±0.5% with field calibration. Engine-Generator Gas Input (FG-1, FG-2, FG-3) There is one Sage gas meter for each of the (3) three engines. This hot-wire device is installed in a spool piece to provide a high accuracy analog reading of mass flow rate.
T-45
T-17
T-16
M&V Plan 15 W 43rd Street – Princeton Club
CDH Energy Corp. 6 May 2012
Heat Recovery Loop Flowrate (FM-8)
Dumped Heat Flowrate (FM-5)
Figure 4. Water Loop Flow Meters
Gas Meter Nameplate
Sage Gas Meter on Engine 1
Figure 5. Gas Meter Locations and Information
FM-8
M&V Plan 15 W 43rd Street – Princeton Club
CDH Energy Corp. 7 May 2012
Engine-Generator Power Output (WG) The power output from all three engine-generator units are consolidated into one feed as shown in Figure 6. The gross power produced will measured with a single Veris self-contained power meter. The transducer will be supplied by CDH Energy an installed by the site contractors in either the disconnect or the breaker panel. ALC will add this power transducer into their system.
10th Floor Engine Power Panel
Suggested Location for Power Transducer for Engine Power (WG, 3 engines combined)
Figure 6. Engine-Generator Combined Power Panels
Auxiliary or Parasitic Loads There are two main parasitic loads on the system; recovered heat loop pumps and the gas compressor. The loop pumps (shown in Figure 2) are expected to run continuously and the gas compressor will run when at least one of the cogen units is operating. A onetime power reading, using a Fluke 39 handheld power meter, will be taken.

M&V Plan 15 W 43rd Street – Princeton Club
CDH Energy Corp. 8 May 2012
Data Logging System CDH will install an Obvius Acqusuite Datalogger with a UPS in its own enclosure underneath the current Auotmated Logic (ALC) panel (see below). The datalogger will communicate with the ALC controller via MODBUS RTU to the extract readings (in Table 1) from the control system. CDH will use the 120 Volt power inside the ALC panel to power the datalogger. Endurant/The Princeton Club will provide internet access to the datalogger by providing a fixed IP-address (accessible from the internet) with a port forwarded to the datalogger’s local IP address. The DSL line will be shared with the Broad Chiller.
Figure 7. Location for CDH Panel
The datalogger will sample or scan each data point at one-second intervals. All readings will be averaged, summed or calculated for each 1-minute interval. The datalogger will be able to hold more than 80 days of recorded data if communications are lost. The datalogger will continue to log data for a few hours in the event of a power outage at the site. The data will be downloaded from the datalogger at least once a day via the internet connection and loaded into a database. The data will be checked for validity and posted on the NYSERDA web site.
CDH Enclosure
M&V Plan 15 W 43rd Street – Princeton Club
CDH Energy Corp. 9 May 2012
Data Logger Support CDH will maintain the data logger over the two-year monitoring period. We will periodically check the CHP web site to ensure the system is operating properly. In the event of a data logger issue, we will be on-site within 48 hours to make a repair. If the problem is with the instrumentation supplied by the site, we will work with them to help correct the problem in a timely manner. Around the 12th and 24th month of the monitoring period, we will come on site to verify and check the instrumentation and sensors. Temperature sensors will be compared to readings with handheld instruments, power transducer readings will also be compared to handheld power readings. Where feasible, we will check flow readings with ultrasonic flow meters. Based on these measurements we will prepare a verification summary report documenting the findings from each visit. The verification/calibration reports will also be posted on the CHP web site.
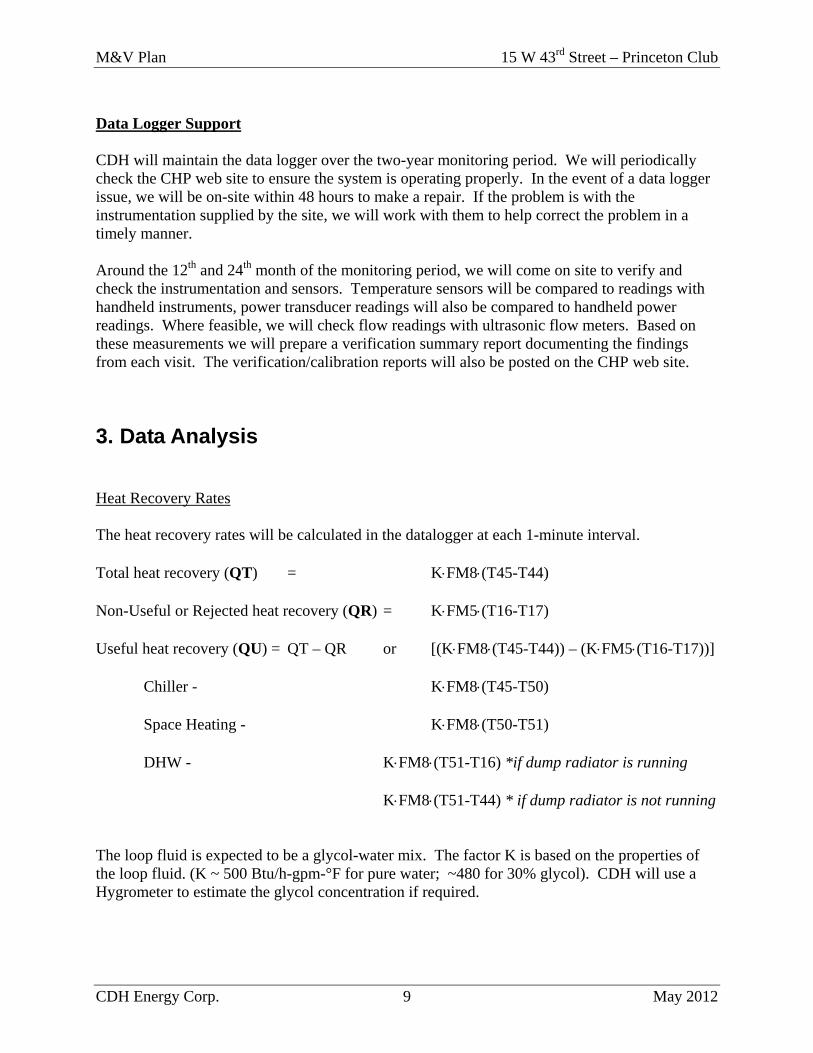
3. Data Analysis Heat Recovery Rates The heat recovery rates will be calculated in the datalogger at each 1-minute interval. Total heat recovery (QT) = KFM8(T45-T44) Non-Useful or Rejected heat recovery (QR) = KFM5(T16-T17) Useful heat recovery (QU) = QT – QR or [(KFM8(T45-T44)) – (KFM5(T16-T17))] Chiller - KFM8(T45-T50) Space Heating - KFM8(T50-T51) DHW - KFM8(T51-T16) *if dump radiator is running
KFM8(T51-T44) * if dump radiator is not running
The loop fluid is expected to be a glycol-water mix. The factor K is based on the properties of the loop fluid. (K ~ 500 Btu/h-gpm-°F for pure water; ~480 for 30% glycol). CDH will use a Hygrometer to estimate the glycol concentration if required.

M&V Plan 15 W 43rd Street – Princeton Club
CDH Energy Corp. 10 May 2012
Calculated Quantities For this site, the net power output from the engine generators is: WNET = WG – WP Where WP is the power use of the recovered heat loop pumps (which will be determined with a one-time reading) and the gas compressor. All power data reported on the website is gross generator power. Parasitic loads will still have to be subtracted. The fuel conversion efficiency of the CHP system, based on the lower heating value of the fuel, will be defined as:
FGLHV
WNETtQUFCE
gas
)(412,3
where: QU - Useful heat recovery (Btu/h) WG - Generator output (kWh) FG - Generator gas consumption, sum of 3 meters (Std CF) t - 1/60 hour for 1-minute data
LHVgas - Lower heating value for natural gas (~905 Btu per CF) The FCE can be calculated for any time interval. When converting to daily, monthly, or annual values, each value is summed and then the formula is applied:
N
gas
NN
FGLHV
WNETtQU
FCE
)(3412
Where N is equal to the number of intervals in the period of interest.

Appendix A Data Sheets
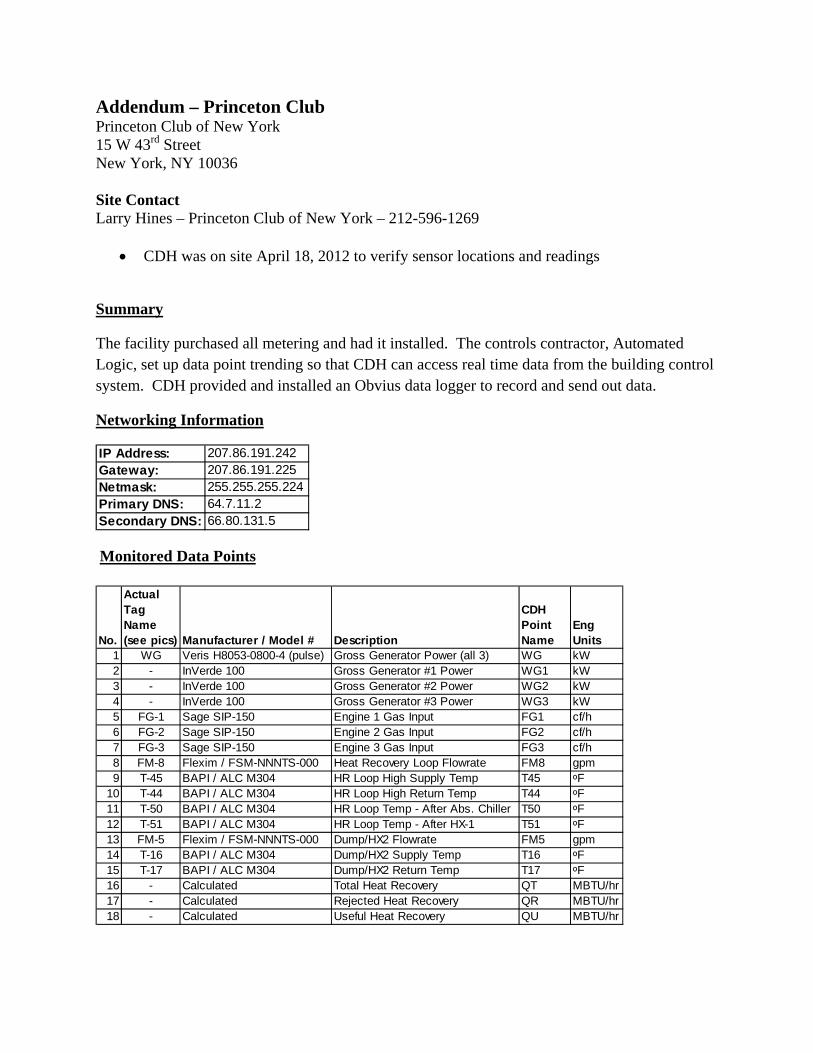
Addendum – Princeton Club Princeton Club of New York 15 W 43rd Street New York, NY 10036 Site Contact Larry Hines – Princeton Club of New York – 212-596-1269
CDH was on site April 18, 2012 to verify sensor locations and readings
Summary
The facility purchased all metering and had it installed. The controls contractor, Automated Logic, set up data point trending so that CDH can access real time data from the building control system. CDH provided and installed an Obvius data logger to record and send out data.
Networking Information
IP Address: 207.86.191.242Gateway: 207.86.191.225Netmask: 255.255.255.224Primary DNS: 64.7.11.2Secondary DNS: 66.80.131.5
Monitored Data Points
No.
Actual Tag Name (see pics) Manufacturer / Model # Description
CDH Point Name
Eng Units
1 WG Veris H8053-0800-4 (pulse) Gross Generator Power (all 3) WG kW2 - InVerde 100 Gross Generator #1 Power WG1 kW3 - InVerde 100 Gross Generator #2 Power WG2 kW4 - InVerde 100 Gross Generator #3 Power WG3 kW5 FG-1 Sage SIP-150 Engine 1 Gas Input FG1 cf/h6 FG-2 Sage SIP-150 Engine 2 Gas Input FG2 cf/h7 FG-3 Sage SIP-150 Engine 3 Gas Input FG3 cf/h8 FM-8 Flexim / FSM-NNNTS-000 Heat Recovery Loop Flowrate FM8 gpm9 T-45 BAPI / ALC M304 HR Loop High Supply Temp T45 ⁰F
10 T-44 BAPI / ALC M304 HR Loop High Return Temp T44 ⁰F11 T-50 BAPI / ALC M304 HR Loop Temp - After Abs. Chiller T50 ⁰F12 T-51 BAPI / ALC M304 HR Loop Temp - After HX-1 T51 ⁰F13 FM-5 Flexim / FSM-NNNTS-000 Dump/HX2 Flowrate FM5 gpm14 T-16 BAPI / ALC M304 Dump/HX2 Supply Temp T16 ⁰F15 T-17 BAPI / ALC M304 Dump/HX2 Return Temp T17 ⁰F16 - Calculated Total Heat Recovery QT MBTU/hr17 - Calculated Rejected Heat Recovery QR MBTU/hr18 - Calculated Useful Heat Recovery QU MBTU/hr

Procedure
Power measurements were made with a Fluke 39 handheld meter from phase to phase (p-p) and phase to ground (p-g).
o Generator power measurements were taken in the 480 switchgear (gross power). The CT’s are located in the adjacent disconnect and are measuring the same power.
o Parasitic loads consist of the cogen loop pumps and gas compressor. One time power measurements were taken of these loads for documentation purposes.
Temperatures were measured using a Fluke 51-II and either a surface probe or insertion probe.
o All temperature measurements were taken from the surface of the copper piping.
Both flows (heat recovery loop and dump radiator flow) were verified using a Portaflow ultrasonic flowmeter, mounted on a straight section of the return piping.
Natural gas use was verified by comparing the Sage meter display for each engine to the
data logger values.
Verification Data – April 18, 2012
Generator Power:
The power measurements taken in the switchgear were compared to the individual generator powers measured by the ALC system. The Veris H8053 was not yet installed at the time of verification.
ALC (WG)ALC
(WG1+WG2+WG3)A B C Total Total (kW) Total (kW)
Voltage 284 286 289 -Amps 285 288 289 -kW 81 82 81 244 248 255.9
Fluke 39 (phase to ground)
ALC (WG)A-B (kW) C-B (kW) Total (kW) Total(kW)
Trial 1 133 115 248 255.9Trial 2 114 132.5 246.5 252.7
Fluke 39 (phase to phase)
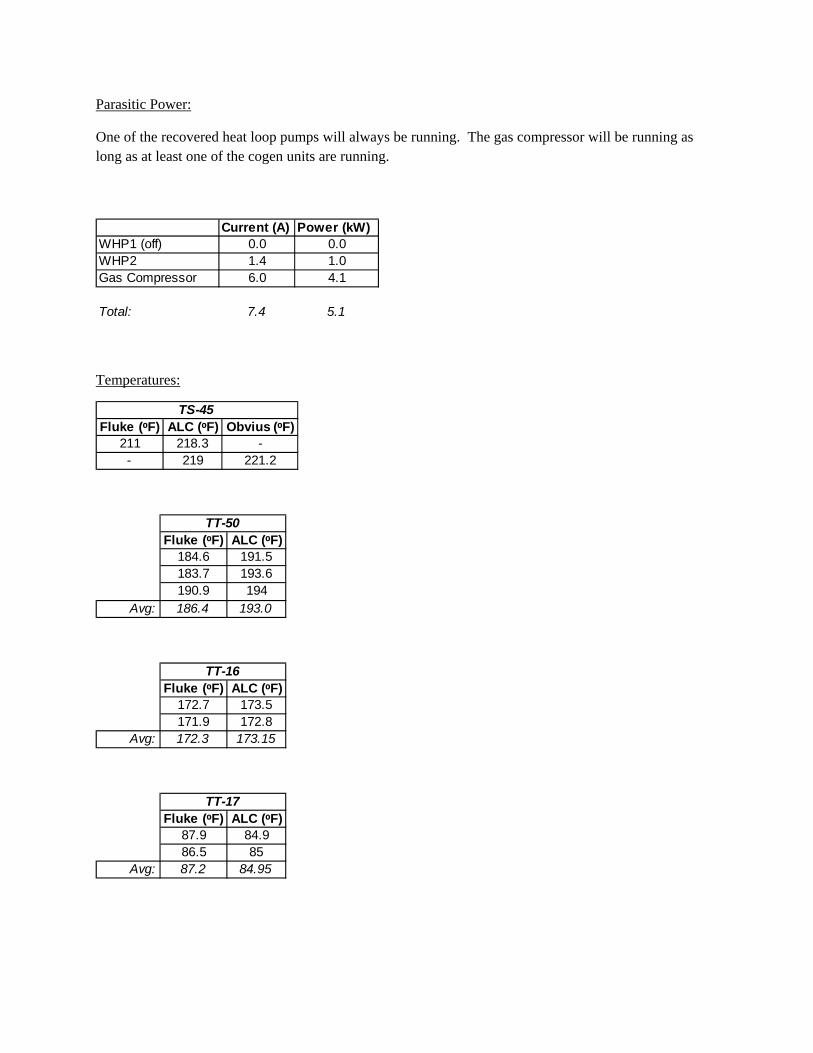
Parasitic Power:
One of the recovered heat loop pumps will always be running. The gas compressor will be running as long as at least one of the cogen units are running.
Current (A) Power (kW)WHP1 (off) 0.0 0.0WHP2 1.4 1.0Gas Compressor 6.0 4.1
Total: 7.4 5.1
Temperatures:
Fluke (⁰F) ALC (⁰F) Obvius (⁰F)211 218.3 -- 219 221.2
TS-45
Fluke (⁰F) ALC (⁰F)184.6 191.5183.7 193.6190.9 194
Avg: 186.4 193.0
TT-50
Fluke (⁰F) ALC (⁰F)172.7 173.5171.9 172.8
Avg: 172.3 173.15
TT-16
Fluke (⁰F) ALC (⁰F)87.9 84.986.5 85
Avg: 87.2 84.95
TT-17
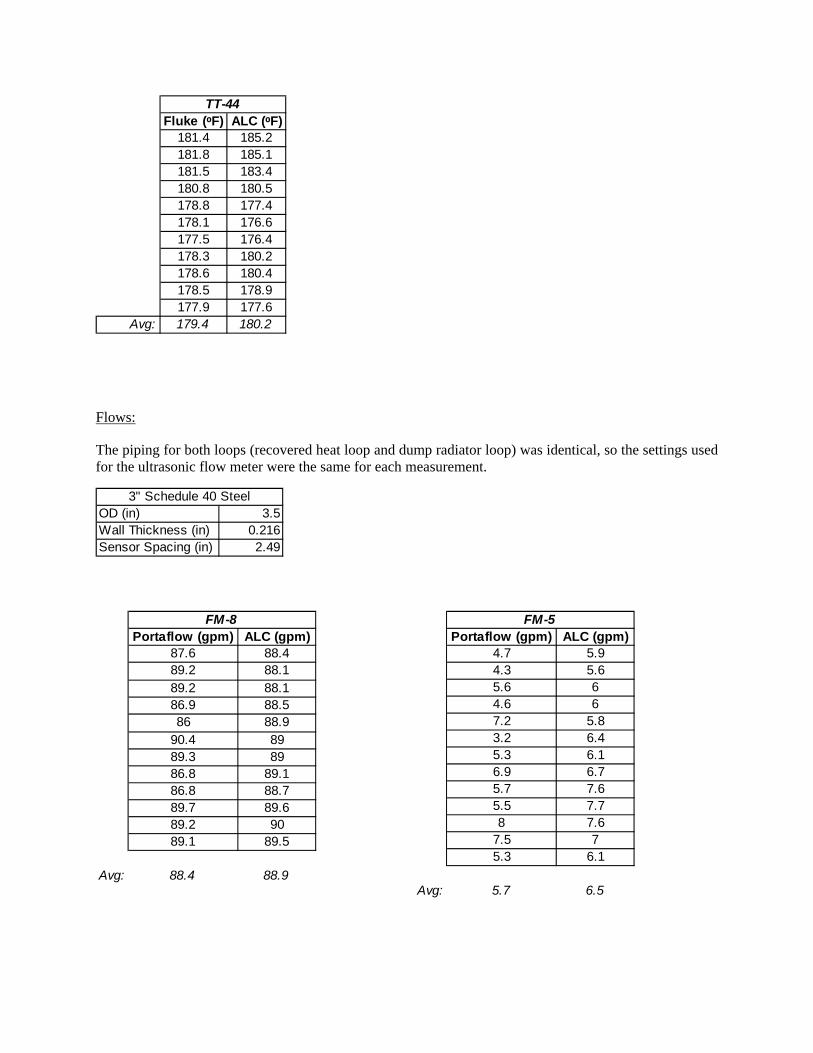
Fluke (⁰F) ALC (⁰F)181.4 185.2181.8 185.1181.5 183.4180.8 180.5178.8 177.4178.1 176.6177.5 176.4178.3 180.2178.6 180.4178.5 178.9177.9 177.6
Avg: 179.4 180.2
TT-44
Flows:
The piping for both loops (recovered heat loop and dump radiator loop) was identical, so the settings used for the ultrasonic flow meter were the same for each measurement.
OD (in) 3.5Wall Thickness (in) 0.216Sensor Spacing (in) 2.49
3" Schedule 40 Steel
Portaflow (gpm) ALC (gpm)87.6 88.489.2 88.189.2 88.186.9 88.586 88.9
90.4 8989.3 8986.8 89.186.8 88.789.7 89.689.2 9089.1 89.5
Avg: 88.4 88.9
FM-8
Portaflow (gpm) ALC (gpm)4.7 5.94.3 5.65.6 64.6 67.2 5.83.2 6.45.3 6.16.9 6.75.7 7.65.5 7.78 7.6
7.5 75.3 6.1
Avg: 5.7 6.5
FM-5
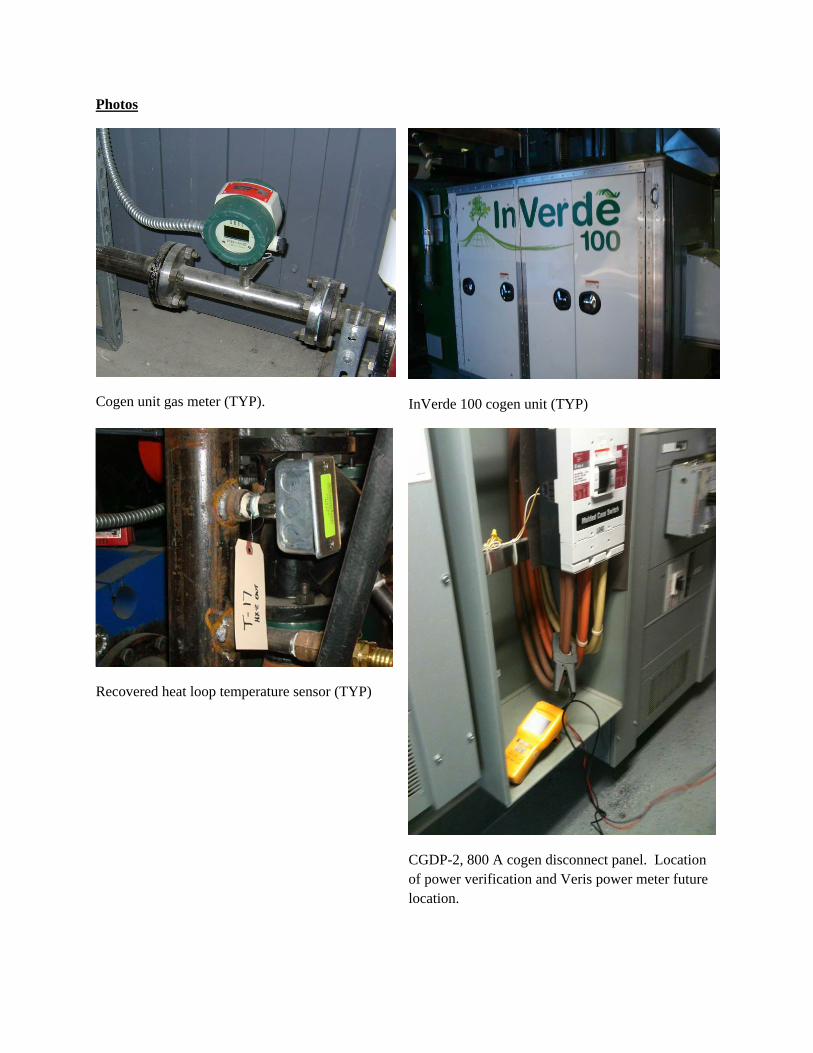
Photos
Cogen unit gas meter (TYP). InVerde 100 cogen unit (TYP)
Recovered heat loop temperature sensor (TYP)
CGDP-2, 800 A cogen disconnect panel. Location of power verification and Veris power meter future location.