Embed Size (px)
Citation preview

MEAN-SHIFT ANALYSIS FOR IMAGE ANDVIDEO APPLICATIONS
a thesis
submitted to the department of electrical and
electronics engineering
and the institute of engineering and science
of bilkent university
in partial fulfillment of the requirements
for the degree of
master of science
By
Halil Ibrahim Cuce
May, 2005

I certify that I have read this thesis and that in my opinion it is fully adequate,
in scope and in quality, as a thesis for the degree of Master of Science.
Prof. Dr. Ahmet Enis Cetin (Supervisor)
I certify that I have read this thesis and that in my opinion it is fully adequate,
in scope and in quality, as a thesis for the degree of Master of Science.
Assoc. Prof. Dr. Ezhan Karasan
I certify that I have read this thesis and that in my opinion it is fully adequate,
in scope and in quality, as a thesis for the degree of Master of Science.
Asst. Prof. Dr. Ugur Gudukbay
Approved for the Institute of Engineering and Science:
Prof. Dr. Mehmet B. BarayDirector of the Institute Engineering and Science
ii

ABSTRACT
MEAN-SHIFT ANALYSIS FOR IMAGE AND VIDEOAPPLICATIONS
Halil Ibrahim Cuce
M.S. in Electrical and Electronics Engineering
Supervisor: Prof. Dr. Ahmet Enis Cetin
May, 2005
In this thesis, image and video analysis algorithms are developed. Tracking mov-
ing objects in video have important applications ranging from CCTV (Closed Cir-
cuit Television Systems) to infrared cameras. In current CCTV systems, 80% of
the time, it is impossible to recognize suspects from the recorded scenes. There-
fore, it is very important to get a close shot of a person so that his or her face
is recognizable. To take high-resolution pictures of moving objects, a pan-tilt-
zoom camera should automatically follow moving objects and record them. In
this thesis, a mean-shift based moving object tracking algorithm is developed. In
ordinary mean-shift tracking algorithm a color histogram or a probability den-
sity function (pdf) estimated from image pixels is used to represent the moving
object. In our case, a joint-probability density function is used to represent the
object. The joint-pdf is estimated from the object pixels and their wavelet trans-
form coefficients. In this way, relations between neighboring pixels, edge and
texture information of the moving object are also represented because wavelet
coefficients are obtained after high-pass filtering. Due to this reason the new
tracking algorithm is more robust than ordinary mean-shift tracking using only
color information.
A new content based image retrieval (CBIR) system is also developed in this
thesis. The CBIR system is based on mean-shift analysis using a joint-pdf. In
this system, the user selects a window in an image or an entire image and queries
similar images stored in a database. The selected region is represented using a
joint-pdf estimated from image pixels and their wavelet transform coefficients.
The retrieval algorithm is more reliable compared to other CBIR systems using
only color information or only edge or texture information because the joint-
pdf based approach represents both texture, edge and color information. The
proposed method is also computationally efficient compared to sliding-window
iii

iv
based retrieval systems because the joint-pdfs are compared in non-overlapping
windows. Whenever there is a reasonable amount of match between the queried
window and the original image window then a mean-shift analysis is started.
Keywords: Mean-shift tracking, FLIR imagery, saliency detection, color his-
togram, content-based image retrieval.

OZET
RESIM VE VIDEO UYGULAMALARI ICINORTALAMA DEGER KAYMASI ANALIZI
Halil Ibrahim Cuce
Elektrik ve Elektronik Muhendisligi, Yuksek Lisans
Tez Yoneticisi: Prof. Dr. Ahmet Enis Cetin
Mayıs, 2005
Bu tezde imge ve video uygulamaları icin analiz yazılımları gelistirilmistir.
Videoda hareketli nesnelerin takibi ve izlenmesi onemli uygulamaları olan bir
problemdir. Ornegin, kapalı devre televizyon sistemi kullanan guvenlik uygula-
malarında izleme yapan kameranın hareketli nesneye otomatik olarak odaklan-
ması cok onemlidir. Cunku olay cıkabilecek yerlere yerlestirilen her kamerayı
izleyen bir guvenlik gorevlisi yoktur. Hırsızlık olaylarında yapılan kayıtların
%80’inde suc isleyenler tanınacak duzeyde degildir. Bu kayıtlardaki kisilerin
yuzleri 20-30 olusmakta ve bu sucluları tanımak mumkun olmamaktadır. Ayrıca
enfraruj kameralarda da otomatik takip ozelligi faydalı bir ozelliktir. Bu tezde
hareketli nesneleri otomatik olarak takip edebilecek bir algoritma gelistirilmistir.
Gelistirilen algoritma ve yazılım ortalama deger kayması metoduna dayalıdır. An-
cak literaturde belirtilen metodlardan farklı olarak imgecikler arasındaki iliskiler
de goz onune alınmıstır ve standart metodlardan daha ustun bir izleme yazılımı
olusturulmustur. Hareket eden nesnenin komsu imgecikleri, kenar ve doku bil-
gisi arasında ki iliskiler, yuksek-bant suzgec islemi sonucu elde edilen dalgacık
katsayılarının kullanılması nedeniyle goz onune alınmıstır. Dalgacık donusumu
katsayıları kenar bilgilerini de icerdiginden algoritma sadece renk histogramı kul-
lanan algoritmalara gore daha dayanıklıdır.
Bu tez cercevesinde ortalama deger kaymasına dayalı bir icerik tabanlı imge
sorgulama metodu da gelistirilmistir. Boyle bir sistemle sayısal video ya da
imge kaydı yapılan bir ortamdan sorgulama yapmak mumkun olacaktır. Kul-
lanıcı sorgulama yapacagı turden bir resmi ya da resim parcasını sisteme gire-
cek sistem de sorgulanan resime benzer ya da onu iceren resimleri veri ta-
banından getirecektir. Sorgulama penceresinin icindeki resim parcasından ortak-
olasılık yogunluk fonksiyonu dalgacık donusumu ve gercek imgecikler kullanılarak
olusturulmaktadır. Hem renk, hem de kenar yogunlugu bilgisi kullanıldıgından
v

vi
sorgulama islemi sadece renk bilgisi kullanan sorgulamalara gore daha guvenlidir.
Arama islemi veritabanındaki resimlerin uzerinden kayan bir pencere uzerinden
degil de ortalama deger kayması kullanılacagından normalden hızlı olmaktadır.
Anahtar sozcukler : Ortalama deger kayması takibi, FLIR resim galerisi, belirgin-
lik bulma, renk histogramı, icerige dayalı resim arama.

Acknowledgement
I would like to express my gratitude to my supervisor Prof. Dr. Ahmet Enis
Cetin for his instructive comments in the supervision of the thesis.
I would like to express my special thanks and gratitude to Assoc. Prof. Dr.
Ezhan Karasan and Asst. Prof. Ugur Gudukbay for showing keen interest to the
subject matter and accepting to read and review the thesis.
vii

Contents
1 Introduction 1
1.1 Review of Object Tracking Methods . . . . . . . . . . . . . . . . . 2
1.2 Mean Shift Tracking in CBIR . . . . . . . . . . . . . . . . . . . . 3
1.3 Organization of the Thesis . . . . . . . . . . . . . . . . . . . . . . 4
2 Mean-Shift Object Tracking in FLIR Imagery 6
2.1 Forward Looking Infrared Systems . . . . . . . . . . . . . . . . . 7
2.2 Mean-Shift Object Tracking . . . . . . . . . . . . . . . . . . . . . 9
2.3 Image Feature Selection . . . . . . . . . . . . . . . . . . . . . . . 10
2.4 Simulation Examples . . . . . . . . . . . . . . . . . . . . . . . . . 15
3 Mean-Shift Tracking in CBIR 22
3.1 Image Content Descriptors . . . . . . . . . . . . . . . . . . . . . . 23
3.1.1 Color . . . . . . . . . . . . . . . . . . . . . . . . . . . . . . 24
3.1.2 Texture . . . . . . . . . . . . . . . . . . . . . . . . . . . . 26
3.1.3 Shape . . . . . . . . . . . . . . . . . . . . . . . . . . . . . 27
viii

CONTENTS ix
3.1.4 Spatial Information . . . . . . . . . . . . . . . . . . . . . . 27
3.2 Similarity Measures . . . . . . . . . . . . . . . . . . . . . . . . . . 27
3.3 Indexing Methods . . . . . . . . . . . . . . . . . . . . . . . . . . . 28
3.4 User Interaction . . . . . . . . . . . . . . . . . . . . . . . . . . . . 29
3.5 Mean-Shift Analysis in CBIR . . . . . . . . . . . . . . . . . . . . 29
3.5.1 Modelling of User interest . . . . . . . . . . . . . . . . . . 31
3.5.2 Similarity Measure . . . . . . . . . . . . . . . . . . . . . . 39
3.5.3 Image Partition . . . . . . . . . . . . . . . . . . . . . . . . 40
3.5.4 Mean-Shift Tracking . . . . . . . . . . . . . . . . . . . . . 41
3.6 Experimental Results . . . . . . . . . . . . . . . . . . . . . . . . . 43
4 Conclusions 54

List of Figures
2.1 A comparison between the night vision camera and FLIR image. . 8
2.2 FLIR image of a plane. . . . . . . . . . . . . . . . . . . . . . . . . 11
2.3 High-pass filtered version of the above plane image. The cut-off
frequency of the filter is π/2. . . . . . . . . . . . . . . . . . . . . 12
2.4 High-pass filtered version of the above plane image. The cut-off
frequency of the high-pass filter is π/4. . . . . . . . . . . . . . . . 12
2.5 A FLIR image from the web page: www.dii-llc.com. . . . . . . . . 13
2.6 (a) Histogram of the highpass image shown in Figure 2.2, (b) high-
pass histogram of the moving car in Figure 2.5. Mean values of
high-pass histograms are very close to zero. The variance of the
histogram in part (b) is higher than the variance of the histogram
in part (a). In the above plots, histograms are shifted by 100. . . 14
2.7 Frequency response of the high-pass filter at cut-off π/4. . . . . . 15
2.8 The Bhattacharya coefficients of the ordinary mean-shift (dotted)
and the proposed method (solid) for image sequence 1. . . . . . . 17
2.9 The iteration number of the proposed tracking method. . . . . . . 18
2.10 Tracking the car on the parking lot: (a) frame 1, (b) frame 3, (c)
frame 5, and (d) frame 9. . . . . . . . . . . . . . . . . . . . . . . . 18
x

LIST OF FIGURES xi
2.11 Tracking the walking man with ordinary mean-shift: (a) frame 1,
(b) frame 5, (c) frame 10, (d) frame 15, (e) frame 20, and (f) frame 25. 19
2.12 Tracking the walking man with the proposed mean-shift method
using both image and high-pass filter information: (a) frame 1, (b)
frame 5, (c) frame 10, (d) frame 15, (e) frame 20, and (f) frame 25. 20
2.13 Tracking the plane in the airport. Ordinary mean-shift tracker
fails: (a) frame 1, (b) frame 3, (c) frame 6, and (d) frame 10. . . . 21
2.14 Tracking the plane in the airport with the proposed mean-shift
method: (a) frame 1, (b) frame 3, (c) frame 6, and (d) frame 10. . 21
3.1 Flow diagram of the proposed CBIR system. . . . . . . . . . . . . 30
3.2 User interest in a query image. . . . . . . . . . . . . . . . . . . . . 34
3.3 Pixels whose histograms entries are larger than 0.005 are colored
in blue to show the effect of background reduction. . . . . . . . . 36
3.4 Wavelet sub-images of the beetle image. . . . . . . . . . . . . . . 38
3.5 Image partition. . . . . . . . . . . . . . . . . . . . . . . . . . . . . 40
3.6 The sub-block with the highest similarity measure (blue rectangle). 41
3.7 The localization of candidate region by mean-shift tracking algo-
rithm after image partition (red rectangle). . . . . . . . . . . . . . 42
3.8 The developed software to test image retrieving. . . . . . . . . . . 44
3.9 Set representation of retrieving process. . . . . . . . . . . . . . . . 44
3.10 (a) Beetle example image with user interest. (b) Hit 1 with 0.99
similarity measure. (b) Hit 2 with 0.40 of similarity measure. (c)-
(f) Other hits with 0.39, 0.30 and 0.29 respectively. . . . . . . . . 47

LIST OF FIGURES xii
3.11 (a) Flower example image with user interest. (b) Hit 1 with 0.74
similarity measure. (b) Hit 2 with 0.74 of similarity measure. (c)-
(f) Other hits with 0.54, 0.48 and 0.46 respectively. . . . . . . . . 48
3.12 (a) Human face example image with user interest. (b) Hit 1 with
0.91 similarity measure. (b) Hit 2 with 0.90 of similarity measure.
(c)-(f) Other hits with 0.89, 0.88 and 0.79 respectively. . . . . . . 49
3.13 (a) Turkish flag example image with user interest. (b) Hit 1 with
0.99 similarity measure. (b) Hit 2 with 0.40 of similarity measure.
(c)-(f) Other hits with 0.39, 0.30 and 0.29 respectively. . . . . . . 50
3.14 (a) Turkish flag example image with user interest. User interest is
modelled by background reduction. (b) Hit 1 with 0.67 similarity
measure. (b) Hit 2 with 0.40 of similarity measure. (c)-(f) Other
hits with 0.32, 0.31 and 0.31 respectively. . . . . . . . . . . . . . . 51
3.15 (a) Bird example image with user interest. (b) Hit 1 with 0.94
similarity measure. (b) Hit 2 with 0.93 of similarity measure. (c)-
(f) Other hits with 0.92, 0.87 and 0.77 respectively. . . . . . . . . 52
3.16 (a) Bird example image with user interest. User interest includes
edge information .(b) Hit 1 with 0.90 similarity measure (b) Hit 2
with 0.87 of similarity measure. (c)-(f) Other hits with 0.86, 0.83
and 0.70 respectively. . . . . . . . . . . . . . . . . . . . . . . . . . 53

List of Tables
2.1 The number of frames tracked successfully by the ordinary mean-
shift and the proposed scheme. . . . . . . . . . . . . . . . . . . . . 16
3.1 Similarity measures for the most similar sub-block after image par-
tition and iterations of the mean-shift tracking algorithm. . . . . . 43
3.2 Recall and Precision values for the example image categories. . . . 45
3.3 The number of the relevant and irrelevant images in top five for
the example image categories. . . . . . . . . . . . . . . . . . . . . 45
xiii

Chapter 1
Introduction
In this thesis, image and video analysis algorithms based on mean-shift analy-
sis [1] is developed. Mean-shift analysis was applied to moving object tracking in
video [2], image segmentation [2], image filtering [1], and Content Based Image
Retrieval (CBIR) [23]. In above applications moving objects or image windows,
or images are characterized by a probability density function (pdf) estimated from
image pixel values. The estimated pdf is basically a normalized and smoothed
version of the color histogram in color images, and gray level histogram in gray
level images including infrared images.
Obviously, a color histogram of an object does not uniquely represent a given
image object or a region. However, it is an efficient way of representing a given
object because it is a one-dimensional function. In addition, it allows a given
object change its shape over time in video. For example, a walking person changes
its shape in video. On the other hand, his or her clothes and their colors do not
change. Therefore, the color histogram can be used to characterize a walking
person in video and many tracking algorithms using the color histogram were
developed in the literature. On the other hand, color or gray level histogram
completely loses the relation between the pixels. Therefore, the color histogram
(gray-level histogram) will not be an effective way of representing the object
when the background has the same colors or similar colors (gray levels) as the
moving object. This causes problems in tracking and the object can be lost by
1

CHAPTER 1. INTRODUCTION 2
the tracking algorithm. Similarly, unrelated images having the same colors as the
image to be queried can be retrieved by the content based image retrieval system.
In this thesis, a joint-pdf estimated from image pixels and their wavelet trans-
form coefficients are used for object tracking and content based image retrieval.
Since wavelet transform coefficients are obtained using a high pass filter wavelet
coefficients capture the texture and edges in a given object or an image region.
Additional information coming from the wavelet domain is essential to distinguish
a moving object from the background. A special emphasis is given to gray-level
Forward Looking Infrared (FLIR) images.
Similarly, a given query image is better described by using both the ac-
tual pixel values and corresponding wavelet coefficients representing the high-
frequency content of the queried image. This leads to better results in CBIR
applications.
In the next section we review the current object tracking methods. In Sec-
tion 1.2, image processing algorithms used in content based image retrieval sys-
tems are reviewed
1.1 Review of Object Tracking Methods
The object tracking problem in video is defined as finding the location of a given
blob in the current frame. Usually, the blob is specified in the previous frame or
in an initial image frame. The object is tracked in the video by keeping track of
the locations of the blob over the video consisting of image frames.
The most straightforward approach of finding a given object in the current
frame is based on correlating the pixels of the blob with the current image:
g(n,m) =∑
k,l
It(k, l) ∗ It−1(n + k, m + l) (1.1)
where It(k, l) represent the current image pixels, It−1 are the pixels of the blob in
the previous frame and the summation is carried out over the object pixels. The

CHAPTER 1. INTRODUCTION 3
correlation function produces a maximum when the two objects overlap. Mean
absolute deviation can be also used instead of correlation providing a computa-
tionally more efficient version of the correlation tracker. One of the main problems
with this approach is that the object may change its shape while moving due to
rotation, arm and leg movements, and/or bending etc. Another problem is that
it is a brute force approach. The correlation function has to be estimated in a
window and its maximum has to be determined in the window. The direction of
the moving object cannot be estimated until the last step of maximum detection.
In mean-shift tracking the blob to be tracked is placed on the current image
and a weight for each pixel is computed. The weights are simply the ratio of the
probabilities of estimated histogram etc. For example, if the current pixel is not a
part of the blob then its probability is zero and the corresponding weight is zero.
If the current pixel is part of the original blob then the corresponding weight is
a nonzero value. The first iteration of the mean shift procedure is completed by
computing the center of mass of weights. The next iteration starts by placing
the blob on the center of mass. It is proven by Comaniciu and Meer that this
process converges. As described above the contribution of this thesis is the use
of multi-dimensional joint-pdf instead of the color only based pdf estimated from
the color histogram.
Recently, particle filtering [6] based moving object trackers are developed.
However, particle filtering is computationally more expensive then mean shift
tracking procedure. Particle filtering based approach also uses the probability
density function to describe an object. It should be pointed out that the joint-
pdf approach proposed in this thesis can be also used in particle filtering based
tracker as well.
1.2 Mean Shift Tracking in CBIR
Content based image retrieval may find applications in video surveillance systems,
medical image retrieval, and image-similarity based Internet browsing, etc. In

CHAPTER 1. INTRODUCTION 4
CBIR systems, the user selects a portion of a given image or the entire image and
tries to retrieve similar images from an image database [13]-[21]. In some systems
the user sketches or paints an image of the object that he wants to retrieve [22].
In this thesis, we focus on image retrieving for image based queries.
The brute force approach is based on correlating the query image with images
in the database to find similar images. If image sizes are different then the
smaller image is correlated with other images in sliding windows. The mean-shift
method was also used in content based image retrieval by Koubaroulis, Matas and
Kittler [23]. Each image in the database is divided into non-overlapping windows
and whenever there is some partial match the mean shift process is started and
if the amount of match increases after mean-shift iterations then the image is
accepted as a match. This approach is computationally more efficient than the
brute force approach because the search windows do not overlap as in sliding
window based approaches. As in standard mean-shift tracking the queried image
is modelled using a color histogram or its smoothed versions estimated from the
image pixels.
In this thesis, we use not only the color histogram but also the joint-pdf
estimated from the image pixels and their wavelet coefficients. This approach
produces more reliable retrieval results because both color, texture and edges are
taken into account by the joint-pdf. The computational cost increases due to the
use of a multi-dimensional pdf instead of a marginal color based pdf estimates.
However the increase is not high because the dynamic range of wavelet coefficients
is not high, e.g., wavelet coefficients corresponding to flat regions are zero due to
high pass filtering.
1.3 Organization of the Thesis
The thesis is organized as follows: Chapter 2 includes mean-shift tracking of
moving objects using multi-dimensional histogram in FLIR imagery and gives
simulation examples. In Chapter 3, the methods used in content-based image

CHAPTER 1. INTRODUCTION 5
retrieval systems are discussed. A CBIR method based on the color histogram and
the corresponding image wavelet coefficients by using the mean-shift analysis is
proposed and experimental results are presented. Finally, the thesis is concluded
in Chapter 4.

Chapter 2
Mean-Shift Object Tracking in
FLIR Imagery
Moving object tracking in video is a critical task in many applications including
surveliance in CCTV systems, vision based human-computer interection, and
infrared imaging [2, 4, 3, 7, 8, 9]. Recently tracking the mean shift method
became popular (see e.g., in [5]) and Yilmaz et al. [7] combined kernel tracking
with global motion compensation for forward-looking infrared (FLIR) imagery.
The mean shift algorithm tracks objects in image sequences by using proba-
bility distributions describing the object. This means that the image data has to
be represented as a probability distribution. In regular video, pdfs are estimated
from color histograms to characterize the object. In FLIR videos, the ordinary
mean shift method relies on the intensity distributions or smoothed histograms
of the target region. It then estimates the location of the target in an itera-
tive manner in the next image frame by comparing the intensity distributions.
Since the original mean-shift method [2] is based only on the one-dimensional
histograms constructed from the image intensity values it completely misses the
texture information of the object. One-dimensional histograms approximating
probability density functions (pdf) do not incorporate spatial relation of the im-
age intensity values. This produces problems especially in small targets in FLIR
6

CHAPTER 2. MEAN-SHIFT OBJECT TRACKING IN FLIR IMAGERY 7
sequences [7, 8] because the number of target intensity values are relatively small
compared to large targets. In order to achieve a more realistic target modelling
two-dimensional histograms or estimates of the two-dimensional probability den-
sity functions (pdf) are used to model targets in [7, 8]. In addition, the authors
used an estimate of the pdf of the local standard deviation of the target region
to highlight the low contrast between the target and the background in FLIR
images. In [11], edges of the object are highligted by including an additional
bit in the histogram characterizing the object. If there is a significant change in
consecutive pixels then the additional bit is set to 1.
In this this, the two-dimensional image data is processed using a highpass fil-
ter to capture object features including edges on the object [12]. Let the random
vector [x, xh] represent the original and highpass filtered version of the original
image x. In this article, the histogram or the pdf of this vector is estimated and
the tracking is carried out using the composite histogram which characterizes the
object not only from the image pixels but also from the pixels of the high-pass
filtered image. The main advantage of this approach over the regular intensity
value based tracking is that the first entry captures the intensity information of
the target and the second entry captures (i) the pixel intensity variation infor-
mation, and (ii) hightlights the contrast between the target and the background
around the edges of the target.
2.1 Forward Looking Infrared Systems
Forward Looking Infrared (FLIR) is a night vision system that is used in many
applications. FLIR systems have superior feature over the conventional night vi-
sion systems. It was originally developed for military purposes but today several
civil applications such as law enforcement, fire fighting, governmental and com-
mercial operations use these systems. FLIR was first used by military forces to
identify the opposite forces. FLIR units measure the amount of infrared energy
emitted by objects. Human eye does not see infrared energy but FLIR system
senses and interprets that energy and converts to an image in complete darkness.

CHAPTER 2. MEAN-SHIFT OBJECT TRACKING IN FLIR IMAGERY 8
Figure 2.1: A comparison between the night vision camera and FLIR image.
FLIR systems do not provide a perfect image like the traditional night vision
systems. It produces sufficient image to distinguish objects. Conventional night
vision systems improve image quality by processing visible night. Therefore they
need a minimal amount of available light to produce acceptable images. At that
point, FLIR systems become more important under the conditions of very low
visibility and full darkness as seen in Figure 2.1. FLIR can be an effective system
for surveillance aims without using special lighting equipments since it measures
thermal energy. It is also significant system for military forces. It has been
adopted to aircrafts, naval vessels and ground vehicles during the last decade.
Recently, its handheld versions have been manufactured.
FLIR systems are widely used in many areas as mentioned above. Therefore,
motion detection and object tracking in FLIR system became a challenging task
for researchers in recent years.

CHAPTER 2. MEAN-SHIFT OBJECT TRACKING IN FLIR IMAGERY 9
2.2 Mean-Shift Object Tracking
Mean-shift tracking algorithm is an iterative scheme based on comparing the
histogram of the original object in the current image frame and histogram of
candidate regions in the next image frame. The aim is to maximize the correlation
between two histograms.
Let x represent an image x : Z2− > {0, 1, 2, ..., N−1} where N is the dynamic
range of the pixel values. Let O represent the support of an object. Let yo be the
center of mass of the support O which is a subset of Z2. The histogram of the
object O in image frame n is defined as follows
hO(`) =∑
(n1,n2)∈O
(δ(x(n1, n2)− `) (2.1)
where x(n1, n2) is the value of the (n1, n2)-th pixel of the image x, δ(.) is the
discrete Dirac-delta function, and ` = 0, 1, 2, ..., N−1. The histogram is smoothed
and normalized in several ways in [2]. In our work, an ordinary low-pass FIR filter
is used to smooth the histogram.
In mean-shift tracking algorithm, histograms of regions are compared to each
other using the Bhattacharya coefficient:
ρ(hO, h) =∑
`
√hO(`)h(`) (2.2)
In the next image frame, the histogram of the same region is estimated and the
following weights w(n1, n2) for each pixel in the region O in the (n+1)st frame
are computed.
w(n1, n2) =N−1∑
`=0
√√√√hO(`)
h(`)(δ(x(n1, n2)− `) (2.3)
where h(`) represents the histogram of the region O in (n+1)st image frame of
of the video. After this step, the center of mass yt of the weights are determined
by:
yt =
∑n1,n2
x(n1, n2)w(n1, n2)∑n1,n2
w(n1, n2). (2.4)
CHAPTER 2. MEAN-SHIFT OBJECT TRACKING IN FLIR IMAGERY 10
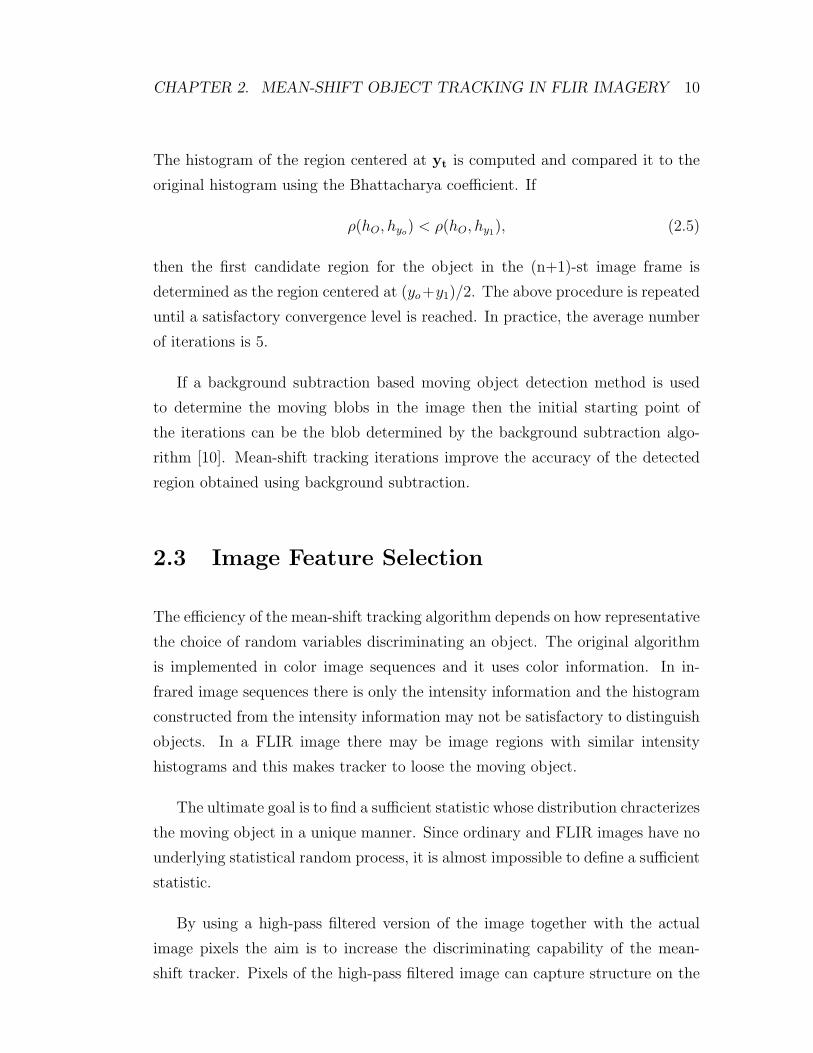
The histogram of the region centered at yt is computed and compared it to the
original histogram using the Bhattacharya coefficient. If
ρ(hO, hyo) < ρ(hO, hy1), (2.5)
then the first candidate region for the object in the (n+1)-st image frame is
determined as the region centered at (yo+y1)/2. The above procedure is repeated
until a satisfactory convergence level is reached. In practice, the average number
of iterations is 5.
If a background subtraction based moving object detection method is used
to determine the moving blobs in the image then the initial starting point of
the iterations can be the blob determined by the background subtraction algo-
rithm [10]. Mean-shift tracking iterations improve the accuracy of the detected
region obtained using background subtraction.
2.3 Image Feature Selection
The efficiency of the mean-shift tracking algorithm depends on how representative
the choice of random variables discriminating an object. The original algorithm
is implemented in color image sequences and it uses color information. In in-
frared image sequences there is only the intensity information and the histogram
constructed from the intensity information may not be satisfactory to distinguish
objects. In a FLIR image there may be image regions with similar intensity
histograms and this makes tracker to loose the moving object.
The ultimate goal is to find a sufficient statistic whose distribution chracterizes
the moving object in a unique manner. Since ordinary and FLIR images have no
underlying statistical random process, it is almost impossible to define a sufficient
statistic.
By using a high-pass filtered version of the image together with the actual
image pixels the aim is to increase the discriminating capability of the mean-
shift tracker. Pixels of the high-pass filtered image can capture structure on the

CHAPTER 2. MEAN-SHIFT OBJECT TRACKING IN FLIR IMAGERY 11
Figure 2.2: FLIR image of a plane.
moving object including the edges.
In Figure 2.2, FLIR image of a plane is shown. The image shown in Figure 2.3
is a high-pass filtered version of this image. A high-pass filter with cut-off fre-
quency at π/2 is used. This image does not clearly reflect the edges of the object.
In Figure 2.4, another high-pass filter with cut-off π/4 is used. This image clearly
shows the edges. Therefore, it is necessary to use a high-pass filter with a lower
cut-off frequency to extract the image structure.
High-pass information can be incorporated into the histogram. Since the
dimension of the data is doubled compared to pixel-only histograms, the dynamic
range of the new histogram is N2. In order to reduce the range the highpass
filtered image is quantized to 4 levels, and this leads to a 4xN size histograms.
As it can be seen from the above images high-pass filtering captures (i) the
pixel intensity variation information, and (ii) hightlights the contrast between
the target and the background around the edges of the target. This makes the
tracking algorithm more robust. Otherwise the histogram of the object shown in
Figure 2.2 essentially contains a single peak around the mean value of the object
region and this is not enough to uniquely determine the object.

CHAPTER 2. MEAN-SHIFT OBJECT TRACKING IN FLIR IMAGERY 12
Figure 2.3: High-pass filtered version of the above plane image. The cut-offfrequency of the filter is π/2.
Figure 2.4: High-pass filtered version of the above plane image. The cut-offfrequency of the high-pass filter is π/4.

CHAPTER 2. MEAN-SHIFT OBJECT TRACKING IN FLIR IMAGERY 13
Figure 2.5: A FLIR image from the web page: www.dii-llc.com.
In Figure 2.5, another FLIR image is shown. This image sequence is down-
loaded from the web page: www.dii-llc.com/FLIR multimedia.html. In this image
there are edges within the object as well. Therefore it is important to include
these features in the histogram characterizing the object in a unique manner. The
highpass histograms of the plane in Figure 2.2 and the moving car in Figure 2.5
are shown in Figure 2.6-a and 2.6-b, respectively. The dynamic range of the
graph in Figure 2.6-b is higher than Figure 2.6-a. As it can be seen from these
graphs high-pass information provides additional information about the moving
object. A composite histogram describing both regular pixel values and pixel
values of the high-pass filtered image can be constructed in several ways. The
easiest approach is to concatenate the normalized histograms of two images. In
this case, the dynamic range of the concatenated histogram is 2N . One can also
create a two-dimensional data set by combining the pixels of the two images.
In this case, the dimension of the data is doubled compared to a pixel-only his-
togram, therefore the dynamic range of the new histogram is theoretically N2.
However, actual dynamic range of the high-pass filtered image is much smaller
than dynamic range of intensity pixels. Quantized version of the high-pass fil-
tered image pixels can be used. It is experimentally observed that 4 to 8 levels
are found satisfactory , and this leads to a 4xN to 8xN size histograms. The

CHAPTER 2. MEAN-SHIFT OBJECT TRACKING IN FLIR IMAGERY 14
0 20 40 60 80 100 120 140 160 180 2000
0.05
0.1
0.15
0.2
0.25
0.3
0.35
0.4
0.45
pixel values(+100)→
norm
aliz
ed h
isto
gram
(a)
0 20 40 60 80 100 120 140 160 180 2000
0.05
0.1
0.15
0.2
0.25
0.3
0.35
pixel values(+100)→
norm
aliz
ed h
isto
gram
(b)
Figure 2.6: (a) Histogram of the highpass image shown in Figure 2.2, (b) highpasshistogram of the moving car in Figure 2.5. Mean values of high-pass histogramsare very close to zero. The variance of the histogram in part (b) is higher thanthe variance of the histogram in part (a). In the above plots, histograms areshifted by 100.

CHAPTER 2. MEAN-SHIFT OBJECT TRACKING IN FLIR IMAGERY 15
0 0.5 1 1.5 2 2.5 3 3.50
0.1
0.2
0.3
0.4
0.5
0.6
0.7
0.8
0.9
1
Normalized frequence→
Mag
nitu
de
Figure 2.7: Frequency response of the high-pass filter at cut-off π/4.
second approach provides a more robust description of the object. This comes
at the expense of additional computation. However, in both cases, the compu-
tational complexity does not increase drastically with the additional high-pass
information in both approaches.
2.4 Simulation Examples
The proposed tracking method was developed by MATLAB 6.5. It is tested for
six FLIR image sequences downloaded from Internet. Due to military nature
of FLIR imaging we could not get permission to use other image sequences in
this thesis. The ordinary mean-shift tracking tracks the targets in four sequences
successfully. Our method tracks them as well. But the ordinary mean-shift
algorithm fails for the image sequences 1 and 2. Table 2.1 gives the number of
frames tracked successfully by the ordinary mean-shift tracking and our method.
The car in the parking lot (Figure 2.5) from image sequence 4 can be also
tracked very easily by both trackers using image pixels, and image and high-pass
filtered image pixels because the background is not cluttered in this scene, either.
CHAPTER 2. MEAN-SHIFT OBJECT TRACKING IN FLIR IMAGERY 16
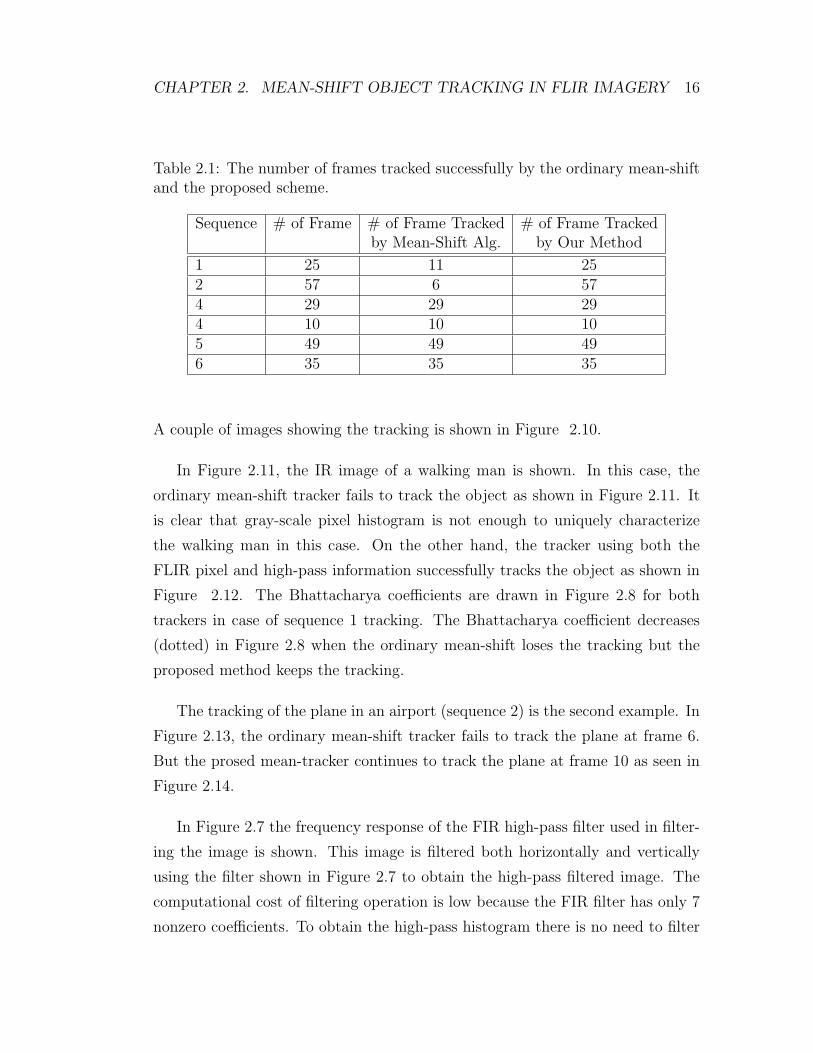
Table 2.1: The number of frames tracked successfully by the ordinary mean-shiftand the proposed scheme.
Sequence # of Frame # of Frame Tracked # of Frame Trackedby Mean-Shift Alg. by Our Method
1 25 11 252 57 6 574 29 29 294 10 10 105 49 49 496 35 35 35
A couple of images showing the tracking is shown in Figure 2.10.
In Figure 2.11, the IR image of a walking man is shown. In this case, the
ordinary mean-shift tracker fails to track the object as shown in Figure 2.11. It
is clear that gray-scale pixel histogram is not enough to uniquely characterize
the walking man in this case. On the other hand, the tracker using both the
FLIR pixel and high-pass information successfully tracks the object as shown in
Figure 2.12. The Bhattacharya coefficients are drawn in Figure 2.8 for both
trackers in case of sequence 1 tracking. The Bhattacharya coefficient decreases
(dotted) in Figure 2.8 when the ordinary mean-shift loses the tracking but the
proposed method keeps the tracking.
The tracking of the plane in an airport (sequence 2) is the second example. In
Figure 2.13, the ordinary mean-shift tracker fails to track the plane at frame 6.
But the prosed mean-tracker continues to track the plane at frame 10 as seen in
Figure 2.14.
In Figure 2.7 the frequency response of the FIR high-pass filter used in filter-
ing the image is shown. This image is filtered both horizontally and vertically
using the filter shown in Figure 2.7 to obtain the high-pass filtered image. The
computational cost of filtering operation is low because the FIR filter has only 7
nonzero coefficients. To obtain the high-pass histogram there is no need to filter

CHAPTER 2. MEAN-SHIFT OBJECT TRACKING IN FLIR IMAGERY 17
0 5 10 15 20 250.5
0.55
0.6
0.65
0.7
0.75
0.8
0.85
0.9
0.95
1
frames→
ρ
Figure 2.8: The Bhattacharya coefficients of the ordinary mean-shift (dotted)and the proposed method (solid) for image sequence 1.
the entire image frame. Only a window around the moving object is sufficient be-
cause means-shift tracker performs a local search to determine the next location
of the object.
Another issue in the tracking based on mean-shift is the number of iterations.
For example, iteration values per frame are depicted in Figure 2.9 for image
sequence 1. The peak and average value is 7 and 2.95, respectively. These may
be used to compute the required processing power in a real-time application.

CHAPTER 2. MEAN-SHIFT OBJECT TRACKING IN FLIR IMAGERY 18
0 5 10 15 20 250
1
2
3
4
5
6
7
frames→
num
ber o
f ite
ratio
ns
Figure 2.9: The iteration number of the proposed tracking method.
(a) (b)
(c) (d)
Figure 2.10: Tracking the car on the parking lot: (a) frame 1, (b) frame 3, (c)frame 5, and (d) frame 9.

CHAPTER 2. MEAN-SHIFT OBJECT TRACKING IN FLIR IMAGERY 19
(a) (b)
(c) (d)
(e) (f)
Figure 2.11: Tracking the walking man with ordinary mean-shift: (a) frame 1,(b) frame 5, (c) frame 10, (d) frame 15, (e) frame 20, and (f) frame 25.

CHAPTER 2. MEAN-SHIFT OBJECT TRACKING IN FLIR IMAGERY 20
(a) (b)
(c) (d)
(e) (f)
Figure 2.12: Tracking the walking man with the proposed mean-shift methodusing both image and high-pass filter information: (a) frame 1, (b) frame 5, (c)frame 10, (d) frame 15, (e) frame 20, and (f) frame 25.

CHAPTER 2. MEAN-SHIFT OBJECT TRACKING IN FLIR IMAGERY 21
(a) (b)
(c) (d)
Figure 2.13: Tracking the plane in the airport. Ordinary mean-shift tracker fails:(a) frame 1, (b) frame 3, (c) frame 6, and (d) frame 10.
(a) (b)
(c) (d)
Figure 2.14: Tracking the plane in the airport with the proposed mean-shiftmethod: (a) frame 1, (b) frame 3, (c) frame 6, and (d) frame 10.

Chapter 3
Mean-Shift Tracking in CBIR
Content-based image retrieval (CBIR) is a method to search images from a
database of images according to the user’s interest. It uses visual contents of
image in searching. CBIR has been an active and challenging research area since
1990s. A significant progress has been made in both theoretical research and
practical applications during the last decade.
Early methods were usually based on textual annotations of images. In other
words, images were first annotated with text and then searched using text-based
approach in database management systems. However, most text-based image
retrieval systems require manual annotation of images since automatic generation
of descriptive texts for a wide spectrum of images is not feasible. It is obvious
that manual image annotation is expensive task for large databases and often
subjective. As a result, CBIR by using traditional database management systems
is not sufficient to support different queries.
In the 1990s, advances in the Internet and new digital image sensor tech-
nologies drastically increased the volume of digital images produced by scientific,
educational, medical, industrial and other applications for users. Therefore the
difficulties of text-based retrieval became more severe. An efficient management
of quickly increasing visual information became an urgent problem. Several re-
searchers from the different areas such as computer vision, database management,
22

CHAPTER 3. MEAN-SHIFT TRACKING IN CBIR 23
human-computer interaction etc. worked on the field [24]-[28]. Then research on
CBIR has developed rapidly. The number of publications on the methods for vi-
sual infirmation extraction, organization, indexing and user query has increased.
Similarly, a large number of CBIR system has been developed by universities,
governments, companies and hospitals.
CBIR systems use the visual contents of an image such as color, shape, texture
and spatial layout to describe and index the image. Next sections explain these
image content descriptors.
3.1 Image Content Descriptors
Image usually consists of both visual and semantic content. General image con-
tent includes color, texture, shape and spatial relationships etc. Semantic content
is obtained by textual annotation or complex inference procedures based on visual
content. This section focuses on general contents descriptions.
A successful visual content descriptor should be robust against the variances
on image such as the variation of the illuminant of scene. However, there is a
tradeoff between the robustness and the discriminative power of visual features.
The discrimination of the essential differences is reduced while increasing robust-
ness.
A visual content descriptor can be local or global. A local descriptor uses
the visual features of regions and objects to describe the image where a global
descriptor uses the visual features of the whole image. An image is often divided
into parts in the local visual descriptors. The image is simply cut into tiles
of equal size and shape. This simple partition does not guarantee perceptually
meaning regions but gives the global features of the images at a lower resolution.
More complex methods are used to obtain semantically meaningful objects such
as bird, car, etc. Some methods widely used to extract color, texture, shape, and
spatial information from are introduced briefly.

CHAPTER 3. MEAN-SHIFT TRACKING IN CBIR 24
3.1.1 Color
Color is widely used for image retrieval systems. The three-dimensional values of
color has obviously higher discriminator feature when compared to gray values
of the image. Firstly, color space that will be used in CBIR systems should be
determined before selecting an appropriate color descriptor. Therefore color space
is introduced first before color descriptors.
Color space: Each pixel of the image is represented by a point in a 3D color
space. RGB, Munsell, CIE L*a*b, CIE L*u*v and HSV are used commonly in
CBIR systems.
RGB space is widely used as a color space to display and print image. It
consists of three color components: red, green and blue. A color in RGB space
is produced by adding them together. RGB space is device independent and
perceptually non-uniform.
The CIE color space is device independent. It can be considered as per-
ceptually uniform. They include a luminance or lightness component and two
chromatic. The transformation of RGB space to CIE space is given in [29].
HSV space is widely used in computer graphics. It has the three color compo-
nents: hue, saturation and value. The hue is invariant to the illumination changes
and camera direction. So it is more suitable for object retrieval.
Color moments: Color moments are widely used in several CBIR systems.
The mean (the first order) and variance (the second order) and skewness (third
order) have been proven to be efficient and effective for the representation of color
distributions of an image [30]. The color moment method has better performance
when both CIE color spaces are used. The use of third moment besides the mean
and variance improves the overall performance of image retrieval.
Color histogram: The color histogram is the effective way to represent the
color content of an image, if all the processed data is unique. The extraction of
the color histogram is simple and it is quite effective in characterizing of local and

CHAPTER 3. MEAN-SHIFT TRACKING IN CBIR 25
global distribution of an image. It is also robust to changes in the view angle,
occlusion and rotation.
The histogram is distribution of the number of pixels for each quantized bins,
which can be defined separately or jointly for each component, since any pixel in
the image has three components in certain color space such as red, green and blue
in RGB space and hue, saturation and value in HVS. It is clear that it has more
discriminative power if more bins is used in the color histogram. However, the use
of large number of bins increases the computational cost. It also makes difficult
to build efficient indexes for image database. A very fine bin quantization does
not improve the retrieval performance in many applications. A way to reduce
the number of bins is to use the clustering methods to determine the K best
colors in a given space for a set of images. Each of these best colors are taken
as a histogram bin. Another way is to use the bins which have the largest pixels
numbers since a small number of histogram bins contain the majority of pixels
in an image [31]. This reduction does not degrade the performance of histogram
matching.
The histogram comparison saturates the discrimination when database has
large number of image. The joint histogram method is proposed in [32]. In
addition, color histogram does not take account into spatial information. Thus
very different image may have similar the color histograms. Therefore several
method to incorporate the color histogram with spatial information are proposed
to increase the discrimination power. A simple approach is to divide an image
into small areas and extract the histograms of these small areas. Increasing
the number of areas increase the spatial information. but also it increases the
computational cost and memory requirement.
Color coherence vectors: A proposed method is to use the spatial information
in the histogram extraction [33]. Each histogram bins is divided into two types. It
is coherent if it belongs to a large colored region or incoherent if it does not. Color
coherence vectors method has better performance than color histograms for image
retrieval especially when images have mostly uniform colors and mostly texture
regions.

CHAPTER 3. MEAN-SHIFT TRACKING IN CBIR 26
Color correlogram: The color correlogram [34] is used to characterize both
the color distribution of pixels and the spatial correlation of pairs of colors. The
color histogram has three dimension. The first and second dimension are used
for the colors of any pixel pairs. The third one is used for their spatial distance.
The size of the color correlogram is very large when all possible combinations of
color pairs. Its simple version called the color autocorrelogram is often used to
reduce this large size.
Invariant color features: Color varies with change of illumination, the surface
orientation and the view angle of camera. Therefore these changes may decrease
the performance of image retrieval system and should be considered. However,
these changes are not considered in the most of the color descriptors given above.
Recently invariant color descriptions have been proposed in [35, 36]. The discrimi-
nation power is decreased when this method is applied to provide the independent
color representation.
3.1.2 Texture
Texture is a significant property of images. There are many texture represen-
tations in pattern recognition and computer vision. The texture representation
has basically two categories: structural and statistical. Structural methods in-
clude morphological operator and adjacency graph to describe texture by identi-
fying structural primitives and their placement rules. Statistical methods include
Fourier power spectra, co-occurrence matrices, shift invariant component analy-
sis, Tamura feature, Wold decomposition, Markov random field, fractal model and
multi-resolution filtering methods such as Gabor and wavelet transform. All of
methods are used to characterize texture by the statistical distribution of the im-
age intensity. The details of image retrieval by the texture are not given because
they are out of scope of this thesis.

CHAPTER 3. MEAN-SHIFT TRACKING IN CBIR 27
3.1.3 Shape
The shape features of objects or regions are used in many CBIR systems. The
shape features are usually described after images have been segmented into re-
gions or objects when it is compared to color and texture features. However,
robust image segmentation is difficult. Therefore use of shape features has some
limitations except some special applications. The shape descriptions method can
be divided into two categories: boundary-based and region-based methods. The
boundary-based methods includes rectilinear shapes, polygonal approximations,
finite element models, Fourier-based shape descriptors . The region-based meth-
ods are statistical moments.
3.1.4 Spatial Information
Regions and objects with similar color and texture properties can be distinguished
by using spatial constraints. For example, a region of sky and ocean may be blue
and have same color distribution and texture. But their spatial locations on the
image are different. Therefore spatial information of region or object can be used
in CBIR systems. The most popular representation of spatial relationships is
the 2D strings [37]. Besides the 2D strings, spatial quad-tree [38] and symbolic
image [39] are also used to represent the spatial information.
3.2 Similarity Measures
Content-based image retrieval systems calculate visual similarities between a
query image and images from database. The retrieval result consists of mul-
tiple image ranked from top to bottom according to their similarity measures
with the query image. There are many similarity measures used in CBIR studies.
Some of them are given below. D(I, J) donates the distance measure between
the query image and I and the image J from the database. fi(I) is number of
the pixels in bin i of I.

CHAPTER 3. MEAN-SHIFT TRACKING IN CBIR 28
Minkowski-Form distance: The Minkowski-Form distance is suitable to mea-
sure distance between two images if each dimension of feature vector is indepen-
dent from others. The distance Lp is defined as:
D(I, J) = (∑
i
|fi(I)− fi(J)|p)1/p (3.1)
The L1, L2 is called Euclidean distance. The Minkowski-Form distance is widely
used as a metric in CBIR systems.
Quadratic form distance: The Minkowski distance takes account into all bins
of the color histogram completely independently and does not consider the certain
pairs of bins corresponding to features. The Quadratic Form Distance is propsed
to solve this problem:
D(I, J) =√
(FI − FJ)TA(FI − FJ) (3.2)
where A = [aij] is a similarity matrix and aij donates similarity between bin i
and j. FI and FJ are vectors which lists all entries of fi(I) and fi(J). It is widely
used in the histogram-based retrieval systems.
Mahalanobis distance: It can be used when each dimension of image feature
vector is dependent on each other and has different importance. Its definition is:
D(I, J) =√
(FI − FJ)T C−1(FI − FJ) (3.3)
where C is the covariance matrix of the feature vectors.
3.3 Indexing Methods
Another critical issue in CBIR is effective indexing and fast searching of images
based on visual features. Because the feature vectors are usually large sized
with multiple dimensions. Therefore they are not appropriate for the well-known
indexing schemes. In general, a size reduction is applied before implementing
efficient indexing scheme. The size reduction methods and indexing schemes are
not detailed since CBIR in this thesis is index free.

CHAPTER 3. MEAN-SHIFT TRACKING IN CBIR 29
3.4 User Interaction
The user interaction with CBIR systems is important. The flexibility for user in
CBIR systems can be obtained by involving the user to the retrieval procedure.
The interface consists of two parts: query specification and a result presentation.
Query specification can be done in many ways. These are category browsing,
query by concept, query by sketch and query by sample.
• Category browsing is to browse in the database according to the category of
the images. By this reason, images in the database are classified according
to their semantic and visual contents.
• Query by concept is to retrieve images according to the conceptual descrip-
tion.
• Query by sketch allows the user to draw a sketch of an image with a tool
(graphical editing).
• Query by example allows the user to define a query on an example im-
age. The CBIR system converts this query into its feature representation
internally.
3.5 Mean-Shift Analysis in CBIR
The proposed CBIR system is based on the color histogram for the local region.
In fact the mean-shift tracking uses the color histograms. Therefore it is efficiently
used to localize the candidate region for an image in database. The region speci-
fied by the user (target region) is searched on the database images by comparing
the color histograms. The color histogram involving background effect reduction
and edge information is first computed to extract the features of user interest.
A search method is applied to the images in database. The search method can
be divided into two categories. The first one is processes which are performed
to localize the candidate region similar to the target region for an image from
CHAPTER 3. MEAN-SHIFT TRACKING IN CBIR 30
Example by User
Feature Extraction
Pick up an Image from Database
Image Partition
Mean-Shift Tracking
Similarity Measure
Ranking Process
End of Database?
Print Results
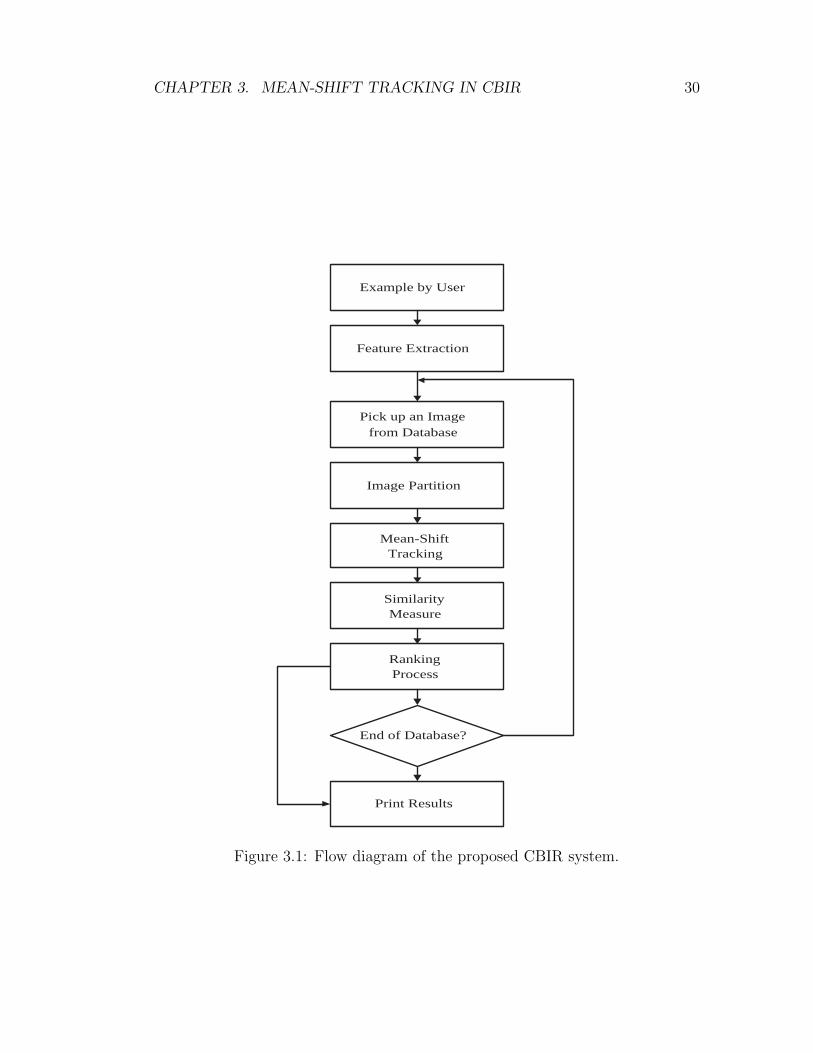
Figure 3.1: Flow diagram of the proposed CBIR system.

CHAPTER 3. MEAN-SHIFT TRACKING IN CBIR 31
database. These processes are image partition, the histogram computation for
sub-blocks in the image partition, evaluation of similarity measure and the mean-
shift tracking algorithm. Their details can be found in the following sections. A
similarity measure is assigned to the image after all these processes in the first
category are performed. That similarity measure is input to the second category
that handles the ranking of the database images. At the end of search, the best
similar five images are given to user as searching result. The flow chart of retrieval
system is shown in Figure 3.1.
3.5.1 Modelling of User interest
A user interest (target) region is chosen before modelling the target. The model of
the target is represented by the joint-color histogram. Background reduction and
use of edge information are considered in the construction of the histogram. The
edge information of the target region is extracted by using wavelet coefficients and
represented in the histogram with color distribution. The details of the histogram
computation are given in the following sections.
3.5.1.1 Histogram or Kernel Density Estimation
Statisticians developed many ways of estimating the probability density function
of a random variable from observed data [40]. The easiest way is to construct the
histogram H of the data and normalize the area under the histogram to one. The
paper by Dorin Comaniciu and Peter Meer [2] followed the approach studied by
statisticians. This approach is called the kernel density estimation. The kernel
density estimate at the observation xi is defined by
f(x) =1
n
n∑
i=1
KW (x− xi) (3.4)
where n is the observed data points or the number of pixel values in an image or
an image region, and xi represent a sample from some unknown density f, or in
the case of gray scale images or video, the pixels themselves. The function KW

CHAPTER 3. MEAN-SHIFT TRACKING IN CBIR 32
is defined as follows:
KW (x) =1√|W |
K(W−0.5x) (3.5)
where K(z) is the d-variate kernel function with compact support satisfying the
regularity constraints as described in [40], and W is a symmetric positive definite
d d bandwidth matrix. For the radially symmetric kernel, the function K(z)
becomes
K(z) = ck(||z||2) (3.6)
where c is a normalization constant. If one assumes a single global spherical
bandwidth, W = h2I, the kernel density estimator becomes
f(x) =1
n(h)d
n∑
xi=1
K(x− xi
h) (3.7)
A widely used choice for the function K is Gaussian function.
The aim of using a d-variate kernel function is to smooth the histogram. This
is especially useful when the number of observed data n is small or, equivalently,
image region is a small region. Obviously the histogram may be very jagged if
the observed image region is small. For example, xi = 200 and xj = 202 may
be observed in a 20 by 20 image region but xi = 201 may not have observed
and the value of histogram for xi = 201 will be h(201) = 0. However, if a
Gaussian smoothing function is used then f(201) will be nonzero. The parameter
h defined above controls the variance of the function K. By changing the value
of h a smoother or sharper pdf is estimated. In the extreme case, the function
K becomes an impulse and the pdf estimate is simply the normalized histogram
H(x). This approach is fine but it is computationally expensive. Because the pdf
estimate is iteratively updated for each observed data point.
We do not follow this approach in our work. We cannot assume a specific
underlying probability density for images. Therefore, the aim is simply to smooth
the histogram so that the value of the estimate for 201 becomes nonzero in the
above example.
There are more computationally efficient ways of smoothing data in electrical
engineering: namely low-pass filtering. We can smooth the histogram by simply

CHAPTER 3. MEAN-SHIFT TRACKING IN CBIR 33
using a discrete low-pass filter. The narrower the bandwidth of the low-pass filter
or smaller the cut-off frequency of the low-pass filter the smoother the estimated
pdf. At the other extreme, when the impulse response of the filter is a Dirac-delta
function then the probability density estimate is simply the histogram.
The computational cost of this approach is a one-dimensional discrete con-
volution whose cost is determined by the impulse response of the low-pass filter.
As a rule of thumb, the narrower the bandwidth of the low-pass filter the longer
the impulse response. Hence the computational cost increases. But this cost is
negligible compared to the kernel density smoothing process used by statisticians
and [2].
In our work, Finite-extent Impulse Response (FIR) filters are used. Example
low-pass filters are presented in Section 3.5.1.4. Recursive Infinite-extent Impulse
Response (IIR) filters have non-symmetric impulse responses therefore they are
not used in smoothing
3.5.1.2 Color Histogram Construction
Figure 3.2 shows a region of interest in an image selected by the user. The region
of interest is called the target region from now. The RGB color space is used to
extract the color feature of the selected target region. Because a color conversion
from the RGB to another color space does not drastically improve the retrieval
performance [41]. Another reason is that the developed CBIR system combines
the color histogram and the mean-shift tracking algorithm. Since the original the
mean-shift algorithm uses the RGB space, the fusion of the retrieval based on
the color histogram and mean-shift tracking algorithm is simplified. The color
histogram is not constructed separately for each color components in this thesis.
The joint-color histogram is used to characterize the target region. The color
components in the RGB space vary between 0 and 255 in an image. The dimension
of the color histogram is 2553 when the original color component values are taken
account during the histogram computation. This is not an efficient method by the
reason of the computational cost and large memory requirement. It also decreases

CHAPTER 3. MEAN-SHIFT TRACKING IN CBIR 34
a
b
( n10
, n20
)
Figure 3.2: User interest in a query image.
the discriminative power of retrieval system for similar images that have different
illumination, viewing angles and compression loss, etc. Therefore most of the
CBIR systems use the quantized values of color components. In this thesis, the
color component values are quantized by a fixed constant Q. As a result, the
dimension of the color histogram reduces to (255/Q)3 = N3. For instance, it
is 4096 when Q equals to 16. A method using the quantized color component
values in the color histogram extraction is mostly known as N -bin histogram
extraction [2].
The position (n10, n20) is the center of the target region with width a and
height b. Let ht be the color histogram of the target region. The size of the
histogram is N3 since the joint-color histogram is used. Equation 3.8 is used to
construct the N-bins joint-color histogram.
ht[k] =1
C
n20+b2∑
n2=n20− b2
n10+a2∑
n1=n10−a2
δ[∆(n1, n2)− k] for k = 1, 2, .., N3 (3.8)
where δ is the discrete Dirac-delta function and C is the normalization constant
and equals to ab. The index ∆(n1, n2) is derived from the quantized color values

CHAPTER 3. MEAN-SHIFT TRACKING IN CBIR 35
by using the following formula.
∆(n1, n2) = Rq(n1, n2) + NGq(n1, n2) + N2Bq(n1, n2) (3.9)
where Rq(n1, n2), Gq(n1, n2) and Bq(n1, n2) are the quantized values of R, G and
B at the pixel location (n1, n2), respectively. The quantization is performed by
Equation 3.10.
Rq(n1, n2) =⌊R(n1, n2)
Q
⌋
Gq(n1, n2) =⌊G(n1, n2)
Q
⌋(3.10)
Bq(n1, n2) =⌊B(n1, n2)
Q
⌋
where b•c is called the largest integer less than •. After this step, the ht is
smoothed by using a FIR low-pass filter defined in Section 3.5.1.1.
3.5.1.3 Reduction of Background Effect on Histogram
The background information is automatically captured while selecting the target
region or especially the object using rectangular window as seen Figure in 3.2.
The background information is important for two reasons. First, the performance
of the mean-shift tracking is decreased due to the background colors in the color
histogram of the target region. Second, it is very difficult to model an object
at its boundary. However, the effect of the background on the color histogram
can be reduced and this improves the discriminative power of retrieving and the
tracking performance of the mean-shift algorithm.
An easy way to reduce weight of the background information in the color
histogram is to estimate the color histogram of background and modify the tar-
get histogram. In Figure 3.2, a rectangular block is chosen by user. The color
histogram for this block obviously contains the object and background informa-
tion. A new extended block is virtually defined to estimate the color histogram
of background. The size of the extended block is 10% larger than the size of the
block originally selected by the user. Then the color histogram hb is computed

CHAPTER 3. MEAN-SHIFT TRACKING IN CBIR 36
Figure 3.3: Pixels whose histograms entries are larger than 0.005 are colored inblue to show the effect of background reduction.
for the region between two blocks by using exactly same method for the target
region. Then target color histogram is updated according to hb. A set weights
to modify the target color histogram ht is defined as follows:
αk = min(hb
hb[k], 1) (3.11)
where hb is the smallest nonzero entry of the hb. Then each entry of ht is
multiplied by the weight corresponding to this entry:
ht[k] = αkht[k] for k = 1, 2, .., N3 (3.12)
where ht is updated the target histogram. The weight reduction makes the target
histogram ht non-normalized. Thus re-normalization is performed:
C =N3∑
k=0
ht[k] (3.13)
ht[k] =1
Cht[k] for k = 1, 2, .., N3 (3.14)
where ht is the normalized histogram in which the effect of the background is
reduced. For example, Figure 3.3 shows the effect of the background reduction.

CHAPTER 3. MEAN-SHIFT TRACKING IN CBIR 37
Pixels whose histogram entries are larger than 0.005 are colored in blue. As
seen in Figure 3.3, the background information around the beetle image within
the user’s rectangle is reduced. The color histogram mostly contains the color
information of the beetle.
This approach may have some disadvantages in some cases. For example, if
there are similar colors on the background around the target region, this meaning-
ful information will be reduced by the method discussed above in the histogram.
As a result, the retrieval performance of the CBIR system is reduced.
3.5.1.4 Incorporation of Edge Information to Color Histogram
In this section, we describe how a joint-pdf including edge information is esti-
mated from a given image region x(n1, n2). Edge information can be extracted
by using wavelet coefficients. In order to obtain the wavelet coefficients the image
is processed by a filterbank with following low-pass and high-pass filters:
hl[n] = {0.25, 0.5, 0.25} (3.15)
and the impulse response of the high-pass filter is
hh[n] = {−0.25, 0.5,−0.25}. (3.16)
The filters are complementary with cut-off frequencies at π/2. Or,
hl[n] = {−1/32, 0, 9/32, 1/2, 9/32, 0,−1/32} (3.17)
and the corresponding high-pass filter is given by
hh[n] = {1/32, 0,−9/32, 1/2,−9/32, 0, 1/32} (3.18)
Both filters are related with Lagrange family of wavelets [42]. The image is
processed in a separable manner by the filterbank and four wavelet sub-images
xll(n1, n2), xlh(n1, n2), xhl(n1, n2), and xhh(n1, n2) are obtained as shown in Figure
3.4. Due to decimation by a factor of two after each filtering operation the wavelet
subimages are quarter size versions of the original image.

CHAPTER 3. MEAN-SHIFT TRACKING IN CBIR 38
Figure 3.4: Wavelet sub-images of the beetle image.
If the pixel x(n1, n2) is part of a horizontal edge then coefficients near
|xlh(n1/2, n2/2)| and |xhh(n1/2, n2/2)| take high values compared to flat ar-
eas in which wavelet coefficients are close to zero. Similarly, when the pixel
x(n1, n2) is part of a vertical edge then wavelet coefficients xhl(n1/2, n2/2) and
xhh(n1/2, n2/2) take high values compared to flat areas in which wavelet coeffi-
cients are close to zero. We construct a sub-image from the high-band wavelet
subimages as follows:
xa(n1, n2) = |xlh(n1, n2)|+ |xhl(n1, n2)|+ |xhh(n1, n2)| (3.19)
The subimage xa(n1, n2) covers both horizontal and vertical edges, i.e., when the
pixel x(n1, n2) is part of an edge then the subimage pixels around xa(n1/2, n2/2)
take high values compared to flat areas because the subimage xa is constructed
from the wavelet coefficients.
A joint-pdf representing a given image region can be estimated from the image
x(n1, n2) and the corresponding subimage xa by adding an extra dimension. This
joint-pdf will represent not only the gray scale information but also the high-
frequency content of the region because the subimage xa is obtained by using the
high-pass filters of the wavelet filterbank.

CHAPTER 3. MEAN-SHIFT TRACKING IN CBIR 39
The additional dimension for the subimage increases the size of the joint color
histogram depending on the quantization level of the subimage. Another way
to add edge information into the joint color histogram is to determine the state
of a pixel. In other words, the edge pixels are separated from non-edge pixels
while constructing the color histogram. This method doubles the dimension of
the histogram. Let E(n1, n2) be the edge binary state of pixel at (n1, n2). The
construction of the joint-histogram is modified as follows:
ht[k] =1
C
∑n2
∑n1
δ[E(n1, n2)N3 + ∆(n1, n2)− k] for k = 1, 2, .., 2N3 (3.20)
and E(n1, n2) is found by:
E(n1, n2) =
1 , xa(n1/2, n2/2) > T
0 , otherwise(3.21)
where T is a treshold used to determine the status of the pixel at (n1, n2) to
be on edge or not. In this case, the wavelet domain information is inherently
quantized to a single bit (or two levels). Higher quantization levels leading to
longer ht functions can be used. The joint-histogram defined in Equation 3.20
can be smoothed by using a low-pass filter.
3.5.2 Similarity Measure
Similarity measures used in CBIR systems are discussed in Section 3.2. In this
thesis, the Bhattacharya coefficient is used to measure the similarity between the
target and candidate histogram. The Bhattacharya coefficient is a divergence
type measure and has a simple geometric interpretation and used in mean-shift
track method by converting to distance to determine the convergence state. It is
simply the cosine of the angle between two unit vectors. The sample estimate of
the Bhattacharya coefficient between two histograms ht and hc is defined as
ρ =Nh∑
k=1
√ht[k]hc[k] (3.22)
where Nh is the size of histograms instead of N3 or 2N3. Because the size of the
histogram varies according to the use of the edge information. The maximum of
CHAPTER 3. MEAN-SHIFT TRACKING IN CBIR 40
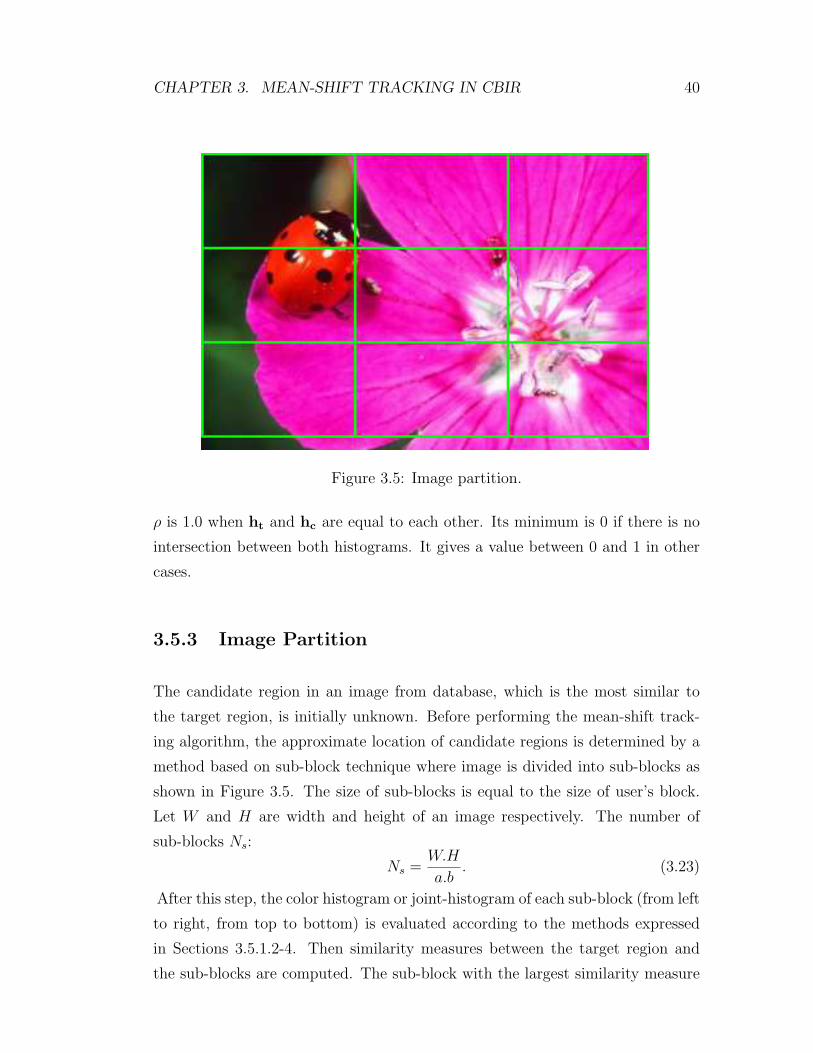
Figure 3.5: Image partition.
ρ is 1.0 when ht and hc are equal to each other. Its minimum is 0 if there is no
intersection between both histograms. It gives a value between 0 and 1 in other
cases.
3.5.3 Image Partition
The candidate region in an image from database, which is the most similar to
the target region, is initially unknown. Before performing the mean-shift track-
ing algorithm, the approximate location of candidate regions is determined by a
method based on sub-block technique where image is divided into sub-blocks as
shown in Figure 3.5. The size of sub-blocks is equal to the size of user’s block.
Let W and H are width and height of an image respectively. The number of
sub-blocks Ns:
Ns =W.H
a.b. (3.23)
After this step, the color histogram or joint-histogram of each sub-block (from left
to right, from top to bottom) is evaluated according to the methods expressed
in Sections 3.5.1.2-4. Then similarity measures between the target region and
the sub-blocks are computed. The sub-block with the largest similarity measure

CHAPTER 3. MEAN-SHIFT TRACKING IN CBIR 41
Figure 3.6: The sub-block with the highest similarity measure (blue rectangle).
as seen in Figure 3.6 is assumed as the approximate position of the candidate
region. The center coordinate (n1b, n2b) of this sub-block is passed to the mean-
shift tracking as an initial position.
3.5.4 Mean-Shift Tracking
The image partition generally gives the approximate location of candidate region
as depicted in Figure 3.6. However, its correct location is necessary to obtain
the similarity measure of correct region for database images. At this point, the
mean-shift tracking algorithm is an efficient and effective method to localize the
candidate region. The key point of the algorithm is to maximize the Bhattacharya
coefficient by using the color histograms in a iterative manner. In the proposed
CBIR method aims to maximize the similarity measure (the Bhattacharya coef-
ficient) for the candidate region as well. This is obviously achieved by iterating
the mean-shift method after the image partition.
The initial position for mean-shift tracking (n1b, n2b) is obtained by image par-
tition. The ht is already available from modelling of user interest. The following

CHAPTER 3. MEAN-SHIFT TRACKING IN CBIR 42
Figure 3.7: The localization of candidate region by mean-shift tracking algorithmafter image partition (red rectangle).
algorithm is iteratively processed to maximize the similarity measure:
1. Compute histogram for the location (n1b, n2b) using Equation 3.8 or 3.20.
2. Compute weights.
w[k] =
√√√√ht[k]
hc[k]for k = 1, 2, .., Nh. (3.24)
3. Derive new location of the candidate region.
n1n =
∑n2
∑n1
w[∆(n1, n2)].n1∑n2
∑n1
w[∆(n1, n2)], and
(3.25)
n2n =
∑n2
∑n1
w[∆(n1, n2)].n2∑n2
∑n1
w[∆(n1, n2)]
where ∆(n1, n2) is defined in Equation 3.9.
4. Stop if |n1b − n1n| = 0 and |n2b − n2n| = 0, else nn1 → n1b and n2n → n2b,
go to step 1.

CHAPTER 3. MEAN-SHIFT TRACKING IN CBIR 43
Table 3.1: Similarity measures for the most similar sub-block after image partitionand iterations of the mean-shift tracking algorithm.
Process SimilarityMeasure
Image Partition 0.43MS Iteration 1 0.46MS Iteration 2 0.47MS Iteration 3 0.48MS Iteration 4 0.48MS Iteration 5 0.48
The mean-shift tracking algorithm correctly localizes the candidate region as seen
Figure 3.7. From the practical experiences, the five iterations are sufficient for
the converge of the algorithm. The maximization process of the algorithm can
be seen in Table 3.1 in terms of similarity measure for the image partition and
five iterations of the algorithm. The location obtained by the mean-shift tracking
algorithm is used in the computation of similarity measure for the image from
database. Final similarity measure is input to rank the images in the database.
Top five images are always held in the ranking queue.
3.6 Experimental Results
In this section, experimental results of proposed retrieval system are given. A
software tool is developed in order to try the proposed system by using VC++ 6.0
as shown Figure 3.8. The system is based on query by example image. Therefore it
allows user to open an example image and select a region. The use of background
effect reduction and edge information is optional. It is also possible to filter
images having lower similarity measures by entering a treshold before searching.
Then a search in the database is started. The resultant images (top 5) matching
to the example image are displayed on the screen together with their similarity
measures as seen in Figure 3.8. Five image categories are tried to see the retrieving
performance of the proposed system in the database. The database includes

CHAPTER 3. MEAN-SHIFT TRACKING IN CBIR 44
Figure 3.8: The developed software to test image retrieving.
d
c a b
E
A B
Figure 3.9: Set representation of retrieving process.
images more than 200 images. The goal of the proposed method is not fast
retrieval so that the computational cost is not considered. The aim is to show
that the proposed method works properly.
In the CBIR systems, two metrics are used to evaluate the performance of
retrieval. Recall expresses the relevant images in the database which are retrieved
in the response to a user query. Precision is defined as the fraction of the retrieved
images that are indeed relevant to the query [43]. In Figure 3.9, a is the number
of retrieved relevant images, b is the number of retrieved irrelevant images, c is
the number of unretrieved relevant images and d is the number of unretrieved

CHAPTER 3. MEAN-SHIFT TRACKING IN CBIR 45
Table 3.2: Recall and Precision values for the example image categories.
Category Recall Precision
Beetle 1 1Flower 1 1Face 1 1Flag 0.4 0.4Bird 0.8 0.8
Table 3.3: The number of the relevant and irrelevant images in top five for theexample image categories.
Category Additional # of total # of retrieved # of retrievedhistogram relevant relevant irrelevantfeature image image image
Beetle None 5 5 0Flower None 5 5 0Face None 5 5 0Flag None 5 2 3Flag Background 5 4 1Bird None 5 4 1Bird Egde 5 5 0
irrelevant images. Recall and precision ratios are computed by:
Recall =a
a + c, (3.26)
and
Precision =a
a + b. (3.27)
The image retrieval is said to be effective if the precision values are higher at
the same recall values. However, recall and precision are only rough expression
of the performance of the retrieval system. Recall and precision values for the
example image categories without using additional feature in histogram are given
in Table 3.2. Table 3.3 gives the number of relevant and irrelevant images in top
five corresponding to each image category.

CHAPTER 3. MEAN-SHIFT TRACKING IN CBIR 46
In the first example image, a group of beetle images is used to test the retrieval
performance. All beetle images in the database are successfully retrieved with the
the straightforward color histogram for the target region as shown in Figure 3.10.
The same performance is obtained for flower and human face images as seen in
Figures 3.11 and 3.12, respectively.
In the fourth example, the images included the Turkish flag are searched in
database. The CBIR system using only histogram extraction shows low perfor-
mance. As seen in Figure 3.13, there are only two relevant flag images. The other
three ones are birds images and completely irrelevant images. The dominant col-
ors on flag is red and white. But, user’s rectangle in Figure 3.13-a contains a
significant amount of the background information. When the background reduc-
tion method is applied, the number of relevant image becomes 4 as shown in
Figure 3.14. As a result, an improvement for this category is provided by the
background reduction method described in Section 3.5.1.3.
The images in the database include the birds and they are searched in the last
example. The query region in this example is the head of a bird. Four images in
top 5 in Figure 3.15 are relevant and the last one is irrelevant. The color distribu-
tion of the bird head and the last retrieved image (especially walls) is close to each
other. The background reduction is not appropriate here since the weight of col-
ors characterizing the bird head is reduced because of its body. Therefore the use
of edge information in the color histogram is applied. Figure 3.16 demonstrates
the elimination of the irrelevant image by use of the edge information.

CHAPTER 3. MEAN-SHIFT TRACKING IN CBIR 47
(a) (b)
(c) (d)
(e) (f)
Figure 3.10: (a) Beetle example image with user interest. (b) Hit 1 with 0.99similarity measure. (b) Hit 2 with 0.40 of similarity measure. (c)-(f) Other hitswith 0.39, 0.30 and 0.29 respectively.

CHAPTER 3. MEAN-SHIFT TRACKING IN CBIR 48
(a) (b)
(c) (d)
(e) (f)
Figure 3.11: (a) Flower example image with user interest. (b) Hit 1 with 0.74similarity measure. (b) Hit 2 with 0.74 of similarity measure. (c)-(f) Other hitswith 0.54, 0.48 and 0.46 respectively.

CHAPTER 3. MEAN-SHIFT TRACKING IN CBIR 49
(a) (b)
(c) (d)
(e) (f)
Figure 3.12: (a) Human face example image with user interest. (b) Hit 1 with0.91 similarity measure. (b) Hit 2 with 0.90 of similarity measure. (c)-(f) Otherhits with 0.89, 0.88 and 0.79 respectively.

CHAPTER 3. MEAN-SHIFT TRACKING IN CBIR 50
(a) (b)
(c) (d)
(e) (f)
Figure 3.13: (a) Turkish flag example image with user interest. (b) Hit 1 with0.99 similarity measure. (b) Hit 2 with 0.40 of similarity measure. (c)-(f) Otherhits with 0.39, 0.30 and 0.29 respectively.

CHAPTER 3. MEAN-SHIFT TRACKING IN CBIR 51
(a) (b)
(c) (d)
(e) (f)
Figure 3.14: (a) Turkish flag example image with user interest. User interest ismodelled by background reduction. (b) Hit 1 with 0.67 similarity measure. (b)Hit 2 with 0.40 of similarity measure. (c)-(f) Other hits with 0.32, 0.31 and 0.31respectively.
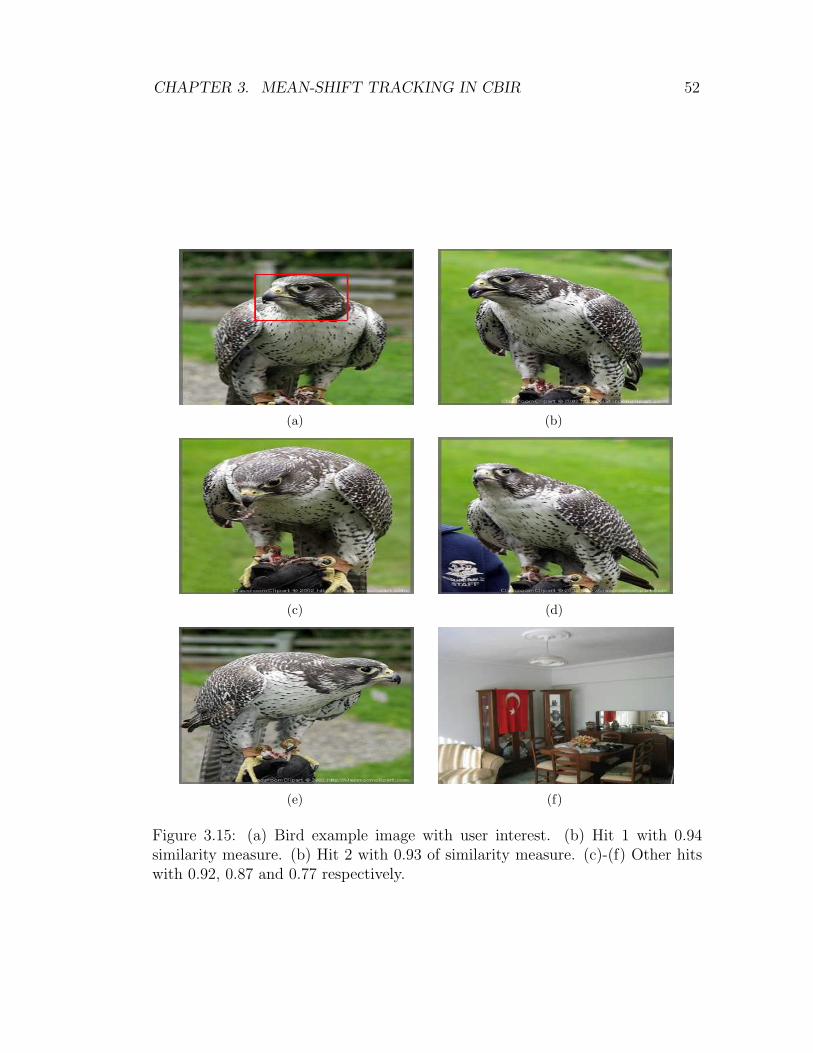
CHAPTER 3. MEAN-SHIFT TRACKING IN CBIR 52
(a) (b)
(c) (d)
(e) (f)
Figure 3.15: (a) Bird example image with user interest. (b) Hit 1 with 0.94similarity measure. (b) Hit 2 with 0.93 of similarity measure. (c)-(f) Other hitswith 0.92, 0.87 and 0.77 respectively.

CHAPTER 3. MEAN-SHIFT TRACKING IN CBIR 53
(a) (b)
(c) (d)
(e) (f)
Figure 3.16: (a) Bird example image with user interest. User interest includesedge information .(b) Hit 1 with 0.90 similarity measure (b) Hit 2 with 0.87 ofsimilarity measure. (c)-(f) Other hits with 0.86, 0.83 and 0.70 respectively.

Chapter 4
Conclusions
In this thesis, mean-shift method is applied to tracking of moving objects in FLIR
imagery and CBIR using multi-dimensional histograms. The first dimension of
the histogram is estimated from actual pixel values of image. The second di-
mension is extracted by using the high-pass filtered version of the image which is
related with wavelet transform of the image.
Experimental results clearly show the superior quality of the proposed tracker
using both the pixel information and the high-frequency information over the
ordinary mean-shift tracker using only pixel information. The same behavior is
observed in all the examples tried. Whenever the background is cluttered the
ordinary mean-shift tracker fails to track the moving object due to the lack of
information in gray scale histogram. In general, the histogram constructed from
the gray-level information of FLIR images is not sufficient to uniquely characterize
the object.
By including high-pass information to tracking process the robustness of the
tracker is improved against noise and cluttered background. Additional high-
pass information leads to a good characterization of the moving object by the
histogram in all the examples tried.
The computational cost of the proposed scheme is low. It consists of only
54

CHAPTER 4. CONCLUSIONS 55
an additional high-pass filtering operation and an increased size in histogram
construction. High-pass filtering operation may not be carried out over the entire
image. It is enough to perform high-pass filtering only around the moving object.
The second contribution of the thesis is a content-based image retrieval
method developed for queries based on especially region and object. The joint
color histogram is used to describe the region selected by user. In order to increase
the discriminative power of retrieving, the reduction of background information
and use of edge information in the histogram are considered. While searching
candidate region similar to the target region within an image from database, the
mean-shift tracking algorithm is used to localize that candidate region. A demon-
stration software is developed to test the proposed CBIR method. The software
gives top five images matching to the query image.
The proposed CBIR method is tested for five category images in the database.
The three categories of them are successfully retrieved. The proposed system
shows low performance for other two categories. However, by reducing the back-
ground information on the joint color histogram and forcing the edge information
into the joint color histogram, the retrieval performance of the system is increased.
There are two observed reasons affecting the retrieval performance of a CBIR
system from the experiments. The first one is the quality of the example image.
Therefore, it is useful to use query images that have good visual quality and view
angle in order to obtain an effective model of the selected region. The second
one is the size of the region specified by user. Since the query of the proposed
method is based on region or object, it may fail to retrieve the images including
the similar regions or objects whose sizes are much smaller or larger than the
size of the region drawn by the user. Although the mean-shift has the ability
to update the search window size adaptively, there are practical implementation
problems.
In fact the computational cost of the proposed scheme is not considered dur-
ing this study. However, use of the mean-shift tracking in localization of the
candidate region increases the retrieving speed when compared to the traditional
methods. Therefore, the computational bottleneck of the proposed method is

CHAPTER 4. CONCLUSIONS 56
histogram extraction. A fast histogram computation technique drastically speeds
up the retrieval process. The background reduction method from the color his-
togram does not increase the retrieval time as it is applied to only query image
while modelling the target region. But use of the edge information consumes
the processing power because of extracting wavelet coefficients for each image
in the database. The demonstration system is not computationally optimized.
Implementation issues are left as a future work.
Bibliography
[1] D. Comaniciu, P. Meer, “Mean Shift Analysis and Applications,” IEEE Int’l
Conf. Comp. Vis., Kerkyra, Greece, pp. 1197-1203, 1999.
[2] D. Comaniciu, V. Ramesh, and P. Meer,“Real-Time Tracking of Non-Rigid
Objects Using Mean Shift,” Proc. IEEE Conf. Computer Vision and Pattern
Recognition, Vol. II, pp. 142-149, June 2000.
[3] D. Comanicu, P. Meer, “Mean shift: A robust approach toward feature space
analysis,” IEEE Trans. Pattern Anal. Machine Intell., Vol. 24, pp. 603-619,
May 2002.
[4] D. Comaniciu, et al., “Real-Time Tracking of Non-Rigid Objects Using Mean
Shift”, US patent pending, 2000.
[5] Dorin Comaniciu, Visvanathan Ramesh, and Peter Meer, “Kernel-Based Ob-
ject Tracking,” IEEE Trans. on Pattern Anal. and Machine Intelligence, Vol.
25, No. 5, pp. 564-579, May 2003.
[6] M. Isard and A. Blake, “Condensation-Conditional density propagation for
visual tracking,” Intl. J. of Computer Vision, Vol. 28(1), No. 1, pp. 5-28,
1998.
[7] A. Yilmaz, K. Shafique, N. Lobo, X. Li, T. Olson, and M. Shah, “Target
Tracking in FLIR Imagery Using Mean Shift and Global Motion Compensa-
tion,” IEEE Workshop on Computer Vision Beyond Visible Spectrum, 2001.
57

BIBLIOGRAPHY 58
[8] A.Yilmaz, K .Shafique, and Mubarak Shah, “Target Tracking in Airborne
Forward Looking Infrared Imagery,”Journal of Image and Vision Computing,
Vol. 21, No. 7, pp. 623-635, 2003.
[9] Murat Bagci, Yasemin Yardimci, A. Enis Cetin, “Moving object detection
using adaptive subband decomposition and fractional lower order statistics in
video sequences,” Signal Processing, Elsevier, Vol. 82, pp. 1941-1947, 2002.
[10] F.M. Porikli, O. Tuzel, “Fast Object Tracking by Adaptive Background Mod-
els and Mean-Shift Analysis”, International Conference On Computer Vision
Systems (ICVS), April 2003.
[11] M.D. Flickner, I. Haritaoglu, “Method of detecting and tracking groups of
people”, US Patent application, No. 0107649 June 12, 2003.
[12] Halil I. Cuce and A. Enis Cetin, “Mean-shift tracking of moving objects using
multidimensional histograms,” Proc. SPIE Int. Soc. Opt. Eng., Vol. 5428, pp.
70-77, 2004.
[13] Selim Aksoy, Robert M. Haralick, “Textural Features for Image Database
Retrieval,” IEEE Workshop on Content-Based Access of Image and Video
Libraries, pp. 45-49, Santa Barbara, CA, June 21, 1998.
[14] Selim Aksoy, Robert M. Haralick, “Content-Based Image Database Retrieval
Using Variances of Gray Level Spatial Dependencies,” IAPR International
Workshop on Multimedia Information Analysis and Retrieval, pp. 3-19, Hong
Kong, August 13-14, 1998.
[15] Ediz Saykol, Ugur Gudukbay, Ozgur Ulusoy, “Integrated Querying of Images
by Color, Shape, and Texture Content of Salient Objects,” Lecture Notes in
Computer Science (LNCS), Vol. 3261, pp. 363-371, 2004.
[16] Y. Rubner, C. Tomasi, and L. Guibas, “A Metric for Distributions with Ap-
plications to Image Databases,” IEEE Proceedings of the International Con-
ference On Computer Vision, pp. 59-66, 1998.

BIBLIOGRAPHY 59
[17] B. Funt and G. Finlayson, “Color Constant Color Indexing,” IEEE Trans-
actions on Pattern Analysis and Machine Intelligence, 17(5), pp. 522-529,
1995.
[18] T. Gevers and W. M. Smeulders, “Color-based Object Recognition,” Pattern
Recognition, 32(3), pp. 453-464, 1999.
[19] R. J. Smith and S.-F. Chang, “Integrated Spatial and Feature Image Query,”
Multimedia Systems, 7(2), pp. 129-140, 1999.
[20] K. Nagao and W. Grimson, “Using Photometric Invariants for 3D Object
Recognition,” Computer Vision and Image Understanding, 71(1) pp. 74-93,
July 1998.
[21] S. Nayar and R. Bolle, “Reflectance Based Object Recognition,” Interna-
tional Journal of Computer Vision, 17(3), pp. 219-240, 1996.
[22] Charles E. Jacobs, Adam Finkelstein, David H. Salesin, “Fast Multiresolu-
tion Image Querying,” Proceedings of SIGGRAPH 95, in Computer Graphics
Proceedings, Annual Conference Series, pp. 277-286, August 1995.
[23] D. Koubaroulis, J. Matas, and J. Kitler, “Colour-based Image Retrevial from
Video Sequences,” Challenge of Image Retrevial, Brighton, 2000.
[24] A. E. Cawkill, “The British Library’s Picture Research Projects: Image,
Word, and Retrieval,” Advanced Imaging, Vol. 8, No. 10, pp. 38-40, October
1993.
[25] J. Dowe, “Content-based retrieval in multimedia imaging,” In Proc. SPIE
Storage and Retrieval for Image and Video Database, 1993.
[26] C. Faloutsos et al, “Efficient and effective querying by image content,” Jour-
nal of intelligent information systems, Vol. 3, pp. 231-262, 1994.
[27] Y. Gong, H. J. Zhang, and T. C. Chua, “An image database system with
content capturing and fast image indexing abilities,” Proc. IEEE Interna-
tional Conference on Multimedia Computing and Systems, Boston, pp. 121-
130, 1994.

BIBLIOGRAPHY 60
[28] H. J. Zhang, and D. Zhong, “A scheme for visual feature-based image in-
dexing,” Proc. of SPIE conf. on Storage and Retrieval for Image and Video
Databases III, pp. 36-46, San Jose, 1995.
[29] A. K. Jain, Fundamental of Digital Image Processing, Englewood Cliffs,
Prentice Hall, 1989.
[30] M. Stricker, and M. Orengo, “Similarity of color images,” SPIE Storage and
Retrieval for Image and Video Databases III, vol. 2185, pp.381-392, Feb. 1995.
[31] Y. Gong, H. J. Zhang, and T. C. Chua, “An image database system with
content capturing and fast image indexing abilities”, Proc. IEEE International
Conference on Multimedia Computing and Systems, Boston, pp.121-130, 1994.
[32] G.Pass, and R. Zabith, “Comparing images using joint histograms,” Multi-
media Systems, Vol .7, pp. 234-240, 1999.
[33] G. Pass, and R. Zabith, “Histogram refinement for content-based image re-
trieval,” IEEE Workshop on Applications of Computer Vision, pp. 96-102,
1996.
[34] J. Huang, et al., “Image indexing using color correlogram,” IEEE Int. Conf.
on Computer Vision and Pattern Recognition, pp. 762-768, Puerto Rico, June
1997.
[35] J. E. Gary, and R. Mehrotra, “Shape similarity-based retrieval in image
database systems,” Proc. of SPIE, Image Storage and Retrieval Systemes,
Vol. 1662 pp. 2-8, 1992
[36] G. D. Finlayson, “Color in perspective,” IEEE Trans on Pattern Analysis
and Machine Intelligence, Vol.8, No. 10, pp.1034-1038, Oct. 1996.
[37] S. K. Chang, Q. Y. Shi, and C. Y. Yan, “Iconic indexing by 2-D strings,”
IEEE Trans. on Pattern Anal. Machine Intell., Vol. 9, No. 3, pp. 413-428,
May 1987.
[38] H. Samet, “The quadtree and related hierarchical data structures,” ACM
Computing Surveys, Vol. 16, No. 2, pp. 187-260, 1984.

BIBLIOGRAPHY 61
[39] V. N. Gudivada, and V. V. Raghavan, “Design and evaluation of algorithms
for image retrieval by spatial similarity,” ACM Trans. on Information Sys-
tems, Vol. 13, No. 2, pp. 115-144, April 1995.
[40] M. Wand, and M. Jones, Kernel Smoothing, Chapman & Hall, 1995.
[41] B.G. Prasad, K.K. Biswas, and S.K. Gupta, “Region-based image retrieval
using integrated color, shape, and location index,” ELSEVIER Computer
Vision and Image Understanding, Vol. 94, pp. 193-233, 2004.
[42] C. W. Kim, R. Ansari and A. E. Cetin, “A class of linear-phase regular
biorthogonal wavelets,” IEEE International Conference on Acoust., Speech,
and Signal Processing (ICASSP’92), Vol. 4, pp. 673-676, San Francisco, USA,
March 1992.
[43] A. M. W. Smeulders, M. Worring, S. Santini, A. Gupta, and R. Jain,
“Content-based image retrieval at the end of the early years,” IEEE Trans.
on Pattern Analysis and Machine Intelligence, Vol. 22, No. 12, pp. 1349-1380,
2000.


![Deep Mean-Shift Priors for Image Restorationpapers.nips.cc/paper/6678-deep-mean-shift-priors... · to the mean-shift vector [8], and it has recently been shown that denoising autoencoders](https://img.dokumen.tips/doc/110x75/5eb672e5dcf8565d963f6c77/deep-mean-shift-priors-for-image-to-the-mean-shift-vector-8-and-it-has-recently.jpg)