Embed Size (px)
Citation preview

Mean-Reversion of Share Prices of South Asian Emerging Stock Markets
Guneratne B Wickremasinghe* School of Accounting and Finance
Victoria University PO Box 14428
Melbourne Victoria 8001
Australia
Key words: Random Walk Hypothesis, Emerging Stock Markets
Preliminary: Do not quote without permission
* Tel: 613-9919 1477, email: [email protected]

1
Mean-Reversion of Share Prices of South Asian Emerging Stock Markets
Abstract
This paper investigates the empirical validity of the weak form of the Efficient Market Hypothesis (EMH) for four emerging stock markets in South Asia. As opposed to econometric techniques widely used in previous studies to examine this issue, we employ univariate unit root tests that have better power and size properties than widely used ADF-type unit root tests as well as panel unit root tests. Our results indicate that panel unit root tests strongly support the validity of the EMH for the South Asian emerging stock markets although the univariate unit root tests provide mixed results. These results are attributed to the low power of univariate unit root tests to recognise the true data generating processes of economic variables. The implications of the results are that stock market participants cannot devise any trading rule to beat the stock markets in the South Asian region on a consistent basis.

2
Mean-Reversion of Share Prices of South Asian Emerging Stock Markets
1. Introduction
Efficiency of financial markets has received enormous attention since the publication of
Fama’s (1965) seminal paper. Most of the studies examining this concept were initially
carried out using data from the developed stock markets (see for example, Kendall
(1953), Granger and Morgenstern (1964) and Sharma and Kennedy (1977)). However,
there have been studies addressing this issue in relation to emerging markets since
recently. This has been partly because of the increased importance of emerging stock
markets in international security portfolios.
The EMH has three forms (Fama, 1965): the weak, semi-strong and strong form. Each
version reflects a different degree of information in the prices of financial assets. The
weak version of the EMH asserts that the prices of financial assets reflect all the
information contained in past prices. Therefore, no person can use past data on the prices
of financial assets to predict the future values of such assets. In other words, the prices of
financial assets behave randomly, or without any identifiable pattern.
On the other hand, the semi-strong version of the EMH says that the prices of
financial assets reflect all publicly available information. In the case of stock prices,
publicly available information would include, for example, information releases on
dividend, bonus and rights issue announcements and announcements related to
macroeconomic variables such as interest rates, inflation and exchange rates. Since stock
3
prices are expected to rapidly adjust to releases of such information, no person can use
publicly available information to predict the movements of stock prices and earn
abnormal returns on a consistent basis.
The strong form of the EMH indicates that the prices of financial assets reflect, in
addition to the information contained in past prices and publicly available information,
inside information. Therefore, even a director of a company cannot use his or her
knowledge of inside information to predict future values of share prices. This version of
the EMH encompasses both the weak and semi-strong versions. The main objective of
this paper is to investigate the weak form of the efficient market hypothesis in relation to
the emerging stock markets of South Asia.
This paper is organised as follows. The next section provides a brief overview of the
empirical studies on the weak form of the efficient market hypothesis. The third section
outlines the methodology and data used. The fourth section provides an analysis of
empirical results. The last section concludes the paper.
2. Empirical tests of the EMH
Since the publication of Fama’s pioneering work on the EMH, stock markets,
especially those in developed countries, have been extensively subjected to tests of
efficiency using different econometric techniques. These techniques have mainly been
aimed at determining whether (a) stock prices behave as a random walk, (b) the stock
market reaction to various company-specific and economic information releases, (c) there
are cointegrating relationships among several stock prices and (d) there are cointegrating

4
relationships between stock prices and macroeconomic variables. The first type of tests
can be categorised as weak-form efficiency tests whereas the second and third type of
tests can be categorised as semi-strong form efficiency tests. Empirical studies using
these different methodologies have provided mixed evidence. In the following sections,
we limit our discussion to review empirical studies that have tested the weak form of the
EMH.
There is a plethora of studies that have tested the weak-form efficiency both of developed
and developing share markets. These studies started in the 1960s with the publication of
Fama's seminal paper on the behaviour of share prices that supported the applicability of
the random walk hypothesis to New York Stock Exchange. Later studies conducted by
Granger and Morgenstern (1963), Godfrey, Granger and Morgenstern (1964) and Sharma
and Kennedy (1977) also produced results similar to those of Fama. Kendall (1953)
studied the behaviour of British weekly share prices and found results that are similar to
results of the above studies, i.e. share prices were serially independent or follow random
walks. Cooper (1982) using data from 50 countries and a sample of 114 shares obtained
results consistent with random walk hypothesis for the New York and London Stock
Markets. However, a study conducted by Dryden (1970) and Leemp and Reid (1971)
found that the British share market was not weak form efficient. Studies conducted in
relation to small stock markets have produced results that do not support the weak form
efficiency of such markets. These studies include those conducted by Conrad and Juttner
(1973) using German Share Prices, Theil and Leenders (1965) using share prices from the
Netherlands, and Jennergren and Korsvold (1975) using data from Norwegian and
Swedish markets. In addition, the studies conducted in the Far East have produced

5
similar results. These studies include those conducted by Praetz (1969) using Australian
data Law (1982) and Wong and Kwong (1984) using data from Hong Kong,
Sareewiwathana and Isbell (1985) on the Thai Stock Market, Saw and Tan (1986) using
Singaporian data and Othman (1989, 1990) and Mansor (1989) using Malaysian data.
To the knowledge of the author, there have been five published studies testing the
applicability of the efficient market hypothesis in its weak-form to the Sri Lankan share
market. A study conducted by Abeyratna and Power (1995) using daily data for 20
companies for a 16-month period obtained results that were consistent with the weak
form efficiency. Samarakoon (1996) examined the predictability of short-horizon returns
of the Colombo Stock Exchange (CSE) using data for All Share Price Index, Sensitive
Price index and indices for the 14 sectors for the period 1985 to 1995. Using daily,
weekly and monthly returns, he concluded that the random walk model of stock returns
does not apply to stock indices and most of the sector indices. Another study by Hasan et
al. (2000) using data for All Share Price Index and Sensitive Price Index of the CSE for
the period 1985 to 1995 has concluded that the weak form of the Efficient Market
Hypothesis is not applicable to the CSE. Abeysekera (2001) examined the validity of the
weak form of the EMH to the CSE using data on daily, weekly and monthly returns of
stock indices for the period January 1991 through November 1996. The indices used
consisted of the Sensitive Index of the Colombo Stock Exchange and a 40-security value-
weighted index, adjusted for dividends, splits, rights and bonuses. The results of this
study indicated that the stocks listed on the CSE do not follow a random walk hypothesis

6
refuting the validity of the weak form of the EMH. Further, this study found that day-of-
the-week effect and month-of-the-year effect are absent on the CSE.
There have been only four studies testing the weak form of the efficient market
hypothesis to the Dhaka Stock Exchange (DSE). Alam et al. (1999) used a variance ratio
test and reported that the monthly stock prices of the DSE followed a random walk.
Mobarek and Keasey (2002) who used runs and autocorrelation tests to daily share price
indices found results inconsistent with the random walk hypothesis. Hasan (2004) used a
battery of tests to examine the random walk variance of the EMH using data of the DSE.
The results of random walk model and unit root tests showed that stock prices of the DSE
have a significant random walk component. The analysis of autocorrelation functions
indicated mean-reversion behaviour of stock returns in most cases. This study also found
significant asymmetric and leverage effects during the sub-period of speculative bubbles
of 1996-1997. The BDS test found evidence of nonlinear long-term dependence during
the pre-speculation period, while during the speculation and post speculation periods the
null hypothesis of nonlinear independence was not rejected. Islam and Khaled (2005)
used two techniques to test the weak form of the EMH, Augmented Dickey-Fuller test
and a variance ratio test. They further examined whether their findings were robust to
structural changes that may have occurred since the market crash of 1996. Using daily,
weekly and monthly data they found that conflicting evidence reported by previous
studies resulted from the use of data at different frequencies, structural changes from pre-
boom to pre-crash period and from the use of tests with and without heteroskedasticity
adjustment.

7
Gunasekarage and Power (2001) studied the performance of technical trading
rules in South Asian emerging stock markets (Bombay, Colombo, Dhaka and Karachi).
They found that returns earned from studying moving average values are equal to those
achieved from a naïve buy and hold strategy providing excess returns to investors in these
markets. These results refute the validity of the weak form of the EMH. Chakraborty
(2006) investigated the weak-form efficiency of the Pakistan stock market using daily
data for Karachi Stock Exchange (KSE). The serial correlation and runs test applied in
this study rejected the random walk hypothesis for KSE for the whole sample period as
well as for both the sample periods. The variance ratio test also rejected the random walk
hypothesis for the full sample period and the first sub-sample period. For the second sub-
sample period while homoscedasticity-consistent test statistics are significant, the
heterocedasticity-consistent test statistics were not significant for some lags. The above
results indicate that the data are autocorrelated and heterocedastic. These results refute
the validity of the weak-form of the EMH to the KSE.
3. Methodology and Data
The econometric methodologies adopted in this paper are more powerful and robust than
those employed in the previous studies detailed in Section 2. Elliot et al. (1996) pointed
out that, when a time series has an unknown mean or linear trend and the sample size is
small, the conventional unit root test such as the augmented Dickey-Fuller test suffers
from low power. To overcome this problem, they proposed a point optimal test, which
substantially improves the power when an unknown mean or trend is present in a time
series. Ng and Perron (2001) also noted that the ADF test suffers from low power,

8
especially when the moving-average polynomial of the first differenced series has a large
negative root. In response to this, Ng and Perron (2001) proposed new tests with
improved small sample properties.
Another way of improving the power of unit root testing is the use of panel data. By
pooling the observations from different cross-sectional units, the test can enjoy a larger
number of sample sizes, which can give rise to a higher power (see, for example,
Maddala and Wu, 1999). In this paper, we also use a number of panel unit root tests.
Ng-Perron tests
Ng and Perron (2001) constructed four unit root test statistics that are calculated
using generalized least squares (GLS) de-trended data for a variable. Compared to the
widely-used Dickey-Fuller (DF) and Phillips-Perron (PP) unit root tests, these have better
power and size properties. The first unit root test statistic developed by Ng and Perron
calculates the Elliot, Rothenberg, and Stock (ERS) point optimal statistic for GLS de-
trended data as follows:
=−+
=−=
−
−
},1{ xif /))()1((}1{ xif /))(c(
t0212
t0212
k
tfyTccfyTc
MPdTk
dTd
T (1)
where ∑=
−=T
t
dt Tyk
2
221 /)( ,
=−=
=},1{ xif 13.5
}1{ xif 7-
t
t
tc , 0f is the zero frequency
spectrum term, and dTy is the generalized least squares (GLS) de-trended value of the
variable.
9
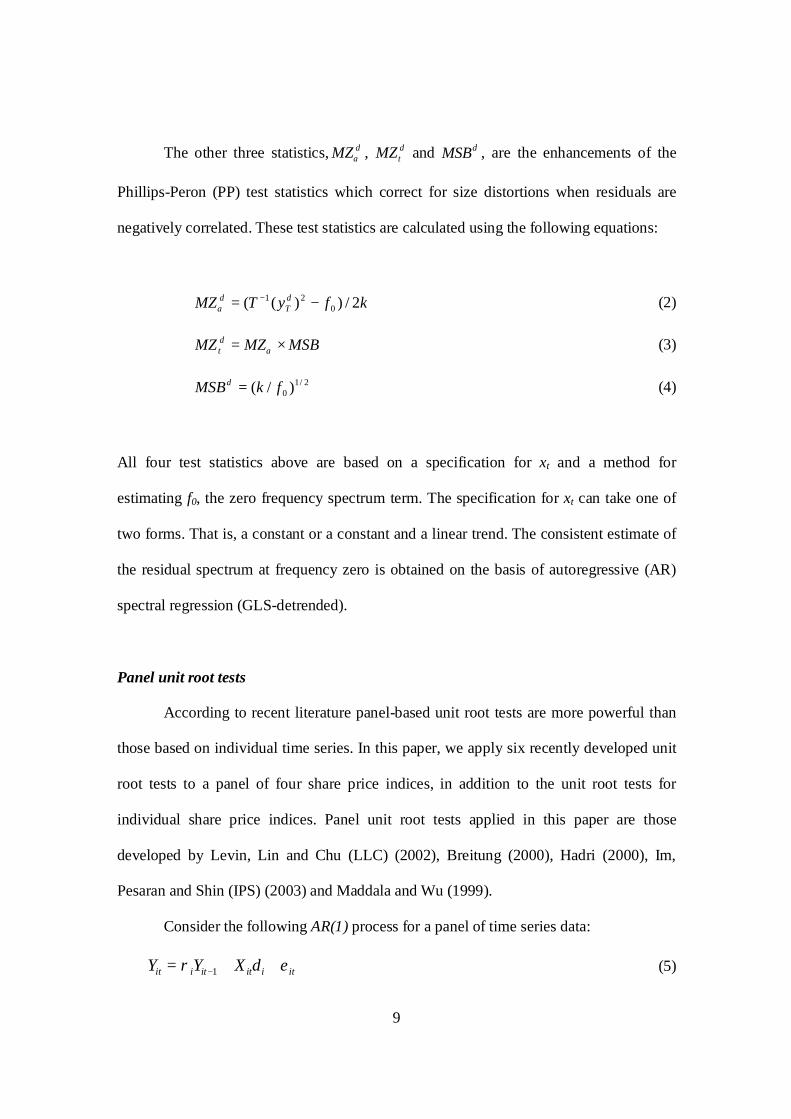
The other three statistics, dMZα , dtMZ and dMSB , are the enhancements of the
Phillips-Peron (PP) test statistics which correct for size distortions when residuals are
negatively correlated. These test statistics are calculated using the following equations:
kfyTMZ dT
d 2/))(( 021 −= −
α (2)
MSBMZMZ dt ×= α (3)
2/10 )/( fkMSBd = (4)
All four test statistics above are based on a specification for xt and a method for
estimating f0, the zero frequency spectrum term. The specification for xt can take one of
two forms. That is, a constant or a constant and a linear trend. The consistent estimate of
the residual spectrum at frequency zero is obtained on the basis of autoregressive (AR)
spectral regression (GLS-detrended).
Panel unit root tests
According to recent literature panel-based unit root tests are more powerful than
those based on individual time series. In this paper, we apply six recently developed unit
root tests to a panel of four share price indices, in addition to the unit root tests for
individual share price indices. Panel unit root tests applied in this paper are those
developed by Levin, Lin and Chu (LLC) (2002), Breitung (2000), Hadri (2000), Im,
Pesaran and Shin (IPS) (2003) and Maddala and Wu (1999).
Consider the following AR(1) process for a panel of time series data:
1it i it it i itY Y Xρ δ ε−= + + (5)

10
where i = 1, 2, …, N cross-sections and t = 1, 2, …, Ti time periods. The Xit denote the
exogenous variables including any fixed effects or individual trends, ρi are the
autoregressive coefficients and the εit are assumed to be mutually independent
idiosyncratic errors. A unit root is present in the panel of time series if |ρi| =1. In a test for
a unit root, normally, there are two assumptions regarding ρi. First, we can assume that ρi
= ρ for all cross-sections. The panel unit root tests in which this assumption is made are
known as tests with common unit root processes. Second, we can assume that ρi vary
freely across cross-sections. The panel unit root tests in which this assumption is made
are known as tests with individual unit root processes. Levin, Lin and Chu (2002),
Breitung (2000) and Hadri (2000) make the first assumption in their unit root tests. Im,
Pesaran and Shin (2003) and Maddala and Wu (1999) make the second assumption in
their Fisher- ADF and Fisher-PP unit root tests. Each of these tests is briefly discussed
below.
Tests with common unit root processes
The LLC and Breitung tests use a version of the basic ADF equation:
11
ip
it it ij it j it itj
y y y Xα β δ ε− −=
∆ = + ∆ + +∑ (6)
LLC and Breitung assume a common 1α ρ= − . However, they allow lag orders for the
difference terms to vary across cross-sections. The null hypothesis that the time series
have a unit is 0α = which is tested against the alternative hypothesis that there is no unit
root 0α < .

11
In the LLC method, the estimates of α are obtained from proxies for ity∆ and
ity that are standardised and free of autocorrelations and deterministic components (see,
Levin, Lin and Chu, 2002 for details on obtaining proxies). After obtaining proxies for
ity∆ and ity , α can be obtained from the following pooled proxy equation:
1it it ity yα η−∆ = +% % (7)
LLC obtain the following modified t-statistic for the estimated α which is normally
distributed under the null:
*
*
2* ˆˆ( ) ( )
(0,1)N mT
mT
t NT S set Nαα
σ α µ
σ
−−= →
% (8)
where tα is the standard t-statistic for ˆ 0α = , 2σ̂ is the estimated variance of the error
term η , ˆ( )se σ is the standard error of σ̂ . The value of T% is obtained as follows:
( / ) 1ii
T T P N= − −∑% (9)
NS is the average standard deviation ratio which is the mean of the ratios of the long-run
standard deviation to the innovation standard deviation for each individual. *mTµ and
*mTσ are the adjustment terms for the mean and standard deviation respectively. iP is the
number of lags used in each cross section equation. Where NS is calculated using kernel
based techniques, we can perform the LLC test with no exogenous regressors, with
individual constant terms (fixed effects) or individual constants and trends.

12
The Breitung unit root test differs from the LLC method in two ways. First, as opposed to
LLC method, it removes only the autoregressive component in constructing proxies for
for ity∆ and ity . Second, the proxies for ity∆ and ity are transformed and detrended (see,
Breitung (2000), for details). Then the persistence parameter, α , is estimated from the
following pooled proxy equation:
* *1 itit ity y vα−
∆ = + (10)
where itv is the whitenoise error term and the other symbols are as defined elsewhere.
Breitung proves that under the null (of a unit root), the estimate of *α is asymptotically
distributed as standard normal. In the Breitung test, we have to specify only the number
of lags in the ADF equations and the exogenous regressors. The exogenous regressors
may include no exogenous regressors, individual constant terms (fixed effects) or
individual constants or trends. We do not need any kernel computations in the Breitung
test as in the case of LLC test.
Hadri’s panel unit root test is similar to the KPSS test in that it has a null hypothesis of no
unit root in any of the series in the panel. As in the case of the KPSS test, Hadri’s test is
based on the ordinary least squares residuals of the individual series in the panel on a
constant or constant and a time trend. Using the residuals from OLS regressions for
individual series in the panel, we can compute the LM statistic as follows:
2 21 01
1 ( ( ) / /Nii
t
LM S t T fN =
= ∑ ∑ (11)

13
where ( )iS t are the cumulative sum of residuals and 0f is the average of individual
estimators of the residual spectrum at frequency zero. Hadri also provides an alternative
LM statistics that allows for hereskedasticity across cross sections:
2 22 01
1 ( ( ) / /Ni ii
t
LM S t T fN =
= ∑ ∑ (12)
Hadri proves that under mild assumptions,
( (0,1)N LMZ Nξζ
−= → (13)
where ξ =1/6 and ζ = 1/45 , when only constants are included in the model and ξ =1/15
and ζ = 11/6300 if both a constant and a time trend are included in the model.
Tests with individual unit root processes
In these tests we assume that iρ varies across cross-sections. Therefore, tests are
performed by combining individual unit root tests to derive their panel counterparts. Im,
Pesaran and Shin base their panel unit root test on a separate ADF test for each cross-
section in the panel. Then the average of the t-statistics of individual ADF statistics are
adjusted to obtain the unit root test statistic for the panel, NTt . IPS provide simulated
critical values for different numbers of cross-sections and series lengths when the lag
order of the ADF equations is zero. When the lag order for some cross-sections in the
panel is non-zero, IPS show that a properly standardised NTt follows an asymptotic
standard normal distribution. The new test statistic denoted by NTtW is computed as
follows:

14
1
1
1
1
( ( ))
( ( ))NT
N
NT iT ii
t N
iT ii
N t N E t PW
N Var t P
−
=
−
=
− =
∑
∑ (14)
where ( ( )iT iE t p and ( ( ))iT iVar t p are expressions for the mean and variance of the ADF
regression t-statistics. IPS provide these expressions for various values of T and P and
differing test equation assumptions.
Maddala, Wu and Choi have proposed an approach that uses Fisher’s (1932)
results to derive tests that combine p-values from unit root tests of individual series in the
cross-section. Let iπ be the p-value for any individual unit root test for cross-section i.
Then under the null of a unit root for all cross-sections, we can obtain the asymptotic
result that
22
1
2 log( )N
i Ni
π χ=
− →∑ (15)
Further, Choi proves that:
1
1
1 ( ) (0,1)N
ii
Z NN
π−
=
= Φ →∑ (16)
where 1−Φ is the inverse of the standard normal cumulative distribution function.
The data set used in this paper consists of monthly stock market indices for India,
Sri Lanka, Pakistan and Bangladesh. The stock indices used are the FTSE for India and
Pakistan, the All Share Index for Sri Lanka and the S&P for Bangladesh. The data used
are monthly and covers the period January 1996 to October 2003. All data series are
obtained from DATASTREAM. In order to obtain a better understanding of the data,
15
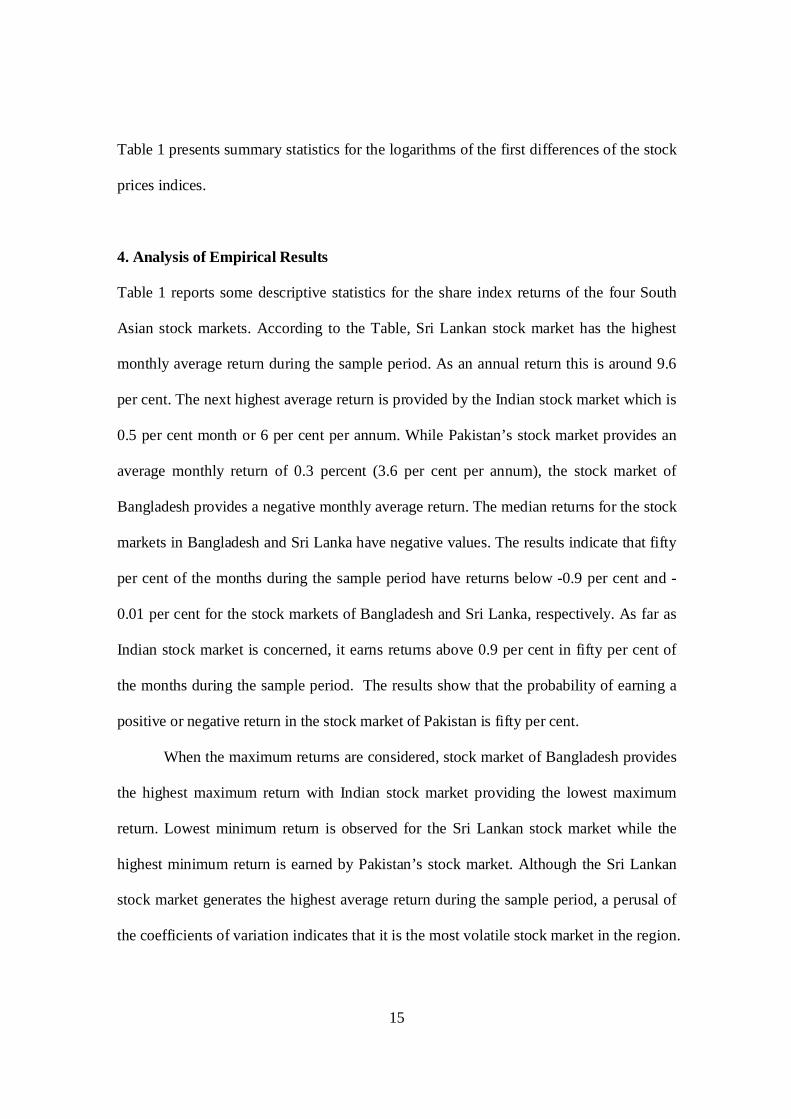
Table 1 presents summary statistics for the logarithms of the first differences of the stock
prices indices.
4. Analysis of Empirical Results
Table 1 reports some descriptive statistics for the share index returns of the four South
Asian stock markets. According to the Table, Sri Lankan stock market has the highest
monthly average return during the sample period. As an annual return this is around 9.6
per cent. The next highest average return is provided by the Indian stock market which is
0.5 per cent month or 6 per cent per annum. While Pakistan’s stock market provides an
average monthly return of 0.3 percent (3.6 per cent per annum), the stock market of
Bangladesh provides a negative monthly average return. The median returns for the stock
markets in Bangladesh and Sri Lanka have negative values. The results indicate that fifty
per cent of the months during the sample period have returns below -0.9 per cent and -
0.01 per cent for the stock markets of Bangladesh and Sri Lanka, respectively. As far as
Indian stock market is concerned, it earns returns above 0.9 per cent in fifty per cent of
the months during the sample period. The results show that the probability of earning a
positive or negative return in the stock market of Pakistan is fifty per cent.
When the maximum returns are considered, stock market of Bangladesh provides
the highest maximum return with Indian stock market providing the lowest maximum
return. Lowest minimum return is observed for the Sri Lankan stock market while the
highest minimum return is earned by Pakistan’s stock market. Although the Sri Lankan
stock market generates the highest average return during the sample period, a perusal of
the coefficients of variation indicates that it is the most volatile stock market in the region.

16
A comparison of skewness and kurtosis indicates that the impact of kurtosis is higher
than that of skewness on the distribution of stock returns. As a result, the behaviour of
stock returns of Bangladesh and Pakistan is non-normal.
In addition to applying unit root tests to examine behavioural properties of stock
prices, we also use two traditional techniques, the autocorrelation test and the LJung-Box
Q-statistic. The results of the autocorrelation test are shown in Table 2 for selected lags.
According to the results, only the first order autocorrelation coefficient for the stock
market of Bangladesh is statistically significant. This indicates that current period’s stock
returns can be predicted by previous period’s stock return. This result is not consistent
with the weak-form of the efficient market hypothesis.
Table 3 reports the results of the Q-statistic test. These results are reported only
for selected lags. According to the results, Q-statistics for lags one and twelve are
statistically significant at the one per cent level for the Bangladesh stock market. These
results again indicate that the weak-form of the efficient market hypothesis is violated for
this stock market.
Insert Table 4 about here
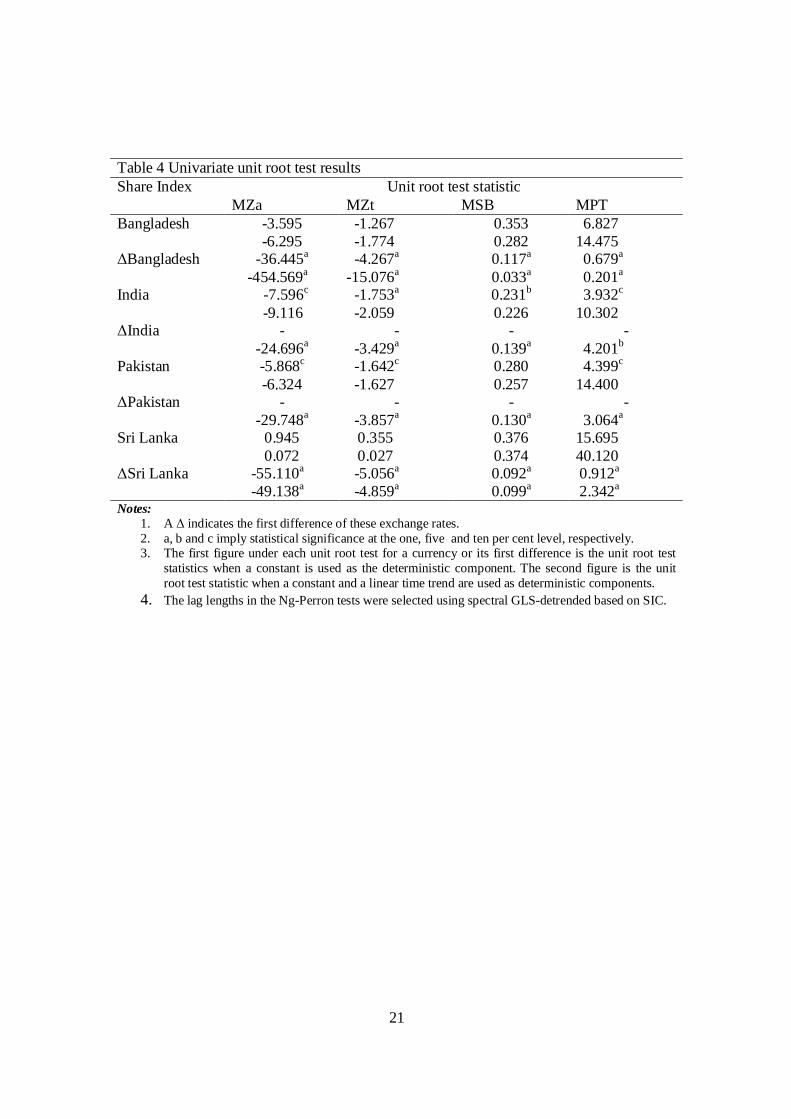
The univariate unit root test results are reported in Table 4. According to the
results, share prices of the four stock markets behave as random walks. These results are
consistent with the weak form of the EMH that says that share prices behave in an
unpredictable manner or follow a random walk behaviour. As share prices behave as
random walks, investors cannot devise any trading rule to beat the south Asian markets
on a consistent basis. Therefore, local as well as international investors have to be
cautious when making decisions to invest in these emerging stock markets. However, this

17
is not conclusive evidence as to the predictability of share prices of these markets as past
literature has pointed out that efficiency test results are sensitive to frequency of data and
the techniques used.
Insert Table 5 about here
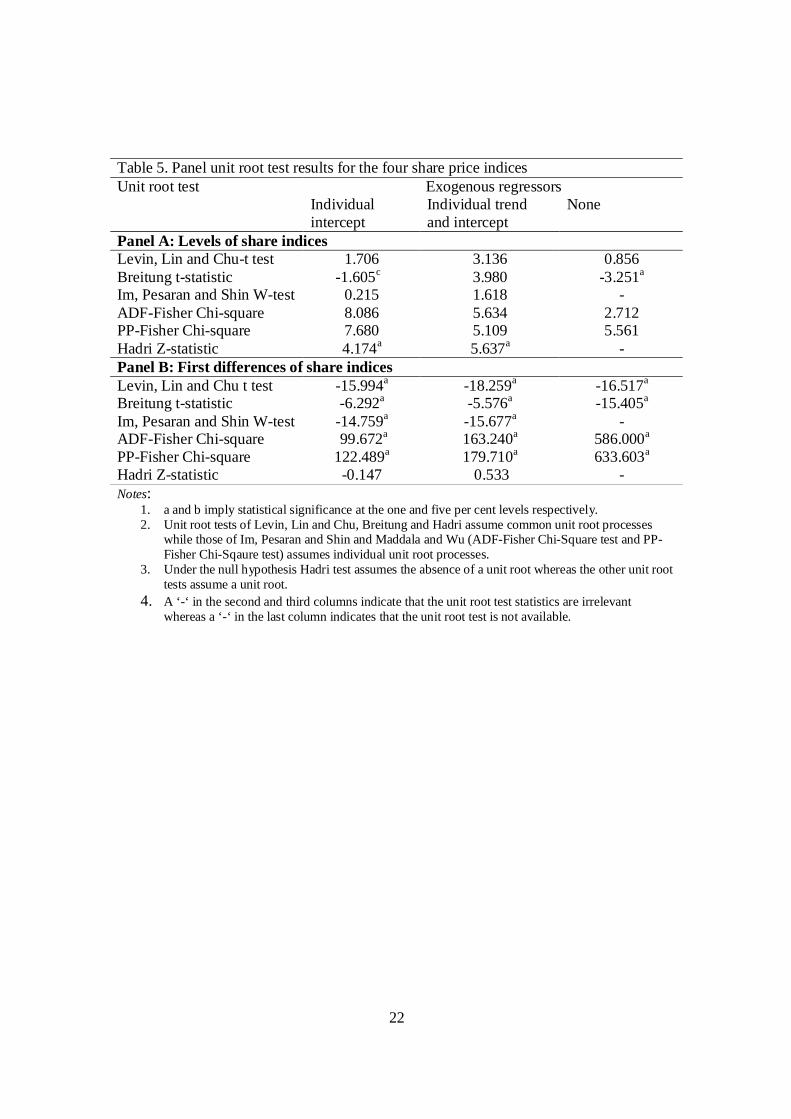
Table 5 reports results of the six recently developed panel unit root tests. As
pointed out before, these tests are more powerful than univariate unit root tests that have
been used in many empirical studies. The results reported in Panel A of the Table show
that under the five panel unit root tests all stock market price indices are non-stationary.
The Breitung t-statistic shows that stock market indices are stationary in levels only when
no deterministic components are included in the test equation. According to the results
presented in Panel B of the Table, stock returns for the four South Asian markets are
stationary. These results are consistent with the EMH. Therefore, investors cannot use
any technical trading rule or technique to make abnormal gains from stock market
transactions on a continuous basis.
5. Conclusion
This paper examined the validity of the weak form of the efficient market hypothesis for
four South Asian emerging stock markets. In addressing the issue of the weak form
efficiency, we employed recently developed univariate as well as panel unit root tests.
These tests are more powerful than most of the econometric techniques used in prior
studies. Our results indicate that although there are inconsistencies of the stock markets
with efficient market hypothesis under traditional techniques such as autocorrelation test

18
and Ljung-Box Q statistic and univariate unit root tests, panel unit root tests provide
strong evidence consistent with the weak form of the efficient market hypothesis. These
results indicate that it is impossible for an investor to predict share prices in these
emerging stock market and beat them on a consistent basis.

19
Figure 1 Share returns of South Asian stock markets
-.4
-.2
.0
.2
.4
.6
.8
96 97 98 99 00 01 02 03
Bangladesh
-.3
-.2
-.1
.0
.1
.2
96 97 98 99 00 01 02 03
India
-.5-.4-.3-.2-.1.0.1.2.3
96 97 98 99 00 01 02 03
Pakistan
-.2
-.1
.0
.1
.2
96 97 98 99 00 01 02 03
Sri Lanka
20
Table 1 Descriptive statistics for share index returns Bangladesh India Pakistan Sri Lanka
Mean -0.005 0.005 0.003 0.008 Median -0.009 0.009 0.000 -0.001 Maximum 0.645 0.172 0.292 0.193 Minimum -0.359 -0.212 -0.470 -0.191 Std. Dev. 0.121 0.087 0.129 0.067 Coef. Var (%) 2,420 1,740 4,300 8,375 Skewness 1.609 -0.491 -0.714 0.106 Kurtosis 11.912 3.025 4.517 3.297 Jarque-Bera 346.867 3.739 16.825 0.517 Probability 0.000 0.154 0.000 0.772 Observations 94 94 94 94
Table 2: Autocorrelation test results for the share index returns Country Lag
Bangladesh India Pakistan Sri Lanka 1 0.309b -0.101 -0.030 0.166 12 0.056 -0.085 -0.089 -0.065 24 0.049 0.122 0.016 0.076 36 -0.026 -0.092 0.018 -0.074 Notes:
1. b implies statistical significance at the five per cent level. 2. The null hypothesis tested was that autocorrelation coefficient at a particular lag is equal to zero.
Table 3: Q-statistic test results for the share index returns Country Lag
Bangladesh India Pakistan Sri Lanka 1 9.1669a 0.9803 0.0849 2.6510 12 25.932a 12.568 7.2636 9.3796 24 31.473 29.624 18.056 17.804 36 34.466 40.404 29.836 25.892 Notes:
1. a implies statistical significance at the one per cent level. 2. The null hypothesis tested is that the total of the total of the autocorrelation coefficients up to a
particular lag is zero.
21
Table 4 Univariate unit root test results
Unit root test statistic Share Index MZa MZt MSB MPT
-3.595 -1.267 0.353 6.827 Bangladesh -6.295 -1.774 0.282 14.475
-36.445a -4.267a 0.117a 0.679a ΔBangladesh -454.569a -15.076a 0.033a 0.201a
-7.596c -1.753a 0.231b 3.932c India -9.116 -2.059 0.226 10.302
- - - - ΔIndia -24.696a -3.429a 0.139a 4.201b
-5.868c -1.642c 0.280 4.399c Pakistan -6.324 -1.627 0.257 14.400
- - - - ΔPakistan -29.748a -3.857a 0.130a 3.064a
0.945 0.355 0.376 15.695 Sri Lanka 0.072 0.027 0.374 40.120
-55.110a -5.056a 0.092a 0.912a ΔSri Lanka -49.138a -4.859a 0.099a 2.342a
Notes: 1. A Δ indicates the first difference of these exchange rates. 2. a, b and c imply statistical significance at the one, five and ten per cent level, respectively. 3. The first figure under each unit root test for a currency or its first difference is the unit root test
statistics when a constant is used as the deterministic component. The second figure is the unit root test statistic when a constant and a linear time trend are used as deterministic components.
4. The lag lengths in the Ng-Perron tests were selected using spectral GLS-detrended based on SIC.
22
Table 5. Panel unit root test results for the four share price indices
Exogenous regressors Unit root test Individual intercept
Individual trend and intercept
None
Panel A: Levels of share indices Levin, Lin and Chu-t test 1.706 3.136 0.856 Breitung t-statistic -1.605c 3.980 -3.251a
Im, Pesaran and Shin W-test 0.215 1.618 - ADF-Fisher Chi-square 8.086 5.634 2.712 PP-Fisher Chi-square 7.680 5.109 5.561 Hadri Z-statistic 4.174a 5.637a - Panel B: First differences of share indices Levin, Lin and Chu t test -15.994a -18.259a -16.517a
Breitung t-statistic -6.292a -5.576a -15.405a
Im, Pesaran and Shin W-test -14.759a -15.677a - ADF-Fisher Chi-square 99.672a 163.240a 586.000a
PP-Fisher Chi-square 122.489a 179.710a 633.603a
Hadri Z-statistic -0.147 0.533 - Notes:
1. a and b imply statistical significance at the one and five per cent levels respectively. 2. Unit root tests of Levin, Lin and Chu, Breitung and Hadri assume common unit root processes
while those of Im, Pesaran and Shin and Maddala and Wu (ADF-Fisher Chi-Square test and PP-Fisher Chi-Sqaure test) assumes individual unit root processes.
3. Under the null hypothesis Hadri test assumes the absence of a unit root whereas the other unit root tests assume a unit root.
4. A ‘-‘ in the second and third columns indicate that the unit root test statistics are irrelevant whereas a ‘-‘ in the last column indicates that the unit root test is not available.

23
References
Abeyratna,G and Power,D.M. (1995), “A Test of the Weak-Form of the Efficient Market Hypothesis: Evidence Using Daily Data from the Colombo Stock Exchange”, Sri Lanka Journal of Social Sciences, Vol.18, No.1&2, pp.41-53.
Abeysekera, S. (2001), Efficient Market Hypothesis and the Emerging Capital Market in Sri Lanka: Evidence from the Colombo Stock Exchange-A Note, Journal of Business Finance and Accounting, 28, 249-261.
Bartlett, M.S. (1946), “On the Theoretical Specification of Sampling Properties of Auto-correlated Time Series”, Journal of the Royal Statistical Society, Series B, Vol.27, pp.27-41.
Breitung, J., 2000. The Local Power of Some Unit Root Tests for Panel Data. in B. Baltagi (ed.), Advances in Econometrics, Vol. 15: Nonstationary Panels, Panel Cointegration, and Dynamic Panels, Amsterdam: Jai Press, 161-178.
Chakraborty, M. (2006), Market Efficiency for the Pakistan Stock Market: Evidence from the Karachi Stock Exchange, South Asia Economic Journal, 7, 67-81.
Choi, I. 2001. Unit Root Tests for Panel Data, Journal of International Money and Finance, 20, 249-272.
Conrad, K. and Juttner, D.J. (1973), “Recent Behaviour of Stock Market Prices in Germany and the Random Walk Hypothesis”, Kyklos, Vol.26, pp. 579-598. Cooper, J.C.B. (1982) “World Stock Markets: Some Random Walk Tests”, Applied Economics, Vol.14, pp.515-531. Dryden,M.M. (1970), ”A Statistical Study of UK Share Prices”, Scottish Journal of Political Economy, Vol.17, pp.369-89. Fama, E.F., (1965), “The Behaviour of Stock Market Prices”, Journal of Business, Vol.38, pp.34-105. Godfrey,M., Granger, C.W.J and Morgenstern, O. (1964), “The Random Walk Hypothesis of Stock Market Behaviour”, Kyklos, Vol.17, pp.1-30. Granger, C.W.J. and Morgenstern, O . (1963), “Spectral Analysis of New York Stock Market Prices”, Kyklos, Vol.16, pp.1-27. Gunesekarage, G. and Power, D.M. (2001), The profitability of moving average trading rules in South Asian stock markets, Emerging Markets Review,2, 17-33.
24
Gupta, O.P. (1985), Behaviour of Share Prices in India: A Test of Market Efficiency, New Delhi: National Publishing House. Hasan, T., Samarakoon, L. P. and Hasan, S. (2000), “Stock Price Behavior in a less Developed Market: Evidence from Sri Lanka, Journal of Applied Business Research, Vol.16, No.2, pp.15-23. Hasan, M.S.(2004), On the Validity of the Random Walk Hypothesis Applied to the Dhaka Stock Exchange, International Journal of Theoretical and Applied Finance, Vol.7, 1069-1085. Jennergren, L.P. and Korsvold, P.E. (1975), “The Non-Random Character of Norwegian and Swedish Stock Market Prices”, in Elton and Gruber eds. International Capital Markets, Amsterdam: North-Holland, pp.37-54. Kendall, M.G. (1953),”The Ananlysis of Economic Time Series, Part I: Prices’’ Journal of Royal Statistical Society, Vol.96, pp.11-25. Law, C.K. (1982), “A Test of the Efficient Market Hypothesis With Respect to the Recent Behaviour of the Hong Kong Stock Market”, The Developing Economies, Vol.20, pp.61-72. Ljung, G.M. and Box, G.P.E. (1978), “On a Measure of Lack of Fit in Time Series Models”, Biometrica, Vol.66, pp.66-72. Hadri, K., (2000), Testing for Stationarity in Heterogeneous Panel Data, Econometric Journal 3, 148-161. Im, K. S., Pesaran, M. H., Shin, Y., 2003. Testing for Unit Roots in Heterogeneous Panels, Journal of Econometrics 115, 53-74. Isa, MD. M. (1989), Share Price Behaviour on the Malaysian Stock Market: Some Empirical Evidence”, Malayasian Journal of Economic Studies, Vol.26, N0.1, pp. 1-20. Islam, and Khaled (2005), Tests of Weak-Form Efficiency of the Dhaka Stock Exchange, Journal of Business Finance and Accounting, 32, 1613 – 1624. Levin, A., Lin, C. F., Chu, C., 2002. Unit Root Tests in Panel Data: Asymptotic and Finite-Sample Properties. Journal of Econometrics 108, 1-24. Maddala, G. S., Wu, S., 1999. A Comparative Study of Unit Root Tests with Panel Data and a New Simple Test. Oxford Bulletin of Economics and Statistics 61, 631-52. Moor, A.B. (1967), “Some Characteristics of Common Stock Prices”, in Cootner ed., The Random Character of Stock Market Prices, Cambridge: MIT Press, pp.139-161.

25
Ng, S., and P. Perron. 2001. “Lag Length Selection and the Construction of Unit Root Tests with Good Size and Power.” Econometrica 69: 1519-1554. Poshakwale, S. (1996), Evidence on Weak Form Efficiency and Day of the Week Effect in the Indian Stock Market, Finance India, 10, 605-616.
Pratez, P.D.(1969), “Australian Share Prices and the Random Walk Hypothesis”, Australian Journal of Statistics, Vol.11,pp.123-139. Samarakoon, L.P. (1996), “Predictability of Short-Horizon Returns in the Sri Lankan Stock Market, Sri Lankan Journal of Management, Vol. 1, No.3, pp.207-224. Sareewiwathana, P. and Isbell, S.B. (1985), “The Securities Exchange of Thailand: Tests of Weak Form Efficiency”, Securities Industry Review, Vol.11, No.1 Sharma, J.L. and Kennedy, R.E.(1977), ”A Comparative Analysis of Stock Price Behaviour on the Bombay, London and New York Stock Exchanges”, Journal of Financial and Quantitative Analysis, Vol.12, No.3,pp.391-413. Theil, H. and Leenders, C. (1965), “Tomorrow on the Amsterdam Stock Exchange”, Journal of Business, Vol.38, pp.277-84. Wong, K.A. and Kwong, K.S. (1984), “The Behaviour of Hong Kong Stock Prices”, Applied Economics, Vol.16, pp.905-17. Yong, O. (1989), “The Price Behaviour of Malaysian Stocks”, Malaysian Management Review, Vol.24, No.3, pp.23-34. Yong, O. (1990), “Thin Capital Markets: A Study of Stock Market Efficiency of Malaysian Stocks”, Malaysian Management Review, Vol.25, No.3, pp.49-61.


![Mean Reversion Pays, but Costs arXiv:1103.4934v1 [q-fin.TR] 25 … · 2011. 3. 28. · Mean Reversion Pays, but Costs∗ March28,2011 Abstract A mean-reverting financial instrument](https://img.dokumen.tips/doc/110x75/5fde417ae2bd164d6b7ca193/mean-reversion-pays-but-costs-arxiv11034934v1-q-fintr-25-2011-3-28-mean.jpg)