Embed Size (px)
Citation preview

Meagan LongoriaConsultant Denny Cherry & Associates Consulting

About Your Storyteller
Meagan Longoria
Denver, Colorado
DataSavvy.me
Twitter: @mmarie
Microsoft Data Platform MVP
Denny Cherry & Associates Consulting

Elements of a Story
Context
Problems
Emotions
Characters
Solutions

Story Structure
Beginning Middle End

Story Structure
Situation Conflict Resolution

Story Structure
What is What is What is What is
What could be Reward
What could be
What could be
Call to adventure Call to action

Why Storytelling?
Logical Structure
Easy to Follow
Engage Our Audience
Memorable Takeaways

What is Story?
“While many of us use the word story over and over again as we make our graphs and visualizations, I think we need to be more careful with the word and use it when appropriate—when we are getting people to feel deeply and when we are leading them to a meaningful climax.” –Jon Schwabish

Is Your Data Actually A Story?
“It’s important to highlight that a visualization isn’t more or less powerful, beautiful, or important because it does or doesn’t tell a story. –Joshua Smith

A Spectrum
Annotation Narration Story
Well organized
Logical order
Plot with climax
Emotional engagement

Storytelling Reality Check
Not everything is a real story, and that’s fine
But your report should be organized coherently within the necessary context to deliver meaning


Start with Message
Explain the “so what” takeaway that your audience should get from your report.
Do this at the report level first, then do this for each planned page and visual.
Whiteboard Storyboard

Message and TitlesClear, descriptive title
with conclusionSupplementary information that supports the message
Chart that clearly supports the message
Chart that clearly supports the message

Message and Dynamic Data
When data values can change, the relationship between report creator and consumer changes.
Creator provides context, signals, interactive controls
Consumer provides their own decision context and arrives at their own story
This is your typical corporate Power BI report

Storyforming in Power BI
Plan story using plot points such as “Year over year sales by product category” instead of static messages
Use dynamic text for titles, tables, and text explanations in Power BI
Try machine learning for forecasting, clustering, explaining key factors

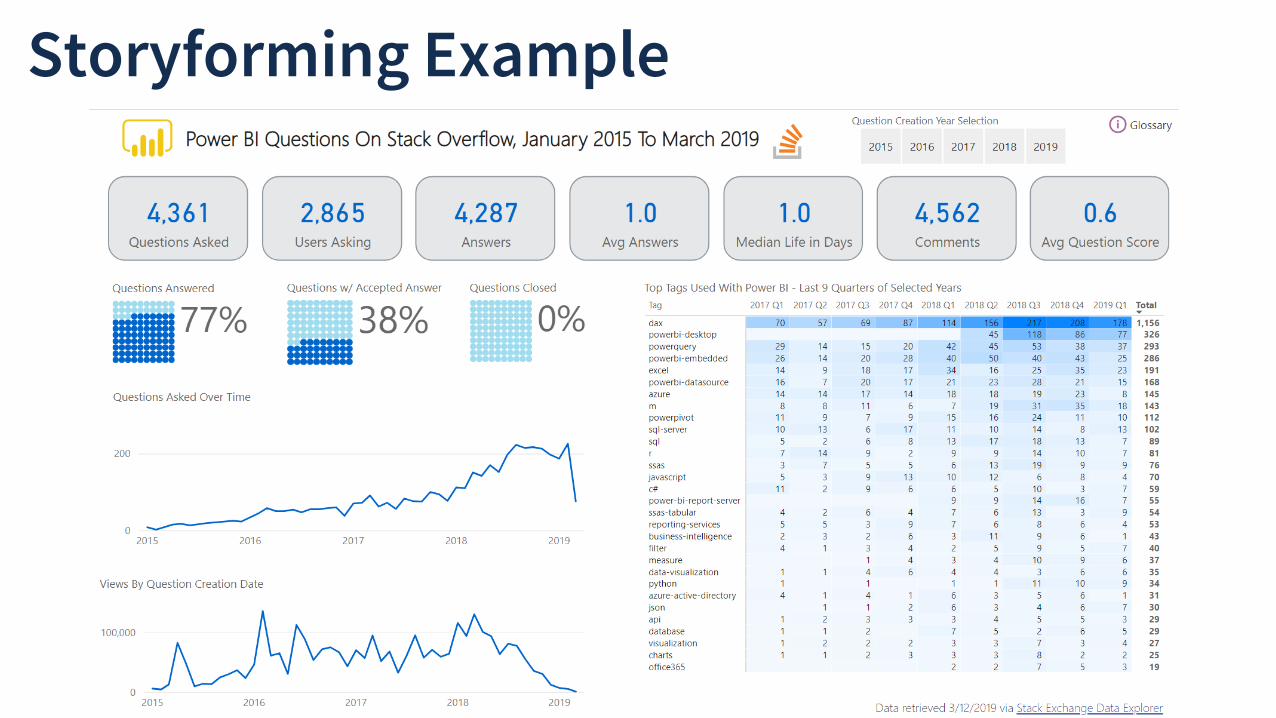
Storyforming Example
Context
Signal Signal
Interactive Controls
Storyforming Example


Publication of Inspiration

Data Storytelling* Technique #1
Text, video, or audio narration with visualizations interspersed throughout
Many news and magazine articles do this!


Data Storytelling* Technique #2
Linking through interactivity, color, or animation
Easy to do with report themes, actions and buttons/shapes in Power BI!


Data Storytelling* Technique #3
Use of next/previous buttons, scrollytelling, breadcrumbs, and menu selections
What we mean when we say“app-like experience”!


Data Storytelling* Technique #4
Dynamic queries allowing users to make selections to explore in a constrained manner, or a separate exploratory piece linked from the narrative


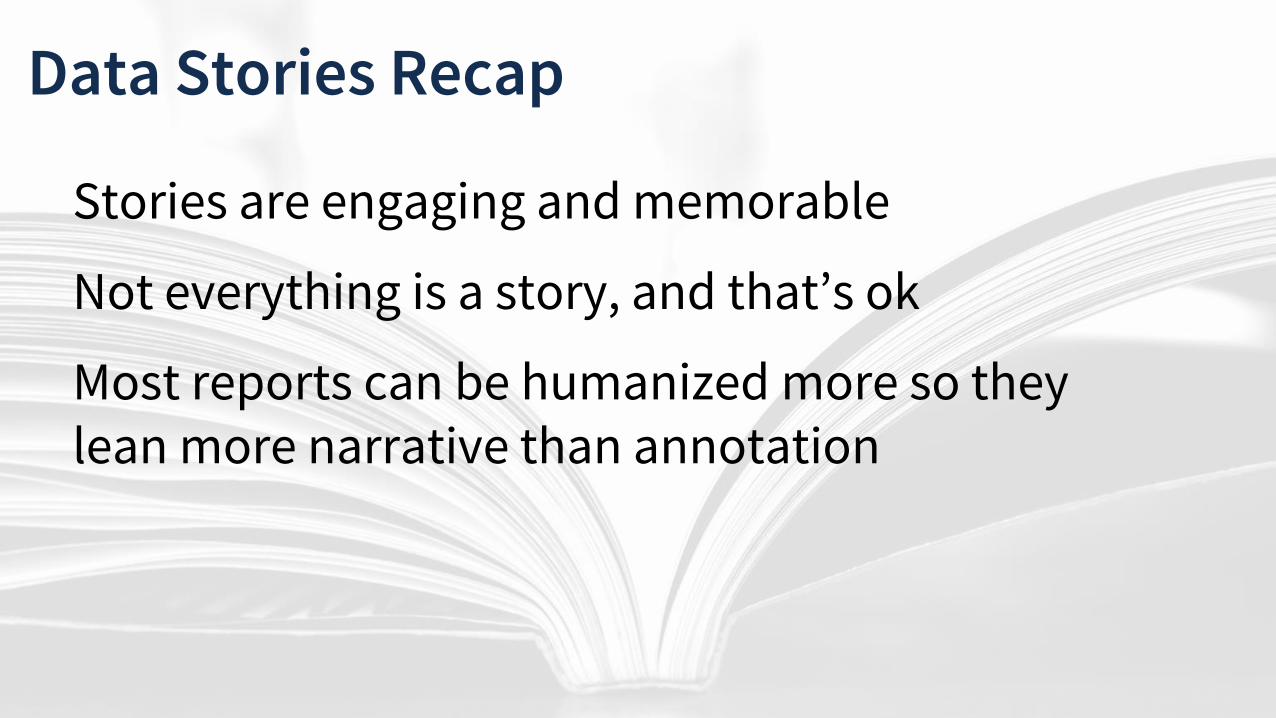
Data Stories Recap
Stories are engaging and memorable
Not everything is a story, and that’s ok
Most reports can be humanized more so they lean more narrative than annotation

Storytelling Technique Recap
Communicating narrative and explaining data
Linking separate story elements
Enhancing structure and navigation
Providing controlled exploration

Meagan Longoria
DataSavvy.me
Twitter: @mmarie
Microsoft Data Platform MVP
Denny Cherry & Associates Consulting