Embed Size (px)
DESCRIPTION
University of WashingtonMechanical EngineeringME 354ME 354 - Mechanics of Materials Lab 01Beam deflection
Citation preview

Page 1
Stress and Strains in a Three-Point Loaded Beam
By
_________________________________ (Name)
Date of this Lab Exercise: _________________________
Date of Lab Report Submission: _________________________
Page 2
Executive Summary:
The executive summary provides the essential information of the report. You should provide a
brief description of what main experiments were conducted for the report. The objectives,
procedures, results and conclusions of the laboratory exercise are to be briefly summarized.
Total length should be 300-500 words and on its own separate, single page. Final quantitative
results (e.g., % error in strain, modulus of elasticity for each material) should be provided to add
quantitative detail and credibility to the conclusions.
This section is the only part of a report that very busy, higher-level managers will read so you
need to carefully capture the essence of the work, results, and key recommendations. Avoid
technical jargon.
Page 3
A. Introduction
Two candidate beams have been selected for use in an aircraft landing gear. Scaled-down
prototypes of the beams with strain-gages were subjected to applied forces in a three-point
bending configuration. The beams had similar lengths and moment of inertias, but different
cross-sectional designs. Uniaxial, biaxial, and rosette strain gauges were placed at various
locations and orientations along the beams. A deflection gauge was used to measure the
displacement at the point of loading. Constitutive relations were used to calculate the predicted
stresses and strains and compared to the strain measurements. The goal is to determine which
beam design will have the most mechanically stability. The working hypothesis is that the same
loading condition for each beam will produce different stress states for each beam design.
Specific learning objectives include a) familiarizing the user with strain gages and associated
instrumentation, b) measuring deflections and compare these to predicted deflections, and c)
verifying aspects of stress-strain relations and simple beam theory.
B. Procedure
Three point bending tests were conducted on two beams made from Aluminum 6061-T6. One of
the beams was a hollow tube (“Round tube”) and the other had a prismatic cross-section with a
horizontal span and two vertical flanges (“C-Channel”). The beams and testing apparatus are
shown in Figure 1. The dimensions are given in Appendix A. Both beams had a series of strain
gauges situated at different points along the beam to measure the internal strain at that point.
The Round tube had four pairs of biaxial strain gauges on it. The C-Channel had 2 rosette strain
gauges and two uniaxial strain gauges. The beams were subjected to a downward applied load
using a turnbuckle device located a fixed position along the span of the beam. The applied load
was indirectly measured using a load cell located at one end of the simply supported beam. Four
loads were applied that caused reaction forces at the load cell that read between 100-400 N. The
computer then reported the strain at each strain gauge using the Strain Smart data acquisition
system and the values were recorded.
Page 4
Figure 1. Three-point testing apparatus.
C. Results:
From the data collected during the experiments on the two beam designs, the predicted
deflections and strains were calculated. The measured values of deflection and strain were then
compared to their corresponding predicted values using percent error.
C.1 Deflections
The measured deflections at each applied load are shown in Figure 2. To compare these
deflections to the predicted values, the applied load is first calculated from the free body
diagram, the equations of static equilibrium, and the load cell readings (Appendix B). The
centroid of each beam design and its moment of inertia was then determined (Appendix C) so
that the predicted deflection of each beam could be calculated (Appendix D). Comparisons
between the measured and predicted deflections for each beam design are tabulated in Tables 1
and 2.
Insert illustration or digital image of the apparatus.

Page 5
Figure 2. Displacement vs. load for each beam design. (Right-click and select “Edit Data” to
change values)
Table 1. Measured vs. Predicted Displacement for Each Beam Design Round Tube C-Channel
δmeas
(mm) δ theory
(mm) Percent Error
δmeas
(mm) δ theory
(mm) Percent Error
C.2 Strains
The measured strains for each strain gauge are listed in Table 2 to 8 for each beam design. To
predict the stress and strain at each gauge location, it was assumed that shear effects are
negligible and the only stresses are due to bending (Appendix E). The bending stress at each
strain gauge was calculated based upon the bending moment at that location and the distance
from the centroidal neutral axis. A rotation of the coordinate system was then used to predict
the strain at an angle θ that corresponds to the orientation of each strain gauge. This
transformation equation is given by
y = 0.009x + 0.75 R² = 0.9
y = 0.0129x - 0.05 R² = 0.99438
0
1
2
3
4
5
6
0 50 100 150 200 250 300 350 400 450
Dis
plac
emen
t (m
m)
Load Cell (N)
Round Tube
C-Channel
Linear (Round Tube)
Linear (C-Channel)

Page 6
2 2cos sin sin cosx y xyθε ε θ ε θ γ θ θ= + + (1)
where εx,εx,and γxy are the predicted strains. The comparison of strains for the Round Tube is
tabulated in Tables 2-5 and for the C-Channel in Tables 6-8.
Table 2. Measured vs. Predicted Strains at Strain Gauge 1 for Round tube
SG 1a (θ = _______) SG 1b (θ = _______) εmeas
(µε) εθ
(µε) Percent Error
εmeas
(µε) εθ
(µε) Percent Error
Table 3. Measured vs. Predicted Strains at Strain Gauge 2 for Round tube
SG 2a (θ = _______) SG 2b (θ = _______) εmeas
(µε) εθ
(µε) Percent Error
εmeas
(µε) εθ
(µε) Percent Error
Table 4. Measured vs. Predicted Strains at Strain Gauge 3 for Round tube SG 3a (θ = _______) SG 3b (θ = _______) εmeas
(µε) εθ
(µε) Percent Error
εmeas
(µε) εθ
(µε) Percent Error
Table 5. Measured vs. Predicted Strains at Strain Gauge 4 for Round tube
SG 4a (θ = _______) SG 4b (θ = _______) εmeas
(µε) εθ
(µε) Percent Error
εmeas
(µε) εθ
(µε) Percent Error

Page 7
Table 6. Measured vs. Predicted Strains at Strain Gauge 1 for C-Channel SG1a (θ = _______) SG 1b (θ = _______) SG 1c (θ = _______)
εmeas
(µε) εθ
(µε) Percent Error
εmeas
(µε) εθ
(µε) Percent Error
εmeas
(µε) εθ
(µε) Percent Error
Table 7. Measured vs. Predicted Strains at Strain Gauge 2 for C-Channel SG2a (θ = _______) SGb (θ = _______) SG2c (θ = _______)
εmeas
(µε) εθ
(µε) Percent Error
εmeas
(µε) εθ
(µε) Percent Error
εmeas
(µε) εθ
(µε) Percent Error
Table 8. Measured vs. Predicted Strains at Strain Gauges 3 and 4 for C-Channel SG3 (θ = _______) SG4 (θ = _______) εmeas
(µε) εθ
(µε) Percent Error
εmeas
(µε) εθ
(µε) Percent Error
D. Discussion:
Discuss the comparison between the predicted and measured deflections in Table 1.
Comment on the linearity of the data in Figure 2 and the R2 value. Discuss the comparison
between the predicted and measured strains in Tables 3-8. Assess the validity of the working
hypothesis. Explain possible sources of error in the measurements and how it would affect
outcome the data. Indicate which beam design is most likely to fail first and at what location do
we expect the onset failure to occur. Make a recommendation about which design to pick based
upon deflection (flexibility) vs. failure (strain).
Page 8
Appendix A: Dimensions and Material Properties
The dimensions of the Round tube and C-Channel are given in Tables A.1 and A.2, respectively.
The given material properties of aluminum at given in Table A.3
Table A.1. Round tube dimensions L LA X Y2 Y3
Table A.2. C-Channel dimensions
L LA X1 X2 X3&4 Y3 Y4
Table A.3. Material Properties of Aluminum
Elastic Modulus, E (MPa) 69000 Yield Strength (0.2%offset), σo (MPa) 275 Poisson's ratio, υ 0.33 Ultimate Tensile Strength, σu (MPa) 324 Percent Elongation, %el (50.8mm gage length) 12

Page 9
Appendix B: Free Body Diagram & Applied Load
The applied load P for each beam design is found from solving the equations of static
equilibrium and the force reading at the load cell, RLC.
Figure B.1 Free-body diagram of 3-pt loaded beam.
To find the applied load, the sum of the moments about A gives
0A A LCM PL R L= = − +∑ (B.1)
To find the reaction force at A, the sum of the forces in the y-direction gives
0y A LCF R P R= = − +∑ (B.2)
The values for each load cell measurement for the round tube and C-channel are given in Table
B.1 and B.2, respectively.
Table B.1. Applied Loads for Round tube RLC (N) P (N) RA (N)
Table B.2. Applied Loads for C-channel RLC (N) P (N) RA (N)
P
RLC RA L
LA
x
y

Page 10
Appendix C: Centroid and Moment of Inertia
Calculation of the centroid and moment of inertia requires the use of the cross-sectional
dimensions of each beam. The values are contained in Table C.1 and C.2.
Table C.1. Dimensions of the Round tube Dimension Length (mm) Outer Diameter, D0 Inner Diameter, Di
Table C.2. Dimensions of the C-channel Dimension Length (mm) Width, w Height, h Thickness, t
C.1 Round Tube
The y-position of the centroid from the bottom of the round tube is
0
2Dy = (C.1)
and has a value of _________________ mm.
The moment of inertia about the z-axis is
( )4 4064z iI D Dπ= − (C.2)
and has a value of _________________ mm4.
C.1 C-Channel
The centroid and moment of inertia requires that the C-channel be calculated as if three
rectangular sections are in union with each other. There is one top section with area (w-2t)(t) and
two identical flange sections on each side with area ht. The y-position of the centroid from the
bottom of the C-channel is
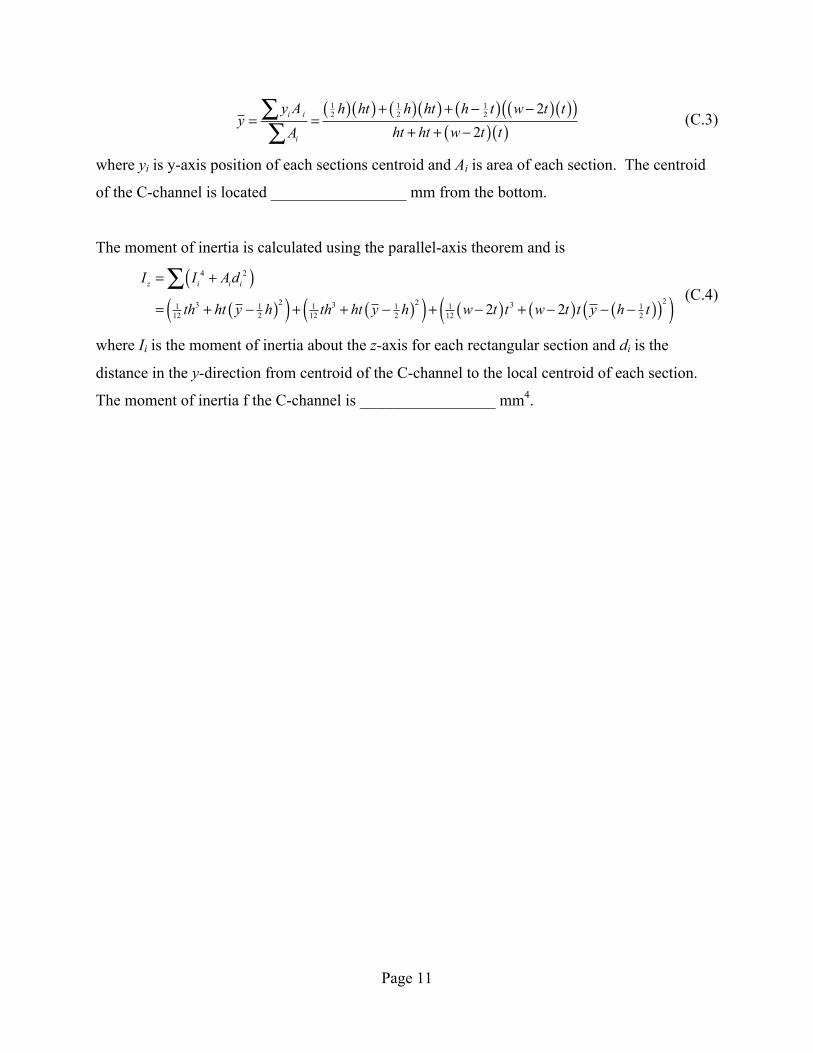
Page 11
( )( ) ( )( ) ( ) ( )( )( )( )( )
1 1 12 2 2 2
2i i
i
y A h ht h ht h t w t ty
ht ht w t tA+ + − −
= =+ + −
∑∑
(C.3)
where yi is y-axis position of each sections centroid and Ai is area of each section. The centroid
of the C-channel is located _________________ mm from the bottom.
The moment of inertia is calculated using the parallel-axis theorem and is
( )
( )( ) ( )( ) ( ) ( ) ( )( )( )4 2
22 23 3 31 1 1 1 1 112 2 12 2 12 22 2
z i i iI I Ad
th ht y h th ht y h w t t w t t y h t
= +
= + − + + − + − + − − −
∑ (C.4)
where Ii is the moment of inertia about the z-axis for each rectangular section and di is the
distance in the y-direction from centroid of the C-channel to the local centroid of each section.
The moment of inertia f the C-channel is _________________ mm4.

Page 12
Appendix D: Beam Deflection Calculation
The deflection of the simply supported beam at the point of loading can be found from Euler-
Bernouli beam theory, and is given by
( )22 3theory A A zPL L L EI Lδ = − − (D.1)
For each load P, the predicted displacements are given in Table D.1 and D.2, respectively.
Table D.1. Displacement for Round tube RLC (N) δ theory (mm)
Table D.2. Displacement for C-channel RLC (N) δ theory (mm)

Page 13
Appendix E: Predicted Stress and Strain in Beams
If we neglect the effect of shear forces, then the stresses at each strain gage are only due to
bending:
, 0, 0x y xyz
MyI
σ σ τ= = = (E.1)
where M is the moment induced by the applied load P at a given point along the length of the
beam ( AM R x= for 0 ≤ x ≤ LA and ( )LCM R L x= − for LA ≤ x ≤ L) and y is the distance in the y-
direction between the location of the strain gage and the centroid of beam ( )iy y y= − . The
normal and shear strains are given by Hooke’s law:
( )1x x y zE
ε σ ν σ σ⎡ ⎤= − +⎣ ⎦ (E.2)
( )1y y x zE
ε σ ν σ σ⎡ ⎤= − +⎣ ⎦ (E.3)
xyxy G
τγ = (E.4)
E.1 Round Tube
The predicted stresses and strains at each strain gage on the Round tube are listed in Tables E.1
to E.4
Table E.1. Stress and Strain at Strain Gage 1 for Round tube.
M (N mm) y (mm) σx (MPa) σy (MPa) τxy (MPa) εx (µε) εy (µε) γxy (µε)
Table E.2. Stress and Strain at Strain Gage 2 for Round tube.
M (N mm) y (mm) σx (MPa) σy (MPa) τxy (MPa) εx (µε) εy (µε) γxy (µε)

Page 14
Table E.3. Stress and Strain at Strain Gage 3 for Round tube.
M (N mm) y (mm) σx (MPa) σy (MPa) τxy (MPa) εx (µε) εy (µε) γxy (µε)
Table E.4. Stress and Strain at Strain Gage 4 for Round tube.
M (N mm) y (mm) σx (MPa) σy (MPa) τxy (MPa) εx (µε) εy (µε) γxy (µε)
E.2 C-Channel
The predicted stresses and strains at each strain gage on the C-Channel are listed in Tables E.5 to
E.8
Table E.5. Stress and Strain at Strain Gage 1 for C-Channel.
M (N mm) y (mm) σx (MPa) σy (MPa) τxy (MPa) εx (µε) εy (µε) γxy (µε)
Table E.6. Stress and Strain at Strain Gage 2 for C-Channel.
M (N mm) y (mm) σx (MPa) σy (MPa) τxy (MPa) εx (µε) εy (µε) γxy (µε)

Page 15
Table E.7. Stress and Strain at Strain Gage 3 for C-Channel.
M (N mm) y (mm) σx (MPa) σy (MPa) τxy (MPa) εx (µε) εy (µε) γxy (µε)
Table E.8. Stress and Strain at Strain Gage 4 for C-Channel.
M (N mm) y (mm) σx (MPa) σy (MPa) τxy (MPa) εx (µε) εy (µε) γxy (µε)