Embed Size (px)
Citation preview

MCRU Programme 2006-2010
The emergency and urgent care system
Final Report
Jon Nicholl Patricia Coleman John Jenkins Emma Knowles Alicia O’Cathain Janette Turner
With acknowledgments to: Tim Pearson for creating the performance indicators maps; and Michelle Hassall, Joanne Turner and Jill Willoughby for supporting the research programme.
March 2011
This work was undertaken by the Medical Care Research Unit which is supported by the Department of Health. The views expressed here are those of the authors and not necessarily those of the Department.

Summary
This is the final report of a five year research programme on the emergency and urgent care system undertaken by the Medical Care Research Unit between 2006 and 2010. This report must be read in conjunction with a formal peer-reviewed interim report sent to the Department of Health in January 2009, which set out the need for this research programme and detailed the findings from the early phases of the five year programme. A responsive programme of ambulance research undertaken between 2008 and 2010 is also reported here.
A. The emergency and urgent care system
This five year programme focused on the way in which an emergency and urgent care system is managed (Networks), the development of performance monitoring of systems using routine data (Performance Indicators), and the development and testing of survey methodology to measure patients’ experiences and views of the system (Patient Perspective). These early parts of the programme (2006-8) were detailed in a formal peer-reviewed interim report to the Department of Health in January 2009. The current report builds on this interim report by summarising the findings of the interim report and then reporting in detail the later phases of the programme. The later phases involved the calculation of performance indicators for all primary care trusts (PCTs) in England, and application of the patient perspective survey within a multiple case study evaluation of changes made to four emergency and urgent care systems. A Toolkit has been devised to enable system managers and stakeholders to calculate the performance indicators and undertake a user survey within their own system.
Managing the system – Emergency and Urgent Care Networks: Case studies were carried out in six areas where there were functioning emergency and urgent care networks. Detailed descriptions of similarities and differences between these networks were used to identify different models of network development and operation. In addition a national email survey of all PCTs in England was carried out to determine network activity across the country. The networks were active at the time of the survey in 2007 but there is no information about network activity currently. Details were reported in our 2009 interim report.
Developing and calculating performance indicators: A Delphi exercise was undertaken to obtain a consensus of experts on candidate performance indicators for the system. Sixteen indicators were identified, some of which were related to 14 conditions which could potentially be managed by a good urgent care system without resort to hospital admission, and some to a further 16 serious emergency conditions from which death could potentially be prevented by a good emergency system. Details were reported in our 2009 interim report. Six performance indicators which could be calculated using national routine data were calculated for all 152 PCTs in England:
1. The standardised population mortality rate
2. The standardised case fatality ratio
3. The standardised urgent admission rate
4. The emergency readmission rate
2

5. The rate of unnecessary referrals by emergency and urgent care services to EDs
6. The rate of unnecessary referrals by ambulance services to EDs
Measuring the patient perspective of the system: Qualitative research was undertaken to identify the characteristics of emergency and urgent care systems which are important to patients. A questionnaire was developed based on this qualitative research and piloted in one system. Two approaches to survey administration were tested – postal and telephone. This resulted in the development of the Urgent Care System Questionnaire (UCSQ) for administration by telephone using a market research company. Details were reported in our 2009 interim report.
Case studies of change in four systems: Four systems were identified which planned to make changes to their emergency and urgent care system during 2009. Case studies were undertaken in each system using documentary evidence of the planned change and expected outcomes, a site visit to the hub of the change to observe the change, telephone interviews with key stakeholders to discuss the change and its perceived outcomes, routine data on the use of some emergency and urgent care services before and after the change, and a survey of system users before and after the change. The two PCTs adding a new service to their emergency and urgent care system succeeded in implementing planned changes whereas the two PCTs reconfiguring existing services had only partly implemented planned changes. There was evidence that adding a new primary or urgent care centre into a system could improve user satisfaction with access to the system. There was also evidence that the UCSQ was responsive to change.
Conclusions: Measuring the performance of the emergency and urgent care system is important. We have developed and tested two sets of tools for use by policy makers, commissioners and researchers: six performance indicators calculated using routine data and the Urgent Care System Questionnaire (UCSQ) with associated survey methodology. As well as publishing this work in peer-reviewed journals, we intend to continue to work with policy makers developing performance indicators for emergency and urgent care, and use the USCQ in future evaluations of changes made to the emergency and urgent care system.
Toolkit: We have developed a Toolkit to allow commissioners and researchers to make full use of our research programme outputs. The Toolkit in Appendix B details how to calculate the six performance indicators evaluated here, and how to administer and analyse a survey of system users.
B. Responsive research
In addition to the five year programme, the MCRU responds to the Department of Health’s requests for research into different aspects of emergency and urgent care. A significant component of this was a programme of research on ambulance services:
Evidence base – We reviewed the evidence base for pre-hospital and out of hospital care and identified the research priorities relevant to future development and implementation of ambulance service policy objectives.
CAT B performance measures – We worked with the ambulance service policy team to support the development of new performance measures for ambulance category B calls that reflect care delivered rather than response times.
3

Contents
Page
Summary 2
The MCRU 5
A. Emergency and urgent care system
1. Introduction
2. Managing the system – Emergency and Urgent Care Networks
3. Developing and calculating performance indicators
4. Measuring the patient perspective
5. Case studies of changes made to four systems
6. Conclusions
6
6
11
13
81
85
112
B. Responsive research: ambulance programme
1. Evidence base for pre-hospital and out of hospital care
2. Category B performance measures
113
113
115
Appendix A Extra information about the performance indicators
118
Appendix B Toolkit for measuring emergency and urgent care
system performance
123
Toolkit
4

Medical Care Research Unit
1. The Unit
The Medical Care Research Unit (MCRU) is a Health Services Research group which started in 1966. It is based in the School of Health and Related Research at the University of Sheffield. Since the early 1990s emergency and urgent care has been the research focus of the unit. The last five year programme of the Unit (2006-2010) has focused on the emergency and urgent care system as well as the individual health services within the system. Members of the Unit have considerable expertise in emergency and urgent care research and have worked closely with both national and local policy makers to support evidence–informed policy making.
2. The team
Professor Jon Nicholl led the five year programme on emergency and urgent care systems.
Professor Jon Nicholl, Patricia Coleman and John Jenkins undertook the research on performance indicators.
Janette Turner led the responsive programme of research on the emergency ambulance service and the work on emergency and urgent care networks.
Professor Alicia O’Cathain and Emma Knowles undertook the research on the system user survey.
Professor Alicia O’Cathain, Patricia Coleman and Emma Knowles undertook the case studies.
The research endeavour was supported by Tim Pearson, Michelle Hassall, Jill Willoughby, and Joanne Turner.
3. The report
This is the final report of a five year research programme on the emergency and urgent care system undertaken by the MCRU between 2006 and 2010. The report builds on a detailed peer-reviewed interim report of the early phases of the programme (2006-2008). The interim report is available at:
http://www.shef.ac.uk/content/1/c6/05/91/04/final%20report.pdf.
Much of what is reported in this final report has been presented to policy leads at the Department of Health during our regular meetings. This final report has been written as an internal report for the Department of Health and thus assumes some background knowledge about the policy context. Any publications in peer reviewed journals will acknowledge the policy context of the programme.
This report also covers a programme on ambulance research responsive to Department of Health needs.
5

A. Emergency and urgent care system
1. Introduction
1.1 What is an emergency and urgent care system The emergency and urgent care system (EUCS) consists of all the services which contribute to the management of people during the emergency phase of health problems, together with the processes in place for referring patients between services. The list of services within an EUCS includes:
• emergency departments • ambulance services • general practice out-of-hours services • minor injury units, walk-in-centres, and other urgent care
centres • NHS Direct • urgent or ‘same day’ GP services • social services • other specialist services e.g. mental health crisis teams,
EUCS tend to be managed by Primary Care Trusts (PCTs) or groups of PCTs, sometimes in conjunction with emergency and urgent care networks which may cover one or more PCTs. PCTs therefore are the basis for defining any EUCS.
1.2 Rationale for health systems research
In October 2001 the government introduced a 10-year strategy for reforming emergency care.1 The strategy was based on six key principles:
• Services should be designed from the point of view of the patient;
• Patients should receive a consistent response, wherever, whenever and however they contact the service;
• Patients’ needs should be met by the professional best able to deliver the service needed;
• Information obtained at each stage of the patient’s journey should be shared with other professionals who become involved in their care;
• Assessment or treatment should not be delayed through the absence of diagnostic or specialist advice; and
• Emergency care should be delivered to clear and measurable standards.
The strategy addressed the performance of individual elements of the emergency care system such as ambulance response times and emergency department waiting. However, it also recognised that a more integrated approach was required to optimise the performance of the emergency and urgent care system from the patient’s perspective.
6

There is a vast amount of literature on health services research and whilst the focus of most is service-based, considerable research into care pathways that cross organisational boundaries has been reported. Patients experiencing an episode of ill-health may not attend or consult a single provider. Instead they may make several contacts often with different services, interacting with different clinicians and support staff. This is particularly true of patients contacting emergency and urgent care services, and a patient’s experience of care when they have an unplanned health care need often relates to the emergency care system rather than to single services. They may phone NHS Direct and visit their general practitioner (GP), or attend a walk-in centre and later contact the out-of-hours service. For more serious emergencies they may be passed from the ambulance service to the hospital emergency department, and then on to a multi-agency community support team. Each of the individual services may be effective, efficient and safe - and yet the system may be inefficient, unsafe, and unsatisfying to the patient. Results of our earlier surveys of users of emergency and urgent care systems suggest that most patients who contact the system make more than one contact per episode, with a significant proportion making three or more contacts (Figure 1.1).2
Figure 1 Proportion of population with an
episode of unplanned health care in 4 weeks by no. of service contacts per episode
0
10
20
30
20022001200019991998
year
%
one contact only two contacts three or more contacts
Although the quality of care provided by each service must be an important determinant of the overall quality of care provided by the system, a EUCS is more than just its individual parts. The system has its own characteristics, such as accessibility, integration, appropriateness of referrals from one service to another, and speed and accuracy of information sharing. The system also has its own metrics, for example the number of services contacted before definitive care is received, and how long this takes. Patients experience the system as well as the services, and so there are also questions about, for example, satisfaction with their pathway through the system.
1.3 An increasing policy focus on the emergency and urgent care system in England
The importance of the system as a whole is implicit in the white paper Our health, our care, our say, which notes that the urgent care strategy must focus on
7

“introducing simpler ways to access care and ensuring that patients are assessed and directed, first time, to the right service for treatment or help”.3 However, when we started this five year programme of research in 2006 the concept of a system of emergency and urgent care was not the norm in policy-making in England. As the programme has progressed, there has been an increasing focus on the system by policy makers and agencies supporting policy makers, commissioners and service providers. Examples of this include the Healthcare Commission review of urgent care which had service integration and coordination at its heart;4 the Department of Health initiative for developing performance indicators for emergency care, with plans to develop indicators for the system in 2012/13;5 and Public Health Observatory support for a system perspective (Figure 1.2).6
Figure 1.2 Public Health Observatory support for a system perspective
(Yorkshire and Humber Monthly QIPP Resource Pack March 2010. Slide 4) 1.4 Overview of the research programme This research programme was concerned with investigating the emergency and urgent care system (EUCS). There were four components: Managing the system using networks As a mechanism to deliver the objectives of the NHS Plan, emergency and urgent care networks were regarded by the Department of Health as a vital part of Reforming Emergency Care.7 Emergency and urgent care networks were established to coordinate services within a EUCS. We set out to consider how systems were managed in England by describing whether and how networks were used in England.
Performance Indicators Commissioners of emergency and urgent care services, and policy-makers, are concerned with quality of care and performance against targets. Typically these are easily measurable, policy sensitive targets such as 48-hour access, 4 hour waiting times, and 8 minute response times. These process measures are the standards by
8

which services are commissioned and therefore performance against these standards must be monitored. Other performance measures which are introduced should not have any negative (or perverse) implications for these standards.
We set out to examine the impact of services and systems on the population as a whole, irrespective of which members of the population may be patients. Inherently, this perspective required us to consider whether differences over time or between areas were attributable to differences in populations (age, sex, incidence of disease, case-mix), in services, or in the system as a whole. We set out to identify performance indicators based on routine data which, from a population perspective, provide a means of comparative performance monitoring of outcomes and events which are the result of the EUCS.
Patients’ perspectives We were interested in the quality and outcomes of care as experienced by individuals who use the system. While this may sometimes coincide with a service perspective, in urgent care it often will not, since the user often experiences a number of services in the course of a single episode of care. Thus, this approach led us to ideas such as the patient pathway, the total time from symptoms/event to definitive treatment, and so forth. We set out to develop and test a questionnaire and survey methodology to measure the performance of the system from the patient perspective.
Evaluating and monitoring change National and local policy makers add new services to EUCS or reconfigure existing services. We set out to test whether our population and patient indicators were responsive to changes made to systems, using case studies of four systems. Finally, managers of systems – be they networks or PCTs – must monitor performance and undertake service evaluation. We set out to develop a Toolkit to allow system managers to calculate performance indicators and undertake surveys of system users.
1.5 Overview of report
2006-2008 Interim
Report
2006-2010 Final Report
Management Interviews and survey of Networks
Performance indicators Development of indicators using Delphi approach
Calculation of indicators
Patients’ perspectives Qualitative research of users’ views Testing of questionnaire and survey methodology
Evaluating and monitoring change
Toolkit for patient perspective
Case studies of four systems making changes in 2009 Toolkit for using surveys to assess change over time and calculation of performance indicators
9

References for Section 1
1. Department of Health. Reforming emergency care. First steps to a new approach. Winter and Emergency Services capacity planning team. London. Stationary Office, 2001.
2. O’Cathain A, Knowles E, Munro J, Nicholl J. Exploring the effect of changes to service provision on the use of unscheduled care in England: population surveys. BMC Health Services Research, 2007; 7: 61.
3. Our health our care our say. http://webarchive.nationalarchives.gov.uk/+/www.dh.gov.uk/en/Healthcare/Ourhealthourcareoursay/DH_072550
4. Healthcare Commission. Not just a matter of time. A review of urgent and emergency care services in England. Commission for Healthcare Audit and Inspection, 2008.
5. Reforming urgent and emergency care performance management
http://www.dh.gov.uk/en/Healthcare/Urgentandemergencycare/DH_121239, accessed 21 February 2011.
6. Yorkshire and Humber Monthly QIPP Resource Pack March 2010. Slide 4 http://www.yhpho.org.uk/resource/item.aspx?RID=71813 7.http://www.dh.gov.uk/en/Healthcare/Emergencycare/Modernisingemergencycare/DH_4063735
10

2. Managing systems: emergency and urgent care networks
Achievement of policy initiatives around emergency and urgent care requires a system approach. One way of delivering a system is by using networks to organise, co-ordinate and manage the necessary processes. To explore how this model was being utilised in the NHS we used two approaches in 2006 and 2007 – 1) detailed case studies with six emergency and urgent care networks exploring how they had developed and operated and 2) a national survey of all PCTs in England to establish network activity. Our 2009 interim report covered findings and implications in detail. We offer a summary here.
The case studies identified a number of salient features key to successful network operation:
• Size of network is important. Although different models exist, the best option appeared to be a two tiered model with a regional network board to manage direction and planning supported by local PCT-based networks to implement services.
• Networks have the potential to reduce inefficiencies, deliver innovative services, improve quality of care and give value for money. There was some evidence of success in these active networks in delivering this potential already, and some examples of potential cost savings in systems managed by networks, but this is far from clear cut.
• Success in achieving objectives and functions appeared to be dependent on senior level participation and commitment, engagement of a range of enthusiastic and committed providers, commissioners who are open to change and willing to work co-operatively, and dedicated network support including appropriate funding.
• Unresolved issues included clarification about the role and scope of networks, uncertainty about responsibilities and accountability, and overlap and duplication with other NHS policy initiatives.
The survey of PCTs found there was a substantial amount of emergency and urgent care network activity across the NHS in England, with 96/152 (63%) of PCTs reporting some network involvement. These networks were at different stages of maturity, and progress had been influenced by the significant re-organisations carried out in 2006. The regional model was dominant with 85 PCTs being involved in some form of regional network. Half of these regional networks comprised two PCTs working together over a well-defined health economy, with two larger networks co-ordinated at a Strategic Health Authority level. Key issues that emerged from the survey were:
• There was a broad range in both the number and types of organisations making up network membership. Almost all networks included PCTs, hospital trusts, ambulance service and social services or community trusts in their membership. At least half also included mental health services, NHS Direct and out of hours providers.
11

• There was variation in the focus of networks, with some engaged in developing strategy and acting in an advisory capacity and others taking a much more operational approach.
• At the time (2007), networks reported becoming more involved in commissioning of emergency and urgent care and considered using network information on service review, planning, prioritisation resource allocation to influence and advise commissioners as one of their functions.
• There were many examples of network activities and service changes that have been made to improve working across organisational and professional boundaries.
• The predominant obstacle to network development and implementation of service change related to funding and the ability to move and reallocate resources around the emergency care system.
Our analysis showed that emergency and urgent care network activity was developing into stronger organisational structures in 2007 and that these networks clearly viewed their role and function as being the “vehicle” for implementing emergency and urgent care policy initiatives and for improving emergency and urgent care across the health economies they represented. Our survey was carried out after a period of major change and there is no central information resource which allows us to determine the extent to which these networks have continued to develop. However within the NHS, and particularly in emergency and urgent care, there has been a clear shift towards system-based service organisation, with the planned implementation of both the 111 urgent care number and regional trauma systems developing using this approach:
http://www.excellence.eastmidlands.nhs.uk/welcome/improving-care/emergency-urgent-care/major-trauma/nhs-clinical-advisory-group/
Future research on networks
In our 2009 interim report we recommended that it would be useful to reassess network activity in 2009 or 2010 to examine the extent to which the objectives and plans they set have actually been achieved. However the NHS faces another period of significant reorganisation which is likely to impact on network activity and development and therefore the value of repeating this exercise is questionable.
12

3. Development of performance indicators for emergency and urgent care systems
3.1 Background 3.1.1 System indicators There are many indicators of health service performance in current use. This is as true for emergency and urgent care services as others. Ambulance response times, door to needle times, times to be treated in the ED, etc, are all used to ‘indicate’ the performance of services. However, what is not widely used are indicators that capture the quality of care provided for patients. Patients experiencing an acute episode of illness may be treated by several services along a pathway. They may phone 111, see an out-of-hours GP, go to an ED and be admitted to hospital. The question we wish to ask is ‘how did the system perform for these patients? It is the performance of systems, that is the set of services which, operating sequentially or in parallel, manage the care of patients along the whole pathway, that matters to patients. System indicators are patient focused, in contrast to service indicators which are management focused. This change in focus from services to systems leads to different performance indicators. A rapid response by an ambulance which results in a patient arriving early at ED only for the patient to be left in the ambulance because there is no capacity in the ED is a system failure. The right indicator in this case might be some measure of the total time from first contact to definitive care. So our programme has been focused on the novel idea of trying to identify, calculate and evaluate some indicators of the performance of emergency and urgent care systems. The system in this sense is not a simple, easily defined entity of course. Different patients with different problems will be treated by different sets of services. Patient pathways will link many services together, often with no clear boundaries between sets of services. Some areas do have reasonably well defined ‘networks’ which organise a set of emergency and urgent care services, and it would be possible to identify patients treated by these networks, and look at indicators of these organisations. However, well- defined networks are the exception, not the rule, and simply substituting networks for services is not possible for nationally useful indicators. We have therefore chosen to use geographical, area-based indicators which reflect the quality of care of the services which together as a system provide care for the population of the area. The system might of course extend beyond the boundaries of a single area, but these population-based indicators are system and hence patient focused, and also answer an important question that commissioners of care for populations want answered. Instead of answering the question ‘which service is best’ they answer the question ‘which population is best served’. This section sets out the methods and results of the development of these indicators. Some important considerations in developing performance indicators for the emergency and urgent care system are set out first.
13

3.1.2 Sets of performance indicators There is a considerable literature on performance indicators, much of which is focused on what makes a good indicator and how to choose and develop indicators. Generally this literature sets out a number of different categories of quality, e.g. i) Types of indicator ii) Fitness for purpose iii) Performance characteristics of the individual indicators iv) Implementation and cost v) Statistical issues However, there is little discussion of the larger question of what makes a good set of indicators. No single indicator can assess the quality of a service or system. Consequently, a set of indicators must be used. What properties should this set have? We consider that the set should ideally be i) Inclusive - performance relevant to a wide range of patient groups
should be covered by the set of indicators. If some patients are excluded, then there is the possibility of distorting the system to focus only on those groups included. This is related to equity.
ii) Comprehensive - addressing several dimensions of performance, such
as effectiveness of services and care, appropriateness, equity, efficiency, safety and so on.1
iii) Co-ordinated - Indicators should work independently or with each
other, not against each other. For example including both the proportion of Traumatic Brain Injury patients treated in a neurosurgery centre and the total number of transfers could cause conflict.
iv) Parsimonious - Equally, a good set of indicators should avoid
unnecessary duplication (indicators that are measuring or indicating performance in the same area). An over-riding principle identified by the Royal Statistical Society working group on PIs is the need for parsimony.2
It is clearly not possible to meet all these criteria at the same time since, for example, inclusive and comprehensive are in direct conflict with parsimonious. 3.1.3 What is a good indicator Types of indicator Indicators and measures. One issue to consider in selecting types of indicator is the question of whether they are ‘indicators’ or ‘measures’. Indicators do just that, they are said to ‘resonate’ with performance and quality but may not be direct measures of it. For example, in emergency and urgent care one ‘indicator’ could be based on the number of attendances at an ED between 7am and midday on a Monday morning compared to the average numbers on other weekday mornings. There is known to be a Monday morning blip, which in itself does not matter, nor is it a ‘measure’ of anything. However, when it is high it might indicate poor access to the EUCS over
14

the weekend. It could be a measure that resonates with the quality and performance of the EUCS over the weekend. We take the view that measures are generally preferable and that the set of ‘indicators’ we choose for the EUC system performance should as far as possible actually measure aspects of the system performance which are important, and which if improved would indicate better performance. However, many aspects of performance, such as preventable or avoidable events, are not directly measurable and indicators have to be used. Outcomes. A second issue is what type of thing should be measured. Performance indicators can make use of outcomes, including patient satisfaction and acceptability, etc, as well as health outcomes; processes, including timings and activities as well as treatments; structures; and costs per unit of performance. Worldwide there is a 10-fold variation in survival rate from out-of-hospital cardiac arrest.3 Although part of this variation is no doubt due to differences in case-mix, definitions, ascertainment and data quality, it is very likely that the variation in outcomes also reflects considerable variation in system quality. Differences in first responder services, the availability of public defibrillators, bystander CPR, and quality of hospital and pre-hospital care, as well as geography and demography may all make a difference. A good system therefore is one which achieves good outcomes, but this should be judged in relation to the ‘inputs’. The number of deaths from out-of-hospital cardiac arrest matters from a public health perspective and may be a good indicator of the quality of the whole health care system, but it is the case fatality rate which focuses on the performance of the emergency care part of the system. A good system increases the chances of survival of someone who has an out of hospital arrest. However, the value of outcomes as performance indicators has been hotly debated.4,5,6 Outcomes have been criticised as a measure of the performance of services for two main reasons i) Outcomes depend on case-mix (i.e. inputs), and the case-mix is not identical
for different areas or institutions. Case-mix adjustment is sometimes thought to overcome this problem, but the ‘case-mix adjustment fallacy’5 and the ‘constant risk fallacy’7 seriously undermine this idea. However, this is less of a problem if the purpose of the indicator is not so much to compare systems, but to monitor progress within systems. Case-mix tends to change slowly within areas and short and medium term trends, or changes before and after the implementation of a new service or organisation model, say, may be assessed in a relatively bias-free way.
ii) Outcomes may be the result of the input of numerous technologies, services,
and clinical teams, and cannot necessarily be attributed to a single step along the care pathway. In emergency and urgent care the patient pathway typically involves several services such as telephone advice services, primary care, pre-hospital care, ED, hospital services, and other specialist services such as mental health or falls services. Indeed it is for this very reason that we are focussing on the evaluation of what we have termed the emergency and urgent care system rather than its component services. However, the same argument implies that outcomes may be an appropriate system performance measure, where the attribution is to the system not the component services.
15

There are other, important reasons for including outcomes in any set of indicators. Firstly, they focus attention on the main ‘prize’ and make sure that institutions, managers, clinicians and everyone involved in the system recognises what the system is there to achieve. Secondly, if processes of care were improving but outcomes were not, we would still be concerned. It would point to a flaw in the indicator set. Thirdly, if only processes are included we are left with the problem of how to assess overall performance. Some processes are more important than others and we might want to ‘weight’ these more highly. However, what we mean by ‘more important’ and how we judge this, is precisely by the importance of their influence on outcomes. Outcomes synthesise all the relevant processes and in proportion to their importance. It is true that they also represent a ‘black box’ which may leave us unable to determine what to do about poor performance. Nevertheless they are essential for monitoring performance and answering the question ‘are things getting better’. Processes. For many emergency and urgent health care problems, health outcomes are not known and performance must also be measured by processes of care and by the structures put in place to help those processes. The question then is which processes should be included in a performance assessment. The processes should be those that are clearly or evidentially related to outcomes that matter to patients. Ambulance response times could be included as a service measure as they are clearly related to survival rates; waiting times in ED are evidentially related to patient satisfaction, shorter times are always preferred over longer times. As illustrated by these examples one process measure which is usually an important indicator in emergency care is the time to certain events. By definition, in emergencies, and other things being equal, the chances of better outcomes are improved with shorter times to care. If this is not true, it is questionable whether the condition can be called an emergency. In urgent care the relevant measure may be more focused on time to access care but nevertheless the ‘time to’ is still an important measure of system performance from a patient perspective. Though as has recently been discovered, achieving short access times by restricting advanced booking is worse for some patients.8 So a good system is one which, other things being equal, minimises times to care and through the care pathway. However, this leaves a host of questions around which time limits are reasonable for which patient groups. Other types of indicator. A good system could also be argued to be one that is organised in an optimal way, so that, for example, facilities are close to patients, they are open when they’re needed, and they are appropriately staffed. So some ‘structural’ measures could also be included in assessing a good system. Finally, a good system should achieve the best outcomes, processes, and structures it can for the resources available. Good systems are efficient as well as effective. Fitness for purpose Indicators may be used for
1. performance assessment against external standards by commissioners, 2. performance monitoring against previous performance (as a quality
improvement tool) by the EUCS, or 3. they may be used for performance comparison in league tables for
information (eg. for the DH, or for patients) or for penalties or rewards (eg. for distribution of resources).
16

Indicators may be good for one purpose but not for the other. For example, case-mix sensitive measures may be no good for constructing league tables but may be good for monitoring change in performance within a system to help drive up quality. Some measures depend on factors which are not readily remediable (such as the location of an ED). These measures may be of little value in performance monitoring or assessment because they are not easy to remedy, but may be of importance for comparison. We have taken the view that EUCS indicators should be chosen with either performance assessment within a system in mind, to answer the question ‘is performance meeting standards’, or performance monitoring to determine the impact of changes, answering the question ‘is performance improving’. However, we are aware that any indicators that are chosen as part of a national indicators set will inevitably be used for league tables (and those league tables for penalties or rewards in one form or another). So the indicators must be as robust as possible against case-mix biases, and will need to be case-mix adjusted as far as possible. 3.1.4 What is a good emergency and urgent care system indicator? As well as adhering to general principles around the development of good PIs (see our 2009 interim report), there are some specific issues that are important for the EUCS. 1. System measures. They should be attributable (to some extent) to the performance of the EUCS as a system rather than to service performance. So, for example, response times for the Ambulance Service would not be appropriate. But in a system which used fire, police, community, and BASICS responders to medical emergencies as well as the Ambulance Service, time from call to first response on scene might be a good system performance indicator. Nevertheless, performance data from a service may still relate to the performance of the system or part of the system. For example, data from a service such as a walk in centre on inappropriate attendance points to faults in the system of services not the walk in centre. So some of the indicators that have been listed as candidate measures are based on local service specific data acting as ‘indicators’ rather than ‘measures’ of system performance. Using service specific data as a system performance indicator is appropriate if the measure depends on the performance of more than one service and if the data are used to monitor within system performance. Service specific data cannot usually be used to compare performance between systems. 2. Event rates. It is important that measures should not be open to gaming, (eg. by changing the time at which calls are said to have been received). One set of measures which are important in many fields including the EUCS, and which are partly susceptible to gaming are ‘case event rates’ such as case-fatality rates, or avoidable admission rates. Case-event rates can be reduced by increasing the denominator (identifying more ‘cases’) as well as by decreasing the numerator (fewer ‘events’). Nevertheless, because these are potentially very important measures we have included them in the candidate indicators. 3. Avoidable events. Remediable or avoidable event rates have been extensively used to assess system performance. For example, avoidable deaths have been used to compare trauma systems, whole health care systems, hospitals, etc; and
17

avoidable admissions to compare primary care services, HMOs etc. Although less widely used, “ambulatory-care-sensitive” conditions for which hospital admissions can be prevented by timely and effective ambulatory care have been identified in the US9,10, and also in the UK11 to look at preventable urgent admissions. Avoidability is of course a difficult concept to measure from routine data. We can distinguish three different ways in which events might be avoided (or prevented) - by preventing the disease (e.g. so that the person doesn’t have asthma at all) preventing the exacerbation or episode (so that the acute attack is prevented perhaps by optimum ambulatory care) and by preventing the urgent care event for the episode (such as hospital admission). Plainly for assessing urgent care systems it is the latter group of avoidable events that we are seeking to identify. Thus we are not looking for events which could have been prevented by preventing the disease or an acute episode resulting from the disease, but looking for events which could have been prevented by effective urgent care delivered at the right time and in the right place to a patient having an acute episode. Avoidable hospital admission is one of the goals for the urgent care system set out in the White Paper Our Health, Our Care, Our Say which focused the urgent care strategy on “significantly reducing unnecessary admissions to hospital”. Thus as well as potentially avoidable outcomes, avoidable processes might be used to monitor the performance of emergency and urgent care. We have focused on avoidable outcomes in serious emergencies, particularly death, and on avoidable processes such as admissions and transfers for urgent conditions. One of the principal criticisms of the Hospital Standardised Mortality Ratio is that avoidable deaths make up less than 10% of the total in-hospital deaths, so that the noise is too large for the indicator to pick up any signal12. One response to this is to focus on just a few conditions that are (relatively) ‘rich’ in preventability. Unfortunately this can create another problem by causing systems to focus only on those conditions, and ignore the performance of the system for the majority of patients. As we said earlier, as far as possible, a set of indicators should be inclusive. We have chosen to compromise between these two views. We have chosen quite large sets of emergency and urgent care sensitive conditions (30 in all) that together make up approximately 40% of the total number of emergency admissions. 4. Conditions which are relevant to emergency and urgent care. In order to examine avoidable events it is necessary to identify a set of conditions, such as MI, cardiac arrest, or mental health crisis, which present to the EUCS and in which a good performing system could manage to avoid some events judged to be undesirable, such as death or hospital admission. The 30 conditions we have identified are a set of 16 serious emergency conditions for which ‘emergency-care-sensitive’ events could be prevented by timely and effective emergency care and a set of 14 less serious urgent conditions for which ‘urgent-care-sensitive’ events can be prevented by timely and effective urgent care. Indicators such as case-fatality rates or admission rates can be calculated for each condition or for the whole set of conditions together. We prefer the latter approach as an overall indicator of performance, but at a local population level it may be necessary to calculate condition-specific indicators in order to ‘deconstruct’ the indicator, and remedy any problems. 5. Unnecessary contacts. One sub-group of ‘avoidable’ processes are those related to unnecessary contacts with services. For example, a good performing EUCS might be expected to avoid unnecessary attendances at A and E and unnecessary home
18

visits by OOH services, as well as unnecessary emergency hospital admissions. The Medical Care Research Unit has been involved in developing measures of unnecessary contacts with the EUCS for a number of years13,14 based on explicit criteria relating to whether the care received needed the level of service contacted. In this model, for example, a patient who made a face-to-face contact with a GP out-of-hours but received no treatment or investigation might be judged to have made an unnecessary contact. Unnecessary contacts may not be avoidable of course, and we have found, for example, that ED attenders who are suitable for care elsewhere often have strong reasons for attending ED.15 Thus we need to focus on identifying contacts with services which are avoidable in a good performing EUCS. This requires assessment of individual level patient records of contacts and care from services within the EUCS. Routine data has been successfully used for this to examine unnecessary ED attendances, but routine data from other services is more difficult to use because use of other services in the system for the same episode of ill health may be an important element of judging whether contact with a service was unnecessary and service datasets are not linked. 6. Recurrent users. Another group of potentially avoidable events relate to recurrent users of urgent care services – ‘frequent attenders’. For example, patients who attend ED and who are referred to social services, acute mental health services, community child health, or maternity services, but who re-attend at an ED within a few weeks may point to a ‘system’ failure. Patients who attend a walk-in centre and who are referred to other health or social services for appropriate care, but re-attend at the walk-in centre for the same problem within a short period of time may indicate problems with care or access elsewhere in the system. However, the only measure of recurrent use that was included in our final set of candidate indicators was re-admission to hospital for the same urgent condition within 7 days of discharge.
3.2 Methods
3.2.1 Developing the indicators
The methods used for developing the candidate indicators have been detailed elsewhere.1 In brief, we used a Delphi approach with the objective of identifying a set of indicators to enable commissioners in England and other NHS decision-makers to monitor and assess the performance of systems of emergency and urgent care for which they are responsible. Using a combination of Delphi RAND methods in three successive rounds of consultation, and nominal group review, we canvassed expert opinion on 70 potential indicators as good measures of system performance. The 70 indicators were drawn from a brief search of the scientific and policy literature for indicators that had been proposed or were being used in different fields such as pre-hospital care, mental health, and hospital admissions. We used two Delphi panels. Panel 1 consisted of 30 senior clinicians and researchers from a wide range of specialties and disciplines. Panel two consisted of 19 urgent care leads and commissioners in PCTs and Strategic Health Authorities (SHAs) who represented ‘indicator users’. The indicators were formatted into a questionnaire according to whether they were outcome, process, structure, or equity-based measures. Participants scored each indicator on a Likert scale of 1-9 and had the opportunity to consider their scores informed by the group scores and feedback. The questionnaire was refined after each round. To ensure that the indicators rated most highly by the Delphi panels covered all dimensions of performance, the results of the Delphi were reviewed by a nominal group consisting of two researchers and three clinicians from the local health services research network (LHSR).
19

Overall, the process yielded 16 candidate indicators (see Table 3.2.1). It also produced a core set of 16 serious emergency conditions for which death was considered to be potentially preventable by a well performing emergency care system, and 14 urgent care-sensitive conditions (defined as conditions whose exacerbations should be managed by a well-performing system without admission to an inpatient bed), for use with the indicators. These conditions are detailed in the results.
3.2.2 Evaluating the candidate indicators
In developing the indicators we asked our panels to ignore the question of whether data was currently available to calculate the indicators. We thought that the indicators should drive data collection rather than vice-versa. As a consequence we have only been able to calculate 6 of the 16 candidate indicators with the data available to us.
Indicators evaluated. We have calculated the first six indicators listed in Table 1, and for each indicator we have also examined variants. These variants have included standardised as well as crude indicators, time trends within PCT areas, and some comparisons between sub-groups. The general methods we have used to evaluate the indicators are explained below.
Indicators not evaluated. Six of the remaining 10 indicators related to time from first contact with the EUCS (e.g. by telephone call to NHS Direct or 111) to various events along the care pathway: clinical assessment, time of admission, time of initiation of definitive care. Unfortunately, we currently do not have linked service datasets available to measure these sorts of system processes which are so important in emergency and urgent care.
Indicator 7, adherence to guidelines, was also outside the scope of routine data analysis. Clinical processes covered by guidelines such as the proportion of suitable strokes thrombolysed, or the proportion of heart attacks taken directly to coronary care units need clinical registries. They are also often focused on care provided by a single service rather than the system of services, and they are focused on single clinical conditions. As we have said earlier, we advise against indicators based on single conditions, because of the risk of distorting care priorities to improve the management of conditions that are in the indicator at the expense of other conditions.
Indicator 8, multiple transfers between EUCS services also needs linked service data. One part of this, multiple transfers between acute hospitals, could have been calculated using HES and HES A&E data. Pathways involving three or more hospital sites, for example, may point to sub-optimal patient management. We have not been able to calculate this type of indicator because our HES datasets do not include hospital site. However, although we have not reviewed this here, as an area-wide measure of system performance this remains an unexplored indicator which could be important to the configuration of acute hospital services, especially in conditions such as serious trauma, heart attacks, and stroke, where specialist care is known to be beneficial if delivered early.
The structural indicator (12) describing ease of access to emergency and urgent care services also depends on data we do not have, though again SHAs might well have information on access times and locations of services, and public health Observatories could examine these geographical data.
20

Table 3.2.1 Candidate performance indicators for the emergency and urgent care system Outcomes based indicators
1. Mortality rates for serious, emergency, conditions for which a well-performing EUCS could improve chances of survival.
2. Case fatality ratios for serious, emergency conditions for which a well-
performing EUCS could improve chances of survival. Process based indicators
3. Hospital emergency admission rates for acute exacerbations of urgent conditions that could be managed out of hospital or in other settings without admission to in inpatient bed.
4. Arrivals at EDs referred by any EUCS services and discharged without treatment or investigations(s) that needed hospital facilities.
5. Arrivals at EDs referred by emergency ambulance and discharged without
treatment or investigations(s) that needed hospital facilities.
6. Proportion of admissions for urgent care conditions resulting in emergency re-admission within 7 days of discharge.
7. Adherence to evidence-based good practice guidelines for serious,
emergency and urgent conditions.
8. Multiple transfers between EUCS services.
9. Time from first contact with a EUCS service to clinical assessment.
10. For patients with urgent conditions who are admitted to a hospital bed, time from first contact with a EUCS service to time of admission.
11. Time from first contact with EUCS service to definitive care
Structural indicator
12. Proportion of population living within 10 kilometres of emergency or urgent care facilities open for more than 12 hours per day and 7 days per week.
Equity indicators
13. Relative case fatality ratios between all contacts with EUCS services for serious emergency conditions between sub-populations
14. Variations in times from first call to any EUCs service for SEC or urgent
conditions and clinical assessment, by sub-populations, time of day, day of week
15. Variations in times from first call for any EUCs service for SEC or urgent
conditions and admission, by sub-populations, time of day, day of week
16. Variations in times from first call to definitive care for SEC, by sub-populations, time of day, day of week
21

Lastly, we had a candidate indicator looking at relative case fatality ratios between groups, such as in hours and out-of-hours, weekdays and weekends,2,3 and different geographical areas. This set of indicators can’t be calculated for time based comparisons because there is no record of the time at which the incidents occurred. However, for some of the other indicators these ‘equity’ comparisons can be made, and we have compared urgent admission rates on weekdays and weekends as well as unnecessary attendance rates in- and out-of-hours. Relative case fatality ratios can be calculated for different geographical resident populations, and this is what we have done when comparing the 152 English PCTs. These comparisons could also be made within PCTs, so that PCTs can examine whether the system appears to be equally effective for residents of different communities. We think that any indicators adopted for national use should be analysed in this way by the networks responsible for delivering emergency and urgent care to see whether you are more likely to be admitted, readmitted, die, attend unnecessarily etc if you live in some communities than others.
Methods of evaluation. For each of the six indicators we have evaluated, we have
1. Calculated the indicator for all the 152 English PCT resident populations in order to clarify any fuzziness in how this should be done
2. Compared standardised and crude indicators to examine the need for standardisation
3. Looked at different methods of examining trends to see if simple change indices are adequate
4. Looked at stability over time to ensure that the indicator is picking up some underlying signal
5. Calculated funnel plots to see if the indicator identifies out-of-control performance
6. Mapped the indicator to look for spatial patterns indicative of system wide performance
Further details about these methods are given in the results sections below. The results are presented in three sections relating to mortality (indicators 1 and 2), urgent admissions and readmissions (3 and 6), and unnecessary attendance at ED (4 and 5). A draft specification for each of the six indicators and their variants has been appended to each of the sections.
22

3.3 Results: mortality indicators
3.3.1. Introduction
A Delphi exercise1 identified two indicators relating to mortality from serious emergency conditions which were considered to be candidates for judging the performance of an Emergency and Urgent Care System (EUCS). These were
i) the population mortality rate (PMR) ii) the case fatality ratio (CFR)
These two indicators were to be used with a set of 16 serious emergency conditions from which the panel judged death could sometimes be avoided by a well performing emergency care system. Methods of calculating these indictors and investigating their usefulness, and the results of the investigations are set out below.
3.3.2. Mortality data
Mortality data for all deaths recorded for residents of PCTs in England for the period from April 2006 to March 2009 were obtained from ONS. The data included
• date of death • ICD-10 code for underlying cause of death and secondary cause
detailing the injury for those deaths with an external cause • PCT of usual residence • age in years at death • sex
All deaths whose underlying or secondary cause was one of the conditions identified by the Delphi panel for use with the emergency mortality indicators were then selected. The conditions and the total numbers of deaths in our ONS files are shown in Table 3.3.1. It will be seen that more than two-thirds of these deaths arose from strokes and heart attacks, and that the number of deaths recorded for the 16 emergency conditions has been declining steadily over this three year period from 89,769 in 2006/7 to 83,414 in 2008/9.
23

Table 3.3.1. Deaths from emergency conditions used in the indicators analysis by financial year
Condition ICD10 codes Financial Year of Death
20067 20078 20089
Total (Col %)
272 293 248 813Falls <75 NEC W00-W19
0.30%
1898 1761 1288 4947RTAs NEC
V0-V7; V80.2-V80.5; V82.1; V83.0-V83.3; V84.0-V84.3; V85.0-V85.3; V86.0-V86.3; V87.0-V87.8; V89.2 1.90%
2863 2924 2776 8563Fractured NOF S72
3.30%
2859 2830 2633 8322Serious head injuries S02-S09
3.20%
1310 1271 1211 3792Self harm NEC X60-X84
1.50%
72 86 82 240Cardiac arrest I46
0.10%
30294 28144 26667 85105AMI I21-I23
32.80%
7502 7798 8212 23512Acute heart failure I50
9.10%
31198 29584 29229 90011Stroke I61; I62.9; I63; I64
34.70%6433 6292 5976 18701
Ruptured AA I71.0; I71.1; I71.3; I71.5; I71.8 7.20%
1009 959 1022 2990Asthma J45-J46
1.20%
51 41 42 134Pregnancy and birth related O00-O99
0.10%
123 144 133 400Meningitis G00-G03; A32; A39
0.20%24 25 28 77
Anaphylaxis T78.0; T78.2; T80.5; T88.6 0.00%
2205 2052 1995 6252Septic shock A40; A41
2.40%
1656 1803 1872 5331Asphyxiation R09.0; T71
2.10%
89769 86007 83414 259190Total
34.63% 33.18% 32.18% 100%
24

3.3.3 The population mortality rate (PMR)
Crude PMR
The crude mortality rate for residents of each of the 152 PCTs in England has been calculated from the total number of deaths from the emergency care sensitive conditions over the period 2006/7 – 2008/9 per thousand PCT population per year using the 2007 midyear PCT resident population.
Standardised PMR
The population mortality rates are highly dependent on the age distribution of the PCT population (sex plays a small and negligible role: 51% of both the emergency condition deaths and the PCT population of England are women). We have therefore also calculated age standardised rates. For comparing PCTs or area networks direct standardisation should be used whenever possible2. Directly age-standardised rates have been computed using the European standard population (see Table 3.3.2).
Table 3.3.2 Weights used for direct age standardisation
Age Group European weight
PCT Population
0 – 4 0.08 0.06 5 – 14 0.14 0.12 15 – 44 0.42 0.42 45 – 64 0.25 0.25 65 – 74 0.07 0.08 75 – 84 0.03 0.06
85+ 0.01 0.02
Trends
Another set of indicators that can be used to monitor performance within EUCS are the year-on-year trends in the indicators. For the standardised population mortality rates we have calculated the ‘trend’ in deaths from the emergency care sensitive conditions.
Trends in SPMRs have been calculated by regressing the SPMR on year of death. We have also tried a simpler approach to monitoring changes in performance by calculating the SPMR in year 3 (2008/9) as a proportion of the average SPMR in the two previous years, and comparing this simple indicator with the trend estimated from the regression coefficient.
3.3.4. Case-fatality Ratios (CFRs)
Because mortality rates depend on the incidence of cases as well as the risk of a case dying, a better measure of system performance, directly related to the risk, is the case-fatality rate. This is the proportion of incident cases that die. Unfortunately, we have no data on the number of incident cases and their outcomes. So we have calculated case-fatality ratios rather than rates.
25

The CFRs are simply the ratio of the number of deaths from the set of emergency conditions in a defined population in a defined time period to the number of incident cases in that time period and population. These are not deaths in these incident cases, but deaths in the same population and time period. The deaths may actually relate to incident cases from an earlier time for example.
We have defined the incident cases for the denominator of the CFR as the number of patients that were either admitted as emergencies for two or more days as an inpatient or who died. Using admissions with a length of stay of 2 or more days means that differences between populations in Trust admission policies which could have a considerable bearing on the number of short-stay admissions should be avoided.
We have focussed only on serious emergency conditions using the 16 clinical categories identified by our Delphi panel as those that could potentially be avoided by a good performing emergency care system. Then for each condition, and for residents of each English PCT, we have calculated the number of deaths during the period of interest (2006/7,2007/8 or 2008/9) using ONS mortality data. We have also calculated the number of residents of the PCT admitted to any hospital for one of these conditions during this period who, after staying for 2 or more days were discharged alive. This criterion was based on the discharge destination field in the HES data.
The CFR has then been calculated as the ratio of the number of deaths in the period of interest to the number of deaths plus admissions discharged alive in the period of interest. Clearly refinements to this simple indicator of could be made. For example, the double counting in the denominator of deaths post discharge could be avoided. Further analysis using linked ONS mortality and HES data is shown in Appendix A.1.
Analysis of CFRs
We have first calculated the CFR for all conditions in 2006/7, 2007/8 and 2008/9 together and the variation in these ratios has been examined and mapped (for 2008/9).
The CFRs have then been standardised. The CFRs are very strongly dependent on condition and age but not sex. With 16 conditions and several age groups the numbers available for calculating age-condition specific CFRs in some PCTs are very small and often zero. In these cases direct standardisation is not possible and so we have calculated indirectly standardised CFRs.
The indirectly standardised CFRs (SCFRs) have simply been calculated from the ratio of the observed number of deaths to the expected number. The expected number can be calculated either by applying an age-condition specific ‘standard’ Ratio to the observed number of deaths + admissions occurring in a particular period in a particular PCT or by using a logistic regression of outcome (death or surviving admission) on age and condition. The two methods give similar results3 and though the former would be the most useful approach for PCTs to use in practice, for convenience we have used the latter here. We have then calculated the SCFRs for each PCT for each year and examined and mapped the variation in these.
26

3.3.5 Other analyses of indicators
Descriptive statistics
The crude and standardised PCT emergency condition mortality rates and CFRs have first been graphed to show range and variation, using simple histograms. The crude and standardised indicators have also been compared to examine the need for standardisation.
Stability
We have next examined whether these indicators are sufficiently stable from one year to the next within PCTs to suggest that they are reflecting systematic rather than random variation. We have done this by calculating simple (Spearman) rank correlations between indicators between years.
These rank correlations show the extent to which a PCT’s ‘league table’ position is consistent over time. Low correlations would suggest that indicators should not be compared between PCTs and conversely high correlations that the ranked position reflects an underlying systematic effect. Of course this effect could be due to systematic differences in the quality of data, for example differences in coding causes of death between PCTs, rather than differences in the quality of care.
Funnel plots
The amount of random variation in both the mortality rates and the CFRs is a function of the size of the PCT, which can be indicated by the size of the PCT population or the number of deaths. We have therefore also calculated ‘control limits’ for the SPMR and the SCFR and have constructed funnel plots using 97.5% and 99.8% limits to examine whether there is any evidence that the indicators can pick up unusual performance (Methods are described in Appendix A.2).
Geographical patterns
The mortality indicators, like the other indicators we are examining, are based on the PCT of residence of deaths. We have used PCT of residence to enable PCTs responsible for commissioning services for the emergency and urgent care of their residents to monitor and compare how well the services are performing for their residents. However, the services we are interested in ‘indicating’ are provided by systems which often extend across geographical boundaries. It may therefore be helpful to geographically ‘map’ the indicators to see whether there are areas with consistent performance which indicate wider system performance. We have mapped the mortality based indicators using quintiles of the rates to examine whether this type of geographical analysis could pick up area-wide performance. We have also mapped the level of deviation from the mean rate/ratio in terms of the number of standard deviations from the mean, this will help show any geographical pattern of PCTs which have admission rates which are 'out of control'.
3.3.6 Results
PCT population mortality rates
Crude PMRs
The PCT population emergency conditions mortality rates for 2006/7 to 2008/9 ranged from 77.4 per 100,000 to 266.9 per 100,000 per year (Figure 3.3.1). Even
27

ignoring the outlying value there was over a three-fold variation in the crude mortality rates.
Figure 3.3.1. Crude population mortality rate from emergency conditions per 100,000 per year
Crude PMR per 100,000 per year
Standardised PMRs
Direct age-standardisation of the PMRs substantially reduced the variation (Figure 3.3.2). Ignoring the single outlying value there was only a two fold difference between PCTs. Furthermore age standardisation changed the ranking of the PCTs
with only a moderate correlation (Spearman s=0.401) between the crude and
standardised ranks (Figure 3.3.3). Clearly standardisation is essential if this is to be a useful indicator.
Figure 3.3.2. Directly age standardised Figure 3.3.3. Comparison of crude and PMR for emergency conditions standardised PMRs
Cru
de
PMR p
er 1
00,0
00 p
er y
ear
Age Standardised PMR per 100,000 per year
Age Standardised PMR per 100,000 per year
28

Trends in standardised PMRs
Trends in SPMRs were estimated by regressing the SPMRs on year for each PCT. The resulting coefficients are shown in Figure 3.3.4 and it will be seen that there was a small decline on in the average SPMR across all PCTs over this three year time period. This was quite consistent between PCTs with only a small number of PCTs showing an increase. These regression coefficients for the trend have been compared with the % change in the SPMR between 2008/9 and the average of 2006/7 and 2007/8 (Figure 3.3.5). As would be expected a clear correlation is evident and the Spearman correlation in ranked position (p=0.854) suggests that calculation of the simple % change in the SPMR from one year to the average of the previous three could provide an excellent indicator for monitoring changes in performance. The average rate from the past two years was calculated from the mean of the SPMR from 2006/7 and 2007/8. Using the standardised rate from these two years combined was also considered, however no difference between this and the mean of the two rates was found, suggesting the simpler method is sufficient to monitor changes over time (result not shown).
Figure 3.3.4. Trends in standardised PMRs, Fig 3.3.5. % change in SPMR 2008/9 to 2006/7-2008/9 2006/7 – 2007/8 compared with Trend coefficient
-
Chan
ge
from
2006/7
and 2
007/8
to
2008/9
(%
)
Change in standardised PMR per 100,000 per year
Change in standardised PMR per 100,000 per year
Stability of standardised PMRs
We have calculated a standardised PMR for each of the three years 2006/7 – 2008/9 and Table 3.3.5 shows the Spearman rank correlations of these SPMRs between the years. It will be seen that the rank correlations are large indicating stability over time.
Table 3.3.5 Spearman rank correlation of 152 PCT SPMRs between years.
Year 2006/7 2007/8 2008/9 2006/7 1.00 0.88 0.89 2007/8 1.00 0.91 2008/9 1.00
29

Funnel plots
A funnel plot for the directly age-standardised PMRs for all three years combined is shown in Figure 3.3.6. It will be seen that making an empirical estimate of the dispersion, the funnel plot shows that all the PCT SPMRs are within the upper 99.8% control limit, although there are four above the 97.5% limit. These data suggest that the age-standardised rates could be used to identify any areas that were ‘out of control’.
Fig 3.3.6. Standardised PCT population emergency condition PMRs per 100,000 per year shown with 97.5% and 99.8% adjusted control limits
Geographical mapping
The crude PCT population mortality rates have been mapped in Figure 3.3.7a and reveal a striking degree of spatial organisation. Neighbouring PCTs are more likely to have similar PMRs than more distant PCTs. It is also apparent that London and the South East, and particularly the M4 corridor, have lower PMRs than elsewhere except in coastal PCTs. This pattern probably reflects two effects, the better age-specific health found in the South and South East, and retirement to coastal PCTs.
Direct age-standardisation of the PMRs (Figure 3.3.7b) shows a similarly well organised spatial pattern, but completely different to that for the crude PMRs. The SPMRs show low mortality rates across the whole of the South and East, including the coast, with the exception of some parts of London. In contrast high rates are seen consistently across parts of Birmingham and the Midlands and across many areas of Northern England stretching from Liverpool to Humberside.
30

Fig 3.3.7 Crude (7a) and standardised PMRs (7b) and deviation from the mean SPMR (7c) for English PCTs,2006/7-2008/9 3.3.7a 3.3.7b 3.3.7c
31

Case fatality ratios
The patterns in SPMRs could reflect either disease incidence or system performance and case fatality rates which reflect the risk of dying in an incident are theoretically better able to pinpoint system performance.
Crude CFRs
The crude case fatality ratios for the years 2006/7 to 2008/9 for all 16 emergency conditions together for the 152 PCTs are shown in Figure 3.3.8. The crude CFRs vary from 115.4 to 325.0 per 1000 in 2006/7, 110.1 to 298.4 per 1000 in 2007/8 and 111.7 to 266.7 per 1000 in 2008/9. Ignoring the outliers the variation in crude ratios is around two-fold in all years (the extreme outlier in 2006/7 is Milton Keynes PCT which has had a problem with the HES data).
Fig 3.3.8. Case fatality ratios for 2006/7 to 2008/9 by PCT
Deaths per 1000 serious incidents
Standardised CFRs
These ratios are highly dependent on the case-mix because the CFR for the 16 conditions are very different, varying from just over 0% for falls in persons <75 years old and pregnancy and birth related admissions to nearly 90% for ruptured aortic aneurysms and asphyxiation (see Table 3.3.6).
32

Table 3.3.6 Number (%) of deaths and survivors by emergency condition
Status Condition Alive Dead Total
Count 163530 813 164343Falls <75 NEC
% Within Condition 99.5% .5% 100.0%
Count 53577 4947 58524RTAs NEC
% Within Condition 91.5% 8.5% 100.0%
Count 165832 8563 174395Neck of Femur Fracture
% Within Condition 95.1% 4.9% 100.0%
Count 58411 8322 66733Serious Head Injuries
% Within Condition 87.5% 12.5% 100.0%
Count 56935 3792 60727Self Harm
% Within Condition 93.8% 6.2% 100.0%
Count 2455 240 2695Cardiac Arrest
% Within Condition 91.1% 8.9% 100.0%
Count 161161 85105 246266AMI
% Within Condition 65.4% 34.6% 100.0%
Count 111125 23512 134637Acute Heart Failure
% Within Condition 82.5% 17.5% 100.0%
Count 125350 90011 215361Stroke
% Within Condition 58.2% 41.8% 100.0%
Count 3409 18701 22110Ruptured AA
% Within Condition 15.4% 84.6% 100.0%
Count 89001 2990 91991Asthma
% Within Condition 96.7% 3.3% 100.0%
Count 95333 134 95467Pregnancy And Birth
Related % Within Condition 99.9% .1% 100.0%
Count 5108 400 5508Meningitis
% Within Condition 92.7% 7.3% 100.0%
Count 1134 77 1211Anaphylaxis
% Within Condition 93.6% 6.4% 100.0%
Count 31793 6252 38045Septic Shock
% Within Condition 83.6% 16.4% 100.0%
Count 717 5331 6048
Asphyxiation
% within condition 11.9% 88.1% 100.0%
Count 1124871 259190 1384061Total
% within condition 81.3% 18.7% 100.0%
33

We have therefore (indirectly) standardised the CFRs for age and condition case-mix. The variation in the SCFRs is less than in the crude ratios (Figure 3.3.9) and there is
only moderate correlation (ρs = 0.73, 0.76 and 0.74 for 2006/7, 2007/8 and 2008/9
respectively) between the ranked position of a PCT on the crude indicator and their ranked position on the standardised indicator (Figure 3.3.10). This underlies the importance of standardisation of this indicator.
Fig 3.3.9. Standardised case fatality ratios for 2006/7 - 2008/9 by PCT
Ratio of observed to expected
deaths
Figure 3.3.10. Comparison of crude and standardised CFRs.
Figure 10a. 2006/7 Figure 10b. 2007/8
Ratio of observed to expected deaths
Ratio of observed to expected deaths
Dea
ths
per
1000 s
erio
us
inci
den
ts
Dea
ths
per
1000 s
erio
us
inci
den
ts
34

Figure 10c. 2008/9
Dea
ths
per
1000 s
erio
us
inci
den
ts
Ratio of observed to expected deaths
Stability of the standardised CFRs
The standardised indicators also appear to be reasonably robust. Table 3.3.7 shows moderate correlation from one year to the next. This data is based on all 152 PCTs. However, some of these PCTs exhibited unexpectedly large variation from year to year in the number of admissions, possibly pointing to coding problems. Excluding these PCTs the correlation is higher.
Table 3.3.7. Comparison of standardised CFRs between years
Year 2006/7 2007/8 2008/9 2006/7 1.00 0.72 0.74 2007/8 1.00 0.71 2008/9 1.00
Funnel plots
Funnel plots for the indirectly standardised CFRs for 2006/7, 2007/8 and 2008/9 are shown in Figure 3.3.11. The funnel plots suggests that there are a number of PCTs whose SCFRs are ‘out of control’ though the spread of values above the upper limit and below the lower limit suggests that some of this is natural ‘over-dispersion’ that hasn’t been allowed for in the control limits. PCTs that have SCFRs above the control limit in 2006/7 have been highlighted so that they can be followed over time. It can be seen that the majority of PCTs return within the limits over time. However, there are three PCTS which remain ‘out of control’ and warrant further investigation. One PCT has been highlighted that was more than 6 standard deviations above the mean in 2006/7 but had returned to normal by 2008/9. This is S.Staffordshire which is served by the mid-Staffordshire hospital. This indicator has exactly picked up the performance identified by the far more complex and disputed Dr Foster approach4.
35

Fig 3.3.11a. Standardised CFR and control limits 2006/7
Fig 3.3.11b. Standardised CFR and control limits 2007/8
Fig 3.3.11c. Standardised CFR and control limits 2008/9
Geographical mapping
The crude and standardised case-fatality ratios for 2008/9 alone have been mapped in Figure 3.3.12 and as with the PMRs reveal a considerable degree of spatial organisation. Figures 3.3.12b and 3.3.12c showing the SCFR and the number of winsorised* standard deviations from the mean SCFR show two ribbons of high case fatality rates running from west to east across the North and across the South Midlands. *a process of truncating extreme values12
36

Fig 3.3.12 Crude (12a) and standardised CFRs (12b) and Deviation from the mean SCFR in English PCTs, 2008/9
3.3.12a 3.3.12b 3.3.12c
37

3.3.7 Discussion of mortality indicators
Outcome indicators
This report has examined the construction and performance of two candidate indicators for monitoring the performance of the emergency and urgent care system. Both are focused on emergency care and have used outcomes, in this case, death, rather than processes. The use of outcomes, and particularly death, to measure performance has been criticised in the past because outcomes are the result of many processes and inputs and so may not be helpful in indicating where problems lie5 and avoidable deaths are uncommon.6 Mortality outcomes in particular are heavily dependent on case-mix characteristics (particularly the patient diagnosis and age), whilst processes such as whether the best care was provided have no such dependency. The consequence of this case-mix dependency for outcomes is that case-mix adjustment is needed before any useful comparisons can be made, and case-mix adjustment is often built on two fallacies that have been shown, for example, to invalidate the standardisation of hospital mortality rates.7,8 There are three counter arguments to be set against these concerns.
1. Outcomes are not sufficiently discerning. It is precisely because outcomes do depend on the input of many processes often provided by several services at different times that they may be helpful indicators for the performance of systems (rather than individual services or institutions or teams). For example, survival from a heart attack may depend on levels of community skill in CPR, access to community defibrillators, ambulance service response times and paramedic training, access to ED and specialist coronary care, and post-discharge primary care support. It is the quality of the processes provided by this system of care that we are seeking to indicate, and outcome measures such as survival synthesise all these elements. Furthermore, they synthesise all the elements in exact proportion to their importance to the outcomes.
2. Outcomes are too dependent on patient inputs. Outcomes are clearly dependent on patient inputs (the patient characteristics) as well as processes of care, and hence the case-mix must be taken into account before outcome indicators can be used to make valid comparisons of the quality of processes of care between systems. We have standardised the population mortality rates for age, and the CFRs for age and emergency condition, but clearly there may be other inputs which are important and have not been adjusted for (the case-mix fallacy9) and the factors that have been adjusted for may not mean the same thing in the areas being compared (the constant risk fallacy10). For example, if the same age carries a different risk in different areas all other things being equal, or the same conditions are coded differently in different areas, then the adjustment or standardisation will not work. We acknowledge the importance of these problems and they imply that both crude and standardised indicators should be used to make comparisons between areas with considerable caution. In particular, indicators should not be treated as measures of performance and corroboration should always be sought. Nevertheless, within area comparisons, that is trends or changes, are relatively free of any of these problems and they may reliably be compared between areas to examine which areas are improving the least for example.
3. Is mortality a good outcome? Although we are concerned to develop indicators for the EUCS as a whole, we think that this can only be achieved by a set of indicators which together are comprehensive, and mortality is just one component of this set. The mortality based indicators we have focused on here
38

are only relevant to the emergency care system of course. We have included all deaths – pre-hospital, in-hospital, and post-hospital. There is an argument that later deaths post discharge or more than 7 or 30 days after the incident, for example, should be excluded so that the outcomes are more closely focused on the acute, emergency phase of care. We have explored the effect of excluding late deaths (see Appendix A.1) but it makes almost no difference to the case fatality ratios. Since there are strong arguments in favour of simplicity in the calculation of indicators, we would recommend just using total mortality occurring in the period of interest.
Population mortality rates
The PMR is straightforward to calculate, can be directly standardised (which is preferable for making between area comparisons), was not found to depend on the standardisation weightings used (not shown here), was stable over time although changes took place, and after making an empirical estimate of the dispersion the funnel plots suggested that there are no PCTs ‘out of control’. However, the geographical maps clearly show the well known persistent pattern of poorer results north of the line joining the Bristol Channel to the Wash. This line does not reflect quality of care of course, just differences in population health. This suggests that the SPMR is too dependent on the incidence of the emergency conditions to be used in isolation as a quality of care indicator. However, we believe it is a useful measure to help interpret the SCFR.
Case Fatality Ratios
We have calculated the CFRs as the ratio of deaths to serious incident cases, defined as deaths plus admissions for the same condition staying in hospital for two or more days. We have chosen two or more days in order to avoid confounding by differences in admissions policies for patients needing observation. The CFRs for the 16 emergency conditions we have focused on differ greatly and adjustment for case-mix is essential. The case-mix adjustment has had to be carried out using an indirect method because the numbers of deaths and admissions in some PCTs in some age groups for some of the rare conditions included in our set are zero. Indirect standardisation does mean that some extra caution is needed in making between area comparisons.2
The standardised CFRs were straightforwardly calculated as the ratio of the observed number of deaths to the expected number if some standard age-condition specific CFR had applied to the actual number of deaths and admissions in the PCT. These CFRs were also found to be sufficiently stable between successive years to suggest that they are picking up some underlying systematic effect. Calculation of the control limits for the funnel plots required an estimate of the year to year variation in the difference between the observed and expected number of deaths (see Appendix A.2). Even with this empirical estimate the funnel plots suggest that there is some additional, though perhaps natural, dispersion. However, residents of a number of PCTs seem to have had persistently unexpectedly poor outcomes over the three years we have studied and these would warrant investigation. One PCT with poor performance that didn’t persist and was found to have markedly improved over time from 6.64 SDs above the mean in 2006/7 to just 0.37 in 2008/9 was South Staffordshire. The residents of this PCT are primarily treated in Mid Staffs NHS Trust for their emergencies, and the performance of this Trust has been shown to have followed exactly this pattern.4
There are two particular problems with the CFRs as we have calculated them here. First patients who are admitted to hospital for more than two days and who are discharged alive and then subsequently die are double counted in the denominator of the ratio – first in the ONS deaths and then in the HES admissions. Second the late deaths may occur many months after the initial incident and these deaths are decreasingly likely to reflect the quality of emergency care.
39

Both these problems can easily be solved using the linked HES/ONS dataset, and we have used the linked ONS data recently supplied to us to investigate whether the double counting has affected the results and the potential impact of omitting deaths (see Appendix A.1). The results show that the double counting has had no impact at all and the results presented here can be taken as showing the true CFRs. Excluding late deaths also makes no difference.
Identification and investigation of outliers
Because PCTs vary considerably in size, event rate indicators vary in reliability between PCTs. This in turn means that identifying exceptional performance must allow for this variable reliability. The recommended way of doing this is to use funnel plots with control limits set at +/- 2 or 3 standard deviations (SDs) from the expected ‘normal’ value11. The calculation of these SDs and hence the limits is, however, tricky. There is considerable over dispersion, that is the SDs are much larger than would be expected from theoretical distributions. This means that empirical estimates of these SDs must be made, but these estimates are made using the data which may contain outliers that we wish to detect. We have followed a recommended approach to this by ‘winsorising’ the data (a process of truncating extreme values)12, but at an arbitrary 20% level.
Together this means that identification of outliers must be treated with caution and investigated with care. We think that four questions need to be asked before identifying an area as having outlying performance.
i) Does the exceptional performance persist over time? ii) Is it sensitive to the methods used? Is it sensitive to how the standardisation is
carried out or the weightings used for example? Is it sensitive to how the control limits are calculated?
iii) If the indicator is a ratio, is there evidence that the problem is with the numerator and not with an unexpectedly small denominator? For example, for CFRs are we sure that there is an excess of deaths (that is a relatively high PMR) not a deficiency of admissions?
iv) Is there any corroborating evidence from related indicators. For example, is there evidence of problems with any of the process indicators such as time from 999 call to definitive care or multiple transfers.
3.3.8 Conclusions for mortality indicators
The standardised case fatality ratios we have calculated show good temporal stability, geographical patterns consistent with system wide performance, and the ability to pick out areas with known or suspected performance problems. When they are corroborated by high population mortality rates it is likely they are indicating quality of care.
40

3.4 Results: Urgent Care Sensitive Condition Admission and Re-admission Rates
3.4.1. Introduction
The Delphi exercise to develop a set of candidate indicators for monitoring the performance of Emergency and Urgent Care Systems (EUCS) identified a set of 14 urgent care sensitive (UCS) conditions to be used as potential indicators.1 Emergency admission for these conditions was judged to be sensitive to the availability and quality of urgent care. The emergency admission rates for these conditions for PCT resident populations can be calculated from HES admission data and ONS population data. Methods of calculating these indicators and investigating their usefulness, and the results of the investigations are set out below.
The use of emergency re-admissions as an indicator is also considered below. This data has often been used for monitoring system performance and has been explored here as a measure of EUCS performance. The rationale for this is that emergency re-admissions a short time after discharge suggest something has gone wrong with the process of care. For example, discharging the patient too early before the community services available to the population are able to manage the patient.
The National Centre for Health Outcomes Development (NCHOD) has analysed and published data on emergency re-admissions for any cause within 28 days of discharge since 1998/9. However, during the Delphi exercise it was thought that a readmissions indicator for monitoring UCS conditions should focus on a short interval between discharge and re-admission in order to focus more clearly on the likelihood that the discharge was not appropriate. It was also felt to be more appropriate to focus on patients re-admitted for the same problem as their original admission, that is one that was clearly known about and being treated, as this type of re-admission suggests that a known problem may not have been adequately managed in the first instance.
This differs from the NCHOD approach where calculations include all re-admissions whether or not the re-admission is for the same condition as the original admission. The argument in favour of using re-admission for any condition is that it is difficult without individual clinical review to identify which conditions are related to each other. However, re-admission for the same condition as the index admission is certainly related and points to a possible failure of care either in the hospital or in the community. We have therefore used as our indicator:
Emergency Re-admission within 7 days of discharge for the same urgent condition as the index admission.
3.4.2 Methods
HES data
HES data on finished consulted episodes (FCE) for all emergency admissions were acquired for 2004/5 to 2008/9. However, we have only analysed data in this report for the period since the last major PCT boundary revisions, that is for 2006/7 to 2008/9. The length of stay for each spell of care was calculated and appended to the record of admission FCE. The first FCEs were selected so that there would be only one record per patient spell (though the same patient may appear more than once in the data).
41

Area of analysis
We have calculated admission rates for PCT populations for reasons outlined in section 3.1.1. Other geographical areas, defining resident populations, such as groups of PCTs representing EUC networks, or GP consortia areas could be used of course.
Excluded data
Within the data set 111,852 admission FCEs were excluded for one or more of the following reasons: they were admitted prior to 2006/7 (19,095 admission FCEs), had an unknown discharge date (32,175), were of unknown gender (290), had missing age (4,167) or were resident outside of England or had an unknown PCT of residence (54,461). A further 8,561 FCEs were judged to be duplicate episodes (defined as matching HES id, admission date, discharge date, main speciality and episode order) and were excluded; the episode with highest episode identifier was retained.
PCTs included in the analysis
Variation in the number of admissions over the three years of analysis was investigated to make sure that the HES counts of admissions were being consistently recorded for the same population. To do this, for each PCT the square root of the annual HES count of urgent condition admissions for residents of the PCT were regressed on year of admission. The square root of the sum of the squared standardised residuals was calculated as an index of unreliability. Figure 3.4.1 shows that 13 PCTS were outliers using this index. However, after further investigation they were included in the analysis as the year on year variation was not judged to be extreme (Table 3.4.1) so that all 152 PCTs within England (using boundaries current for 2008/09) were included in the analysis. Since 2008/09 there have been changes to the boundaries of PCTs in England which came into effect in April 2010.
Fig 3.4.1 Box plot showing outliers* with respect to variability of their annual admission numbers.
* Potential outliers are PCTs with values <(lower quartile – 1.5 x IQR) or >(upper quartile + 1.5 IQR).
42

Table 3.4.1 Urgent admissions by year by PCT of residence for 13 PCTs examined for unreliable data
Year of admission
PCT Name 2006/7 2007/8 2008/9
Barnet PCT 5318 4023 5544
Bedfordshire PCT 5807 5729 7092
Coventry Teaching PCT 7007 5957 6759
Derby City PCT 5442 5058 6037
Enfield PCT 5566 3790 5102 Isle of Wight Healthcare PCT 2363 1688 2288
Mid Essex PCT 5328 5381 7236
Milton Keynes PCT 2160 5088 5444 North East Lincolnshire Care Trust 2829 3197 2346
North Staffordshire PCT 3982 3210 4080
Sefton PCT 8740 9882 8618
Somerset PCT 11028 9922 11671
Stoke on Trent PCT 5882 4568 6042
43

Urgent Care Sensitive Conditions
The ICD10 codes for the 14 conditions identified by the Delphi panel as urgent care sensitive, together with the total number of cases over these three years in the usable HES data set are shown in Table 3.4.2.
Table 3.4.2 Frequency of urgent conditions
Admission year Total Condition ICD 10 codes
2006/7 2007/8 2008/9 Count % Falls >74 NEC W00 - W19 98045 105025 113972 317042 9.7%Minor head injuries S00 22901 23841 27939 74681 2.3%Non-specific chest pain
RO 7.4, RO 7.3 23001
2 227150 239094 696256
21.4%DVT I80-I82 25089 24014 25497 74600 2.3%Angina I20 72532 68318 66205 207055 6.4%COPD
J40-J44 10236
4 98803 107445 308612
9.5%Acute mental crisis
F00 - F99 11122
7 109927 104049 325203
10.0% Non-specific abdominal pains
R10 20375
6 202578 210297 616631
19.0%Cellulitis L 03 51482 50513 52050 154045 4.7%Pyrexial child R50 5640 6127 6054 17821 0.5%Blocked urinary catheter
T83.0 4999 5141 5808 15948
0.5%Diabetic emergencies
E10.0, E11.0, E12.0, E13.0, E14.0, E15, E16.1, E16.2
11136 11367 12550 35053
1.1%UTIs N39.0 95009 99250 107410 301669 9.3%Epileptic fit G40, G41 35679 36238 36380 108297 3.3%Total 10698
71 1068292 1114750 3252913 100%
Population data
Final mid-2007 estimated resident population by quinary age groups and sex for PCTs in England were obtained from ONS. The population counts were categorised into 7 age groups (0-4, 5-14, 15-44, 45-64, 65-74, 75-84, 85+) to match the categorisation of HES admission data (Population Estimates Unit, ONS Centre for Demography, ONS).
Analysis
Crude urgent admission rates for each PCT have been calculated first. Then these have been directly age and sex standardised using the European standard population*. Next we have examined trends in urgent admissions by regressing the directly standardised admission rates on year of admission. We have also explored the possibility of simply using the change in admissions in one year compared to the average of the previous years for monitoring trends. Next we have examined variation between PCT urgent care
* Weights used were 0-4yrs: 0.04, 5-14yrs: 0.07, 15-44ys: 0.21, 45-64yrs:0.125, 65-74yrs: 0.035, 75-84yrs: 0.015, 85+: 0.005 for each gender group.
44

sensitive condition admission rates for younger people (≤ 74years), and also between weekends and weekdays. We then examined differences in lengths of stay in PCTs with high and low UCS condition admission rates. Lastly, we investigated re-admissions for the same condition within 7 days of discharge. Subsequent admissions (i.e. re-admissions) were matched to the index admission by condition (based on the primary diagnoses shown in Table 3.4.2) and the 32 character HES identifier for each patient.
The emergency re-admission rate has then been calculated as the ratio (%) of the number of re-admissions to the total number of admissions (including re-admissions) for all ages and also for under 75 year olds. In order to assess the sensitivity of this indicator we have also estimated emergency re-admission rates within 30 days for all ages and compared with re-admissions within 7 days.
Descriptive statistics
Indicators have first been graphed to show range and variation, using simple histograms. The crude and standardised indicators have also been compared to examine the need for standardisation.
Stability
We have then examined whether these indicators are sufficiently stable from one year to the next within PCTs to suggest that they are reflecting systematic rather than random variation. We have done this by calculating simple (Spearman) rank correlations between indicators between years. These correlations are effectively the correlation between a PCT’s ‘league table’ position from one year to the next. We would expect these correlations to be high between successive years but to taper off with increasing time.
Funnel plots
The amount of random variation in estimated admission rates is a function of the size of the PCT, which can be indicated by the size of the PCT population. We have therefore also calculated ‘control limits’ for the age/sex standardised admissions rate taking account of over dispersion and have constructed funnel plots using 97.5% and 99.8% limits to examine whether there is any evidence that the indicators can pick up unusual performance. The methods used for calculating the control limits shown in the funnel plots are explained in Appendix A.2.
Geographical patterns
The indicators presented here are based on the PCT of residence of patients. We have used PCT of residence rather than PCT of treatment to enable PCTs responsible for commissioning services for urgent care of their residents to monitor and compare how well the services are performing for their residents. However, the services we are interested in ‘indicating’ are provided by systems which often extend across PCT boundaries. It may therefore be helpful to geographically ‘map’ the indicators to see whether there are areas with consistent performance which indicate wider system performance. We have mapped some of the indicators using quintiles of the crude and standardised rates to examine whether this type of geographical analysis could pick up area-wide performance. We have also mapped the level of deviation of each PCT from the mean admission rate of all PCTs in terms of the standard deviation of the admission rate for that PCT calculated from the values used in the funnel plots. This will help show any geographical pattern of PCTs which have admission rates which are 'out of control'.
45

3.4.3 Results: Urgent admissions
Crude rates
Figure 3.4.2a shows the crude total urgent condition admission rate over all 3 years together for residents of the 152 PCTs. Two PCTs have unexpectedly high admission rates which are probably due to data errors, though this warrants investigation. Ignoring these there is only a factor of 2.7 between the lowest rate (36.7 per 1000 residents per 3 years) and the highest rate (102.1 per 1000 per 3 years).
Fig 3.4.2a Crude urgent care sensitive condition admission rates per 1000
population over 3 years 2006/7 – 2008/9.
Crude rate per 1000 per 3 years
Fig3.4.2b Boxplot showing outliers.
Cru
de
rate
per
1000 p
er 3
yea
rs
Table 3.4.3 shows the Spearman rank correlations of the crude rate per year from 2006/7 to 2008/9.
46

It will be seen that the rank correlations are large indicating stability over time, and that they weaken with increasing distance in time as might be expected.
Table 3.4.3 Spearman rank correlation of 152 PCT admission rates between years.
Year 2006/7 2007/8 2008/9 2006/7 1.00 .94 .92 2007/8 1.00 .95 2008/9 1.00
Age-sex adjusted rates
The admission rates have been directly standardised for age and sex by combining the age-sex specific urgent admission rates using the European Standard population weights. Figure 3.4.3a and 3.4.3b show the resulting adjusted admission rates. The two outlying PCT rates remain unexpectedly high indicating that their high crude rates were not due to anomalous population age-sex distributions. In fact, plotting the crude rates against the adjusted rates shows that there is some movement in these rates (Figure 3.4.4), but only a small number of PCTs show a clear change in ranked position.
Fig 3.4.3a Directly age-sex standardised UCS condition admission rates per 1000 population over 3 years.
Age/sex DSR per 1000 per 3 years
47

Fig 3.4.3b Boxplot showing outliers
Fig 3.4.4 Crude admission rates versus directly standardised rates.
Age/
sex
DSR p
er 1
000 p
er 3
yea
rs
Age/sex DSR per 1000 per 3 years
Cru
de
rate
per
1000 p
er 3
yea
rs
To assess the stability of the standardised rates over time the Spearman rank correlations of the standardised rate per year from 2006/7 to 2008/9 were calculated. Table 4 shows that the rank correlations are large indicating stability over time.
Table 3.4.4 Spearman rank correlation of 152 PCT directly standardised rates between years.
Year 2006/7 2007/8 2008/9 2006/7 1.00 0.93 0.91 2007/8 1.00 0.96 2008/9 1.00
A funnel plot for the directly age/sex standardised admission rates is shown in Figure 3.4.5. The control limits have been calculated using an empirical estimate of the dispersion. The funnel plot shows that three PCTs have rates that are above the 99.8% control limit indicating these PCTs may have rates that are out of control and warrant further investigation.
48

49
Fig 3.4.5 Standardised PCT population urgent care sensitive admission rates per 1000 per 3 years
20
40
60
80
100
120
0 200 400 600 800 1000 1200 1400
DS
R pe
r 100
0 S
tand
ard
Pop
ulat
ion
per 3
Yea
rs
Population Thousands
The crude and standardised admission rates were mapped, and also the deviation from the mean standardised rate for each PCT in terms of the standard deviations calculated for the control limits in the funnel plot. The maps (Fig 3.4.6) show distinct geographical or spatial patterns with high crude and standardised rates, even allowing for variability, in the North and North West, and low rates in the East, the Midlands and parts of the South outside London. These patterns probably represent general population health as well as system performance and it possible that they should be adjusted using some external measure of population health, or should be used for monitoring trends within populations or comparing rates within populations.

Fig 3.4.6 Spatial distribution of crude admission rates (6a), directly standardised rates (6b) and deviation from the mean admission rate (6c) for English PCTs, 2006/7-2008/9
3.4.6a 3.4.6b 3.4.6c
50

Trends
Trends in admissions for urgent care sensitive conditions which could be used to monitor PCT performance have been calculated.
Directly standardised admission rates have been used and the trend has been calculated by regressing the rate on year of admission for each PCT.
The estimated coefficient for the trend (figure 3.4.7) shows a simple symmetric distribution around zero, with two positive outliers. The data for one of these PCTs shows a steady growth in the admissions rate over the 3 years and suggests that the number of admissions is really increasing. However the outermost PCT had a more than two-fold increase in admissions rate between 2006/7 and 2007/8 suggesting a data anomaly perhaps reflecting a change in coding practice.
Figure 3.4.7 Coefficient of trend in UCS condition standardised admissions rate.
Trend coefficient
An alternative approach to monitoring changes in performance was also calculated. This approach was simpler, using the standardised admissions rate occurring in year 3 (monitoring year) as a proportion of the average standardised admissions rate in the previous two years. This shows a similar but slightly more dispersed distribution (Figure 3.4.8a), and a box and whisker plot identified eight outlying PCTs (Figure 3.4.8b). The number of admissions for residents of seven of the eight PCTs changed by more than 20% (i.e. >120% or <80%) in 2008/9 compared to the previous two years.
51

Fig 3.4.8a Proportion of UCS admissions in 2008/9 as a % of average admissions 2006/7 – 2007/8
Proportional change in rate from previous two years
Fig 3.4.8b Box plot showing outliers
Proport
ional
change
in r
ate
fr
om
pre
vious
two y
ears
The relationship between the trend coefficient and the simple change index is shown in Figure 3.4.9. There is a tight correlation and high values of the simple index identify all the high values using the trend analysis. It would therefore be most straightforward to simply monitor changes in performance using the simpler indicator looking at proportional change in rate over time.
52

Fig 3.4.9 Relationship between % change in number of admissions and regression coefficient for trend
Proportional change in rate from previous two years
Tre
nd c
oef
fici
ent
Urgent admission rates excluding the elderly Elderly people tend to have multiple morbidities and there is evidence in HES data that the proportion of patients with more than one diagnostic code rises steeply to the age of 75. Our nominal group that reviewed the Delphi results advised that it might be helpful to calculate the indicators for patients <75 in whom good performing EUCS would have more chance of preventing death and admission.
For the urgent care sensitive conditions, we have therefore calculated the admission rates separately for patients under 75 years old. Around 67% of all UCS emergency admissions over the three year period were for people aged up to 74 years old and consequently there is a very close relationship between the age/sex adjusted rates in the whole population and in the under 75s (Fig 3.4.10a). This suggests that monitoring the population as a whole is sufficient. Furthermore, the correlation between the crude under 75s rate and the whole population standardised rate is good but not very close (Fig 3.4.10b), so we cannot use the crude under 75s rate as a simple substitute for the whole population standardised rate.
53

Fig 3.4.10a Under 75 years directly age-sex standardised UCS condition admission rates and rates for the population as a whole.
Age/
sex
DSR p
er 1
000 p
er 3
yea
rs (
all age)
Fig 3.4.10b Correlation of all age directly age-sex standardised admission rate with <75 Crude admission rate 2006/7-2008/9
Age/sex DSR per 1000 per 3 years (<75yr olds)
Day of week of admission
Across all PCTs together the number of admissions at the weekend is much smaller than would be expected if the chance of being admitted following an urgent event was the same at all times (assuming also that urgent episodes are evenly spread over the week).
54

Table 3.4.5 shows there were proportionally fewer admissions on either day of the weekend (Saturday: 12.0%, Sunday: 11.7%) compared with any day of the week (15.3% of admissions on average). If there was a uniform admission rate each day 28.6% of admissions would be expected at the weekend. Figure 3.4.11a shows that no PCTs achieved this rate with all but one PCT under 26%. There was also one outlying PCT where just 20.6% of UCS conditions were admitted at the weekend (Figure 3.4.11b).
Table 3.4.5 Number (%) of UCS admissions by day of week.
Day Frequenc
y Percent Valid
Percent Cumulative
Percent Sun 384832 11.7 11.7 11.7 Mon 525233 15.9 15.9 27.6 Tue 501430 15.2 15.2 42.7 Wed 490773 14.9 14.9 57.6 Thur 495065 15.0 15.0 72.6 Fri 510771 15.5 15.5 88.0 Sat 394849 12.0 12.0 100.0
Total 3302953 100.0 100.0 Fig 3.4.11a Proportion (%) of UCS admissions at the weekend by PCT.
Proportion of admissions on weekend (%)
55
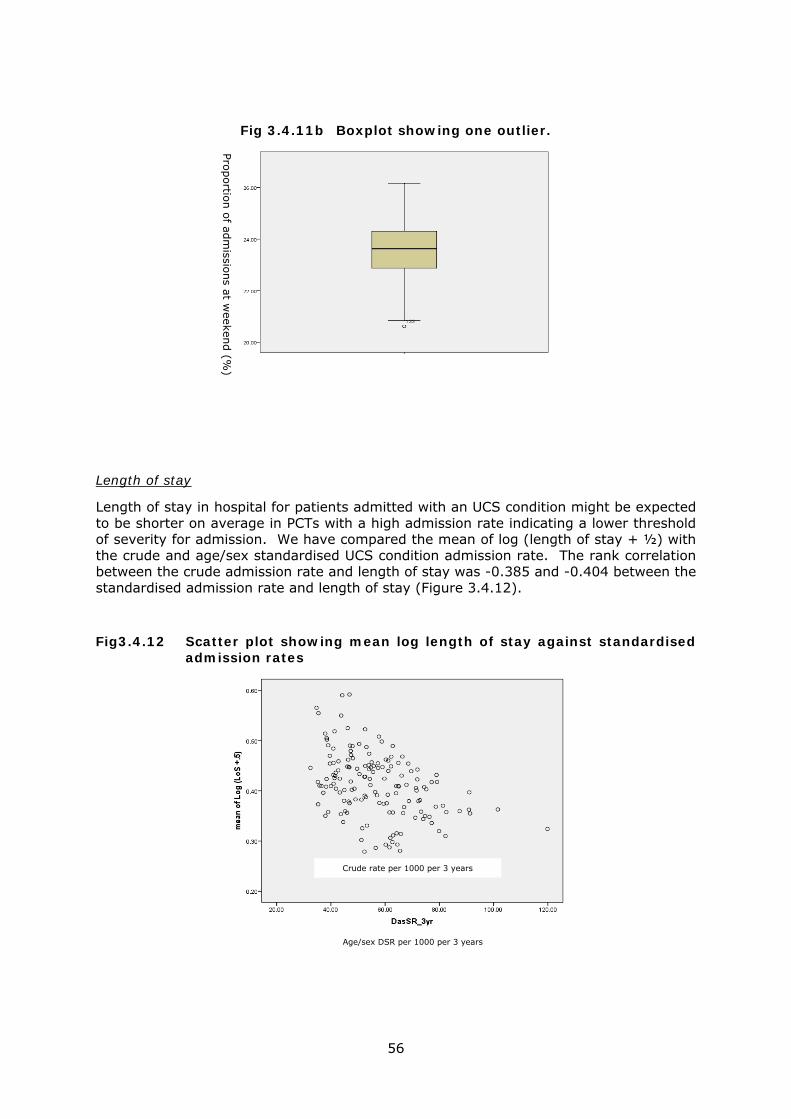
Fig 3.4.11b Boxplot showing one outlier.
Pro
portio
n o
f adm
issions at w
eekend (%
)
Length of stay
Length of stay in hospital for patients admitted with an UCS condition might be expected to be shorter on average in PCTs with a high admission rate indicating a lower threshold of severity for admission. We have compared the mean of log (length of stay + ½) with the crude and age/sex standardised UCS condition admission rate. The rank correlation between the crude admission rate and length of stay was -0.385 and -0.404 between the standardised admission rate and length of stay (Figure 3.4.12).
Fig3.4.12 Scatter plot showing mean log length of stay against standardised admission rates
Crude rate per 1000 per 3 years
Age/sex DSR per 1000 per 3 years
56

We have also looked at the median length of stay in each PCT and compared this with the average admission rate (simple mean of crude rate or DSR in this case). PCTs fell into three groups with median length of stay of either 1, 2, or 3 days, Table 3.4.6 shows that the average admission rate tended to be lower in PCTs where the median length of stay was longer. For all admissions the median length of stay was 2 days (IQR 0-6 days).
Table 3.4.6 Comparison of median Length of stay and admission rate
Median length of Stay (days)
Mean crude rate per 1000 per 3 years
Mean age/sex standardised rate
per 1000 per 3 years
1 73.96 64.20
2 60.62 51.62
3 51.51 44.17
3.4.4 Results: Emergency re-admissions within 7 days for the same condition Figures 3.4.13a and 3.4.13b show the distribution of emergency re-admissions within 7 days for the same condition as a percentage of all admissions by residents of the PCTs for any of the 14 urgent conditions for all three years combined. Over this period the mean number of re-admissions per PCT was 647 and on average 475 of these were for patients aged under 75 years. This equates to a median re-admission ratio of 3.01% (IQR 2.66% - 3.33%) in all ages and 2.14 % (IQR 1.91% - 2.47%) in the under 75s. Fig 3.4.13a Proportion (%) of Emergency re-admissions within 7 days with the
same condition as the index case
57

Fig 3.4.13b Proportion (%) of Emergency re-admissions within 7 days with the
same condition as the index case (<75 yrs)
Residents of two PCTs clearly have exceptionally high readmission rates over 5%, and 4 more over 4%. The cause of these anomalous rates would clearly warrant confirmation and investigation if the rates were accurate. Tables 3.4.7a and 3.4.7b below show that there is only moderate correlation over the three year period we have looked at but this decreases as time progresses in line with our expectations.
Table 3.4.7 Spearman rank correlation of 152 PCT rates of readmission within 7 days.
Table a All ages. Table b Under 75 years
Year 2006/7 2007/8 2008/9 2006/7 1.00 0.60 0.52 2007/8 1.00 0.67 2008/9 1.00
Year 2006/7 2007/8 2008/9 2006/7 1.00 0.60 0.53 2007/8 1.00 0.62 2008/9 1.00
The readmission rate within 30 days for the same condition was also calculated. The median number of days between the discharge from the index case and readmission was 6 days. This suggests that focusing on re-admissions within 7 days for the same condition would make little difference to this as an indicator of performance. We also calculated readmission rates for any emergency or urgent condition rather than the same urgent condition. PCTs with the most extreme values for re-admissions for the same condition also had the most extreme values when re-admissions were expanded to include re-admission for any emergency or urgent condition. This also suggests that focusing on emergency re-admissions within 7 days for the same urgent condition would not be in conflict with current policy focusing on 30 days, any cause of readmission, and elective admissions. The reasons for focusing on 7 days are that it is much more likely that the admissions are linked to the same episode or exacerbation of the same condition. Thirty days apart it is easily possible that a second and separate exacerbation of conditions such as COPD and asthma could occur and the readmission is not attributable to how the system performed in the first admission.
58

3.4.5 Discussion and conclusions for these indicators
Unnecessary admissions to hospital are a matter of on-going concern in the NHS. The recent report from the Nuffield Trust suggest this problem has been getting worse over recent years.2 This is despite a number of initiatives to try to curtail this. The total number of unnecessary admissions is partly made up of emergency admissions for urgent conditions, and where the admission follows an acute episode or exacerbation of a long term condition which could in some circumstances be managed out of hospital this clearly points to a failure of the urgent care system as a whole. Could these patients have self-managed with advice and support, or been managed at home by extended skills paramedics or out-of-hours doctors? If they did need to go to ED, was admission inevitable or should there have been other, community based services able to manage them?
The proposed indicator, emergency admission rates for these urgent care sensitive conditions, is not a measure of unnecessary admission of course. Most of these admissions will be necessary. However, where the rate is unexpectedly high, this may indicate relatively large numbers of unnecessary admissions. The association with length of stay suggests this is true. Where there are high admission rates there tend to be short lengths of stay. The admission rate in patients aged under 75 would probably be ‘richer’ in unnecessary admissions than the all ages rate. However, we have found that using under 75s and all ages gives very similar results, and whichever approach is taken age-sex standardisation should be used. So it is probably simplest to use the all ages age-sex standardised urgent condition emergency admission rate as the indicator.
We have also calculated the indicator separately for weekdays and weekends and found low rates of admission at the weekends. In fact this is difficult to interpret because there are at least two conflicting influences: 1) reduced resources for admission in hospitals at the weekend reducing the number of admissions, and 2) reduced access to other urgent care services outside hospital leading to an increase in hospital admissions.
These emergency admissions rates for resident populations:
1. easy to calculate using HES data so long as HES codes the area of residence. Moving forward to GP consortia commissioning, alternative areas of residence will need to be used to define populations as PCTs are phased out;
2. can be kept current using monthly HES downloads for monitoring;
3. appear reliable, with evidence that only a very few areas have potentially faulty data;
4. can be directly standardised for age and sex enabling possibly fair comparisons between populations, since there are no selection biases operating;
5. show reasonable stability over time suggesting that they are picking up an underlying signal, potentially relating to performance;
6. show spatial organisation indicating area or system wide influences.
We have also examined readmissions, which is another area of current policy concern. The DH has recently introduced a policy of non-payment to Trusts for some acute hospital readmissions.3 This policy is focused on elective admissions and covers emergency readmissions within 30 days for any reason. We have focused on emergency admissions for urgent conditions who are readmitted within 7 days for the same condition. The argument for this divergence is the same one made several times above. Emergency readmissions may not be unnecessary and may not identify a failure of care. Unexpected and unpredictable changes in health do occur. However, emergency readmission within 7 days for the same condition is more likely to point to a problem
59

with the initial care, or community support post discharge, than readmission in 30 days for any condition. Our proposed indicator has a relatively strong ‘signal’ and is therefore more appropriate as an indicator.
The difficulty with emergency readmission is that it is very strongly focused on the quality of care in hospitals and only loosely concerned with the quality of the quality of the urgent care system. Despite being chosen by our Delphi panel we are not convinced of its value as an EUCS indicator.
Conclusions
Overall, therefore, we think the simple indicator of age-sex standardised admission rates for the 14 urgent conditions together is a useful indicator of quality of care in an emergency and urgent care system, but other variants such as excluding the elderly or for weekends add little value. Emergency readmissions should focus on short time intervals for related conditions, but even then are probably not a useful system indicator.
60

3.5 Results: Unnecessary attendance at Emergency Departments 3.5.1 Unnecessary attendance at Emergency Departments
Patients who attend Emergency Departments but who didn’t needed care, that is could have been managed adequately by other services, indicate a potential fault with the system of Emergency and Urgent Care services, their organisation and accessibility. This may be particularly true if such patients were brought in by the Ambulance Service or referred by other services. Unnecessary attendance is a much contested idea.1-3 It was introduced by MCRU in 19944 instead of the more widely used term “inappropriate attendance” because we felt that this term was too value-laden. Unnecessary attendance simply refers to the fact that the patient could have been managed equally well outside the Emergency Department (in so far as that can be determined). It does not have any implication about whether such attendances are right or wrong. These patients are sometimes referred to as ‘primary care patients’. Our Delphi exercise undertaken to identify a list of potential performance indicators for the emergency and urgent care system5 identified two indicators based on unnecessary ED attendance which may be related to the accessibility and quality of appropriate local urgent care services. The indicators are
i. the proportion (%) of referrals to ED by health care services that were unnecessary
ii. the proportion (%) of all patients brought in by ambulance who were unnecessary
This report examines the face validity of these indicators based on the proportion of attendances recorded in HES 2008/9 data that meet the definition of unnecessary attendance set out below. Face validity has been examined in relation to the expected volume of unnecessary attendance, and the expected patterns with respect to type of ED attended, age, sex, and source of referral. The proportion of attendances that were unnecessary has also been calculated for in-hours and out-of-hours (weekend and 20.00 hours to 07.59) to examine face validity, and the ratio of the out-of-hours to in-hours unnecessary attendance rates has also been calculated and examined as a possible further indicator. 3.5.2 Defining unnecessary attendance
In our original 1994 paper we defined unnecessary attendance as first attenders who were
i. registered with a GP ii. not investigated in A&E iii. not treated in A&E except by prescription, bandage, sling, dressing or steristrips iv. did not come from a transport accident, or accident at work, school, a public
place or a sporting event; and v. were discharged completely from care in A&E or referred to their GP
This definition was developed in 1993 prior to the widespread introduction of open access walk-in centres and so the requirement for GP registration is now redundant. Equally, the development of open access minor injury centres means that simply having had an accident outside the home shouldn’t necessarily mean that attendance at an Emergency Department was necessary. So for the purpose of the system performance
61

indicators calculated here, unnecessary attenders have been more simply defined as patients who are first attenders who are neither treated nor investigated, with some minor exceptions, and who are discharged home or to GP care. We have calculated unnecessary attendance using HES A&E data for 2008/9. The treatment, investigation and disposal codes taken as indicating unnecessary attendance are: HES A&E data field name: A&E investigation : 2 character
Codes included Investigation 24 or blank None
06 Urinalysis 21 Pregnancy test 22 Dental investigation 23 Refraction, orthoptic tests and
computerised visual fields HES A&E data field name: A&E treatment :2 character
Codes included Treatment 01 Dressing 02 Bandage/support 04 Wound closure (excluding sutures) 07 Prescriptions 22 Guidance/advice only 30 Recording vital signs 34 Wound cleaning 56 Dental treatment 57 Prescription
99 or blank None HES A&E data field name : Attendance Disposal
Codes included Disposal 02 Discharged – following treatment to be
provided by GP 03 Discharged – did not require any follow-
up treatment 12 Left department before being treated
In the HES A&E dataset there are several variables available for recording treatments and investigations. A large proportion of the codes in the treatment and investigation variables are blank. It is unclear whether a blank means no treatment or investigation was provided or whether the code is missing. We have interpreted a blank as indicating no treatment or investigation if at least one other treatment or investigation variable is recorded (ie has a non-blank code), and as missing (not recorded) if all other treatment and investigation codes are also blank. In effect our definition of unnecessary attendance is
“first attendance with some recorded treatments or investigations none of which needed Emergency Department facilities, followed by discharge home or to GP care”.
Where all the treatment and investigation variables have blank codes, unnecessary attendance is considered not known or ‘missing’. Patients who left before being seen
62

have also been coded as unnecessary attenders. Irrespective of the presence or absence of treatment and investigation codes, patients who were referred to A&E or fracture clinics, were admitted, died in the Emergency Department, or left the Emergency Department having refused treatment were all classified as necessary attenders. HES A&E data also includes records for some patients attending walk-in-centres and minor injury units managed by the A&E and for some patients attending specialist emergency departments. These records (about 3% of the total) need to be excluded from the unnecessary attenders analysis. The type of department is, however, only recorded in approximately 50% of records so we have had to include all HES A&E records with the type of department recorded as a general, 24 hour consultant led A&E or not recorded (department type = 1 or 99). Nearly all A&E attendances for residents of one PCT (5F1) are recorded as MIU attendances, and this PCT has been excluded from this analysis. The data show that the proportion of attendances judged unnecessary for departments recorded as general EDs and departments with no type recorded are almost the same (21.9% vs 21.5%) (Table 3.5.1) suggesting that the no type recorded departments are general EDs. In contrast the estimated unnecessary proportion for departments recorded as MIUs is 34.0% and for walk-in centres is 48.8%, suggesting that the operational definition of unnecessary attendance used here works. Table 3.5.1. proportion (%) of unnecessary attendances by type of department
Type of attendance Total
necessary not
necessary Type of department
general ED Count 1961845 550678 2512523
% 78.1% 21.9% 100.0% special ED Count 61527 15513 77040 % 79.9% 20.1% 100.0% other eg
miu Count
102647 52874 155521
% 66.0% 34.0% 100.0% walk-in-
centre Count
11918 11370 23288
% 51.2% 48.8% 100.0% nk Count 4569080 1254412 5823492 % 78.5% 21.5% 100.0% Total Count 6707017 1884847 8591864 % 78.1% 21.9% 100.0%
Based on data from 108 PCTs included in the analysis below 3.5.3 Robustness of data
As well as large numbers of unrecorded entries for treatments and investigations, there are a very large number of treatment and investigation codes in the data that are not allowed by the HES A&E codebook. We have interpreted these as indicating a treatment or investigation and hence patients with these codes have not been included as
63

unnecessary attenders. This means that our calculations of this indicator may not be robust. As with all the other indicators, we have calculated the indicators for PCT resident populations rather than by service providers in order to answer the question “which population is best served” rather than the question “which service is best”. That is, we have taken ‘commissioner’s’ perspective rather than a ‘providers’ perspective. However, not all A&E departments have returned data to HES A&E, some departments have only returned data on some of their patients, and as outlined above some have only returned partial data on those patients that have been included. So we have not been able to calculate the indicators for all PCTs. The distribution of PCT resident population A&E attendance rates in HES A&E data for 2008/9 is shown in Fig.3.5.1. Eleven PCTs had very low attendance rates reported in the data (<100 attendances per 1000 resident population) probably indicating missing records and these have been excluded from the analysis reported here. Fig.3.5.1 PCT Rate of first attendance at ED per 1000 residents pa.
600.00500.00400.00300.00200.00100.000.00
Freq
uenc
y
30
20
10
0
Mean =264.8511�Std. Dev. =100.37639�
N =152
A&E attendance rate per 1000 residents pa The proportion of attendances with missing information to determine whether they were unnecessary attenders or not (i.e. had no investigations or treatments recorded) is shown in Fig.3.5.2. The missing proportion is less than 10% for residents of half the PCTs, but is over 40% for 9 PCTs. The missing proportion is plotted against the proportion of those with known status who were classified as unnecessary attenders in Fig. 3.5.3. It will be seen that the larger the missing proportion, the smaller the proportion of the remaining attenders who were classified as unnecessary. This suggests that some patients for whom no treatments or investigations were recorded (and who are therefore classified as missing here) were actually unnecessary attenders who had no treatment or investigations. In order to avoid the bias this might cause, we have also excluded some PCTs with high rates of unrecorded treatment and investigation. Examining Fig.3.5.3, we have taken the cut-off as 25% missing. This has excluded a further 32 PCTs, leaving 109 PCTs in the analyses reported below.
64

65
Fig.3.5.2 Proportion of attendances with no investigations or treatments recorded
60.0040.0020.000.00
Freq
uenc
y
40
30
20
10
0
Mean =14.5632�Std. Dev. =14.30689�
N =141
Proportion (%) missing
Fig.3.5.3 Relationship between the proportion of attendances classified as unnecessary and the proportion with missing treatments and investigations
60.0040.0020.000.00
prop
ortio
n_un
nec
50.00
40.00
30.00
20.00
10.00
0.00
Proportion (%) missing
3.5.4 Validation of the data
i. Proportion of unnecessary first attenders
A total of 22% of first attendances with non-missing data were identified as unnecessary attendances. This is typical of proportions that have been reported before.6-10 Seven PCTs showed particularly high values (Fig.3.5.4). Mapping these unnecessary attendance rates showed some geographical patterning (Maps 3.5.5a and 3.5.5b).

66
Map 3.5.5a. Map 3.5.5b. Proportion of unnecessary attenders by PCT of residence, England Proportion of unnecessary attenders by PCT of residence, London

Fig.3.5.4 Proportion of first attenders judged unnecessary by PCT
50.0040.0030.0020.0010.000.00
Freq
uenc
y
25
20
15
10
5
0
Mean =22.081�Std. Dev. =9.67588�
N =109
Proportion (%) unnecessary
ii. Unnecessary attendance out-of-hours
Similar proportions of out-of-hours (20.1%) and in-hours (19.8%) attendances were classified as unnecessary. However, this similarity comes from two distinct and contrasting patterns. First, a higher proportion of weekend attendances are unnecessary (21.2% vs 19.5%). Second, a lower proportion of attendances in the dead of night are unnecessary (see Fig.5). These differences are what might be expected. Overall, analyses of ‘out-of-hours’ are probably less helpful than separate analyses by weekend and night-time.
PCTs show a strong correlation between their in-hours unnecessary attendance proportion and their out-of-hours unnecessary attendance proportion as they should (Fig.3.5.6). Nevertheless, the ratio of the two rates varies considerably by PCT (Fig.3.5.7), suggesting this may be an indicator of different accessibility to out-of-hours services by residents of different PCTs.
67

68
Fig.3.5.6 In-hours vs out-of-hours unnecessary attendance rate by PCT
50.0040.0030.0020.0010.000.00
Prop
ortio
n_un
nec_
inho
urs
50.00
40.00
30.00
20.00
10.00
0.00
Proportion (%) unnecessary out-of-hours
Fig.3.5. 7 Ratio of % unnecessary attendance in-hours to out-of-hours
1.601.401.201.000.800.60
Freq
uenc
y
25
20
15
10
5
0
Mean =0.986�Std. Dev. =0.13383�
N =109
Ratio
iii. Unnecessary attendance by source of referral
The estimated proportion of attenders brought in by ambulance that were classified as unnecessary was 10.4% compared to 24.0% of ambulatory attenders. The proportions unnecessary by source of referral are shown in Table 3.5.2.

Map 3.5.12b. Map 3.5.12a. Proportion of unnecessary attendances brought in by ambulance, by PCT Proportion of unnecessary attendances referred by
other healthcare providers, by PCT
69

Table 3.5.2. Proportions of attendances that were unnecessary by source of referral
Source of referral Unnecessary % GP 10.3% Self 25.3% Emergency Services 11.1% Work 29.4% Educational establishment 27.9% Police 17.6% Other healthcare provider 16.6% Other 19.3% Not known 15.2% Total 21.8% The pattern is what might be expected with low rates of unnecessary referral by GPs (10.3%), emergency services (11.1%) and other healthcare providers (16.6%), but high rates from work (29.4%) and schools (27.9%) probably reflecting risk aversion. iv. Residual influence of missing data
There was only weak correlation between the proportion of referrals from healthcare providers classified as unnecessary and the proportion of self-referrals identified as unnecessary (Fig.3.5.8). The suggests that after excluding the PCTs with large amounts of missing data, the variation between PCTs is not only being determined by variation in recording treatments and investigations (which would be expected to affect self and other referrals equally). Fig.3.5.8 Relationship between proportions of self-referrals and healthcare provider referrals classified as unnecessary
60.0050.0040.0030.0020.0010.000.00
healt
hpro
vider
_per
cent
40.00
30.00
20.00
10.00
0.00
Proportion % self-referrals that are unnecessary
v. Unnecessary attendance by age and sex
There was no evidence of an important difference between men and women in the proportions of attendances classified as unnecessary (men 22.9% vs women 21.0%). However, there is a different story for age. There is a striking and consistent decrease across the ages, with the proportion classified as unnecessary falling from 31.4% in children to just 6.6% in those aged over 85 (Fig 9).
70

Standardisation
This suggests that it might be necessary to standardise the unnecessary attendance rates for age before valid comparisons can be made between populations. To examine the need for this we have plotted the standardised rate against the crude rate in Fig 3.5.10.
Fig 3.5.10. Crude and standardised unnecessary attendance by PCT of residence
50.0040.0030.0020.0010.000.00
age_
stan
dard
_pro
p_un
nec
0.50
0.40
0.30
0.20
0.10
0.00
Crude unnecessary attendance rate It will be seen that standardisation rarely makes any difference and is probably unnecessary. Overall, the data on unnecessary attendance show strong face validity clearly reflecting patterns that might be expected. This means in turn that this indicator may be picking out some aspect of the performance of the system provided to residents.
71

3.5.5 Referrals from healthcare services
One indicator of system performance identified by our consensus panel was the rate of unnecessary referral to Emergency Departments by healthcare providers such as GPs. In the 109 PCTs with reliable data, the proportion of unnecessary referrals from healthcare providers to Emergency Departments averaged 11% (range 0% - 37%) (Fig.3.5.11). Seven PCTs showed values in excess of 20% and those results would warrant investigation to rule out data recording anomalies. The proportions of healthcare provider referrals classified as unnecessary also show some geographical pattern (Map 3.5.12a). Fig.3.5.11 Proportion of attendances referred by healthcare providers classified as unnecessary, by PCT
40.0030.0020.0010.000.00
Freq
uenc
y
25
20
15
10
5
0
Mean =11.4906�Std. Dev. =6.29992�
N =109
Proportion (%) unnecessary 3.5.6 Referrals from the ambulance service
Approximately 25% of first attenders at Emergency Departments arrive by ambulance. Of these, 10.4% were classified as unnecessary attenders, and in most PCTs this proportion was <15% (Fig.3.5.13). However, there are some PCTs with eccentrically large values, and this would warrant further investigation. The proportion of patients brought in by ambulance unnecessarily is also shown in Map 3.5.12b.
72

Fig.3.5.13 Unnecessary attendance for patients arriving by ambulance
50.0040.0030.0020.0010.000.00
Freq
uenc
y25
20
15
10
5
0
Mean =10.5421�Std. Dev. =6.68283�
N =109
Proportion (%) unnecessary 3.5.7 Discussion for these indicators Unnecessary attendance at ED is an attractive indicator of the accessibility and acceptability of the other urgent care services which serve a population. Although many patients have a ‘good’ reason for attending ED with minor problems11, these reasons include several relating to the (perceived) availability and quality of alternative services,10 and hence unnecessary attendance may reflect the performance of these other services. Nevertheless, there are many other important determinants of unnecessary attendance such as the patient’s age and sex, and time of day and day of week, as we have shown here, as well as other factors such as proximity to the ED, and the patients general use of health services. In fact, Martin9 has shown that unnecessary attenders have 10 times as many out-of-hours telephone contacts with their GP as other attenders. This suggests that unnecessary attenders at ED are just unnecessary attenders everywhere; that it is a patient characteristic not a service indicator. Our indicators, however, avoid this problem because they are focused on unnecessary referrals from other health services. Some researchers have actually used self-referral as a criterion for whether an attendance can be judged unnecessary, claiming that all other referrals are by definition necessary.1 We know this is not true for patients brought in by ambulance, and we think that this approach misses the point for other sources of referral. Poor triage (eg from NHS Direct, 111, or telephone out-of-hours assessment) will result in unnecessary attendance. In fact all triage, whether in person or by telephone, is prone to error and our results suggest that although the specificity is excellent at nearly 90%, nevertheless there is considerable variation between PCT populations. It is possible of course that the referrals from GPs that we have categorised as unnecessary are the result of data errors. The HES A&E data are notoriously of poor quality. Having said that we have clearly separated out a strong ‘signal’ from all the ‘noise’, with the effects of source of referral, night time and weekends, and age all showing expected patterns. This suggests that the results for PCTs show genuine variability in unnecessary attendance rates, and the question is how this should be interpreted. Although some of this variation may be related to differences in the prevalence of people with a propensity for
73

unnecessary attendance, we are confident that some is due to differences in the quality or accessibility of the services available to PCT populations. We have certainly shown that although age is a very strong determinant of propensity for unnecessary attendance, standardisation for age makes little difference to the relative performance of PCTs. Furthermore, the problem that PCTs have populations with different characteristics, such as age and propensity to use health services, so that comparisons might be confounded by these characteristics can be wholly avoided by looking at ratios, such as out-of-hours to in-hours unnecessary attendance ratios. These ratios are directly comparable between PCTs, and with appropriate benchmarking we think that these ratios may be particularly helpful to PCTs or other commissioners responsible for commissioning out-of-hours services for their populations. Another difficulty in comparing unnecessary attendance rates between PCTs is that the rate is sensitive to the geography of the PCT. We know that residents close to EDs are more likely to attend unnecessarily than those living further away, so that small urban PCTs might be expected to have higher unnecessary attendance rates than larger, more rural PCTs. However, the maps we have produced show little evidence of any systematic effect like this in the data. There is some geographical patterning but there is no obvious urban/rural split. For example, we found very high rates in rural Cumbria but very low rates in rural Lincolnshire. Conclusions We think these indicators should be considered for inclusion in a set of NHS indicators for emergency and urgent care, because
1. They are focused on urgent care 2. Unnecessary attendance at ED leads to unnecessary or avoidable
admissions 3. The ratio of out-of-hours to in-hours rates are directly comparable
between PCTs 4. Unnecessary referrals from other health services warrant investigation as
they point to poor triage or system performance. 5. The indicators show high variability but good stability 6. They are straightforward to calculate from national administrative data.
74

3.6 Conclusions and recommendations
Developing and using system indicators
Population indicators.
Patient focused performance indicators should assess the quality of care provided for patients when they become ill. This care is typically provided by several services along a ‘care pathway’. The indicators should therefore be focused on health care systems, that is on the set(s) of services which look after patients when they become ill, and not on single services.
We think therefore that the best way to develop robust indicators is to use a population based approach because
1. Population based indicators can reflect the performance of the whole systems that serve the populations.
2. Population based indicators are what commissioners need to monitor whether the populations they commission services for, whether these are PCTs or the populations of consortia of GP practices, are being well served.
3. Population based indicators avoid the selection biases inherent in any service based approach. Of course comparison of populations which have a different case-mix is challenging but this problem is of a different degree to dealing with selection biases such as indication bias.
Our indicators are therefore population based. They are in essence public health indicators, indicating not ‘which service is best’ but ‘which population is best served’. Standardisation
PIs may be used for assessing system performance against standards, monitoring change in system performance, or comparing systems. Even using population based indicators, which are relatively free of case mix problems, comparison between populations or against standards is problematic. We think therefore that although all PCTs or consortia should be encouraged to monitor their health care system performance using population indicators, they should be discouraged from making comparisons.
Case mix standardisation is usually advisable, and essential when comparing PIs against standards or other populations. Standardisation for comparison should be carried out using direct methods whenever it is possible. When it is necessary to use indirect methods then further care is needed in making comparisons.
Sub-groups
We think that calculating the main indicators for sub-groups of the population, such as those resident in different parts of the area or those using services in and out of hours, may be very useful for commissioners. They were the focus of four of the ‘equity’ indicators our Delphi panel wanted to see. We would not envisage these entering a national set of indicators.
Data requirements
Three of these equity indicators were not evaluated at all, because like the primary indicators on which they were based, and some others, they need linked data from several services which together can be used for assessing the whole patient pathway. This is of course the essence of patient-focused, system indicators. We have defined systems as the sets of services linked by patient
75

pathways which together serve populations. Unfortunately we still do not have access to much linked data. It is remarkable that in the NHS, a single service covering almost all care in the UK, we still cannot generate linked data.
Using indicators
1. Numerators and denominators. Many indicators are ratios or rates. They measure the number of indicator events in the numerator and compare it with some population which generates those events in the denominator. For example, we have looked at the number of unnecessary attenders at ED compared to all attenders, and the number of deaths in all incidents. When these types of indicator change it is essential to also examine the crude number of events in the numerator. If the case fatality ratio falls, but the number of deaths in the numerator has not changed, then this indicates a change in data recording not a change in quality of care.
2. Funnel plots. Funnel plots are essential for making informed comparisons between population indicators. However, there is some ‘art’ as well as science in constructing control limits. If DH wishes to develop and use sets of PIs for monitoring care then we think a standard approach for calculating control limits should be used.
3. Mapping. We have found that mapping our indicators can point to regional problems, and this is a potentially useful tool for understanding system effects. When service commissioning moves to smaller populations of GP consortia, and hence to smaller geographical areas, mapping will become an even more important tool. We have introduced another novel idea to this process, which is to map the amount of deviation from the average value used in the funnel plots, rather than the actual value of the indicator.
4. Identifying outliers. Identification of outliers must be treated with caution and investigated with care. We think that four questions need to be asked before identifying an area as having outlying performance.
• Does the exceptional performance persist over time? • Is it sensitive to the methods used? Is it sensitive to how the
standardisation is carried out or the weightings used for example? Is it sensitive to how the control limits are calculated?
• If the indicator is a ratio, is there evidence that the problem is with the numerator and not with an unexpectedly small denominator? For example, for CFRs are we sure that there is an excess of deaths (that is a relatively high PMR) not a deficiency of admissions?
• Is there any corroborating evidence from related indicators? For example, is there evidence of problems with any of the process indicators such as time from 999 call to definitive care or multiple transfers, or in surrounding areas?
76

An Indicator set for the Emergency and Urgent Care System
We have calculated and evaluated 6 primary indicators and several variants of each, and the methods for all the calculation of the primary indicators are specified in the indicator toolkit in Appendix B. The six indicators are
i) the standardised population mortality rate
ii) The standardised case fatality ratio
iii) The standardised urgent admission rate
iv) The emergency readmission rate
v) The rate of unnecessary referrals by emergency and urgent care services to EDs
vi) The rate of unnecessary referrals by ambulance services to EDs
We think that the mortality rate is only useful as an adjunct to the standardised case fatality ratio (to check that unexpected values are due to unexpected numbers of deaths), and we remain unconvinced that emergency readmission rates, even closely focused on readmissions for the same problem within 7 days, have much bearing on the performance of the emergency and urgent care system. We also think that two variants of the unnecessary attender rates should be given consideration. First, the overall unnecessary attendance rate, as this indicates issues for patients accessing suitable alternative services within the system, and second the ratio of out-of-hours to in-hours unnecessary attendance rates. These ratios are comparable between PCTs (being unaffected by differences in populations or data coding) and indicate accessibility of out-hours services.
References for Section 3
3.1
1. Arah OA, Klazinga NS, Delnoij DM, ten Asbroek AH, Custers T. Conceptual frameworks for health systems performance: a quest for effectiveness, quality, and improvement. [erratum appear in Int J Qual Health Care, 2004; Apr, 16(2): 189]. International J for Qual in Health Care, 2003; 15(5): 377-398.
2. Bird SM, Cox Sir D, Farwell VT, Goldstein H, Holt T, smuth PC. Performance indicators: good, bad, and ugly. J of the Royal Stat Soc, 2005; 168(part1): 1-27.
3. Eisenberg M, Horwood BE, Cummins R, et al. Cardiac arrest and resuscitation: a tale of 29 cities. Ann Emerg med, 1990; 19: 179-186.
4. Lilford RJ, Brown C, Nicholl J. Use of process measures to monitor the quality of clinical practice. BMJ, 2007; 335: 648-650.
5. Lilford R, Mohammed MA, Spiegelhalter D, Thomson R. Use and misuse of process and outcome data in managing performance of acute medical care: avoiding institutional stigma. [see comment]. Lancet, 2004; 363(9415): 1147-1154.
77

6. Giuffrida A, Gravelle H, Roland M. Measuring quality of care with routine data: avoiding confusion between performance indicators and health outcomes. BMJ, 1999; 319(7202): 94-98.
7. Nicholl JP. Case-mix adjustment in non-randomised observational evaluations - the constant risk fallacy. J. Epi Comm Health, 2007; 61: 1010-1013.
8. Salisbury C, et al. does advanced access improve access for primary health care? BJGP, 2007; 57: 615-621.
9. Brown AD, Goldacre MJ, Hicks N, Rourke JT, McMurtry RY, Brown JD, et al. Hospitalization for ambulatory care-sensitive conditions: a method for comparative access and quality studies using routinely collected statistics. Can J Pub Health, 2001; 92(2): 155-159.
10. Oster a, Bindman AB. Emergency department visits for ambulatory care sensitive conditions: insights into preventable hospitalizations. [see comment]. Medical Care, 2003; 41(2): 198-207.
11. Sanderson C, Dixon J. Conditions for which onset or hospital admission is potentially preventable by timely and effective ambulatory care. J. Health Ser Res Policy, 2000; 5(4): 222-230.
12. Lilford RJ, Pronovost P. Using hospital mortality rates to judge hospital performance: a bad idea that just won’t go away. BMJ, 2010; 340: c2016.
13. Lowy A, Kohler B, Nicholl J. Attendance at accident and emergency departments: Unnecessary or inappropriate? J Pub Health Med, 1994; 16: 134-140.
14. Munro JF, Clancy M, Knowles E, Sampson F, Nicholl JP. Evaluation of NHS Direct: impact and appropriateness. Report to the Department of Health. Medical Care Research Unit, University of Sheffield, 2003.
15. Coleman P, Irons R, Nicholl JP. Will alternative immediate care services reduce demand for non-urgent treatment at a and E? EMJ, 2001; 18(6): 482-487.
3.2
1. Coleman P, Nicholl J. Consensus methods to identify a set of potential performance indicators for systems of emergency and urgent care. J Hlth Serv Res Policy, 2010; 15 Suppl 2: 12-18.
2. Bell CM, Redelmeier DA. Mortality among patients admitted to hospitals on weekends as compared with weekdays. NEJM, 2001; 345(9): 663-668.
3. Schmulewitz L, Proudfoot A, Bell D. The impact of weekends on outcome for emergency patients. Clinical medicine, 2005; 4(6): 621-625.
3.3
1. Coleman P, Nicholl J. Consensus methods to identify a set of potential performance indicators for systems of emergency and urgent care. J Hlth Serv Res Policy, 2010; 15 Suppl 2: 12-18.
78

2. Julious SA, Nicholl J, George S. Why do we continue to use standardised mortality ratios for small area comparisons? J. Pub Health Med, 2001; 18(6): 482-,
3. Roalfe AK, Holder RL, Wilson S. Standardisation of rates using logistic regression: a comparison with the direct method. BMC Hlth Serv Res, 2008; 8: 275-.
4. Bottle A, Jarman B, Aylin P. Strengths and weaknesses of hospital standardised mortality ratios. BMJ 2011; 342: c7116
5. Brown C, Nicholl J, Lilford RJ. Use of process measures to monitor the quality of clinical practice. BMJ, 2007; 335: 648-650.
6. Lilford RJ, Pronovost P. Using hospital mortality rates to judge hospital performance: a bad idea that just won’t go away. BMJ, 2010; 340: c2016.
7. Mohammed MA, Deeks JJ, Girling A, et al. Evidence of methodological bias in hospital standardised mortality ratios: retrospective database study of English hospitals. BMJ, 2009; 338: 6780.
8. Shahian DM, Wolf RE, Iezzoni LI, et al. Variability in the measurement of hospital-wide mortality rates. NEJM 2011; 363: 2530-9
9. Lilford R, Mohammed MA, Spiegelhalter D, Thomson R. Use and misuse of process and outcome data in managing performance of acute medical care: avoiding institutional stigma. Lancet, 2004; 363: 1147-1154.
10. Nicholl J. Case-mix adjustment in non-randomised observational evaluations: the constant risk fallacy. J Epi Comm Hlth, 2007; 61: 1010-1013.
11. Spiegelhalter DJ. Funnel plots for comparing institutional performance. Statist Med, 2005; 24: 1185-1202.
12. Spiegelhalter DJ. Handling over-dispersion of performance indicators. Qual Saf Health Care, 2005; 14: 347-351.
3.4
1. Coleman P, Nicholl J. Consensus methods to identify a set of potential performance indicators for systems of emergency and urgent care. J Hlth Serv Res Policy, 2010; 15 Suppl 2: 12-18.
2. Blunt I, Bardsley M, Dixon J. Trends in emergency admissions in England 2004-2009. The Nuffield Trust. London 2010.
3. NHS Confederation. The impact of non-payment for acute readmissions. Briefing Feb 2011. Issue 211.
3.5 1. Bezzina AJ, Smith PB, Cromwell D et al. Primary care patients in the
emergency department: Who are they? A review of the definition of the ‘primary care patient’ in the emergency department. Emergency Medicine Australasia (2005) 17, 472-479.
79

2. Steel J. Inappropriate – the patient or the service? Accident and Emergency Nursing 1995 3 (45-49)
3. Wise M. Inappropriate attendance in Accident and Emergency. Accident and Emergency Nursing 1997; 5 (102-106)
4. Lowy A, Kohler B, Nicholl J. Attendance at accident and emergency departments: unnecessary or inappropriate? Journal of Public Health Medicine Vol.16 No 2, (134-140)
5. Coleman P, Nicholl J. Consensus methods to identify a set of potential performance indicators for systems of emergency and urgent care. J Health Serv Res Policy 2010 Apr;15 Suppl 2:(12-8)
6. Liggins K. Inappropriate attendance at accident and emergency departments: a literature review. Journal of Advanced Nursing 1992; 18 (1141-1145)
7. Murphy AW. ‘Inappropriate’ attenders at accident and emergency departments II: health service responses. Family Practice 1998 Vol 15, No.1
8. Murphy AW, Leonard C, Plunkett PK et al. Effect of the introduction of a financial incentive for fee-paying A&E attenders to consult their general practitioner before attending the A&E department. Family Practice 1997 Vol 14, No 6
9. Martin A, Martin C, Martin PB et al. ‘Inappropriate attendance at an accident and emergency department by adults registered in local general practices: how is it related to their use of primary care? J Health Serv Res Policy. 2002 Jul; 7(3): (160-165)
10. Carret MLV, Fassa AG, Domingues MR. Inappropriate use of emergency services: a systematic review of prevalence and associated factors. Cad. Saude Publica. Rio de Janeiro, 25(1): 7-28, Jan 2009.
11. Coleman P, Irons R, Nicholl J. Will alternative immediate care services reduce demands for non-urgent treatment at accident and emergency? Emerg Med J. 2001 Nov;18(6): (482-487)
80

4. Measuring the patient perspective of the emergency and urgent care system This component of the programme is detailed in the 2009 interim report and summarised here. We undertook a qualitative study of recent system users’ experiences and views of the emergency and urgent care system to identify the characteristics of the system important to patients (see section 4.1). We tested different ways of identifying and surveying users of the system (see section 4.2). We developed and tested the validity of the Urgent Care System Questionnaire based on the qualitative research in 4.1 (see Section 4.3). Finally, we explored the types of information the survey provided about an emergency and urgent care system (see Section 4.4).
4.1 What characteristics of a system are important to patients?
We undertook a qualitative study of recent users of the system. This was published in a peer-reviewed journal in 2008. The abstract is below:
Objectives: To explore patients’ views and experiences of the emergency and urgent care system to inform the development of a questionnaire for routine assessment of the system performance from the patient perspective.
Methods: Qualitative research with people who had recently used the system: 47 people in eight focus groups and 13 individual interviews.
Findings: Recurrent themes included characteristics of the system which are rarely addressed in service-specific questionnaires, in particular confusion over the most appropriate service to use for their health problem, coordination between services, and informational continuity across services. Other characteristics were identified which, although commonly included in service-specific questionnaires, could have system-level consequences. These included communication between health professionals and patients, and ease of access to services. For example, patient perception of poor communication with one service could increase their subsequent use of other services in the system. Proactive behaviour from health professionals was an important characteristic because it could allay patient anxiety by making them feel that their concerns were being taken seriously, and could sort out problems such as feeling stuck in, or bounced around, the system. ‘Candidacy’, whereby eligibility for health care is determined between the user and the service provider, was evident across the social spectrum when seeking help urgently.
Conclusions: Questionnaires designed to assess patients’ views and experiences of emergency and urgent care should address system-level as well as service-specific issues in order to address the full range of patient concerns.
O’Cathain A, Coleman P, Nicholl J. Characteristics of the emergency and urgent care system important to patients: a qualitative study. Journal of Health Services Research and Policy 2008;13:19-25.
81

4.2 How is it best to locate and survey recent users of the system?
We compared a telephone population survey with a postal population survey. This was published in a peer-reviewed journal in 2010. The abstract is below:
Background: To address three methodological challenges when attempting to measure patients’ experiences and views of a system of inter-related health services rather than a single service: the feasibility of a population survey for identifying system users, the optimal recall period for system use, and the mode of administration which is most feasible and representative in the context of routine measurement of system performance.
Methods: Postal survey of a random sample of 900 members of the general population and market research telephone survey of quota sample of 1000 members of the general population.
Results: Response rates to the postal and market research telephone population surveys were 51% (457 out of 893 receiving the questionnaire) and 9% (1014 out of 11924 contactable telephone numbers) respectively. Both surveys were able to identify users of the system in the previous three months: 22% (99/457) of postal and 15% (151/1000) of telephone survey respondents. For both surveys, recall of event occurrence reduced by a half after four weeks. The telephone survey more accurately estimated use of individual services within the system than the postal survey. Experiences and views of events remained reasonably stable over the three month recall time period for both modes of administration. Even though the response rate was lower, the telephone survey was more representative of the population, was faster and cheaper to undertake, and had fewer missing values.
Conclusions: It is possible to identify users of a health care system using a population survey. A recall period of three months can be used to estimate experiences and views but one month is more accurate for estimating use of the system. A quota sample market research telephone survey gives a low response rate yet is more representative and accurate than a postal survey of a random sample of the population.
O’Cathain A, Knowles E Nicholl J. Testing survey methodology to measure patients' experiences and views of the emergency and urgent care system: telephone versus postal survey. BMC Medical Research Methodology 2010; 10:52.
82

4.3 A validated instrument for measuring views of the system
We developed a questionnaire based on the qualitative research reported in 4.1 and tested its validity in the surveys reported in 4.2. This was published in a peer-reviewed journal in 2011. The abstract is below:
Background: Patients seeking emergency and urgent care tend to experience a system, making choices about which service to use, and making use of a number of services within a health care episode. The aim was to psychometrically test the Urgent Care System Questionnaire (UCSQ) for the routine measurement of the patient perspective of the emergency and urgent care system. Methods: The UCSQ was developed based on qualitative research with recent users of the system. It consisted of a screening question to identify recent users, and questions on the patient experience of, and satisfaction with, their most recent event. The acceptability, validity and reliability of the UCSQ were tested in a postal survey of 900 members of the general population and a telephone survey of a quota sample of 1000 members of the general population. Results: The response rate to the postal survey was 51% (457/893). In the telephone survey 11604 calls were made to obtain a quota sample of 1014 people. These surveys identified 250 system users in the previous three months. Principal components analysis identified three satisfaction components with good internal consistency (Cronbach’s alpha between 0.7 and 0.93): ‘progress through the system’ (10 items), ‘entry into the system’ (3 items), and ‘patient convenience’ (5 items). These components varied as expected by age and overall rating of the system. Conclusion: Preliminary testing suggests that the UCSQ has reasonable acceptability, validity and reliability. Further testing is required, particularly its responsiveness to changes in emergency and urgent care systems.
O’Cathain A, Knowles E, Nicholl J. Measuring patients’ experiences and views of the emergency and urgent care system: Psychometric testing of the Urgent Care System Questionnaire. BMJ Quality & Safety, Published Online First: 5 January 2011 doi:10.1136/bmjqs.2009.036574
83

4.4 Measuring patients’ experiences and views of a system We used the survey results from 4.2 to consider the aspects of a system that could be described and monitored. This will be published in a peer-reviewed journal in 2011. The abstract is below:
Background: Surveys of patients’ experiences and views of health care usually focus on single services. During an unexpected episode of ill health, patients may make contact with different services and therefore experience care within an emergency and urgent care system. We developed the Urgent Care System Questionnaire and used it to describe patients’ experiences and views of an emergency and urgent care system in England. Methods: A market research company used quota sampling and random digit dialling to undertake a telephone survey of 1000 members of the general population in July 2007. Results: 15% (151/1000) of the population reported using the emergency and urgent care system in the previous three months. Two thirds of users (68%, 98/145) contacted more than one service for their most recent event, with a mean of 2.0 services per event. Users entered the system through a range of services: the majority contacted a daytime GP in the first instance (59%, 85/145), and 12% (18/145) contacted either a 999 emergency ambulance or an emergency department. Satisfaction with all aspects of care diminished when four or more services had been contacted. Conclusions: This is the first study to describe patients’ experiences and views of the emergency and urgent care system. The majority of patients experienced a system of care rather than single service care. There was an indication that longer pathways resulted in lower levels of patient satisfaction. Health care organisations can undertake similar surveys to identify problems with their system or to assess the impact of changes made to their system.
Knowles E, O’Cathain A, Nicholl J. Patients’ experiences and views of an emergency and urgent care system. Health Expectations, in press.
84

5. Case studies of changes made in four emergency and urgent care systems 5.1 Background Systems, and the services within them, are frequently assessed and re-modelled to meet the needs of the population. There is a need to measure the performance of systems and the effect of any changes made to them. We recruited four primary care trusts (PCTs) planning a large change to their emergency and urgent care system during 2009. The four PCTs Our original plan was to recruit four emergency and urgent care networks (see Section 2) which intended to make changes to their systems. An email invitation was sent to active emergency and urgent care networks that had been identified in an earlier phase of our programme. Networks were asked if they were planning a large change and were interested in participating in our study. One network, operating within a single PCT, was planning a large change to their emergency and urgent care system within our research timescale and was selected to participate in the study. Following discussions with the Department of Health (DH), we decided to include a ‘DH leader’ of change in urgent care and an early adopter of the summary care record. This latter choice was made to facilitate the calculation of performance indicators (see Section 3). Finally we approached a local PCT planning a large change to their system and they agreed to participate in our study. The planned changes Each PCT described the changes that they were planning to their emergency and urgent care system (Table 5.1). Three PCTs implemented their system change at one point in time, whereas one – PCT ‘A’ - introduced changes at two time points. Prior to the planned change, all PCTs had an emergency department within their geographical boundary and three of the PCTs had a NHS walk-in centre, although one walk-in centre was open at weekends only. One PCT operated a minor injuries unit within its geographical boundary. 5.2 Aims and objectives The primary aim was to determine the impact of changes made to the emergency and urgent care systems. However, this relied on using approaches to measuring change – in particular the Urgent Care System Questionnaire (UCSQ) to measure changes in patients’ perceptions of the system - which had been validated but not tested for responsiveness to change. Therefore there was a secondary aim of assessing the responsiveness to change of the UCSQ. The objectives were to:
1) understand more about the changes that were planned and the changes that occurred in practice
85

2) explore key stakeholder perceptions of whether the changes had resulted in, or were likely to result in, improvements to the system, and if so, what effects were likely to be seen
3) determine the effect of the changes on patients’ experiences and views of the system 4) measure the impact of the changes on demand for services in the system and on system performance
5) examine the responsiveness of the UCSQ.
Table 5.1: Planned system changes PCT ‘A’ PCT ‘B’ PCT ‘C’ PCT ‘D’
Planned primary changes
GP led health centre (with extended hours) Re-commissioning of Emergency Department: Emergency Room with Urgent Care Centre
Purpose built Primary Care Centre
Purpose built Primary Care Centre
Urgent Care Centre to include a ‘common front door’ to: Emergency Department minors, Walk-in centre, GP out of hours service
Planned secondary changes
Integrated Community Care Pathway (ICCP)
Removal of services: Inpatient paediatrics, SCUBU, Obstetrics, Emergency surgery
Planned date of change
March and September 2009
April 2009 June 2009 August 2009
5.3 Methods We used Yin’s multiple case study approach, with each PCT as a ‘case’.1 There are six key sources of evidence for case studies: documents, records, interviews, direct observation, participant-observation, and physical artefacts.1 We used a range of methods within each case including documentary analysis, observation through site visits, qualitative interviews with key stakeholders, analysis of routine data, and a before and after survey of system users’ experiences and views. We had planned to calculate our performance indicators (see Section 3) for the year before and year after the change. However these indicators are based on Hospital Episode Statistics data which have a time delay and the ‘after’ data were not available at the time of writing this report. Therefore they are not reported here. The focus of each case study was the ‘hub of the change’ e.g. the purpose built primary care centre.
86

1) Document analysis We examined documents that were in the public domain relating to the PCT’s decision to change its emergency and urgent care system. These provided information about the change, the reasons for the change and the expected outcomes. 2) Observation through site visit At least one of our team ‘walked through the process’ of the hub of the change to observe the convenience of access and how the service worked in practice. 3) Qualitative interviews We invited up to six stakeholders in each PCT to take part in a telephone interview. These included PCT commissioners, general practitioners, nurse practitioners, service managers and staff, lead emergency department clinicians, and user group representatives. With consent the interviews were recorded using digital audio equipment. The interviews were guided by a semi-structured interview schedule which was sent to the participant prior to the interview. 4) Routine data We asked each participating PCT for activity data on any new service introduced as part of the change. We also requested activity data for key services which might be affected by the change for one year before and one year after the changes were introduced. We also used the Quarterly Monitoring of Accident and Emergency (QMAE) dataset which covers consultant-led accident and emergency departments (type 1); consultant mono-specialities e.g. ophthalmology or dentistry (type 2); and doctor or nurse-led urgent care services provided on a ‘walk-in’ basis (type 3, excludes GPs), for the same before and after the change time periods. 5) System user surveys A market research company was engaged to undertake a telephone survey of recent system users in each PCT before and one year after the change. We identified the relevant postal districts within each PCT boundary and the proportion of the population residing within each postal district. This, alongside the age/sex demographic of the population, formed the frame for quota sampling. The market research company undertook random digit dialling with one attempt to contact a landline telephone number, aiming to identify 1000 respondents, representative of the age/sex profile of the PCT population. Standard market research procedures were followed to identify an adult to speak to within a household who was aged 16 and over. An adult or a child in the household was selected as the focus of the interview in line with meeting the quota sample. In each PCT the survey was undertaken approximately one month prior to any system change. The ‘pre-change’ surveys were administered between February and May 2009, with the ‘post-change’ surveys administered exactly 12 months later. Ethics As the study did not recruit participants from the NHS, NHS ethics approval was not required. Ethical approval was obtained from the University of Sheffield, and
87

relevant NHS R&D departments were sent a courtesy letter informing them of the study. Questionnaire The UCSQ was developed based on qualitative research with recent users of the emergency and urgent care system (see Section 4). It was then piloted and modified after psychometric testing. All participants were asked a screening question about whether they had sought help for a recent urgent health problem, and some socio demographic questions. If they had sought help urgently from health services in the last three months they were asked to complete the remainder of the questionnaire in relation to their most recent urgent health problem. They described their care pathway and their satisfaction with different aspects of the emergency and urgent care system. 5.4 Case study analyses The survey User satisfaction with different aspects of the system was compared before and after the system change. Regressions were undertaken using general linear models when comparing continuous variables, and logistic regression for binary variables. When making comparisons within PCTs, adjustments were made for the different age, sex, and ethnic profiles of system users in the two time periods assessed because how services are used, and satisfaction with healthcare, are likely to depend on these variables. In particular, satisfaction with healthcare is known to be related to age, with older people more satisfied than younger people. Data were analysed using SPSS version 16.0. Within case Data from each source were analysed separately and then brought together to provide an integrated ‘case study’ for each PCT (Figure 5.1). The findings from each data set were compared to identify convergence, complementarity and any apparent contradictions. Multiple cases After analysing each case separately we undertook a multiple case study analysis by using ‘pattern matching logic’ to look for cross-case patterns.1
88

Figure 5.1
Site visits
Document analysis
Routine data Local and national
Performance indicators
UCSQ (Patient survey)
Interviews
Hub of change
5.5 Findings The findings are reported in three sections: the results of the before and after surveys, the findings for individual cases, and the multiple case findings. THE SYSTEM USER SURVEYS Response rates The response rates were broadly similar across PCTs, ranging from 30% to 35% (Table 5.2). The response rates were higher than our earlier pilot study2 and other published telephone surveys using a similar approach.3-5
89

Table 5.2: Response rates to system user surveys
A B C D 2009 2010 2009 2010 2009 2010 2009 2010 Total calls made
4531
4928
4616
4603
4783
4646
4479
4893
Calls where potential participant did not have the opportunity to respond
1558 1572 1678
1668 1424 1753 1562 1790
Calls resulting in a completed questionnaire
1016 1010 1006 1000 1000 1000 1002 1000
Response rates 34% (1016/2973)
30% (1010/3356)
34% (1006/2938)
34% (1000/2935)
30% (1000/3359)
35% (1000/2893)
34% (1002/2917)
32% (1000/3103
PCT population demographics The 2001 Census was used to create a demographic profile for each PCT (Table 5.3). The PCTs have similar age profiles apart from ‘D’ which has a slightly younger population. PCT ‘D’ also has a larger proportion of the population from ethnic minority communities than the other PCTs. PCTs ‘A’ and ‘C’ have fewer adults educated to degree level, and poorer general health than individuals in other PCTs.
Table 5.3: Demographic profile of each PCT population (2001 Census) A
% B %
C %
D %
Age group: 0-4 5-19 20-44 45-64 65+
6 20 33 24 16
6 20 34 25 15
6 20 34 25 16
7 21 38 23 10
Gender: Male
49
49
49
50
Ethnicity: White
98
94
97
91
Housing status: Owner occupier
70
76
65
70
Education: Qualifications at degree level or higher
12
18
12
19
General health: ‘not good’
12 10 12
7
Total population N 286,866 180,608 248,175 207,507
90

System use and seasonal variation The use of the system in the previous three months varied between 12% and 21% across the four PCTs. System use within each PCT remained relatively stable apart from in ‘A’ where the use of the system in the previous three months reduced from 21% in 2009 to 12% in 2010 (Table 5.4). There was also some evidence of this in PCT ‘B’, where use of the system reduced by 3.5 percentage points. This was highly unlikely to be due to changes made to the system and we needed to explore reasons for these differences. There was no evidence that the difference was due to the survey administration; we explored this for PCT ‘A’, checking that the two surveys had been undertaken in a similar way and also checking routine data on service use in the two time periods. We concluded that this difference was likely to be due to a spike in GP consultations for respiratory problems and influenza which occurred nationally during the survey period in PCT ‘A’ in 2009.6 Table 5.4: Data capture period and use of system
A B C D
2009 2010 2009 2010 2009 2010 2009 2010
Survey date 9th February
8th February
23rd March
22nd March
27th April
26th April
26th May
24th May
Number of respondents
1016 1010 1006 1000 1000 1000 1002 1000
Three month recall period
Nov 2008–Feb 2009
Nov 2009–Feb 2010
Jan-Mar 2009
Jan-Mar 2010
Feb-Apr 2009
Feb-Apr 2010
Mar-May 2009
Mar-May 2010
Use of services in last 3 months % (n)
20.6 (209)
11.7 (118)
18.5 (186)
15.0 (150)
13.0 (130)
11.9 (119)
14.7 (147)
14.9 (149)
System user demographics We would expect the demographic profile of system users to be similar in the two time periods within each PCT. Some differences were found within PCTs for the age groups of 20-44 in both the ‘C’ and ‘D’ samples. In addition there were some gender differences in the ‘C’ sample, and ethnicity differences in the ‘D’ sample (Table 5.5). All analyses have been adjusted for these differences.
91

Table 5.5: Demographic profile of system users
A B C D
System
users
(2009)
%
System
users
(2010)
%
System
users
(2009)
%
System
users
(2010)
%
System
users
(2009)
%
System
users
(2010)
%
System
users
(2009)
%
System
users
(2010)
%
Age group:
0-4
5-19
20-44
45-64
65+
10
19
28
30
13
14
17
28
28
13
13
20
27
24
16
21
17
24
25
12
11
22
33
20
14
13
29
19
21
19
18
22
33
24
3
17
24
21
28
11
Gender:
Male
Female
41
59
43
57
34
66
38
62
45
55
34
66
40
60
33
67
Ethnicity:
White
Non white
96
4
98
2
97
3
97
3
99
1
97
3
88
12
93
7
Length of pathway for most recent health event System users reported using between 1 and 7 services for their most recent urgent health problem (Table 5.6). The mean number of services in a pathway remained unchanged within PCTs ‘B’ and ‘C’ but decreased in ‘A’ (p=0.001) and increased in ‘D’ (p=0.033). Table 5.6: Number of services used in most recent contact
A B C D
2009 2010 2009 2010 2009 2010 2009 2010
Range 1-7 1-4 1-5 1-5 1-7 1-6 1-4 1-5
Mean 2.0 1.6* 1.7 1.7 1.8 1.8 1.6 1.8**
*p=0.001, **p=0.033 (comparison within area and adjusted for age, sex, and ethnicity)
Services on pathways System users were asked to list all the services that they contacted for their most recent urgent health episode (Table 5.7). As might be expected the majority of system users had made contact with someone at a general practice. Across all PCTs there was a decrease in those reporting using a general practice ‘in hours’ in 2010. This may be related to an increase in use of extended hours in general
92

practice in that year. There were statistically significant changes in three PCTs. In ‘A’, it appeared that use of ‘in hours’ general practice had decreased by 12 percentage points (p=0.049). The use of a pharmacist also showed a similar trend. This might be explained by the national spike in consultations for respiratory and influenza-like illness during the 2009 data capture period in PCT ‘A’. In PCT ‘B’ there appeared to be a large increase in the use of the GP out of hours service (p=0.048). The GP out of hours service and walk-in centre (WIC) were co-located in both time periods, moving into the new primary care centre as part of the changes. It is possible that patients were unsure of the name of the service that they accessed. In PCT ‘D’ there was a 7 percentage point reduction in the use of out of hours GP (p=0.049), a reduction in the use of an emergency department (-5%), and an increase in system users accessing a pharmacist (+5%). Table 5.7: Service types used for most recent health problem A B C D
2009
%
2010
%
2009
%
2010
%
2009
%
2010
%
2009
%
2010
%
GP/nurse in
general practice
(in hours)
62 50* 55 49 54 47 50 43*
GP (out of hours) 13 19 3 9*** 8 10 12 5*
ED 25 27 23 27 32 30 27 22
999 7 8 5 9 7 9 5 4
WIC 3 7 19 13 9 14 23 24
NHSD 14 10 9 9 10 8 13 9
Pharmacist 27 14** 18 11 18 19 12 17
*P=0.049, **p=0.007, ***p=0.048, (comparison within area and adjusted for age, sex, ethnicity)
93

Entry into the system: first service used System users were asked to identify the first service they had made contact with for their most recent urgent health episode (Table 5.8). The majority of system users contacted a general practice during the day in the first instance. Table 5.8: First service contacted on pathway A B C D
2009
%
2010
%
2009
%
2010
%
2009
%
2010
%
2009
%
2010
%
General practice (in
hours)
57 48 48 45 45 40 45 48
GP (out of hours) 7 14 3 6 5 9 8 3
ED 11 14 11 15 23 21 12 13
999 6 2 3 9 5 6 3 3
WIC - 4 16 10 2 8 14 20
NHSD 12 8 7 7 11 7 10 7
Pharmacist 1 1 2 1 2 1 0 1
Other 6 7 11 6 5 4 6 5
Satisfaction System users were asked for their views on the extent to which care was given with sufficient urgency, the number of services contacted, and overall care received (Table 5.9). On the whole, it appeared that system users were satisfied with the number of services on their pathway; 10% or less of system users felt that they had contacted “too many” services. The majority of system users felt their case had been managed with sufficient urgency and less than 10% of users felt they had received “poor” or “very poor” care overall. Respondents within PCT ‘D’ tended to have lower satisfaction levels than respondents in the other areas. After adjustment for the system user profiles, there was no evidence of any differences in satisfaction within each area. Psychometric testing on the pilot questionnaire identified three discrete domains of system satisfaction: entry into the system, patient convenience of the system, and progress through the system. Each domain has a maximum score of 5. Overall, patient convenience of the system received lower scores than the other domains, whilst entry into the system achieved the highest mean scores (Table 6.10). After adjustment for the system user demographic profiles, there was no evidence of any change in domain scores within PCTs ‘A’ or ‘D’. In ‘B’ there was evidence of increased satisfaction with entry into the system (p=0.011), and progress through the system (p=0.023). In ‘C’ there was an increase in satisfaction with entry into the system (p=0.001).
94

Table 5.9: Satisfaction with the system
A B C D
2009
%
2010
%
2009
%
2010
%
2009
%
2010
%
2009
%
2010
%
The number of services contacted:*
Just right
Too many
Too few
93
7
<1
96
4
0
95
3
2
93
6
1
95
5
1
97
2
2
88
10
1
90
8
2
Case managed with sufficient urgency:**
Yes definitely
Yes I think so
No I don’t think so
Definitely not
66
25
7
2
68
19
5
8
68
24
5
3
60
29
7
4
66
20
7
7
61
27
5
8
54
24
10
12
50
31
13
5
Overall care received:***
Excellent
Very Good
Good
Fair
Poor
Very Poor
48
27
15
5
2
3
42
31
12
9
3
3
46
27
18
6
2
1
43
25
21
4
5
2
41
32
16
4
4
3
45
27
16
8
3
3
29
37
18
7
6
3
33
29
20
11
1
5
(binary logistic regression: * “just right” vs remaining responses, ** ”yes, definitely” vs remaining responses, *** ”excellent” vs remaining responses)
Table 5.10: Satisfaction domains (mean scores)
A B C D
2009 2010 2009 2010 2009 2010 2009 2010
Entry into the system 4.29 4.32 4.21 4.38
*
4.12 4.47
**
4.26 4.23
Patient convenience of the
system
3.98 3.89 3.91 3.92 3.88 3.90 3.79 3.83
Progress through the
system
4.16 4.09 3.99 4.16
*
4.01 4.18 3.94 3.95
*<0.05 **<0.001 (comparison within area and adjusted for age, sex, and ethnicity)
95

Summary of survey results
• Results of the before and after surveys for PCT ‘A’ were compromised by variation in system use. Results for PCT ‘B’ may also have been compromised to a lesser extent.
• Information about type of service depends on user knowledge. • Changes in user satisfaction with some aspects of the system were
identified for PCTs ‘B’ and ‘C’.
INDIVIDUAL CASES PCT ‘A’ Interviews were undertaken with six staff in the PCT and the foundation trust. Each participant had direct involvement in designing, commissioning, implementing or providing the changes. Details of the planned change The primary change was the reconfiguration of a type 1 accident and emergency department into a new Emergency Department (ED) housing an Unplanned Care Centre for non life threatening conditions, and an Emergency Room for patients with serious health conditions, trauma or in need of resuscitation. To integrate primary care expertise, the Emergency Out-of-Hours (OOH) Service was co-located in the ED. The investment included a new telephone system whereby patients would phone their own GPs and during OOH the call would be diverted automatically to the call handling service in the ED. The Trust continued to maintain a Minor Injuries Unit on another site. A smaller change was the introduction of an 8-8 GP-led equitable access facility providing care for registered and non-registered patients on an appointment and walk-in basis close to the town centre. The PCT had plans to build large new primary care walk-in facility in the future, close to the railway station, bus interchange and central shopping area. The introduction of these changes were part of a bigger urgent and emergency care programme that included a significant proportion of GPs having extended opening hours, a minor injuries unit, Emergency Care Practitioners, community pharmacists trained to deal with minor ailments, nurses and matrons to better manage patient with chronic conditions, a separate work stream for mental health, and a dental access centre. The changes in practice Some changes occurred as planned in the ED. As part of these, patients are seen either in the Emergency Room (around 24,000 attendances annually) or the Unplanned Care Centre (around 72,000 attendances annually) depending on whether the condition is ‘major’ (emergency or life-threatening) or ‘minor’. All ambulatory patients enter by a common door and share the same reception and waiting room. Attendees are seen in order of arrival on a ‘see and treat’ basis unless symptoms of serious health conditions require a patient to be given priority. Although the sharing of patient information occurs electronically within different providers and from providers to GPs, any shared information across the wider system was described by interviewees as paper-based.
96

The interviewees described the changes focused around the ED as large scale and dynamic. They indicated that full implementation of the changes had taken longer than expected and that the changes were still in development at the time of the interviews. The 8-8 centre was established as planned. It is located in the premises that had been occupied by the GP OOH service before the service moved into the ED. Although the 8-8 premises are not visible from the main road, the interviewees reported that the population is familiar with its location due to the premises being occupied previously by the GP OOH service. Expectations of the change The aims of the changes in PCT ‘A’ were stated in documents on the PCT and Trust websites. The ED-focused change aimed to improve patient access to unscheduled care, provide timely assessment and treatment at the appropriate level, and minimise unnecessary admissions to hospital. Opening from 8 in the morning until 8 in the evening every day, the primary care centre was part of the national strategy to improve access to primary care and reduce demands on the ED. Interviewees felt that the 8-8 centre had provided flexibility for patients who may find it difficult to see a GP during the day because of work or other responsibilities, thereby improving access to primary care especially for those visiting, living or working in and around the centre of town. Interviewees described economic migration of different population groups in and out of the PCT area and how the 8-8 centre is used regularly by those who do not use the GP system or prefer not to use appointments when seeking health care, for example, migrant families with young children. Impact on the system Given that the process of making the changes around the ED was ongoing at the time of the interviews and the ‘after’ survey, we would expect to see little impact on the emergency and urgent care system either using routine data or the system user survey. Interviewees felt that the ED needed a period of stability to consolidate and build on what had already been achieved. They reported that the reduction in avoidable admissions expected by the changes to the ED was yet to be achieved and that the changes had not impacted on ED attendances. The routine data supported this view in that there was no evidence of reduction in ED attendance (Figure 5.2). There was evidence of an increase in use of GP OOH services from the routine data. PCT data showed that GP OOH calls rose by 9.3% between 2008/9 and 2009/10 (from 61497 to 67276). Interviewees explained this increase by reporting that historically GP OOH activity in the PCT has been low and below the national average. The system user survey indicated increases in GP OOH activity but this may have been due to changes to general practice opening hours during 2010.
97

Figure 5.2 PCT ‘A’: All type 1 A&E activity 2008-9 and 2009-10 for Foundation Trust
Site A: All type 1 a&e activity 2008-9 and 2009-10
0
20000
40000
60000
80000
100000
120000
140000
160000
180000
2008-9 2009-10
Srce: DH QMAE statistics
Impact on user satisfaction with the system We had the problem of being unable to compare like with like in the PCT ‘A’ user survey because system use had been high in 2009 due to a spike in respiratory disease nationally over the period of data collection in this PCT. The user survey showed no change in satisfaction (measured over three domains by access, progress, and convenience) before and after the changes. The interviewees stated that they would have been happy with no change because they described their work to maintain consistent standards of service delivery during a challenging transitional period when patient satisfaction might have been expected to decrease. However, we might have expected some change in user satisfaction with accessibility to the system because the 8-8 centre had been opened. Challenges Despite tensions, the interviewees were confident in the integrative model which was moving forward with the full support of the PCT and the Trust. Interviewees felt that the change focused on the ED had overcome many challenges and was moving in the right direction. The barriers that had been overcome were the physical and environmental upheaval of the reconstruction work, financial pressures, ongoing challenges in staffing (historically the ED in PCT ‘A’ was reported as an under-recruited department), several changes in key posts, team
98

building in a Trust where emergency and urgent care is split between two sites, integrating primary and acute care clinicians who have different ways of working into a type 1 ED setting, and the lack of good quality data to monitor progress. Interviewees felt that what the ED needed now was a period of stability to consolidate and build on what had been achieved to date. PCT ‘B’ In PCT ‘B’, interviews were undertaken with three key staff in the PCT and the providers involved directly with the changes. Details of the change A new-build modern health facility was commissioned in the town centre to supplement existing acute services provision. The planned changes were to integrate urgent care services, introduce a rapid access and treatment service (RATS) to reduce unnecessary waiting times, and address inequalities in access to primary care in the residential areas around the town centre. The new centre would house three services within the same building: 1) GP OOH care (telephone and appointments only between 6.30 pm to 8.00 am) 2) a nurse-led ‘walk-in’ service between 7.00 am and 10.00 pm weekdays, and 9.00 am-10.00 pm at weekends); and 3) GP care provided on a walk-in or appointment basis. The change in practice The structural changes occurred as planned. The site visit and the interviews confirmed that the centre is centrally located, bright and airy with good links to all public transport, road and pedestrian access. A limited amount of free car parking is available for users. During our site visit the centre appeared to be busy. The intentions to modernise services and provide good physical access appeared to have been met. The GP out of hours, WIC, and GP practice have been consolidated on the same site. The main business of the WIC is episodic health problems that can usually be dealt with in one visit. Traditionally, a walk-in centre is a nurse-led model but GP availability on site enables the centre to provide a flexible clinical response according to patient need. There is a pharmacy on the site but no diagnostics. Any user presenting with serious health symptoms, e.g. chest pains, trauma or an acute medical problem, is referred to the appropriate provider (ED or 999 ambulance service) without delay. The interviewees described the centre as popular with people who work in the central area (i.e. registered with a GP elsewhere) and find it convenient to seek care after work or during their breaks. Waiting times for users even at busy periods were reported to be no longer than 40 minutes. The GP practice was described as attracting registrations from a particular area in the town, mobile populations and groups whose needs previously have been ‘under-doctored’, for example bail hostels. The general practice list was reported as being above its predicted target. There has been investment in an ADASTRA computer system to enable patient information to be shared between the three providers, and to send messages to inform GPs of OOH visits to the centre by their registered patients. PCT ‘B’ is a national summary care records site so some generic information is also available. However, the view expressed in the interviews was that sharing patient information across the wider system is at an early stage of development.
99

The new centre in PCT ‘B’ forms part of a larger urgent and emergency care programme that includes a significant proportion of GPs having extended opening hours, a walk-in centre, consultant clinics in nursing homes, pharmacists, two new GP practices, and a social marketing campaign of ‘Choose Well’ to highlight what is appropriate for the ED (which is available 24/7) and the other options are available when seeking care urgently. Expectations of the change The aims of the change were obtained from the business case and the interviews. The principal benefits expected from the changes were improvements to the quality of patient care, reductions in ED attendances locally which were rising year on year, and cost efficiencies by providing access to treatment at an appropriate level to match patient need. The centre was not intended to substitute for care commissioned from GP practices. Impact on the system We did not have routine data on attendances at the new centre. The interviewees referred to adopting a ‘steady approach’ to promoting the new centre, ‘by stealth’ rather than an all out advertising campaign. The rationale for this was to avoid generating public expectations that the system cannot meet. Given that the changes occurred as planned we would expect to see some impact on the system. The interviewees referred to a levelling off in ED attendances locally. Routine data from the PCT for April 2008-March 2009 and April 2009-March 2010 showed no change in use of the ED (Figure 5.3). We have been unable to verify this using the QMAE data because the type 1 a&e activity in PCT ‘B’ is masked by the overall figures for the Acute Trust which covers several PCTs. The interviewees suggested the stabilising of ED attendances may be linked to the availability of the new centre. However, we have no additional data to indicate a directional shift in consulting behaviour from one provider to another to support this. There was some indication of an increase in GP OOH activity: an increase of 5.2% in OOH calls was recorded in the PCT routine data (from 31287 in 2008/9 to 32919 in 2009/10. Impact on user satisfaction with the system The national spike in urgent care activity in the first few months of 2009 caused by respiratory problems probably affected our before and after comparison within PCT ‘B’ too, although to a lesser extent. The system user survey in PCT ‘B’ showed evidence of increased patient satisfaction with entry into the system, and also progress through the system. It is possible that this was a real change brought about by the extended opening times and the flexibility of the new centre.
100

Figure 5.3: PCT ‘B’ Type 1 A&E activity 2008-9 and 2009-10
Site B: Type 1 a&e activity
0
10000
20000
30000
40000
50000
60000
70000
2008-9 2009-10 Srce Site B PCT data
Challenges The interviewees identified some challenges affecting the capacity of the centre to function at full strength. Staffing the nursing rotas with a consistent skill-mix affected the level of service that could be provided. For example, the availability of nurse prescribers was variable. Interviewees felt that although service users were not aware of this necessarily, it could impact on waiting times adversely. The interviewees reported positive engagement between the new centre and the Acute Trust, and also between the centre and the wider GP community. Initially, relations with the ED were described as ‘frosty’ but there was an emerging appreciation amongst the senior clinicians of benefits of releasing capacity to other providers to enable the ED to achieve its 4-hour target. Interviewees felt that the ability of the centre to provide for users presenting with mental health needs is under-developed. Mental health is the responsibility of a different Trust to the Acute Trust and introduces a further layer to the process of engagement necessary for the providers to work together effectively. Finally, the lack of diagnostics in the centre means that anyone requiring an X-ray, for example, is referred to the Trust ED. These factors appear to limit the immediate potential of the centre to provide a fully integrated service and substitute for other acute services. Conversely, a concern expressed in the interviews was that although the intention was not to duplicate existing GP provision, there was a feeling that the centre may be used as an overflow for patients who cannot get an appointment with their own GP when it is convenient for them.
101
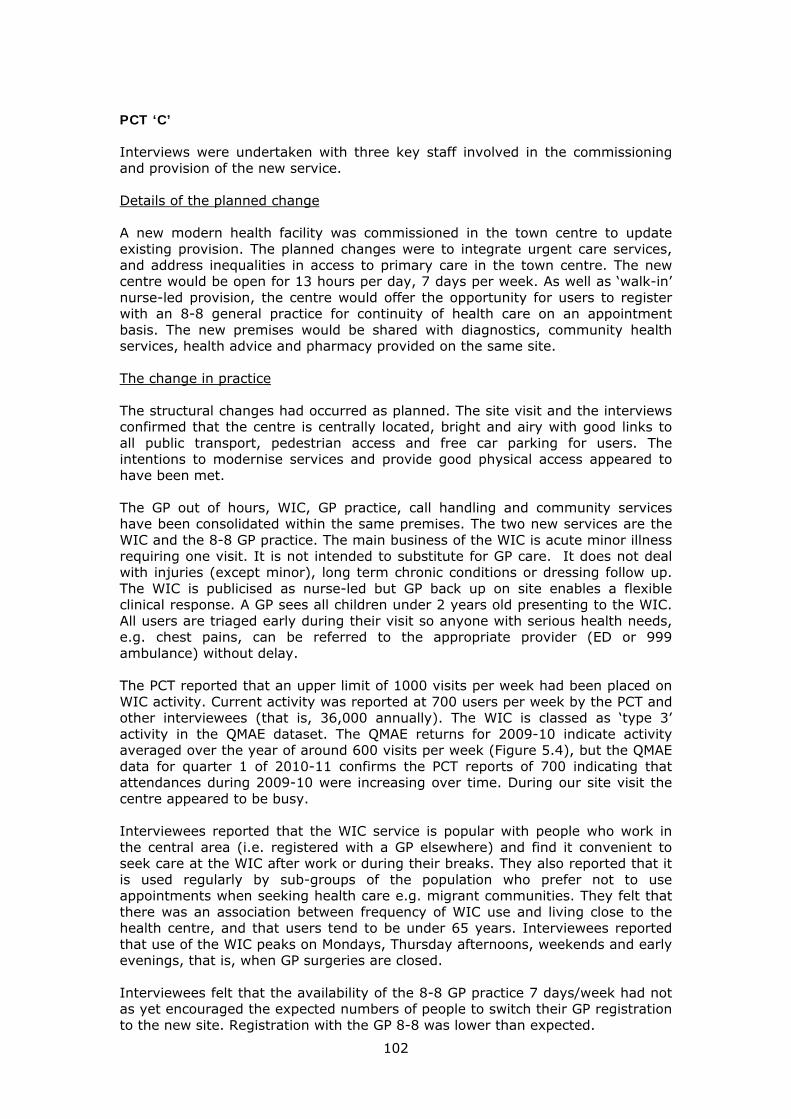
PCT ‘C’ Interviews were undertaken with three key staff involved in the commissioning and provision of the new service. Details of the planned change A new modern health facility was commissioned in the town centre to update existing provision. The planned changes were to integrate urgent care services, and address inequalities in access to primary care in the town centre. The new centre would be open for 13 hours per day, 7 days per week. As well as ‘walk-in’ nurse-led provision, the centre would offer the opportunity for users to register with an 8-8 general practice for continuity of health care on an appointment basis. The new premises would be shared with diagnostics, community health services, health advice and pharmacy provided on the same site. The change in practice The structural changes had occurred as planned. The site visit and the interviews confirmed that the centre is centrally located, bright and airy with good links to all public transport, pedestrian access and free car parking for users. The intentions to modernise services and provide good physical access appeared to have been met. The GP out of hours, WIC, GP practice, call handling and community services have been consolidated within the same premises. The two new services are the WIC and the 8-8 GP practice. The main business of the WIC is acute minor illness requiring one visit. It is not intended to substitute for GP care. It does not deal with injuries (except minor), long term chronic conditions or dressing follow up. The WIC is publicised as nurse-led but GP back up on site enables a flexible clinical response. A GP sees all children under 2 years old presenting to the WIC. All users are triaged early during their visit so anyone with serious health needs, e.g. chest pains, can be referred to the appropriate provider (ED or 999 ambulance) without delay. The PCT reported that an upper limit of 1000 visits per week had been placed on WIC activity. Current activity was reported at 700 users per week by the PCT and other interviewees (that is, 36,000 annually). The WIC is classed as ‘type 3’ activity in the QMAE dataset. The QMAE returns for 2009-10 indicate activity averaged over the year of around 600 visits per week (Figure 5.4), but the QMAE data for quarter 1 of 2010-11 confirms the PCT reports of 700 indicating that attendances during 2009-10 were increasing over time. During our site visit the centre appeared to be busy. Interviewees reported that the WIC service is popular with people who work in the central area (i.e. registered with a GP elsewhere) and find it convenient to seek care at the WIC after work or during their breaks. They also reported that it is used regularly by sub-groups of the population who prefer not to use appointments when seeking health care e.g. migrant communities. They felt that there was an association between frequency of WIC use and living close to the health centre, and that users tend to be under 65 years. Interviewees reported that use of the WIC peaks on Mondays, Thursday afternoons, weekends and early evenings, that is, when GP surgeries are closed. Interviewees felt that the availability of the 8-8 GP practice 7 days/week had not as yet encouraged the expected numbers of people to switch their GP registration to the new site. Registration with the GP 8-8 was lower than expected.
102

Expectations of the change The aims of the change were evident from the business case and the interviews. The business case referred to the potential for the WIC to divert activity from the ED. As stakeholders, the Acute Trust had expressed misgivings about the potential scale of the changes planned and the impact of diverting minor cases away from their emergency (ED) to the walk-in centre (WIC). Impact on system Perceptions in the interviews were that attendances at the ED had been increasing historically and that since the changes have been introduced ED attendances have stabilised i.e. they have not risen. The QMEA returns to the DH for 2008-9 and 2009-2010 confirm that attendances to the ED have remained stable (Figure 5.4). Impact on system satisfaction Interviewees felt that the availability of the WIC had made accessing urgent care easier for some groups in the population, and therefore expected an increase in satisfaction in these groups. There was a statistically significant increase in patient satisfaction with entry into the system in the user survey (see Table 5.10 above), increasing from a mean of 4.1 to 4.5. Given that interviewees reported that the WIC was the most active change to the system, and it tended to be used by under 65s, we returned to the survey data to see if the change in satisfaction with access was larger in under 65s than over 65s. The change in the younger age group was from 4.1 to 4.5 (based on approx n=100 users in each time period) and the change in the older age group was from 4.2 to 4.3 (based on approx n=20 users in each time period).
Figure 5.4 PCT ‘C’: A&E activity 2008-9 and 2009-10
Site C: All a&e activity 2008-9 and 2009-10
0
10,000
20,000
30,000
40,000
50,000
60,000
70,000
80,000
2008-9 2009-10
type 1
type 3
Srce: DH QMAE statistics
103

Challenges Although the interviewees perceived tensions to exist between the ED and the WIC around minor case activity, interpretation of the interview data suggests that the ability of the WIC to substitute for the ED is constrained. Although the WIC had a large number of attendances weekly, the interviewees identified some challenges affecting the capacity of the WIC to function at full strength. The interviewees identified constraints as recruitment of appropriately skilled nursing staff, the inability to offer suturing, the lack of staff who can interpret X-rays (even though there are X-ray facilities on the premises), and the lack of a plaster room. Users attending the WIC with acute mental health needs are referred to the ED where the mental health team is based. These factors appear to limit the immediate potential of the WIC to impact on the ED and constrain opportunities for the ED and other services such as 999 ambulance to set up pathways to divert patients from the ED to the WIC. Sharing of patient information was perceived by the interviewees as important for enabling integration between services. The recent installation of an information system that is also used by some GPs (not all) locally was regarded as an important step towards achieving this. PCT ‘D’ Interviews were undertaken with three key participants in the PCT and the providers who had been directly involved with the changes. Details of the planned change Following a review of the urgent care provision that showed that patients were being referred around the system unnecessarily, PCT ‘D’ developed a strategy to simplify patient access into urgent care by joining up multiple care pathways. The plan was to have a common front door to emergency and urgent care. As part of this the PCT commissioned one provider to consolidate a 24/7 walk-in service and GP OOH, and the telephone answering service, in the same building, on the same campus. This was separate to the hospital ED. The change in practice The first step of the planned change was taken. This involved integrating the WIC, GP OOH and telephone answering service under one provider. The new provider company was a collaborative venture between the Trust and the previous GP OOH provider. The site visit and the interviews confirmed that the Urgent Care Centre (UCC) provides a walk-in service and GP OOH on the same campus as the hospital. The centre was built about ten years ago. It is a modern refurbished building with good public transport and road links, and car parking for users. The intentions to streamline 24/7 access into urgent care were met. The centre is staffed 24/7 by GPs and nurses. The staffing rotas are responsive to predicted and unexpected changes in activity which is monitored on a daily basis. The predicted peaks of activity coincide with 5.30 pm and 6.30 pm when GP practices close, weekends, and also Monday mornings when sufficient GP appointments may not be available to meet demand. There are fewer nurses on during the OOH periods. At all other times, there is a mixture of GPs and nurses. During the day, the telephone is not part of the service and although a line is
104

available, users tend to walk in. Users can walk-in during OOH but this is not encouraged. Patients who contact their GP during OOH periods are transferred to the OOH service, triaged by telephone, and if necessary given an appointment to attend the centre to be seen by a GP. The flexibility in the system means the centre can staff up or down in response to unexpected fluctuations in demand. The centre has a small pharmacy. There are no diagnostics. Interviewees reported that the walk-in service is popular with people who wish to seek health care urgently at a time when it is convenient to them, for example, after work, during their breaks or after picking children up from school. The growing population of around 250,000 in the PCT is relatively young and mobile. Interviewees felt that most users refer themselves appropriately. Users may be encouraged to use other services, for example, their own GP, or pharmacy, or the ED, if necessary. PCT data showed current walk-in activity of around 800 visits per week (around 42,000 annually) and this corresponds with the weekly average in the QMAE data for 2010 (Figure 5.5). The main walk-in business is episodic conditions that usually can be dealt with in one visit. The interviewees reported an association between use of the centre and the population registered with practices close to the centre and also with the patients of the busier general practices. GPs are kept informed about visits to the centre by their patients via an ADASTRA system. Information about any special needs that patients may have, for example palliative care, are logged into the centre’s information system to be readily available to the OOH service should the need arise. The interviewees reported that communication with GPs is one-way; although sharing of information electronically has improved in some ways, it still tends to be paper-based. The second step of the planned change did not occur. The common front door to ED and urgent care had not developed. Expectations of the change The primary aims were to reduce ED attendances by having a ‘common front door’ for urgent care and the ED, by which the population could receive the most appropriate level of care for their health needs, and thus realise cost efficiencies. The centre offered a more integrated approach rather than new access. Therefore activity data for the centre (Figure 5.5) looked different from the activity data for the new centre in PCT ‘C’ (Figure 5.4). The change in activity was small over time (Figure 5.5). Impact on the system Only part of the planned changes had occurred. The integration of some urgent care services within a single centre had occurred but the ‘common front door’ (which was most likely to impact on ED use) had not occurred. The interviewees reported that the changes had had no impact on reducing ED attendances and that there had been an increase in demand for services. The available routine data supported this view. The QMAE returns for 2008-9 and 2009-10 for PCT ‘D’ showed a 3% increase in all type 1 activity and a 2.3% increase in type 3 activity (the integrated centre )(Figure 5.5). The PCT data showed a very small increase in GP OOH activity. There was no data to identify whether the increases in activity observed were new demand or a shift in consulting behaviour from one provider to another. The interviewees indicated that the centre might have reduced demands on the district nursing
105

service by offering a dressings service to ambulatory patients at the weekend. They also felt that the integration of the walk-in and GP OOH resulted in significant cost savings achieved through sharing a common reception and pathways. Impact on user satisfaction with the system The focus of the change was on improving integration and we might have expected to see some change in satisfaction with progress through the system, even though only part of the change had occurred. The user survey identified no changes in user satisfaction between the two periods. Figure 5.5 PCT ‘D’ : All A&E activity 2008-9 and 2009-10
Site D: All a&e activity 2008-9 and 2009-10
0
10000
20000
30000
40000
50000
60000
70000
80000
2008-9 2009-10
type 1
type 3
Srce: DH QMAE statistics
Challenges The first stages of the planned changes were achieved. The delivery of 24/7 urgent care was streamlined, the refurbished centre is well-used and the changes were described as ‘cost saving’. One of the benefits expected of the change was to divert activity from the ED by establishing a ‘common front door’. One of the interviewees reported that although the centre refers to other services including the ED, the ED never refers patients to the centre. Two explanations were given for this. Firstly, EDs are incentivised not to turn patients away. Secondly, EDs have a model of care in which they are uncomfortable about referring patients, for whom they are accountable, to another model of urgent care. Contrary to expectations that the centre is not intended to substitute for the work commissioned from GP practices, the interviewees suggested that, in part, the centre is being used as an overspill for patients who are unable to get an appointment with their own GP. There still remains a strong commitment in PCT ‘D’ to achieving the second stage of a ‘common front door’ to ED and ongoing positive engagement with all the stakeholders was reported in the interviews. A view expressed in the interviews
106

and site visit was that a new build project was required to realise full integration enabling a seamless transition from one service to another; this would be difficult when financial flows were contracting. An important trigger perceived by the interviewees to enable closer integration of urgent care was investment in integrated information systems. MULTIPLE CASE STUDIES The case studies for each PCT used a range of data sources. We summarised findings in a single table to help us to consider all the cases together (Table 5.11). Models of change There appeared to be two models of change in operation in our case studies. The first was ‘new service’ which occurred in PCTs ‘B’ and ‘C’, involving new purpose-built premises located in the centre of town. The second model was ‘reconfiguration’ (PCTs ‘A’ and ‘D’), involving reconfiguring existing provision and buildings on hospital sites outside the town centre to provide more integrated models of care. The two ‘new service’ models of change occurred as planned. The two ‘reconfiguration’ models had only achieved part of their plans. Impact on system We need to exercise caution when considering the impact on system demand of changes planned within our case study sites because our approach to measurement was limited. We really required historical trend data and control sites to understand the impact of the changes because demand for emergency and urgent care is increasing annually and changes in demand have numerous causes. Also, there were limitations to the routine data available to us in terms of sensitivity to the local PCT and accuracy. However, there was some suggestion that purpose-built health centres offering extended primary care staffed by GPs and nurses could be associated with stemming the rise in ED activity. This requires verification in a larger study drawing on trends in demand for services over time. Our before and after system survey of users was compromised for two PCTs because of a national spike in system use in part of one of the years. The data on use of services was difficult to interpret in practice because we were not confident that users could distinguish between types of service, particularly if services were co-located. Measures of patient views of the system behaved as expected, with improvements evident in the two PCTs where the change had been achieved. Also, in one new service which was used by younger people the change in user satisfaction was evident in younger people only. There was evidence that ‘new service’ changes had a positive effect on system user satisfaction. This also supported the responsiveness to change of the UCSQ. Challenges associated with changing systems There were x key challenges associated with making changes to the emergency and urgent care system:
• Collaboration between stakeholders: Interviews within all the sites indicated that relationships between the new providers, the ambulance
107

108
service, community and district nursing, and the wider GP community generally, were good. Some tensions were described as existing between the ED in the Acute Trusts and the new independent sector providers over minor caseload activity. The reasons evident in the interviews for this were that the ED has financial incentives not to turn patients away, the rewards for the minor activity subsidises the major work in the ED, and that EDs have a model of care in which they are accountable for their patients and are reluctant to refer them into other models of care.
• Workforce: Three of the four PCTs (A, B & C) reported ongoing challenges
with staff recruitment and training which may be restricting the potential to develop new care pathways and reduce demands elsewhere in the system. Difficulties in staff recruitment or having the appropriate skill-mix to staff the nursing rotas, for example, nurse prescribers, or the ability to suture, limited ability to provide a consistent level of service for patients.
• Integrated information systems: These were required to enable different
providers to share information across organisational boundaries and were identified as important mechanisms to enable closer collaboration between new and existing urgent care services in the wider system and improve patient care.
• Provision of specific services: Other challenges to fully integrated systems
of care affecting the ability of primary or urgent care centres to substitute for ED were around the need to develop capacity to provide a service for users with mental health needs, and to be able to have and undertake diagnostic testing on site. The centres in PCTs B and D did not have diagnostics, for example X-ray on site. PCT C had X-ray equipment but not the staff to use them.
5.6 Discussion
The two PCTs adding a new service to their emergency and urgent care system succeeded in implementing planned changes whereas the two PCTs reconfiguring existing services had only partly implemented planned changes. There was evidence that adding a new primary or urgent care centre into a system could improve user satisfaction with access to the system. Strengths and limitations We had a good mix of types of changes that were typical of changes which PCTs in England attempt to make. There were three limitations. The first was the difficulty obtaining routine data for use of key services in the system that was both sensitive and accurate. The second was the limitation of not having controls given the incessant rise in demand for emergency and urgent care and the potential for national spikes in demand for emergency care to compromise comparisons between years before and after any change. The third was our inability to obtain the views of patient representatives in our case study interviews.

Table 5.11 Multiple case study analysis display: Key themes emerging from site specific case studies of changes to systems of emergency and urgent care
Site Change Aim Actual Impact Challenges EUC system activity Patient satisfaction
ED OOH WIC Entry Ease* Progress
Staffing Informa-tion sharing
Diagnostics
Collaboration between providers
A 1. Re-configuration of A&E and OOH to integrate GPs and Acute care clinicians in ED on hospital site away from town centre 2. 8-8 GP-led centre in existing premises near town centre
Reduce avoidable admissions Improve access to primary care
In progress
Increase
Increase
Increase
No change (N/C)
Under-recruit-ment; Changes in key posts No issues reported
Needs improving
Available Not available
Workplace tensions in between GPs and ED staff in ED setting Separate initiative
B New purpose built facility in town centre integrating WIC, OOH and GP practice
Improve access to care; reduce ED attendances
Achieved Same Increase Increase Increase N/C Increase
skill mix in nursing rotas
Needs improving
Not available
Tension with ED over minor case activity
C New purpose built facility in town centre integrating WIC, OOH and GP practice
Improve access to care; reduce ED attendances
Achieved Same No reliable data
Increase Increase N/C N/C skill mix in nursing rotas
Needs improving
Available but lacking capacity to use
Tension with ED over minor case activity
D Reconfiguration of OOH, WIC and telephone in refurbished building on hospital site away from town centre
Improve access to care; reduce ED attendances via ‘common front door’ for ED and UCC
In progress
Increase Increase Increase No change (N/C)
No issues – GPs and nursing rotas responsive
Needs improving
Not available
Tension with ED over minor case activity
Evidence sources Document analysis
Interviews Document analysis Interviews
PCT data Site visit Interviews
User survey, DH QMAE, PCT routine data, and interviews
User survey and interviews Site visit and interviews
*convenience
109

Implications The UCSQ can be used to evaluate change to emergency and urgent care systems. The satisfaction measures are more robust than the service use measures within the survey. When using the survey to measure change over time, the survey must be undertaken in a control area in case a national spike in demand occurs in one data collection period. The learning from the case studies is being used in our current evaluation of the ‘111’ urgent care telephone service in four pilot areas. We are using the survey before and after the start of the new service in the four intervention areas and four matched controls. References for Section 5 1. Yin RK (2003). Case study research. Design and methods. Third Edition. London: Sage Publications. 2. O’Cathain A, Knowles E, Nicholl J. Testing survey methodology to measure patients’ experiences and views of the emergency and urgent care system: telephone versus postal survey. BMC Medical Research Methodology 2010;10:52 3. Rubin GJ, Page L, Morgan O, et al. Public information needs after the poisoning of Alexander Litvinenko with polonium-210 in London: cross sectional telephone survey and qualitative analysis. British Medical Journal 2007;335:1143. 4. Rubin GJ, Brewin CR, Greenberg N, Simpson J, Wessely S. Psychological and behavioural reactions to the bombings in London on 7 July 2005: cross sectional survey of a representative sample of Londoners. British Medical Journal 2005;331:606. 5. Rubin GJ, Amlot R, Page L, Wessely S. Public perceptions, anxiety, and behaviour change in relation to the swine flu outbreak: cross sectional telephone survey. British Medical Journal 2009;339:b2651. 6. RCGP weekly consultation rates for Influenza-like Illness (ILI), Total Respiratory Disease (TRD) & Acute Bronchitis (AB)1998-2010.

6. Conclusions
Measuring the performance of the emergency and urgent care system is important. We have developed and tested two sets of tools for use by policy makers, commissioners and researchers: six performance indicators calculated using routine data and the Urgent Care System Questionnaire (UCSQ) with associated survey methodology. As well as publishing this work in peer-reviewed journals, we intend to continue to work with policy makers developing performance indicators for emergency and urgent care, and use the USCQ in future evaluations of changes made to the emergency and urgent care system. We have developed a Toolkit to allow commissioners and researchers to make full use of our research programme outputs.
112

B. Ambulance programme
In 2005 a major review of ambulance services was undertaken and the resulting policy report “Taking Healthcare to the Patient” set out a comprehensive list of recommendations for the future development of ambulance services in England. The DH ambulance advisor (Peter Bradley, Chief Executive of London Ambulance Service NHS Trust) and ambulance policy team embarked on a programme of work to implement these recommendations. The MCRU was commissioned by DH to conduct two studies to support this process.
1. Building the Evidence Base for Pre-hospital and Out of Hospital Care
Background
One of the recommendations of the 2005 review of ambulance services in England, Taking Healthcare to the Patient, was that “The Department of Health should commission a programme of work to build the evidence base for pre-hospital and out of hospital care.” In 2007 DH commissioned the 999 EMS Research Forum to conduct a prioritisation exercise which identified research topics relevant to pre-hospital care. Potential topics were identified and a review of reviews carried out to establish the current evidence base. A Delphi consultation was then conducted, and topics scored, and a list of research priorities in the field of pre-hospital care ranked in order of importance. A total of 96 topics were generated.
The aim of this project was to build on the findings of the prioritisation exercise and generate a short, definitive list of the most important and pressing research topics for pre-hospital and out of hospital care that would have a direct impact on the achievement of DH policy initiatives in this area of service delivery.
Methods
The list of 96 topics identified in the prioritisation exercise provided the working framework. Research registers and research funding organisations were interrogated to assess what current relevant research was in progress. In addition a short survey was sent to each of the 11 Ambulance Service NHS Trusts in England and academic units with a pre-hospital care research focus to establish current research activity. The project steering group discussed and refined the topic list, taking into account current research, related DH activities and relevance to policy. Clinical topics were excluded on the basis that alternative research funding streams are available.
A final list of topics was agreed for further assessment (see Table 1) and 11 scoping reviews were conducted in 2009 covering the broad areas:
• Understanding the EMS Organisation
• Understanding how services are being used
• EMS Workforce
• Patient Assessment and management
113

• Alternatives to ambulance response or transport to A&E
• Information and performance measurement
After completion of the reviews each of the topics was scored using 3 criteria
1. Strength and quality of the evidence
2. Current research activity or related DH workstreams
3. Relevance and importance to future policy development and implementation.
This then allowed the construction of a prioritised list of key research areas for pre-hospital and out of hospital care. All of the evidence reviews and the prioritised list of research topics were included in a report which provides an evidence resource and information for research funders about priority areas in pre-hospital care.
Dissemination
The final report was submitted to DH and published on their website in July 2010:
http://www.dh.gov.uk/en/Publicationsandstatistics/Publications/PublicationsPolicyAndGuidance/DH_117194
It is also available on the ScHARR website and NHS evidence. In October 2010 this work was featured in the quarterly magazine Ambulance Today promoting wide dissemination across ambulance services in the UK: http://www.ambulancetoday.co.uk/downloads/AT_October_2010.pdf
114

2. Developing performance indicators for ambulance service category B calls Background Historically ambulance service performance measures have been time-based standards. In England the response time target for category B 999 calls is 95% within 19 minutes. Whilst time is a significant issue related to patient outcome for a small group of life-threatening conditions, this makes up only a small proportion of ambulance service emergency workload. There are many other calls where there is no evidence to support time as a measure of quality that impacts on patient outcome. The development of alternative performance indicators that reflect the quality and appropriateness, as well as the timeliness, of pre-hospital care is one of the key recommendations of “Taking healthcare to the patient”. Clinical performance indicators have already been developed for category A calls. This project has been designed to extend this work to category B calls. Indicator development The work was conducted in several stages:
1. Description of category B call characteristics
Before developing these new indicators, a clear description of the nature and type of calls within category B was needed in order to understand the case-mix of this group so that any new indicators would be relevant to this patient population. To do this we carried out two activities.
i) A national survey of all ambulance services in England was conducted requesting information on the total number of category B calls for one year (2007/8) and the numbers allocated to each AMPDS dispatch category. The main findings from this work were that a large proportion of calls were for a relatively small group of conditions. The main categories were
• Falls (19.4%)
• Overdose/poisoning (7.8%)
• Traffic/Transport (7.8%)
• Sick person (7.5%)
• Unconscious/faint (6.4%)
ii) We obtained two months of category B call dispatch records and scanned anonymised clinical patient record data from one ambulance service. This information was used to describe how serious the clinical conditions were and the frequency of clinical assessment and interventions by the attending ambulance crews. We analysed 26882 cases and the main findings were
• 25% of cases had no assessment or intervention other than basic vital sign measurement (for example pulse, blood pressure)
115

• 50% had additional clinical assessment such as a pain assessment or blood sugar measurement but no active treatment was needed.
• 25% required some type of intervention or treatment. The most frequent intervention was oxygen administration. Only 10% of cases required drugs, airway management or other procedures.
These analyses confirmed that Category B calls comprise a population of patients without time dependant conditions and the need for active intervention by ambulance crews is very low. Consequently response time as a measure of performance is not a particularly relevant or helpful approach to assessing the quality of care for this patient group.
2. Alternative measures
The next stage was to identify a range of alternative measures that could reflect the range of conditions within category B and potentially be used as future indicators. The project advisory group initially constructed a matrix scheme comprising a list of broad condition types and a range of pertinent dimensions that could have possible indicators attached to them. An example is given in the table below.
Group clinical dispatch time disposition other
Falls
Clinical management pathways
e.g falls assessment completed
Resource sent
e.g 2 man,
ECP
Response
Definitive care
Falls service
Emergency Department
Left at home
Re-contact
Satisfaction
Five broad groups were identified and some possible indicators for each dimension constructed. We then held a one day workshop in London to allow a broader group of stakeholders to comment and have input into the process. There were 60 people in attendance including ambulance managers, commissioners, professional groups, policy team, researchers and patient & public representatives. Groups of stakeholders discussed and commented on the indicators developed for the five groups.
The five groups were
• Falls
• Neurological problems
• Breathing problems
• Injury
• Other
Their comments and views on how indicators could be further developed were fed back to the research team to inform the next step. The project advisory group considered the feedback from the workshop and a key issue identified was the recognition that quality measures apply to all calls regardless of category and the
116

subsequent work reflected this by focussing on a list of indicators that could be applied across the whole range of 999 calls. A simplified group of potential indicators developed from the workshop and reflecting this principle of inclusiveness was subsequently identified by the project advisory group and developed by the research team for further consideration by relevant stakeholders.
Output
The development of a set of potential indicators coincided with the change in government in 2010. As a consequence the work stalled for some months pending confirmation of new policy including use of ambulance response time targets. Once the plan to replace the category B response time standard was agreed, a working group was set up by the DH national ambulance advisor and the final list of new indicators agreed for introduction in 2011:
http://www.dh.gov.uk/en/MediaCentre/Pressreleases/DH_122877
117

Appendix A Performance indicators
A.1
The Case Fatality Ratios presented in this report have been calculated from
all ONS deaths of PCT residents from emergency condition in year (all deaths) CFR1 =
all deaths + all HES admissions of PCT residents from emergency conditions in year discharged alive after 2 or more days
CFR1, has two problems. First patients who are admitted for more than 2 days (ie. with LOS ≥ 2 days) and are discharged alive but who subsequently die are double counted in the denominator in both the deaths and the HES admissions. Second, the numerator and denominator include late deaths that may have occurred several months after the incident. There is an argument for excluding late deaths from emergency care indicators because the longer the time from incident to death the less likely it is that the outcome was related to the quality of the emergency care.
Both these problems can be addressed using the HES/ONS linked dataset. We have obtained the linked ONS file for 2004/5 – 2008/9 and using the full ONS dataset for 2008 and 2009 have been able to calculate corrected CFRs for the financial year 2008/9 to explore the impact of different methods of calculating the CFR.
1. Double counting
For residents of each English PCT we have calculated a corrected CFR from all deaths in 2008/9
CFR2 = all deaths in 2008/9 + HES admissions in 2008/9 with LOS ≥ 2
who did not die in 2008/9
Across the PCTs the mean CFR1 in 2008/9 was 180.4 per 1000 and after removing the double counted deaths, the mean CFR2 was 182.4 per 1000. The rank correlation between the PCT CFRs calculated from the two methods was 0.999, and a scatter plot showing the values is shown in fig A.1. It is clear that the double counting has made no difference to the relative size of these indicators, and the results shown in the main body of this report can be taken as reflecting the true performance of the CFR.
118

Figure A.1. Correlation between CFR1 and CFR2
CFR
2 2
008/9
CFR1 2008/9
2. Excluding late deaths
As an exploration of the impact of excluding late deaths we have considered excluding deaths occurring more than seven days after hospital discharge. Thus we have calculated
all deaths pre-hospital, in-hospital in 2008/9 or <=7 days after discharge (all deaths) CFR3 =
all deaths + HES admissions in 2008/9 with LOS ≥ 2 who did not die in 2008/9
The mean of CFR3 was 173.6 per 1000, and focusing only on the ‘early’ deaths has made little difference to the relative performance of PCTs (Figure A.2) and
the rank correlation ( s = 0.996) suggests that the impact of excluding late
deaths is very small.
Figure A.2 Correlation of CFR1 and CFR3
119

120
CFR
3 2
008/9
CFR1 2008/9

A.2
i) Control limits for the Population Rates
The Association of Public Health Observatories has a web-based tool for calculating and plotting control limits for rates. The tool assumes events arise from a Poisson process and limits for directly standardised rates are calculated by estimating an implied population size from the directly standardised rate and the number of events.
The APHO control limits for the directly age-standardised PCT population mortality rates are shown in Figure A.3. It will be seen that there is considerable over-dispersion, so much so that these control limits can’t help identify out-of-control areas.
Figure A.3 Control limits for directly standardised PMRs using Poisson limits
Fig X. Control limits for directly sdtandardised PMRs using Poisson limits
90
110
130
150
170
190
210
230
250
270
0 200000 400000 600000 800000 1000000 1200000 1400000Population
Rate
per
100
,000
Pop
ulat
ion
per Y
ear
DataAverage2SD limits3SD limits
Source: calculated using the APHO toolNote: Population is adjusted due to Standardisation Calculations
We have therefore taken a simple empirical approach to calculating control limits for these rates. To illustrate the method consider the population mortality rate (PMR).
Let PMRj = (dj/Nj), where dj is the number deaths and Nj the size of the population in the jth PCT.
Then Var (PMRj) = Var (dj/Nj) = pj(1 – pj)/Nj
and letting pj = p
Var (PMRj) = K/Nj and se(SPMRj) = .
121

We have used Spiegelhalter’s method to allow for the over-dispersion9 by calculating Z-scores for each observed SPMR.
Zj = (observed SPMRj – mean SPMR)/se(SPMRj).
Then the over-dispersion factor, = ∑z2/n where n is the number of PCTs
= 1/152 [∑Nj (SPMRj – mean SPMR)2] / K
and Var (SPMRj) K/Nj = [∑Nj (SPMRj – mean SPMR)2/152] /Nj
In line with Spiegelhalter’s suggestions11,12 we have ‘winsorised’ the data so that extreme values that are out-of-control do not inflate the variance estimate. We winsorised 20% of the z-scores (ie. so that the top and bottom 10% of scores were set equal to the 10th and 90th centile values).
Method of calculation
In general, then, the method for calculating the control limits for rates (including directly standardised rates, etc, is set out below. Let the rate in the jth population of size Nj be Rj then
i) Calculate Zj2 = Nj(Rj – mean rate across all populations)2
ii) ‘Winsorise’ the Zj2 by setting all the values of Zj
2 which are greater than the 90th centile value equal to the 90th centile value, and all the values less than the 10th centile value equal to the 10th centile value.
iii) Calculate V = ∑ Zj2 / number of populations
iv) Then for a population of size N the 99.8% and 97.5% control limits are given by +/- 2 or 3 times sqrt (V/N).
v) The funnel plot then plots Rj against Nj.
ii) Control limits for the standardised case fatality ratios
The case fatality ratios are the ratio of the observed deaths (d) to the sum of observed deaths and admissions discharged alive who stayed ≥ 2 days (A).
ie.
Mortality rates and the CFR vary greatly between conditions and between age groups. Standardisation of the CFR to enable any between PCT comparison is therefore essential. Direct standardisation is not possible as some age x condition combinations have no deaths or admissions in some PCTs in some years.
122

Indirect standardisation can be used although comparison between PCTs is not strictly valid1.
For indirect standardisation we simply calculated a standardised case-fatality ratio (SCFR) from
SCFR = Observed deaths/ Expected deaths
Where the expected deaths = ∑pi (dij + Aij) where pi is the ‘standard’ case-fatality ratio for the ith condition and dij and Aij are the deaths and admissions for the ith condition in the jth PCT.
Both the numerator and denominator of the SCFR are random variables (that co-vary as well) and the variance of the SCFR and hence control limits for ‘acceptable’ variation needs to take this into account.
Setting SCFR = O / S where S = the standard expected deaths
Then using Fieller’s theorem
Var (SCFR) ‐
And since E(O) = S and E(S) = S
Var (SCFR) = =
We can estimate Var (O – S) from the variance between years within PCTs. The difference between the observed and expected number of deaths (O-S) is modelled as a function of a fixed year effect and a random PCT effect and the residuals provide an estimate of Var(O-S). Then for SCFR = 100 x O/S
se (SCFR) 100 x se(O/S) = 100 x sqrt(var(O – S))/S
97.5% and 99.8% control limits can be set using 100 +/- 2 or 3 se(SCFR). The funnel plot then consists of plotting Oj/Sj against Sj.
For 2006/7 to 2008/9 this model gives
Var(O-S) = 823.4
and hence for SCFR = 100 x O/S
se (SCFR) 100 x se(O/S) = 100 x 28.7/S
The control limits and the estimated SCFRs for 2006/7 to 2008/9 case-fatality ratios are shown in Figures 11a to 11c. It will be seen that there are some PCTs outside the 99.8% control limits suggesting that there may still be some over-
123

dispersion. Over-dispersion means that the ‘true’ SMRs in some PCTs are not 100 and this either points to a failure in care, or an inadequacy in the data or model to capture natural variation.
124

Appendix B Toolkit
Toolkit for commissioners of the emergency and
urgent care system
1. Calculating indicators for commissioners to monitor the performance of their emergency and urgent care systems (eucs) using data that are available routinely 2. Undertaking a survey of system users’ experiences and views
Medical Care Research Unit, University of Sheffield, 2011
125

126
1. Calculating indicators for commissioners to monitor the performance of their emergency and urgent care systems (eucs) using data that are available routinely Contents
Introduction Using HES data ICD10 codes for core serious emergency conditions and urgent conditions to be used with indicators
Outcomes based indicators
1. Mortality rates for serious, emergency, conditions for which a well-performing EUCS could improve chances of survival.
2. Case fatality ratios for serious, emergency conditions for which a well-performing EUCS could improve chances of survival.
Process based indicators
3. Hospital emergency admission rates for acute exacerbations of urgent conditions that could be managed out of hospital or in other settings without admission to in inpatient bed.
4. Arrivals at EDs referred by any EUCS services and discharged without treatment or investigations(s) that needed hospital facilities.
5. Arrivals at EDs referred by emergency ambulance and discharged without treatment or investigations(s) that needed hospital facilities.
6. Proportion of admissions for urgent care conditions resulting in emergency re-admission for the same condition within 7 days of discharge.

Introduction: System indicators
This toolkit presents the methods used to calculate the six patient focused performance indicators indictors developed and tested in the final report to the Department of Health of the Medical Care Research Unit on emergency and urgent care systems. As care is typically provided by several services along a ‘care pathway’, the indicators focus on health care systems, that is, on the set(s) of services which look after patients when they become ill, and not on single services.
The indicators in this tool kit are therefore population based. They are in essence public health indicators, indicating not ‘which service is best’ but ‘which population is best served’. The indicators are:
1. the standardised population mortality rate
2. The standardised case fatality ratio
3. The standardised urgent admission rate
4. The emergency readmission rate
5. The rate of unnecessary referrals by emergency and urgent care services to EDs
6. The rate of unnecessary referrals by ambulance services to EDs
Using indicators
Numerators and denominators. Many indicators are ratios or rates. They measure the number of indicator events in the numerator and compare it with some population which generates those events in the denominator. For example, we have looked at the number of unnecessary attenders at ED compared to all attenders, and the number of deaths in all incidents. When these types of indicator change it is essential to also examine the crude number of events in the numerator. If the case fatality ratio falls, but the number of deaths in the numerator has not changed, then this indicates a change in data recording not a change in quality of care.
Standardisation. Case mix standardisation is usually advisable, and essential when comparing performance indicators against standards or other populations. Standardisation for comparison should be carried out using direct methods whenever it is possible. When it is necessary to use indirect methods then further care is needed in making comparisons.
Mapping. We have found that mapping our indicators can point to regional problems, and this is a potentially useful tool for understanding system effects. When service commissioning moves to smaller populations of GP consortia, and hence to smaller geographical areas, mapping will become an even more important tool.
Identifying outliers. Identification of outliers must be treated with caution and investigated with care. We think that four questions need to be asked before identifying an area as having outlying performance.
• Does the exceptional performance persist over time? • Is it sensitive to the methods used? Is it sensitive to how the standardisation is carried
out or the weightings used for example? Is it sensitive to how the control limits are calculated?
• If the indicator is a ratio, is there evidence that the problem is with the numerator and not with an unexpectedly small denominator? For example, for CFRs are we sure that there is an excess of deaths (that is a relatively high PMR) not a deficiency of admissions?
• Is there any corroborating evidence from related indicators. For example, is there evidence of problems with any of the process indicators such as time from 999 call to definitive care or multiple transfers, or in surrounding areas?

2
Notes on using Hospital Episodes Statistics Data Analysis using HES data should be carried out using finished consultant admission episodes. In the majority of spells of care in HES the admission episode (where EPIORDER = 1) is also the discharge episode. However when a patient is admitted for a spell of care that has multiple Finished Consultant Episodes (FCEs) the discharge information such as discharge date, discharge method and discharge destination are only contained within the discharge episode. It is also important to be aware that diagnosis and procedure data are episode specific, therefore the primary procedure for an admission and discharge episode can vary within any given spell of care. When carrying out analysis which requires information about the admission and discharge then the data in the first and last episodes in a spell need to be linked. For example data within the first and last episodes of each spell would need to be linked to find the length of stay following admission for acute heart failure. If only the discharge episode was used for this analysis then information about patients who were admitted for acute heart failure and then seen by a different Consultant, for a different diagnosis before discharge would be omitted from the analysis. Similarly, if only the admission episode is used for analysis of in-hospital deaths, patients who were transferred to another consultant before dying would not be included as deaths. Duplicate FCEs are found within HES data and should be omitted from any analysis. Within this analysis duplicate FCEs have been defined as episodes which have identical values within the following fields: HES ID, provider spell number, admission date, episode start date, main specialty of treatment and episode order.

Core set of serious, emergency, and urgent conditions to be used with the performance indicators Serious emergency conditions ICD-10 codes Underlying cause of death Stroke/CVA I61; I63; I64; I629 Meningitis G01; G02; G03; A39; A321 Myocardial Infarction I21; I22; I23 Asthma J45; J46 Cardiac arrest I46 Pregnancy and birth related O00 – O99 Self harm NEC2 X6; X7; X8 Ruptured aortic aneurysm I710; I711; I713; I715; I718 Falls under 75 years NEC1 W0; W1 Road traffic accidents NEC1 V0; V1; V2; V3; V4; V5; V6; V7;
V802; V803; V804; V805; V821; V892; V830; V832; V833; V840; V841; V842; V843; V850; V851; V852; V853; V860; V861; V862; V863; V870; V871; V872; V873; V874; V875; V876; V877; V878
Septic shock A40; A41 Acute heart failure I50 External/secondary causes of death3 Anaphylaxis T780; T782; T805; T886 Asphyxiation T71 Fractured neck of femur S72 Serious head injuries S02-S09 ‘Urgent conditions’ defined as the exacerbations of which could be managed by a well-performing EUC system without admission to an inpatient bed COPD J40; J41; J42; J43; J44 Acute mental health crisis F Non-specific chest pain R072; R073; R074 Falls over 74 years W0; W1 Non-specific abdominal pain R10 Deep vein thrombosis I80; I81; I82 Cellulitis L03 Pyrexial child under 6 years R50 Blocked tubes, catheters and
feeding tubes T830 Hypoglycaemia E10; E11; E12; E13; E14; E15;
E161; E162 Urinary tract infection N390 Angina I20 Epileptic fit G40; G41 Minor head injuries S00
2 Where conditions are marked NEC they should only be included if the underlying cause was not due to an external injury (i.e. secondary cause of
death should be blank). 3 Where the cause of death of interest is a secondary cause the original underlying cause of death should be excluded
3

Indicator: 1A Short title: POPULATION MORTALITY RATE Full title: MORTALITY RATE FOR SERIOUS, EMERGENCY CONDITIONS FOR
WHICH A WELL-PERFORMING EUC SYSTEM COULD IMPROVE CHANCES OF SURVIVAL
Aim
Reduce mortality from serious emergency conditions (SEC) that are (typically) emergencies but not inevitably fatal, in populations in areas covered by EUCS.
Rationale
This indicator is based on health outcomes that may depend on how well the services within an emergency and urgent care system work together to deliver the care that the patient needs. Monitoring changes in mortality rates for specified SECs in the local population over time is one indicator of the performance of the EUC system/network, or multi-agency working.
Data sources
Office for National Statistics (ONS) Mortality Statistics; Mid-year PCT resident population estimates (ONS)
Period
Annual
Provider Not a provider-based indicator
Construction
Numerator The number of deaths of residents of the PCT (ONS Mortality Statistics) where underlying or secondary cause was due to a serious emergency condition (SEC)-see table of definitions
Denominator
Mid-year PCT resident population
ICD10 codes
See table of definitions
Process
i) Ratio of total SEC deaths per year to population (reported per 1000 pop) for each PCT or area of interest
Comment
Population mortality rates can be derived for any population where the number of deaths and number of residents are known. ONS mortality data is routinely reported by area of residence therefore population mortality rates should be calculated for PCT of residence. Where urgent care is provided by a network of more than one PCT, the defined population can be altered to that resident within the boundaries of all the PCTs covered by the network. Care should be taken if a network is not co-terminus with PCT boundaries. The crude indicator is sensitive to the incidence of the conditions in the population as well as to the performance of the EUCS in preventing the deaths of patients with the conditions. It is not recommended for comparisons between networks. The rates can be standardised for age (Indicator 1B) but this is not necessary
4

when looking at short term trends within PCT or urgent care networks to monitor changes in performance. Note also that the mid year PCT populations are estimates generated from census-based population data and may introduce some error.
5

Indicator: 1B Short title: AGE STANDARDISED POPULATION MORTALITY RATE Full title: AGE STANDARDISED MORTALITY RATE FOR SERIOUS, EMERGENCY
CONDITIONS FOR WHICH A WELL-PERFORMING EUC SYSTEM COULD IMPROVE CHANCES OF SURVIVAL
Aim As above Rationale As above Data sources
As above
Period Annual Provider Not a provider-based indicator
Construction
Numerator The number of deaths per age group of residents of the PCT where underlying or secondary cause was due to a serious emergency condition (SEC).
Denominator
Mid-year PCT resident population per age group
ICD10 codes
See table for definitions of urgent conditions
Process
i) Calculate age group specific mortality rates from the ratio of number of deaths from SEC in that age group to size of the population of that age group for each PCT
ii) Multiply the rate for each age group by the standard population weight for the age group (see table in comments section), then sum up results for all age groups to give the standardised mortality rate for each PCT.
Comment
This indicator is directly age standardised. This method helps account for different age structures within each resident population. This allows fair comparisons between different PCT rates and analysis of long term trends. The European standard population/weightings are conventionally used. Although choice of a more local population such as England will produce standardised rates which better reflect the crude rate of admissions. The same standard population should be used for all areas to aid temporal or geographical comparisons of rates. Population weightings for selected age groups are shown in the table below.
6

An Excel based tool for calculating standardised rates is available: http://www.apho.org.uk/resource/view.aspx?RID=48617
Population weights Age Group
European weight
England 2007 population
0 – 4 0.08 0.06
5 – 14 0.14 0.12
15 – 44 0.42 0.42
45 – 64 0.25 0.24
65 – 74 0.07 0.08
75 – 84 0.03 0.06
85+ 0.01 0.02
7

Indicator: 2A Short title: CRUDE CASE FATALITY RATIOS Full title: CASE FATALITY RATIOS FOR SERIOUS, EMERGENCY CONDITIONS
FOR WHICH A WELL-PERFORMING EUC SYSTEM COULD IMPROVE CHANCES OF SURVIVAL
Aim
Reduce the proportion of patients with specified serious emergency conditions (SEC)-(see table of definitions) who die.
Rationale This indicator is based on health outcomes. It indicates the chance that someone with a SEC will die (rather than the chance that someone will die of a SEC). It is therefore a useful indication of how well the services delivering care to the patient are working together to deliver timely and appropriate care.
Data source Hospital Episode Statistics (HES) for emergency admission;
ONS Mortality Statistics
Period Annual Provider PCT based indicator
Construction Numerator The number of deaths of residents of each PCT from the SEC causes during the year
Denominator All deaths in the numerator plus all emergency admissions in HES data during the year for PCT residents for SEC conditions who stayed in hospital for 2 or more days and were discharged alive (Discharge method not equal to 4)
ICD10 codes
See table of definitions for SECs
i) Ratio of number of deaths to the number of deaths AND total emergency admissions for SEC discharged alive in the same period
Process
Comment
Where urgent care is provided by a network of more than one PCT, the defined population can be altered to that resident within the boundaries of all the PCTs covered by the network. Care should be taken if a network is not co-terminus with PCT boundaries. These ratios begin to overcome the problem with the crude mortality rates by using the admissions as a measure of the incidence of the conditions. However, the case fatality ratios for all SEC together should be standardised for casemix and age for national comparisons (Indicator 2B). To monitor short term trends in performance within PCTs/networks the crude ratios are likely to be sufficient This indicator can also be calculated for early deaths, for example,
8

deaths within 7 days or 30 days of first contact with the EUCS. However, analysis has shown that the results from the early deaths or all deaths case fatality ratios are comparable for each PCT.
9

Indicator: 2B Short title: STANDARDISED CASE FATALITY RATIOS Full title: CASE FATALITY RATIOS FOR SERIOUS, EMERGENCY CONDITIONS
FOR WHICH A WELL-PERFORMING EUC SYSTEM COULD IMPROVE CHANCES OF SURVIVAL
Aim As above
Rationale As above
Data source As above
Period Annual
Provider As above
Construction
Numerator The observed number of deaths in residents of the PCT from SEC causes in the year.
Denominator The number of deaths expected given the age and SEC casemix
ICD10 codes
See table of definitions for SECs
Process
i) The expected number of deaths in the PCT is calculated by first calculating the expected number separately for each age and SEC combination.
ii) The age/SEC specific expected number of deaths is calculated by multiplying the number of incident cases in each age/SEC specific group in the PCT by a standard case fatality ratio.
iii) The number of incident cases is the age/SEC specific denominator in the crude case fatality ratio (ie deaths plus admissions discharged alive. see above)
iv) The age/SEC specific standard case fatality ratio is the crude case fatality ratio (see above) for that age and SEC group for all PCTs together.
v) When the age/SEC specific number of incident cases is zero or the standard case fatality ratio is zero, the expected number of deaths is set to zero.
vi) The expected deaths for each age/condition group are then summed to form a total expected number of deaths per PCT.
vii) The indirectly standardised ratio is calculated by dividing the total observed number of deaths in a PCT by the expected and multiplying by 100.
10

Comment
The case fatality ratios tend to be strongly dependent on condition and age but not sex. We have used 7 age groups (0-4, 5-14, 15-44, 45-64, 65-74, 75-84, 85+) and as there are 16 SEC conditions direct standardisation methods may not be suitable. Therefore indirect standardisation based on age/condition specific groups has been employed. The average ratio is always 100, and a ratio of 110 say indicates 10% more deaths than expected. When using this method direct comparisons between different standardised PCT ratios may not be reliable, but comparisons with the average (100) are valid.
11

Indicator: 3A Short title: CRUDE HOSPITAL EMERGENCY ADMISSION RATES Full title: HOSPITAL ADMISSION RATES FOR EXACERBATIONS OF URGENT
CONDITIONS THAT COULD BE MANAGED OUT OF HOSPITAL OR IN URGENT CARE SETTINGS WITHOUT ADMISSION TO A HOSPITAL BED
Aim
Reduce hospital admission rates for exacerbations of urgent conditions (UC)-(see table of definitions), that could often be managed out of hospital or in settings without admission to a hospital bed.
Rationale
Indicator 3 extends the concept of ‘ambulatory care sensitive conditions’ by focussing on avoidable admissions for acute exacerbations of urgent conditions. In this way systems of EUC may monitor how effectively the services within their range of responsibility are managing demands for care for urgent conditions over time without admitting the patient to a hospital bed.
Data sources
Hospital episode statistics (HES)
Period
Annual
Provider PCT based indicator
Construction
Numerator Number of emergency admissions of PCT residents within PCT or network area for urgent conditions by year
Denominator Mid-year population estimates for the PCTs in the network
ICD10 codes
See table for definitions of urgent conditions
Process
Ratio of number of admissions for urgent conditions to size of population reported per 1000 population;
Comment
This indicator is sensitive to the incidence of the conditions in the PCT or network population as well as the performance of the network in avoiding admission. It should not therefore be used for comparison between EUCS. Case admission rates would be preferable, but ‘cases’ should be contacts across the whole EUC system and we cannot count these. Case admission rates for a specific service may not have system relevance. Calculation of rates based on residents of each PCT needs national data since they may be treated out of PCT. The indicator can be calculated separately for weekdays and weekends, and this may provide useful information on access out-of-hours
12

Indicator: 3B Short title: STANDARDISED HOSPITAL EMERGENCY ADMISSION RATES Full title: HOSPITAL ADMISSION RATES FOR EXACERBATIONS OF URGENT
CONDITIONS THAT COULD BE MANAGED OUT OF HOSPITAL OR IN URGENT CARE SETTINGS WITHOUT ADMISSION TO A HOSPITAL BED
Aim As above Rationale As above Data sources
As above
Period Annual Provider Not a provider-based indicator
Construction
Numerator Number of emergency admissions of residents within PCT or network area for urgent conditions by year
Denominator
Mid-year population estimates for the PCTs in the network & Standard Population (standardised weights)
ICD10 codes See table for definitions of urgent conditions
Process
i) For each age/sex group calculate the ratio of the number of emergency admissions for urgent conditions in the year to size of the population
ii) Multiply the ratio for each age/sex group by the standard population weight for the age/sex group (see table in comments section), then sum up results for all age/sex groups to give the age/sex standardised urgent condition admission rate.
Comment
This indicator is directly age/sex standardised. This method helps account for different age and gender structures within each resident population. This enables comaprison of rates between different PCTs and analysis of long term trends. The European standard population/weightings are conventionally used. Although choice of a more local population such as all England with produce standardised rates which better reflect the crude rate of admissions. The same standard population should be used for all PCTs to aid temporal or geographical comparisons of rates. Population weightings for selected single sex age groups are shown in the table below.
13

A Excel based tool for calculating standardised rates is available: http://www.apho.org.uk/resource/view.aspx?RID=48617 Differences in rates between EUCS may reflect differences in local incidence of the conditions in the PCT or network population as well as the performance of the network in avoiding admissions.
Population weights for each sex group Age Group European
weight England 2007 population
0 – 4 0.04 0.03
5 – 14 0.07 0.06
15 – 44 0.21 0.21
45 – 64 0.125 0.12
65 – 74 0.035 0.04
75 – 84 0.015 0.03
85+ 0.005 0.01
14

Indicator: 4 Short title: EUCS REFERRALS TO EMERGENCY DEPARTMENTS Full title: ARRIVALS AT EMERGENCY DEPARTMENTS (EDs) REFERRED BY ANY
EUCS SERVICES AND DISCHARGED WITHOUGH TREATMENT OR INVESTIGATIONS THAT NEEDED HOSPITAL FACILITIES
Aim
Reduce the number of referrals to EDs for conditions that do not need hospital facilities.
Rationale
The focus of Indicator 4 is processes of care. The measure will enable EUCs to monitor the quality of the initial assessment, appropriate triage and management of the condition.
Data sources
ED records or national HES A&E dataset
Period
Annual
Provider
EDs in the network area
Construction Numerator The number of patients recorded as referred by any EUC services in the system (including ambulance services) who are discharged without treatment or investigations that needed hospital facilities
Denominator
The number of patients attending EDs who were referred by any EUC services in the system
ICD10 codes
N/A
Process i) simple proportion of ED records of all patients referred by any EUC services in the system
ii) As i) but calculated separately for attendances in-hours and out-of-hours.
Comment This indicator is based on records of referrals. Although ambulance service referrals are to be included this is not the same as ‘brought in by ambulance’. Some patients are transported to ED by ambulance after referral by another service. Some patients are advised by the ambulance service to attend ED but not taken by ambulance. This indicator (4) looks only at referrals . Indicator 5 looks separately at patients transported to ED by 999 ambulance.
Data may not be routinely available at present. The indicator can be calculated from ED records if they include a field indicating whether the patient was referred by another service. Patients not treated or investigated have been defined as not investigated or treated with some minor exceptions and discharged home or to GP care.
15

The codes that are included in the definition are ahown in the tables below. HES A&E data field name: A&E investigation : 2 character
Codes included Investigation 24 or blank None
06 Urinalysis 21 Pregnancy test 22 Dental investigation 23 Refraction, orthoptic tests
and computerised visual fields
HES A&E data field name: A&E treatment :2 character
Codes included Treatment 01 Dressing 02 Bandage/support 04 Wound closure (excluding
sutures) 07 Prescriptions 22 Guidance/advice only 30 Recording vital signs 34 Wound cleaning 56 Dental treatment 57 Prescription
99 or blank None HES A&E data field name : Attendance Disposal
Codes included Disposal 02 Discharged – following
treatment to be provided by GP
03 Discharged – did not require any follow-up treatment
12 Left department before being treated
16

Indicator: 5 Short title: ARRIVALS AT EDs BY EMERGENCY AMBULANCE Full title: ARRIVALS AT EMERGENCY DEPARTMENTS (EDs) REFERRED BY
EMERGENCY AMBULANCE AND DISCHARGED WITHOUT TREATMENT OR INVESTIGATIONS THAT NEEDED HOSPITAL FACILITIES
Aim
Reduce the number of referrals to EDs for conditions that do not need hospital facilities.
Rationale
Indicator 5 is a process-based measure to enable EUCs to monitor the quality of the initial assessment and appropriate triage of the condition at the first point of contact. It will also provide quantifiable data about the numbers of journeys by emergency ambulance that could be avoided if appropriate alternative care pathways were available, and inform the development of services within the system.
Data sources
ED records or national HES A&E datasets
Period
Annual
Provider
EDs in the network area
Construction
Numerator Number of patients brought in by emergency ambulance to EDs, who are discharged without treatment or investigations that needed hospital facilities
Denominator
All patients brought in by emergency ambulance to ED
ICD10 codes
N/A
Process
i) simple ratio of the number of patients arriving at EDs by emergency ambulance who were not treated or investigated to all patients arriving by emergency ambulance ii) Also calculated separately for in-hours and out-of-hours
Comment
Though focused on emergency ambulance performance, this is related to the availability of alternative care pathways in the system available for the ambulance service to use. Patients not treated or investigated are defined as for indicator 4 above
17

Indicator: 6 Short title: EMERGENCY RE-ADMISSIONS Full title: PROPORTION OF ADMISSIONS FOR URGENT CARE CONDITIONS
RESULTING IN EMERGENCY RE-ADMISSION FOR THE SAME CONDITION WITHIN 7 DAYS OF DISCHARGE
Aim To identify the proportion of patients who admitted for urgent
care conditions and were discharged before receiving treatment to fully manage their condition.
Rationale
The focus of Indicator 6 is the processes within the urgent care system.
Data sources
Hospital Episode Statistics
Period
Annual
Provider PCT based indicator
Construction
Numerator Number of emergency re-admissions within 7 days of discharge for the same condition as the index emergency admission episode of care per PCT
Denominator
Number of emergency admissions for a UC condition that were discharged alive (index case) per PCT
ICD10 codes
Urgent care conditions – see table above.
Process
Calculate the proportion (%) of index cases that are followed by an emergency readmission for the same patient (matching HES id) for the same condition (defined by UC ICD10 code groupings) within 7 days of discharge.
Comment
To use HES data for this indicator all finished consultant emergency admission episodes need to have a date of discharge and discharge destination appended (these fields will only be populated if the admission episode is also the discharge episode). A dataset can then be defined as all emergency admissions episodes where the main diagnosis matched the UC conditions listed in the definition section and the patient was alive on discharge. From this group of index cases emergency readmissions can be identified if episodes are listed in order of HES ID, admission date and discharge date. Readmissions will be those episodes with a subsequent admission for the same patient within 7 days and for a matching condition.
18

2. Undertaking a survey of system users’ experiences and views
Contents
1. The need for a toolkit ……………………......................................... 2. Aim of this toolkit …………………………………………………………………………. 3. How the toolkit was developed…………………………………………………… 4. The toolkit………………………………………………………………………………………… 4.1 Key requirements……………………………………………………………………… 4.2 Ethics approval and research governance………………………………. 4.3 The Questionnaire…………………………………………………………………….. 4.4 Guidance on sample sizes and related costs…………………………… 4.5 How to find a market research company………………………………… 4.6 How to identify an age-sex breakdown of your population……. 4.7 Instructions for a market research company………………………….. 4.8 Analysis plan……………………………………………………………………………… 5. Reporting results and dissemination…………………………………………. 6. References……………………………………............................................ APPENDIX A Copy of telephone questionnaire…………………………....
19

1. The need for a toolkit What is an emergency and urgent care system? The Department of Health continues to propose changes to what they term both emergency1 2 and urgent care,3 defining urgent care as “the range of responses that health and care services provide to people who require – or who perceive the need for – urgent advice, care, treatment or diagnosis”. Emergency and urgent care is provided by a range of services including 999 ambulance, emergency (EDs) departments, general practice (GP) both in and out of hours, pharmacy, NHS Direct, walk in centres, minor injury units, dental services, community mental health teams, and social care.3 It can also be called unplanned or unscheduled care. Patients seeking urgent care may not attend or consult a single service. Instead they may make several contacts with the same or different services.4 For example, they may call NHS Direct, be directed to attend A&E, and then be admitted as an inpatient; or they may attend a walk in centre and then later contact the GP out of hours service. Each emergency and urgent care service may be effective but not operate as a system, ensuring the smooth and efficient transfer of patients along pathways involving more than one service. These individual services need coordination to ensure that they work together as a system. Why measure the performance of the system from the patient perspective? The patient perspective of health care is important as policy in England shifts towards a patient-led NHS.5 The Darzi report in 20086 focused on the need for patients to be at the very centre of care and that measurement on quality of care should include patient views of success and quality of their experience. Patients experience a system rather than simply the individual services within it. Commissioners and providers of emergency and urgent care services need to identify problems with their systems, and monitor the effect of any changes they make to their systems e.g. closure of an Emergency Department, opening of a Primary Care Centre, co-location of services etc.
20

2. Aim of this toolkit The aim of the toolkit is to help those who manage the emergency and urgent care system to obtain the patient perspective of their system. The main customers for this toolkit are system commissioners. 3. How the survey was developed Researchers at the University of Sheffield undertook focus groups and interviews with people who had made recent contact with the emergency and urgent care system.5 Based on this qualitative research, they identified the key characteristics of the system which were important to patients and developed a questionnaire. They then worked with an Emergency and Urgent Care Network to test this questionnaire and how best to administer it. They tested the use of a standard market research company telephone survey versus a ‘gold standard’ postal survey and found that
• A survey of the general population can identify recent users of the emergency and urgent care system.
• A standard market research company telephone survey using quota sampling was
more representative and inclusive than a postal survey using random sampling. It was also more accurate in identifying specific service use (Table 1).
• Patient recall of having an urgent event worsened considerably after four weeks
and therefore any survey with an aim of estimating use of the system must focus on a four week recall period. However, answers to satisfaction questions were consistent across a three month period of recall on the telephone survey. Therefore satisfaction can be measured for events occurring in the past three months.
• For every 1000 people who complete a questionnaire by telephone, 150 have
used the system in the previous three months.
21

Table 1: Rate per 1000 population per month using specific services in the system Service Postal
survey
Telephone survey
Routine data provided by Network
GP out of hours 26 13 13 ED 23 11 12 999 3 7 6 Urgent care centres (MIUs) 6 4 5 4. The toolkit The toolkit includes
• Key requirements of the toolkit • The need for ethics approval and research governance
• The questionnaire
• Guidance on sample sizes and related costs
• How to find a market research company
• How to identify an age-sex break down of your population
• Instructions for a market research company
• Analyses to request from the market research company
4.1 Key requirements
A market research company must be employed to undertake this survey
The sampling procedure as outlined in this document must be adhered to
The survey must be administered by telephone
The telephone questionnaire must include all the items. You can add extra questions at the end of the survey if you wish
This toolkit is not subject to copyright but if you do wish to re-produce this,
please make a courtesy contact to the MCRU
22

Keeping everyone informed It is important to the success of this survey that all relevant parties are kept informed of progress. All departments in the Network/PCT/commissioning body should be made aware that a survey is being undertaken because patients may contact services and ask questions about the survey. You may want to send an email to staff, or put posters up in coffee rooms, providing information about the survey. In addition you may want to publicise the survey amongst the general population, which may have a positive impact on your response rates. For example, posters in GP surgeries and publicity in the local media. Project team Even though the survey will be undertaken by a market research company, we feel that it would be useful for you to set up a small project team (this could be as small as a couple of people). For example, the Director of Unplanned Care may want to take on a role overseeing the project, and a middle management member of staff may want to take on the responsibility of liaising with the market research company and ensuring the survey is undertaken using the guidelines within this toolkit. Timing The timing of the survey can be decided upon by you. However, to maintain consistency you must survey at the same time each year if using on an annual basis (e.g. May 2011, May 2012 and so on). If you are using the survey to assess the impact of a system/service change within your area, we suggest you should administer the survey just prior to the change (say the month before). In order to measure the impact of the change, administer the survey again exactly twelve months later. If you are planning to use the survey to provide annual monitoring of the emergency and urgent care system we would suggest avoiding administering the survey during the winter months which may be affected by rates in respiratory infections which may fluctuate from year to year. 4.2 Ethics approval and research governance Approval is not required from an NHS Ethics Committee because no NHS records, facilities or staff, are used to recruit participants for this survey. All participants are members of the general population. No use will be made of NHS facilities to recruit patients and therefore research governance will not be required. The market research company commissioned to use this toolkit must be a member of the Market Research Society. As such there are no issues in relation to data protection and patient confidentiality as companies must comply with the Market
23

Research Society’s code of conduct (http://www.marketresearch.org.uk/standards/codeconduct.htm) which ensures that research is carried out in a professional and ethical manner. 4.3 The questionnaire Core questionnaire The questionnaire has a screening question to determine whether people have used the emergency and urgent care system in the previous three months. Only people who have used it then go on to complete a more detailed questionnaire about their most recent experience. The questionnaire is at the end of this Toolkit in the form of a ‘script’ used by telephone interviewers. The questionnaire covers:
• Questions to ensure that adults only are interviewed (aged 16+) • Questions to select when an adult describes the system use of a child • A screening question about use of the emergency or urgent care system • Experience of using the system for the most recent event, focusing on the first
three services contacted • Satisfaction with using the system for the most recent event • Socio-demographic information: age, sex, ethnicity
Making changes to the questionnaire The generic terms for services are used in the questionnaire (e.g. ED department). You may wish to name the service and include the name used by your local population so that it is instantly recognised by respondents (e.g. A&E department at the Northern General Hospital). The advantage of this approach is that you can be confident that respondents know which service is being described. However, this may not work if you have a lot of service use by your population outside of your system, that is, people on the border of your area may travel to hospitals not in your geographical patch. If you choose to name services then please change questions Q6 and Q8. Extra questions For every 1000 people who complete the questionnaire, around 150 will have used the system in the previous three months and thus complete the more detailed questionnaire about their most recent experience. You may wish to ask a question or questions of all respondents which are relevant to the whole population. For example, you may wish to seek population views of access to dentists.
24

4.4 Guidance on sample sizes and related costs A survey of 1000 people who answer the screening questionnaire will yield approximately 150 recent users of the system. This will be adequate to detect changes to you system (see sample size calculation below).
Say a change was made to the system, for example a large GP-led centre was set up with the intention of improving access to urgent care or an emergency department was closed for efficiency of the system. You could undertake a survey before the change and a survey a year after the change. If the intention of the change was to improve satisfaction entry into the system from a mean of 3.8 to a mean of 4.1, with a standard deviation of 0.9, you would need 142 system users to detect this effect size of 0.3 at the 5% level with 80% power. That is, a market research company telephone survey of 1000 members of the general population before and after the change would suffice because it would identify approximately 150 system users each time.
A telephone survey of 1000 people in 2007 cost £10k including VAT. 4.5 How to find a market research company* Market research companies commissioned to undertake this survey must be members of the Market Research Society (MRS). In order to locate a market research company we suggest that you go to the MRS website: http://www.mrs.org.uk/ You will need to access the ‘research buyers guide’ through the following link: http://www.theresearchbuyersguide.com/index.php?p=home&SESSID=ot3f8n2rdl2s05sg9f20r80nl1 You will need to register on this site in order to access a list of MRS members. 4.6 How to identify an age-sex breakdown of your population First you need to identify the geographical area covered by your system so that the market research company can locate telephone numbers within your area. This is best done by identifying the postcode sectors covered by your system e.g. DE1, DE2, SK43. You will need to make a decision about whether to include some postcode sectors on the border of your system. Postcodes of general practices within your system are a useful source of this information. Market research companies will require an age-sex breakdown of the population within your emergency and urgent care system so that their quota sampling for the telephone survey can reflect this. You may have this information available to you as a PCT or Emergency and Urgent Care Network Board. If you do not, then a good source is the ONS (Office of National Statistics) website at www.statistics.gov.uk where census data
25

for populations is available for different areas. Another useful source is your local authority. 4.7 Instructions for a market research company 1. Undertake a telephone survey of 1000 people in your geographical area. All 1000 people will complete a short screening questionnaire. If they have used the emergency and urgent care system in the previous three months they will complete a more detailed questionnaire. Approximately 15% (150) of people will need to complete the more detailed questionnaire. 2. Telephone numbers of people in your geographical area can be identified using the range of postcode sectors provided. The following approach can be taken to sampling: working with these postcodes, enter a common surname together with a postcode into the BT search engine of residential numbers at ‘www.thephonebook.bt.com’. From that number, generate additional numbers by replacing the last two digits of the number with two new random digits. Replicate the process using different surnames and postcodes to generate sufficient telephone numbers to complete the survey. An example: Initial contact: Smith, A. (S1) Tel: 0114 1234567 Next contact: 0114 12345[XX] Continue by replacing the last two telephone digits, and so on… Brown, D (S5) Tel: 0114 7654321 Next contact: Tel: 0114 76543[XX] Continue by replacing the last two telephone digits, and so on… 3. Use quota sampling to ensure that the profile of respondents is similar to your geographical area in terms of age and sex. 4. The survey is of health service use for the whole population including children. However, the telephone survey can only be undertaken with adults aged 16 and over. Therefore the script covers identification of people aged 16+ and numbers of children of different ages in the household to allow quota sampling of under 16s.
26

4.8 Analysis plan Please ask the market research company to undertake the analysis and write a report for you. Analysis should follow as detailed below: A. Population 1. An age-sex breakdown of the 1000 respondents for comparison with your population. Check that the quota has been filled. 2. A frequency table of any question or questions you requested to be asked of all 1000 respondents. Some cross tabulations may be useful by socio-demographic characteristics: age, sex, and ethnic group. 3. The proportion of respondents reporting that they used the emergency and urgent care system in the previous three months (S2). B. System users Selecting users of the emergency and urgent care system in the previous three months, for the most recent event: 1. The length of pathways in your system including
• The number of services used (Q7) • The mean number of services used (Q7) • The proportion using four or more services (Q7) • Mean length of time (minutes) taken from first service contacted to help wanted
received (Q18). Days, hours and minutes must be transformed into minutes. 2. Movement between pathways
• The reason for moving along a pathway: why was a second or third service used? (Q11, Q14)
3. Experiences and satisfaction of system users
• The proportion seeking help in/out of hours (Q9, Q12, Q15) • The proportion making contact with services via a) phone, b) internet, c) in
person (Q10, Q13, Q16) • The proportion feeling that they needed to contact too many services (Q19) • The proportion reporting that their case was managed with sufficient urgency
(Q17) • The rating of their overall care (Q23)
4. Satisfaction domains
27

• Three system satisfaction domains have been identified: patient convenience, entry into the system, and progress through the system. Frequencies can be run for each item within a domain.
• An overall mean score can also be calculated. See SPSS syntax below. Entry into the system (Q20): a. I did not know which service to go to about this problem b. I felt that the first service I tried was the right one to help me c. I felt sometimes I had ended up in the wrong place
Patient convenience (Q21): a. Travelling to the services I needed was easy b. I was told how long I’d have to wait c. Services had the information they needed about me d. I had to repeat myself too many times e. Services understood that I had responsibilities, like my need to look after my family Progress through the system (Q22): a. My concerns were taken seriously by everyone b. I was made to feel like I was wasting everyone’s time c. I had to push to get the help I needed d. I moved through the system smoothly e. It took too long to get the care needed f. I felt that no one took responsibility and sorted out my problem g. I saw the right people h. I felt I was given the wrong advice i. Services did not seem to talk to each other j. At each stage I was confident in the advice services gave me
28

SPSS syntax COMPUTE entry = MEAN(Q20a,Q20b,Q20c) . EXECUTE . COMPUTE patient = MEAN(Q21a,Q21b,Q21c,Q21d,Q21e) . EXECUTE . COMPUTE progress = MEAN(Q22a,Q22b,Q22c,Q22d,Q22e,Q22f,Q22g,Q22h,Q22i,Q22j) . EXECUTE . 5. Problems with pathways You may have some problem pathways. An example of a pathway is when a patient goes to their GP in hours, then to the walk in centre and then to ED for the same problem. Unfortunately there are so many combinations of pathways that you are unlikely to have enough people on different pathways to look at satisfaction by pathway. However, you will have enough numbers to look at satisfaction for pathways with specific services on them, for example all pathways that include ED. You may find that if a certain service is on a pathway then system satisfaction is lower than if it is not on a pathway. (Q8 and Q19, Q20, Q21, Q22, Q23). SPSS syntax COMPUTE A&E=0. IF (Q8a=4 or Q8b=4 or Q8c=4) A&E=1. EXECUTE.
29

5. Reporting results and dissemination A market research company can administer the survey, undertake the analysis and produce a report of the findings. It is up to yourselves how you wish to disseminate the findings. 6. References 1. Department of Health. Reforming Emergency Care. First steps to a new approach. 2001. http://www.dh.gov.uk/en/Publicationsandstatistics/Publications/PublicationsPolicyandGuidance/DH_4008702. Accessed 22 October 2007. 2. Department of Health. Emergency access. Clinical case for change: report by Sir George Alberti, the national director for emergency access. 2007. http://www.dh.gov.uk/en/Publicationsandstatistics/Publications/PublicationsPolicyandGuidance/DH_063288. Accessed 22 October 2007. 3. Department of Health. Direction of Travel for Urgent Care: A discussion document. 2006 http://www.dh.gov.uk/en/consultations/Liveconsultations/DH_4139428. Accessed 22 October 2007. 4. O’Cathain A, Knowles E, Munro J, Nicholl J. Exploring the effect of changes to service provision on the use of unscheduled care in England: population surveys BMC Health Serv Res 2007;7:61. 5. O’Cathain A, Coleman P, Nicholl J. Characteristics of the emergency and urgent care system important to patients: a qualitative study. Journal of Health Services Research and Policy 2008;13:19-25. 6. Department of Health. High Quality Care For All. NHS Next Stage Review Final Report. 2008. http://www.dh.gov.uk/en/Publicationsandstatistics/Publications/PublicationsPolicyAndGuidance/DH_085825 Accessed 14th July 2008.
30

TELEPHONE QUESTIONNAIRE
31

UNIVERSITY OF SHEFFIELD NHS RESEARCH VIA TELEPHONE
“I am [name of interviewer] calling from [name of market research company] on behalf of the [name of NHS organisation] who are conducting research for the NHS. They are looking for views on getting help and advice on the day you need it for health problems. The information you give will help to plan health services in your area. It will take 10 minutes at the most. Can you help? Thank you. S1a Are you over 16? Yes - go to S1c No - go to S1b S1b Can I speak to someone who is?
Yes - GO TO S1c No - CLOSE (Do not count towards quota) Your telephone number has been randomly selected. This is a genuine market research survey, which is conducted in accordance with the Market Research Society Code Of Conduct. No one will try to sell you anything during the interview or as a result of taking part. Any information that you do provide today will be anonymised, and kept in the strictest confidence. Your future NHS care will not be affected by anything you tell us today. The data that I collect today will only be used for the purpose that I have described here. IF NECESSARY: If you have any concerns about the validity of this research you can contact the Market Research Society on Freephone 0500 39 69 99 Health issues can be a sensitive area. In the unlikely event that any of our questions cause you distress you can stop the interview” [Interviewer – in the event of someone getting upset, please suggest that they can stop the interview and may wish to contact their GP]. Name __________________________ Postcode __________________________ (first part only e.g. DE5) Telephone number __________________________ Date of interview __________________________ S1c How many adults (over 16 years of age) are there in total (including yourself) in your
household? Adults (write in) ________ S1d How many children under 16 years of age are there in your household? Children under 16 (write in) ________ S1e What ages are your children
1st child _______________ 2nd child _______________
32

3rd child _______________ 4th child _______________ 5th child _______________ 6th child _______________
CHECK QUOTA OF INTERVIEWS WITH ADULTS VS CHILDREN S1f AGE OF INTERVIEW SUBJECT __________________ S1g GENDER OF INTERVIEW SUBJECT MALE .1 FEMALE.2 S1h POSTAL DISTRICT (EG “S61”) _________________ CODE INTERVIEW WITH ADULT RESPONDENT .1 INTERVIEW ON BEHALF OF CHILD .2 IF CHILD INTERVIEW, SELECT ONE CHILD AT RANDOM Say “I would like to concentrate in this interview just on the experiences relating to one of your children. Can you please just think about your 1st/2nd/3rd etc child. I would just like you to focus on them for the rest of this interview.”
RECORD WHICH CHILD CHOSEN 1st child .1 2nd child .2 3rd child .3 4th child .4 5th child .5 6th child .6 write in name of child chosen ___________ S2 In the last 3 months have you sought help for an urgent health problem for yourself/your
child ____________ (if child chosen, refer to the name of the child from above)
Say “this includes trying to contact a service such as a GP, accident and emergency, Chemist, 999 ambulance, NHS Direct, walk-in centre, minor injuries unit, dentist etc where you felt help or advice was needed on the same day” Yes - GO TO Q1
No - GO TO Q24 Q1 In the last 3 months about how many times have you sought help for yourself/for (name of
child) an urgent health problem? _______ (write in number of times) Say “I would like you to think about the most recent occasion when you
have sought help for an urgent health problem for yourself/for (name of
child)”.
33

Q2 Thinking about the most recent time that help was needed urgently, how many weeks ago was that?
Write in number of weeks ________ Q3 How long after thinking this health problem was urgent was help sought?
(read out, single code) Immediately .1
Less than 2 hours .2 Between 2 and 12 hours .3 Between 12 and 24 hours .4 More than 24 hours .5 > ASK Q4
Q4 How long after thinking about the health problem was the urgent help sought? _____________________________ (write in verbatim) Q5 Was the health problem …(read out, single code)
An illness .1 An injury .2
Other .3 Refused (do not read out) .4
Q6 Still thinking about the most recent health problem, please tell me which of the following
services were involved in giving help or advice. Please include all those who you tried to contact, even if this was not successful? (Read out, multi code possible)
Doctor at general practice, in hours .1 Nurse at general practice, in hours .1 GP out of hours .1 Accident and Emergency .1 999 Ambulance service .1 Walk-in Centre .1 Minor Injuries Unit .1 A Pharmacist or Chemist .1 NHS Direct .1 Other .1 please state________________
(note for interviewer: ‘nurse at general practice includes district nurse and practice nurse, ‘999 ambulance service’ includes paramedics) Q7 How many services were involved altogether? _______________ services NOTE FOR INTERVIEWER: this question relates to how many contacts were made. If a respondent reports going to see their GP on two occasions, the number of services would be “2”. CHECK Q7. IF JUST ONE SERVICE USED ASK Q8A, USING JUST THE WORD “SERVICE” IF MORE THAN ONE SERVICE USED THEN ASK Q8A USING PHRASE “FIRST SERVICE”, AND ASK Q8B, Q8C UP TO THE FIRST THREE SERVICES THEY USE AT Q7
34

NOTE FOR INTERVIEWER: Q8 should tally with Q7. For example if a respondent reports 1 service used in Q7 then only Q8a should be completed. If Q7=2 then Q8a and Q8b should be completed and so on.
Q8a What was the service/first service you contacted or tried to contact? (Read out, single code)
Q8b What was the second service? Q8c What was the third service? 1st 2nd 3rd
Doctor at general practice, in hours .1 .1 .1 Nurse at general practice, in hours .2 .2 .2 GP out of hours .3 .3 .3 Accident and Emergency .4 .4 .4 999 Emergency Ambulance .5 .5 .5 Walk-in Centre .6 .6 .6 Minor Injuries Unit .7 .7 .7 A Pharmacist or Chemist .8 .8 .8 NHS Direct .9 .9 .9 Other .10 .10 .10 please state _________
(note for interviewer: ‘nurse at general practice includes district nurse and practice nurse, ‘999 ambulance service’ includes paramedics) CHECK Q7. IF MORE THAN ONE SERVICE USED, SAY “I would like you to think about the first service you used which was ______(name of 1st service from Q8a) FIRST SERVICE Q9 When was help sought from _______ (name of 1st service from Q8a)?
(Read out, single code) Monday to Friday between 8.30am and 6pm .1 Monday to Friday outside these hours .2 Saturday or Sunday, anytime .3 Bank holiday .4
Can’t remember .5 Q10 How did you get the health advice that you needed?
(Read out, single code) By telephone only .1 In person .2 By Internet .3
Other .4
CHECK Q7. IF ONLY ONE SERVICE USED, GO TO Q17, OTHERWISE GO TO Q11
SECOND SERVICE Say “I would now like you to think about the contact you had with the second service, which was ______________(name of 2nd service from Q8b) Q11 Why did you contact the second service _________(name of 2nd service from Q8b)?
35

Say “I will read out some options, please tell me which of these you think apply. You may think that more than one applies”
(Read out, multi code possible)
.1 I could not get access to the first service (name of 1st service from Q8a)
.1 I was not satisfied with the response from the first service (name of 1st service from Q8a)
.1 I was told to do so by the first service (name of 1st service from Q8a) I wanted another opinion .1 The treatment did not work .1 The health problem changed .1 Other .1
note to interviewer: ‘I could not get access to the service’ includes the response ‘it was out of surgery hours’ ‘I was told to by the service’ includes the response ‘to get a prescription’ ‘the health problem changed’ includes the response ‘the health problem got better or worse’ Q12 When was help sought from _______ (name of 2nd service from Q8b)?
(Read out, single code) Monday to Friday between 8.30am and 6pm .1 Monday to Friday outside these hours .2 Saturday or Sunday, anytime .3 Bank holiday .4
Can’t remember .5 Q13 How did you get the health advice that you needed?
(Read out, single code) By telephone only .1 In person .2 By Internet .3
Other .4
CHECK Q7. IF ONLY TWO SERVICES USED GO TO Q17, OTHERWISE GO TO Q14 THIRD SERVICE Say “I would now like you to think about the contact you had with that third service, which was ______________(name of 3rd service from Q8c) Q14 Why did you contact the third service _________(name of 3rd service from Q8c)? Say “I will read out some options – please tell me which of these you think apply. You
may think that more than one applies” (Read out, multi code possible)
I could not get access to the first service (name of 1st service from Q8a) .1
36

.1 I was not satisfied with the response from the first service (name of 1st service from Q8a) I was told to do so by the first service (name of 1st service from Q8a) .1 I could not get access to the second service (name of 2nd service from Q8b)
.1
I was not satisfied with the response from the second service (name of 2nd service from Q8b)
.1
I was told to do so by the second service (name of 2nd service from Q8b)
.1
I wanted another opinion .1 The treatment did not work .1 The health problem changed .1 Other .1
note to interviewer: ‘I could not get access to the service’ includes the response ‘it was out of surgery hours’ ‘I was told to by the service’ includes the response ‘to get a prescription’ ‘the health problem changed’ includes the response ‘the health problem got better or worse’ Q15 When was help sought from _______ (name of 3rd service from Q8c)?
(Read out, single code) Monday to Friday between 8.30am and 6pm .1 Monday to Friday outside these hours .2 Saturday or Sunday, anytime .3 Bank holiday .4
Can’t remember .5 Q16 How did you get the health advice that you needed?
(Read out, single code) By telephone only .1
In person only .2 By Internet .3
Other .4 OVERALL Say “I would now like you to think about how your case was managed overall” Q17 Do you think your case was managed with sufficient urgency? (Read out, single code)
Definitely not .1 No I don’t think so .2 Yes I think so .3 Yes definitely .4 Q18 How long did it take from the time the first service was contacted until the help you wanted was received? (Read out, single code)
Less than 1 hour .1 Between 1 and 6 hours .2 Between 6 and 12 hours .3
Between 12 and 24 hours .4 More than 24 hours .5 Still haven’t received the help I required .6
Q19 How do you feel about the number of services you had to contact? (read out, single code)
37

Too many services .1 Too few services .2 The right number of services .3 Say “Again, I would now like you to think about how your case was managed overall. I am going to read out some statements. Please say if you strongly agree, agree, neither agree or disagree, disagree or strongly disagree with each one. ” (read out, single code each statement) Q20 “The following statements relate to ENTRY into the system”
Agree Neither agree/ disagree
Disagree Strongly agree
Strongly disagree
a. I did not know which service to go to about this problem
.1 .2 .3 .4 .5
b. I felt that the first service I tried was the right one to help me
.1 .2 .3 .4 .5
c. I felt sometimes I had ended up in the wrong place
.1 .2 .3 .4 .5
Q21 “The following statements relate to PATIENT CONVENIENCE”
Agree Disagree Strongly agree
Neither agree/ disagree
Strongly disagree
a. Travelling to the services I needed was easy .1 .2 .3 .4 .5
b. I was told how long I’d have to wait .1 .2 .3 .4 .5
c. Services had the information they needed about me
.1 .2 .3 .4 .5
d. I had to repeat myself too many times .1 .2 .3 .4 .5
e. Services understood that I had responsibilities, like my need to look after my family
.1 .2 .3 .4 .5
Q22 “The following statements relate to PROGRESS through the system” Strongly
agree Agree Neither
agree/ disagree
Disagree Strongly disagree
a. My concerns were taken seriously by everyone
.1 .2 .3 .4 .5
b. I was made to feel like I was wasting everyone’s time
.1 .2 .3 .4 .5
c. I had to push to get the help I needed .1 .2 .3 .4 .5
d. I moved through the system smoothly .1 .2 .3 .4 .5
e. It took too long to get the care needed .1 .2 .3 .4 .5
38

f. I felt that no one took responsibility and sorted out my problem
.1 .2 .3 .4 .5
g. I saw the right people .1 .2 .3 .4 .5
h. I felt I was given the wrong advice .1 .2 .3 .4 .5
i. Services did not seem to talk to each other .1 .2 .3 .4 .5
j. At each stage I was confident in the advice services gave me
.1 .2 .3 .4 .5
Q23 Overall, how would you rate the care you received? (read out, single code) Excellent .1 Very Good .2 Good .3 Fair .4 Poor .5 Very Poor .6
39

40
Say “Before we finish here are some general questions relating to the
person you have spoken about today”
Q24 What is your ethnic group (read out, single code) White .1 Black or Black British .2 Asian or Asian British .3 Mixed .4 Chinese .5 Other .6 If other, how would you describe your ethnic group__________ Refused (do not read out) .7
Q25 Do you have any long-term illness, health problem or disability which limits your daily activities or the work you can do? (includes problems which are due to old age)
Yes .1 No .2
“On behalf of [name of market research company and NHS organisation] we would like to thank you for taking part in this survey”