Embed Size (px)
Citation preview

McRae 1
Emily Rose McRae
Working Draft of Paper for 2007 ILASSA Conference, Austin, TX
Introduction
The Hispanic population in the United States has grown dramatically since 1990,
numbering over 40 million in 2004. This population growth was accompanied by a change in
migration patterns. Instead of the traditional destinations of New York, New Jersey, California,
Chicago, Texas and the Southwest, many Hispanics chose to migrate to Southern states. There
are a variety of forces at play in this change, both economic and social. Migration networks and
economic expansion, with its associated increase in the demand for labor, are generally cited as
the two key dynamics of the phenomenon of rapid Hispanic population growth in the South. In
New Orleans, apparent migration networks have been in place for many years, and the high
demand for labor associated with the rebuilding efforts after the 2006 hurricane season has
contributed to a noticeably increased Hispanic population. However, the motivations for these
migrants are unknown, and as such, the services provided by the community may or may not fit
their needs.
This paper analyzes data from the entrance survey given to all visitors to the Hispanic
Business Resources and Technology Center (HBRTC or “the Center”) in Kenner, LA, and
compares the demographic trends observed with those hypothesized by several models of
migration in order to discover the motivations of Hispanic migrants to New Orleans. After
presenting some basic economic and sociological model of migration behavior, this paper
discusses previous research on the motivations of migrants, then the data gathered is analyzed,

McRae 2
the various models are evaluated and conclusions are drawn. The neoclassical, surplus labor,
and segmented labor market models fixate on income or wage differentials between the country
of origin and the receiving country. Such models often begin with assumptions that do not apply
to real world cases. The osmosis, recent basic trends, and planned behavior theory models have
more general assumptions, but as a result do not provide much insight into the motivations of
migrants. Migration network theory offers the best means of understanding how the
demographic trends expressed in the HBRTC data reflect migration motivations.
Migration Theories
Traditional economic migration theories attempt to understand the motivations and
consequences of migration in terms differences in some measure such that the destination of
country is preferable to the country of origin, and the differential decreases with migration until
the process reaches an equilibrium state. Often, models that explain internal migration can be
applied to international migration by adapting the costs of migration being considered. Internal
migrants face lower costs than international migrants. The act of crossing an international border
adds additional bureaucratic, transportation, and sometimes legal costs, while the additional
distance creates greater stress on personal relationships.
The neoclassical model of migration claims that differences in real income per capita
motivate migration. Workers from the country with the lower income per capita will migrate to
the country with the higher income per capita, which raises the income per capita in the sending
country and lowers it in the receiving country. This model assumes perfect competition in the
labor markets of both countries, full employment in the receiving country, no surplus labor in the
sending country, constant returns to scale of labor and no foreseeable technological advances,
which means that the migrants necessarily reduce wages or replace native workers in the

McRae 3
receiving country (Reubens, 1981). The obvious flaw with this model is that these conditions do
not hold in the real world. While it could be argued that low levels of unemployment are merely
structural unemployment, such that the receiving country does have full employment,
technological advances and varying returns to scale mean that the demand for jobs is not fixed.
Also, perfect competition in the labor market of either country would require an equilibrium
wage such that income is a function of hours worked, which is not the case in most countries.
The osmosis and recent basic trends models of migration both attempt to adapt the
neoclassical model and address some of its limitations. Differences in some factor motivate
migration, but that factor can be anything—income per capita, but also population density,
educational opportunities, capital per worker, or one of many other factors that appear to
precipitate migration (Reubens, 1981). These models’ greatest strengths are in their rejection of
the rigidity of the neoclassical model, and their addition of the concept of threshold effect to the
discussion of migration. The threshold effect can be seen in situations where a factor differential
between two countries does not lead to migration, because it is not significant enough to
motivate migration. However beneficial their rejection of neoclassical rigidity may be, it is
difficult to draw substantial conclusions from the application of these models, because their lack
of rigidity leaves them overly applicable. When multiple factors have significant differentials
between two countries, the osmosis and the recent basic trends models do not help to explain
which factors played a greater role than others, or why.
The surplus labor model, developed by Lewis and elaborated upon by Ranis and Fei, is a
push-pull, two-sector model, where the “traditional sector” is engaged is agriculture, and the
“modern sector” in industry or technologically advanced agriculture. Wages are higher in the
modern sector, and surplus labor in agriculture migrates into the modern sector, which is

McRae 4
growing, such that wages in the modern sector do not immediately begin decreasing. Migration
continues until the modern sector stops growing, and then the model moves into the neo-classical
model of migration. The model assumes that migration is a net-benefit for both the individual
migrant and for the area of origin (Lewis, 1954; Ranis and Fei, 1964). Migration and
development theorists have found that empirical evidence suggests that it is skilled and semi-
skilled workers, not the unskilled labor the model suggests, who are the most likely to migrate,
as they stand to receive the greatest benefit from the migration. This criticism does not take into
consideration human capital obtained after migration, but reflects the reality of migration
between two countries, one with a more extensive traditional sector and the other with a more
extensive modern sector. The countries that the majority of migrants to New Orleans come from
countries have official economies substantially dominated by the service industry, part of the
theorized modern sector.
Related to the surplus labor model, the segmented labor market theory describes an
economy divided into primary and secondary labor markets, with secondary being the lower-
skilled, lower-wage jobs due to heavy competition. The model assumes that native workers
refuse to fill the secondary vacancies, and so migration to the secondary labor market is
encouraged. This model, most notably in the work of Doeringer and Piore, describes the
secondary labor market jobs as miserable and low quality, with low wages, poor labor
conditions, and low levels of labor productivity due in part to the refusal of firms to upgrade their
technology (Doeringer and Piore, 1971). If this is the case, such jobs would still have to have
benefits far superior to those available in the country of origin in order to motivate migration.
The planned behavior theory comes from the field of sociology, and argues that
intentions, as a function of social norms and expectations “that one will attain valued goods as a

McRae 5
consequence of the behavior,” determine behavior decisions (DeJong, 2000, p. 309). DeJong’s
application of planned behavior theory to migration decision-making assumes that individual,
household and community characteristics are not immediately relevant to migration in and of
themselves, but impact the decision through their effect on expectations. DeJong found that
lower income expectancies for non-migration and lower satisfaction with work opportunities in
the country or origin were significant determinants of migration intentions. For women, lower
income and comfort expectancies, lower work satisfaction, and prior migration were most
significantly correlated with migration behavior, while for men lower affiliation expectancies in
the country of origin were most significantly correlated with migration behavior (2000). Overall,
the planned behavior model can be explained in economic terms, specifically in terms of
differences in individual preferences and expected utility motivating the migration decision.
In general, while economics can provide a strong model of patterns in migration
motivation, sociology allows for greater elaboration of the nuances in these patterns. In both
fields, the more specific assumptions the models are based upon, the more detailed the
observations that can be drawn from the application of the model, and the more limited the
prevalence of these observations. Migration networks are an example of this dual economic-
sociological migration model. Connections with experienced migrants lower the economic (not
just financial) costs of migration for new migrants, by providing less risk and better information,
through jobs, language skills, illegal status, and public services. They also help establish social
capital—ties to the community and relationships with other members of the same society that
facilitate interactions. Donato found that migration networks have a greater correlation to female
than to male migration and previous migration of immediate family members also increases the
likelihood of female migration (1993, p. 751). This finding suggests that the utility of such

McRae 6
networks is greater for women. Historically, Hondurans and other Central Americans have been
migrating to New Orleans in significant numbers since the United Fruit Company established a
strong transport conduit between Central American countries and Southern US port cities, in
particular between Honduras and New Orleans (Chinchilla and Hamilton, 2004). The impact of
this migration network on the Hispanic community in New Orleans will be detailed below.
There are also instances where sociological approaches to migration trump economic.
Economics is limited in its approach to examining gender and migration decisions. While there
are plenty of economic studies on female migration’s correlation with having children, education
levels, and income levels, economics provides very little on the role of household decision-
making processes in effecting female migration. Sociology improves upon this weakness by
discussing how women are not always able to express their preferences in household migration
decisions (or household decisions in general). If women are not allowed to maximize their
utility, or if their preferences are not considered while attempting to maximize household utility,
then their migration is not the result of an economic decision.
Patterns of Migration
When Yap examined demographic trends of migrants, he found that marriage and
children decreased the propensity to migrate for both men and women. Family creates strong
ties to the community (social capital) that lower the benefits of migration, and having children
increases the costs of migration. Yap also found that education was strongly positively
correlated with migration (1976). The findings of Stuart and Hyclak support this, in that when
there is a low to non-existent wage differential for unskilled labor there is little benefit of
migration for those lacking skills (1984). However, if there is a significant differential between

McRae 7
standards of living, then all levels of education may have a strong correlation with migration.
Cerrutti and Massey explained that “the act of migration is clearly associated with a higher rate
of labor force participation, even though the move itself may be strongly connected to life course
factors” (2001, p. 187). This suggests that whether or not motivations for migration are directly
related to employment, the act of migration itself is. Labor force participation may not be
immediate, but it is highly likely.
Hispanic Migration to the United States
Passel’s work at the Pew Hispanic Center has found that Hispanic migrants in the United
States are usually young, male, Mexican, illegal, and temporary. They are here to work and go
home, or migrate around the country, and send most of their money home as remittances. While
most migrants initially come alone, they often eventually have their family join them in the
United States (2004). This is the traditional view of Hispanic migration to the United States, and
seems to support the segmented labor market model.
That said, the Hispanic population is decidedly not homogenous, and the experiences of
its subsets vary greatly. Borjas (1982) pointed to the differences in political versus economic
migration in terms of costs of return migration, and the resulting incentives for adaptation in the
receiving country. Borjas found that wage differentials, as a proxy for labor market assimilation,
decrease with both the years since initial migration and with acquiring of skills and human
capital. If decreasing wage differentials are used as a proxy for assimilation, then the segmented
labor market model is inaccurate for describing Hispanic migration to the United States, and
planned behavior theories discussion of expectations may be more relevant.

McRae 8
Migration to the Southern United States
Migration to the South has been driven by economic expansion in the service and
industry sectors of metropolitan areas in the South, and the resultant need for semi-skilled labor.
This migration has been largely motivated by employment, such that apparent wage differentials
overcame the strong pull of the benefits of migrating to traditional settlement areas. Given the
long-lasting impact of economic conditions in the United States on job opportunities for migrants
(see Stewart and Hyclak, 1984, p. 292), the economic expansion in the South has created a
significant motivation for migration to the South as opposed to other areas of the United States.
In the New Orleans area, the even greater demand for labor is even higher since Hurricane
Katrina, such that job prospects could be even more appealing to migrants. However, Kochhar,
in a 2006 report on Latino labor, finds that “there is no clear sign that Hurricane Katrina gave an
unusual boost to employment in construction for Latino workers either in the South or in the
nation at large between mid-2005 and mid-2006” (p. 24). Kochhar elaborates that an increased
Hispanic populations in hurricane-affected areas resulted more from “Hispanic construction
workers relocating from neighboring areas in the South” than foreign-born workers entering the
area (p. 24). The overall trend of high rates of increase in foreign-born Hispanic employment
than native-born Hispanic employment mentioned earlier in the same Latino labor report could
contrast this conclusion, but may simply reflect diversification of the overall Hispanic labor force
into fields other than construction.
Human Capital and Migration

McRae 9
Given that the data for this paper comes from surveys given to individuals seeking
services from the Hispanic Business Resources and Technology Center, whose language courses
and business seminars focus on increasing visitor’s human capital, the effects of human capital
on migration may be particularly significant to this data set. Stier and Tienda (1992) draw the
conclusion that for migration motivated by differences in incomes or wages, not only do
migrants self-select from higher education and skill level cohorts, but higher wages are
associated with education, training and skills in the US. Some pre-migration human capital has
less of an effect on wages than post-migration human capital (work experience), while other
forms do not have a significant difference in their effect on wages between accumulation before
and after migration (schooling). Only in enclaves is their significant incentive to avoid English-
language training (through formal classes or prolonged exposure to English-speaking society) for
those who do not yet have it. They also found that “language effects on wages are mediated by
the prospects for securing a job in the first place” (Stier and Tienda, 1992, p.1303). Also
highlighting the positive wage effect of skill accumulation, Borjas found that “most, if not all,
wage differentials between races/ethnicities can be explained by differences in skills, further
emphasizing the importance of skill accumulation” (1982, p. 344). This emphasis on skills and
their effect on wages for migrants suggests that the neoclassical model suffers from its lack of
differentiation between workers of different skill levels. The surplus labor, segregated labor
market, and planned behavior theory models seem to compliment the importance of skills to
migrant wages.
Gender and Migration to the United States

McRae 10
Given the potential restrictions on individual utility maximization in the household
migration decision mentioned above, female motivations for migration may differ significantly
from male motivations, and may reflect any constraints imposed upon them during the decision
making process. Cerrutti and Massey found that within the household, “a husband’s migration is
determined substantially by factors more relevant to employment (human and social capital),
whereas the wife’s is related more strongly to family considerations (the prior migration of
children, nieces, and nephews)” (2001, p. 192). Along with family ties, migration networks have
a positive correlation with female migration.
After migration, Stier and Tienda found “little support for the claim that the labor supply
of immigrant wives responds to intra-familial economic pressures” (1992, p. 1309). Time in the
US did not increase the likelihood of labor force participation in their sample. Earlier immigrant
wives participate less in the labor market than more recent immigrant wives. “This suggests that
“pure” immigration effects on labor supply are transitory and quickly give way to other factors
that shape market decisions” (p. 1305). Also, Enchautegui finds that “long-term nonwork
decreases the propensity to migrate for women in each demographic group. Apparently, labor
market detachment produces migration inertia” (1997, p. 546). Female migration appears to be
motivated by family decisions and constraints rather than income differentials. Cerrutti and
Massey caution against assuming that “that economic or household strategy models are the
appropriate explanations for women’s behaviors. It may simply be that women’s decisions are
closely constrained by patriarchal norms, whereby men ultimately determine whether and when
wives should join them” (2001, p. 198). The migration decision for women must be contrasted
with the labor force participation decision. When women migrate and are active in the labor

McRae 11
force, their economic activity is most likely the result of a decision to maximize household
utility, though individual utility decisions cannot necessarily be observed in the act of migration.
Data and Analysis
New Orleans Hispanic Population
This paper uses HBRTC survey data supplemented with US Census Data, including the
2004 American Community Survey. Survey questions will be included in the appendix. This
data was gathered between the Center’s opening on March 13, 2006 and October 13, 2006, a
period of seven months.
The HBRTC survey data has natural limitations resulting from the self-selection of
visitors. Individuals seeking the services of a small business support center are not likely to be
retirement age, as they will wish to live to implement their plans and to see return on their
investments, so the sample may be skewed slightly younger than overall population. Also, these
same individuals are less likely to be temporary migrants. While the human capital obtained at
the Center can certainly be applied to other states and countries, the social capital cannot. Since
many of the services offered at the HBRTC require a substantial time commitment over several
months, there are numerous opportunities for significant social capital development that could
increase the costs of out-migration from the New Orleans area.
Demographics
The arithmetic mean age of visitors to the HBRTC was 34.89 years, and the geometric
mean was 32.99 years. As the difference suggests, there were many more visitors younger than

McRae 12
34, but a few 60 and 70 year old visitors skew the data. The median age in New Orleans was
35.2 according to 2005 US Census data. Visitors to the center were 51.3% male and 48.7%
female. Number of children was used as a proxy for family composition. 66.1% of Center
visitors had children, 33.9% did not. Of the 66.1% who had children, the arithmetic mean
number of children was 2.14 and the geometric mean was 1.8. The survey population was on
average in their low-thirties, roughly the age of beginning new families or having young
children, divided almost evenly between men and women (the difference between even split is
not statistically significant, so the overall population could be perfectly evenly split). The high
percentage of females in the sample population is higher than expected, given the literature on
gender and migration, particularly for a small business center. This suggests a female migrant
population that is active in the labor market. The majority of visitors had children, which defies
the assumption of migrants as non-married and without children, however, in many cases these
children may be from relationships since migration.

McRae 13
22.7% of men and 17.1% of women were under 24. 20.5% of men and 11.4% of women
were between 25 and 29. 31.8% of men and 17.1% of women were between 30 and 34. 11.4%
of men and 5.7% of women were between 35 and 39. 2.3% of men and 22.9% of women were
between 40 and 44. 4.5% of men and 5.7% of women were between 45 and 49. 2.3% of men,
and 14.3% of women were between 50 and 59. 4.5% of men and 5.7% of women were over the
age of 60. Women were more dispersed throughout the age cohorts, and women had a higher
mean age. If visiting the HBRTC is in and of itself considered a proxy for labor force
participation, and the age limitations on female fertility are taken into consideration, the data
implies that migration may begin as a family decision that later leads to labor market
participation. The data for gender and children also supports this, because significantly more
women than men had children.
55.2% of men had children, while 44.8% did not. 78.2% of women had children and
22.8% did not.

McRae 14
29.4% of visitors under the age of 24 had children, while 70.6% did not. 53.8% of
visitors between 25 and 29 had children and 46.2% did not. 80% of visitors between 30 and 34
had children, while 20% did not. 57.1% of visitors between 35 and 39 had children and 42.9%
did not. 88.9% of visitors between 40 and 44 had children, 11.1% did not. 100% of visitors
between 45 and 49 had children. 75% of visitors between 50 and 59 had children, 25% did not.
75% of visitors over 60 had children, while 25% did not.

McRae 15
The country of origin for the largest number of survey respondents was Honduras
(47.1%), followed by Mexico (16.8%), and Nicaragua (13.4%), along with a smaller number of
native-born US citizens (4.2% of visitors). There were also a limited number of visitors from
Colombia, Brazil, Costa Rica, Argentina, Cuba, El Salvador, Peru, and Venezuela (as well as
Thailand and Vietnam). The high percentage of Hondurans implies the existence of a nativity
enclave, which reflects the historical trends mentioned above.

McRae 16
47.4% of both male and female visitors were from Honduras. 21.1% of men and 10.5%
of women were from Mexico. 15.8% of men and 12.3% of women were from Nicaragua. 5.3%
of men and 3.5% of women were born in the US. 1.8% of men and 5.3% of women were from
Guatemala. 100% of the migrants from Costa Rica, Colombia, Argentina, and Venezuela were
female. (Also the two visitors from non-Latin American countries who reported their gender
were female.) 3.5% of men and 1.8% of women were from Brazil. 100% of visitors from Peru
were male. 1.8% of both men and women were from Cuba and the same percentage of each
were from El Salvador. The statistics on gender and country of origin support the assumption
that New Orleans is the site of a Honduran migration network and nativity enclave. There are
significantly less women than men in the Mexican and Nicaraguan nativity groups. This is not
true for the Hondurans, which suggests that something is either lowering the costs or raising the
benefits of migration to New Orleans relative to those of Mexican and Nicaraguan women.
However, the number of women from non-major areas possibly conflicts with this, which

McRae 17
suggests that costs and benefits could differ for reasons other than a migration network.
However, the number of individuals from the non-major countries is small overall, such that this
trend may be a result of a small sample size for that cohort. There is no significant difference
between the expected and observed relationship of having children and country of origin or
between the expected and observed relationship of having children and time in the US.
68.6% of Honduran migrants had children and 31.4% did not. 65% of Mexican migrants
had children, while 35% did not. 64.3% of Nicaraguans had children, 35.7% did not. 100% of
US-born visitors had children. Of the remaining countries, 47.8% had children, while 52.2% did
not.
Motivations

McRae 18
I used length of time in the US and having lived in other states or countries as proxies for
permanent versus temporary migration. Time in US is a continuum variable—I cannot be certain
that individuals who have been in the US for several years will stay in the US, let alone New
Orleans, but the greater the period of time since initial migration, the lower the likelihood of
return migration. Having lived in other locations than Louisiana is a good variable for
examining temporary versus permanent migration, as individuals who are motivated by wage
labor alone are not likely to choose to permanently reside in New Orleans (for reasons discussed
below, in the economic data section), but also because those who have lived in states other than
Louisiana or countries other than the US and their country of origin are more likely to place
lower value on previously developed social capital, and as such are more likely to migrate
elsewhere.
I also looked at responses to the question “what are your objectives for you interaction
with the HBRTC?” The answer to this question illuminates individual motivations for
improving personal human capital and competitiveness in the labor market. If migration is
related to labor market factors, such as higher real per capita income, then these same factors that
motivate individuals to visit the HBRTC, and thereby increase their expected wages, may have
motivated them to migrate in the first place.

McRae 19
The majority of survey respondents had been in New Orleans prior to the Hurricane, but
on average less than 5 years. This may reflect some self-selection by Center visitors, since well-
established members of the Hispanic community might not feel the need for business training.
Return migration is less likely for the majority of respondents that have children, suggesting that
the Hispanic population in New Orleans is for the most part permanent, not temporary.
However, while HBRTC visitors were dispersed throughout the time in US cohorts, frequency
decreased with time and almost a third had been in the US between one and three years. One to
three years is not a long enough period of time to suggest permanent migration, but other factors
must be considered before the visitors to the HBRTC are described as temporary. Their short
stay in the US may in fact be a result of their coming to the HBRTC for assistance, as more
established individuals might have found the same resources elsewhere, or not need these
resources at all. As mentioned in the beginning of the data section, the decision to use HBRTC
services in and of itself expresses a degree of permanency in the visitors’ migrations.

McRae 20
20.3% of men and 7.1% of women had been in the US for less than a year. 40.7% of men
and 19.6% of women had been in the US for 1 to 3 years. 1.9% of men and 19.6% of women
had been in the US for 3 to 5 years. 11.1% of men and 16.1% of women had been in the US for
5 to 7 years. 5.6% of men and 3.8% of women had been in the US for 7 to 9 years. 1.9% of men
and 12.5% of women had been in the US for 9 to 11 years. 12.9% of men and 8.9% of women
had been in the US for 11 to 20 years. 5.6% of men and 12.5% of women had been in the US for
over 20 years. A higher percentage of men than women had been in the US between one and
three years, and these visitors also tended to be in the lower age cohorts. These visitors may
represent more traditional migration that is motivated by wage and per capita income
differentials to seek temporary employment in the US.

McRae 21
This data shows that the likelihood of having children increases with time spend in the
US—those who have been in the US for less than a year are more likely to not have children.
All other time spent in the US cohorts are more likely to have children than not, and the
probability of not having children generally declines with time in the US. Most likely, with a
larger sample size this pattern would be even more pronounced. Such a trend implies that
permanent migration is more positively correlated with having children than with not having
children, but more research and data analysis needs to be done to confirm this. It is important to
recognize that the migration of entire families carries with it a good deal more risk and economic
cost than the migration of an individual, so many households may send over a single family
member who sends remittances home, while in other cases individuals abstain from beginning a
family until after the act of migration. If longer-term migrants are having families after

McRae 22
migration, or if entire families migrate after one family member establishes a household in the
US, the services the Hispanic population of New Orleans will demand will be quite different if
these same longer-term migrants leave households with children in their country of origin. The
two situations are probably occurring at the same time, with migrants participating in the nativity
enclave beginning families after migration, or migrating with their families, while other
migrants, possibly more temporary, sending remittances home to their family.
69.1% of visitors had not lived anywhere other than Louisiana and their country of origin
for more than six months, 28.5% had lived in other states, and 2.4% had lived in other countries.
For the most part likelihood of having lived in another state or country decreased as time spent in
the US increased, but the pattern was not perfect. This is most likely due to the sample size. It
must also be noted that because survey respondents were choosing to receive training in business
and employment skills, the group itself is self-selected, with those who intended to migrate only
temporarily not visiting the Center. However, since the Center offers ESL classes, there is
certainly the possibility that visitors utilizing these services might participate in out-migration to
other areas of the US.

McRae 23
Interestingly, time in US and having lived in other states does not seem to be negatively
correlated, as one might expect if they were both good proxies for permanent versus temporary
migration. While the sample size for visitors who had lived in other states or countries is far too
small to draw conclusions from, it is clear the correlation is not sharply negative. This does not
have to mean that either time in US or having lives in other states are poor proxies for permanent
versus temporary migration. It is possible that the migrants that are motivated mostly be
differences in real income per capita make up a significant portion of the visitors who have lived
in other states, and that in the case of those visitors who have been in the US for less than a year,
this subgroup has not yet had the opportunity to move elsewhere. This may be true for the one to
three year cohort as well. It is also possible that having lived in other states would increase with
time spent in the US if many migrants were initially motivated by differences in income per
capita, but some factor, such as a nativity enclave or an increase in demand for labor, drove them
to New Orleans later, after their initial migration to the United States. This group would not

McRae 24
necessarily be permanent residents of the city, it would depend on their motivations for making
the internal migration to New Orleans, and whether these motivations were specific to the city or
not.
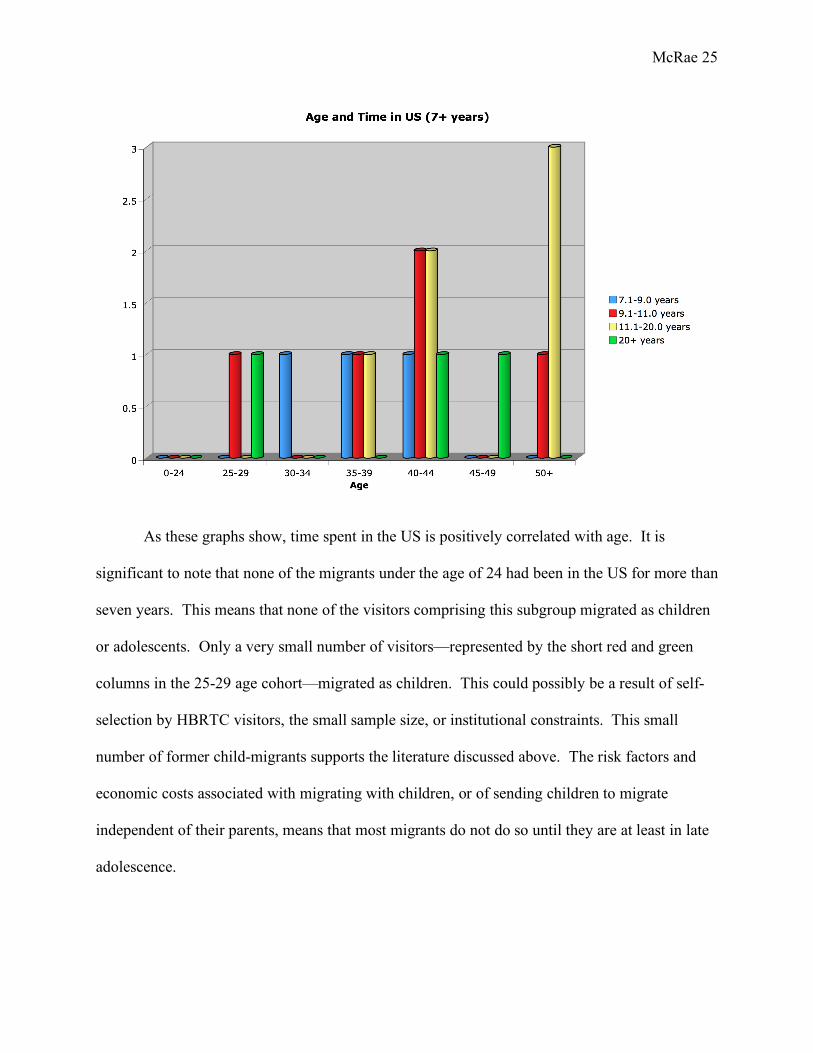
The following two figures present the relationship between age and time in the US,
broken into two graphs for easier reading. The first graph shows the frequency of time in the US
under seven years for the surveyed population, according to age, while the second graph shows
the frequency of time in the US over seven years.
McRae 25
As these graphs show, time spent in the US is positively correlated with age. It is
significant to note that none of the migrants under the age of 24 had been in the US for more than
seven years. This means that none of the visitors comprising this subgroup migrated as children
or adolescents. Only a very small number of visitors—represented by the short red and green
columns in the 25-29 age cohort—migrated as children. This could possibly be a result of self-
selection by HBRTC visitors, the small sample size, or institutional constraints. This small
number of former child-migrants supports the literature discussed above. The risk factors and
economic costs associated with migrating with children, or of sending children to migrate
independent of their parents, means that most migrants do not do so until they are at least in late
adolescence.

McRae 26
In answering the question “what are your objectives for you interaction with the
HBRTC?” 39.5% chose development, 17.4% chose finding employment, 19.8% chose opening
or developing their own business, and 23.4% chose helping family. Visitors were allowed to
choose more than one response. Most of the surveys were answered in Spanish, and
“capitación” was listed in place of “capacitación” which means qualification or preparation, and
was listed as development on the English survey. Many respondents corrected the word on the
form themselves, and for simplicity’s sake this paper assumes that those who did not correct the
mistake nevertheless were aware of the intent of the word. We did not ask visitors to elaborate
on what they meant by choosing “development” or “family,” the two most commonly chosen
objectives, both of which can be highly conceptual. Visitors who chose personal development
were most likely referring to increasing the competitiveness of their labor or business, via new or
improved skills, but they could also have been referring to enhanced social networking, or any
other myriad objectives that might fall under the category of development. Helping ones family,
as the Spanish text of the survey translates, is even more ephemeral. It could involve assisting
with children’s schoolwork, bringing in additional income, facilitating household production
(easing interactions with neighbors, landlords, and/or service providers), improving inter- or
intra-family relationships, and/or any number of other things.

McRae 27
Objectives were evenly distributed between the genders. Men and women almost equally
listed “family” as an objective, suggesting that while initial migration may or may not be a
family decision, with wives participating equally with their husbands, labor force participation is
such a decision. The near equal percentages of men and women who listed business as an
objective implies a higher level than expected of not only female labor force participation, but
also of female business initiative.

McRae 28
Those visitors with children were equally as likely as those without to list “family” as an
objective, but a lower percentage of those with children list “employment” as an objective, and a
higher percentage of the same group list “business” as an objective. This could imply that those
with children have motivations beyond wages, and wish to establish an income-generating
source independent of their labor.
B. National Hispanic Population
According to Fry’s Statistical Portrait of Hispanics at Mid-Decade, the US Hispanic
population was 59.8% native born and 40.2% foreign born in 2005. The HBRTC data differs
greatly from this in that nearly all visitors were foreign-born. Those who were native-born were
not asked which origin group they affiliate with.
Nativity Pew HBRTC Standard Error
Z-Value

McRae 29
Foreign Born 0.402 0.957 0.0455 29.847 Native Born 0.598 0.0431 0.0455 12.198
The table above shows the most significant difference between the Pew Hispanic Center
data and the HBRTC data—there are far more foreign born in the HBRTC sample. This has the
potential to skew the result, if the foreign born population is significantly different than the
national population, independent of distinctions between the national and New Orleans data.
The Pew has data on the foreign born population’s age and gender, which is compared later in
the text with the overall Hispanic population’s data on age and gender relative to that of the
HBRTC data in order to see what potential impact this high percentage of foreign born in the
sample might have on the conclusions that can be drawn from the data.

McRae 30
The majority of Hispanics (63.8%) were of Mexican origin, while 1.1% were Honduran,
and 0.7% were Nicaraguan. This is different from the majority Honduran HBRTC sample.
Country of Origin Pew HBRTC S.E. Test 1
Pew-Foreign Born
HBRTC-Foreign Born S.E. Test 2
Honduras 0.0111 0.483 0.00974 -48.405 0.0197 0.505 0.0132 -36.725
Mexico 0.639 0.172 0.0446 10.458 0.645 0.180 0.0454 10.224
Nicaragua 0.00656 0.138 0.0075 -17.523 0.0113 0.144 0.0100 -13.271 As the table shows, this difference is significant and with regards to country of origin, the Pew
data and the HBRTC data are radically different and do not represent identical populations. For
a two-tailed test of difference at the ninety-five percent significance level, acceptable Z-values
would fall between -1.96 and 1.96. None of the Z-values for the Honduran, Mexican, and
Nicaraguan sample proportions fall within this range. The Honduran proportion exhibits the
strongest degree of difference, then the Nicaraguan. Because nativity may be skewing the Pew’s

McRae 31
majority native-born sample, the foreign populations of both samples were also compared. The
magnitude of the Honduran Z-value decreases by almost twenty-five percent, as does the
Nicaraguan test statistic, but the difference in the Mexican proportions does not appear to change
substantially. While the Z-values continue to fall outside the range of acceptable values to
accept the country of origin proportions as equal, comparing the foreign born populations as
opposed to the overall populations does somewhat mediate the degree of difference for the
Honduran and Nicaraguan proportions. It shows minimal effect on mediating the difference
between the Pew and HBRTC Mexican proportions, most likely due to the large size of the
Mexican proportion in both sets of Pew data.
As the chart above shows, the Pew data exhibits a similar trend to the HBRTC data, with
females being more widely dispersed throughout the age cohorts, and with male having a slightly

McRae 32
lower median age. Out of concern for the potential impact that the differences in nativity
between the two samples might have on this trend, the overall Pew data and the Pew data on the
foreign born Hispanic population were both subjected to tests of difference against the HBRTC
data. Data for individuals under the age of 15 was rejected, as such individuals are too young to
legally be employed in the United States, and as such there was not a comparable population in
the HBRTC data. The rejection of this data had a significant impact on the proportions within
the age brackets for the Pew overall data, as nearly thirty percent of both the male and female
sampled population is under age 14.
Age and Gender
Male Pew HBRTC S.E. Test 1
Pew-Foreign Born
HBRTC-Foreign Born S.E. Test 2
15-24 0.240 0.227 0.0644 0.195 0.173 0.244 0.0591 -1.203 25-29 0.141 0.205 0.0525 -1.213 0.152 0.171 0.0561 -0.336 30-34 0.128 0.318 0.0504 -3.76 0.147 0.317 0.0553 -3.078 35-39 0.117 0.114 0.0484 0.0602 0.1364 0.122 0.0536 0.271 40-44 0.101 0.0227 0.0454 1.72 0.117 0.0244 0.0502 1.842 45-49 0.0799 0.0455 0.0409 0.843 0.0859 0.0488 0.0438 0.847 50-59 0.102 0.0227 0.0457 1.742 0.104 0.0244 0.0477 1.674 60-64 0.0302 0.0227 0.0258 0.29 0.0295 0.0244 0.0264 0.195 65 + 0.0610 0.0227 0.0361 1.06 0.0555 0.0244 0.0357 0.869
Female Pew HBRTC S.E. Test 1
Pew-Foreign Born
HBRTC-Foreign Born S.E. Test 2
15-24 0.226 0.171 0.0707 0.777 0.148 0.152 0.0619 -0.0528 25-29 0.123 0.114 0.0555 0.159 0.125 0.121 0.0576 0.0717 30-34 0.120 0.171 0.0548 -0.948 0.137 0.182 0.0599 -0.743 35-39 0.111 0.0571 0.053 1.007 0.133 0.0606 0.0591 1.223 40-44 0.101 0.229 0.051 -2.498 0.117 0.242 0.056 -2.239 45-49 0.0819 0.0571 0.0463 -1.151 0.0921 0.0606 0.0503 0.626 50-54 0.0642 0.0286 0.0414 0.859 0.0701 0.0303 0.0444 0.895 55-59 0.0495 0.114 0.0367 -1.766 0.0513 0.0909 0.0384 -1.033 60-69 0.0636 0.0286 0.0412 0.848 0.0598 0.0303 0.0413 0.715 70 + 0.0602 0.0286 0.0402 -0.561 0.0588 0.0303 0.0409 0.695

McRae 33
Using the same decision rule of rejecting all Z-values below -1.96 and above 1.96, the
data shows that overall the Pew and HBRTC data presented proportions whose equality could
not be rejected. For the overall male population, only the 30-34 cohort’s equality was rejected
with the HBRTC proportion significantly higher than the Pew proportion. All other male age
cohorts shared significantly equal proportions between the HBRTC and Pew data. When nativity
is considered and the foreign-born samples compared, the same overall equality is observed.
Again, only the 30-34 year age group has a proportion significantly different between the two
samples—the HBRTC proportion is greater than the Pew proportion. In the case of the 15-24
cohort’s proportion, there is a sign change in the test statistic, along with a substantial magnitude
change. While the proportions’s equality cannot be rejected, the Z-value goes from very small,
and positive, implying a slightly higher Pew proportion, to relatively large and negative,
implying a substantially higher HBRTC proportion. This implies that the national foreign-born
population has fewer members of the 15-24 cohort relative to the overall national population.
For the lowest three age cohorts, the HBRTC foreign-born proportion is larger than that of the
Pew, and for the upper six age cohorts the Pew foreign-born proportion is larger. The HBRTC
foreign-born data is younger than the national foreign-born data.
In the overall female samples, only the 40-44 age cohort had overall proportions that
were significantly unequal, with the HBRTC proportion larger than that of the Pew. The
foreign-born samples required rejecting the equality of the same age cohort. Unlike the male age
cohorts, the female age cohorts did not exhibit any consistency of sign in their test statistics,
implying that the national and New Orleans samples were not significantly older or younger than
one another, but that the sample with the larger proportion depends on which age cohort is being

McRae 34
examined. Some of the difference may be a result of the small HBRTC sample size, particularly
relative to that of the national data.
In the Statistical Portrait of Hispanics at Mid-Decade, Fry recompiles and analyzes data
from the American Community Survey (ACS) of 2005. One set of data that the ACS provides
that Fry did not recompile for his Statistical Portrait is the breakdown of the foreign-born
population by year of entry.
Foreign-Born Population by Sex, Year of Entry and Hispanic Origin Type: 2004 (numbers in thousands) Year of Entry Total Hispanic Hispanic Origin Mexican Central American Number Percent Number Percent Number Percent Total 16278 100 10638 100 2126 100 2000 or later 3259 20 2252 21.2 424 20 1990 - 1999 5947 36.5 4030 37.9 810 38.1 1980 - 1989 3909 24 2505 23.5 590 27.7 1970 - 1979 1881 11.6 1216 11.4 204 9.6 Before 1970 1282 7.9 634 6 98 4.6 Source: American Community Survey Data, 2004
In contrast to the HBRTC data, where the majority of respondents entered the US after
2000, the majority of ACS respondents arrived during the decade of the 1990s. Broken down
further, by Hispanic origin, both the Mexican and Central American samples follow the ACS
pattern, so the difference in time in the US between the two samples cannot be attributed simply
to the differences in nativity. Central American is not broken down further into countries origin,
so it is difficult to say for certain, but it appears that pull, not push, factors must be motivating
the differences in average time in the US. At some point between 2000 and 2005, individuals
who visited the HBRTC were more motivated to migrate to the United States than between 1990
and 1999.
Latin Growth in New Orleans, LA 1990 2000 Change Metropolitan Statistical Area (MSA) 52,563 58,545 11%

McRae 35
Central City 15,900 14,826 -7% Suburb 36,663 43,719 19%
Suro and Singer’s report on Latino Growth in Metro America describes the changes in
the New Orleans Hispanic population. Between 1990 and 2000 the overall MSA’s Hispanic
population grew by 11%, but this includes a 7% decrease in the central city’s population.
Compensating for this loss is the increase in suburban New Orleans’s Hispanic population. We
do not know if the 7% leaving central city necessarily were part of the 19% increase in suburban
New Orleans, but the overall trend was for suburban increase.
C. Economic Indicators
For the purpose of comparing what the demographic and motivational trends suggest
about the motivations of Hispanic migrants to New Orleans with what economic data suggest,
statistics on income and employment rates were gathered.
GDP Per Capita (USD PPP) Year Source
New Orleans 19,711 2004 US Census Bureau
USA 41,800 2005 US Census Bureau
Honduras 2,900 2005 CIA World Factbook
Mexico 10,000 2005 CIA World Factbook
Nicaragua 2,900 2005 CIA World Factbook
The differences in income per capita suggest that wage and income differentials could
play a substantial role in motivating migration. The lower income per capita in New Orleans
compared to the rest of the United States suggests that something other than wage and income
differentials must be increasing the benefits or lowering the costs of migration to New Orleans

McRae 36
relative to the costs and benefits of migration to elsewhere in the US. Because institutional
factors in each country assure that wages do not the equal marginal productivity of labor, it’s
difficult to tell from the data whether the New Orleans Hispanic population is better education or
more highly skilled than similar individuals in their country of origin, however, the decision to
receive training at the HBRTC will have a direct effect on their income (according to Stewart
and Hyclak’s results).
Unemployment Rate (%) Underemployment Year Source
New Orleans 11.8 2004 US Census Bureau
USA 6.9 2005 US Census Bureau
Honduras 28 2005 CIA World Factbook
Mexico 3.6 25 2005 CIA World Factbook
Nicaragua 5.6 46.5 2005 CIA World Factbook
While the level of underemployment is unknown, it is clear that overall employment is
far higher in the overall United States. New Orleans’s level of unemployment, from pre-Katrina
data, is over seventy percent higher than the national rate. Because this data is not broken down
by sector, we cannot be certain that information regarding sectors with higher than average
employment rates did not motivate migrants to New Orleans. What is apparent is that based on
strict unemployment rates as reported by each country’s government, the level of Honduran
migration is expected, given the differentials between Honduran and New Orleans
unemployment rates, but Mexican and Nicaraguan migration requires that one factor in
underemployment. Since the rate, but not the degree, of underemployment is provided, it is

McRae 37
difficult to judge whether one can argue that migration is in response to, and if it follows
economic models, proportional to, unemployment differentials between regions.
V. Evaluation
Clearly, differences in income per capita play a role in migration, but the neoclassical
model’s assumptions do not hold—New Orleans does seem to have full employment currently,
but this is a phenomenon of the reconstruction, and does not reflect the state of affairs when
many of those surveyed first migrated to New Orleans. Also, the assumption of no surplus labor
in the country of origin cannot be supported by this data, given the prevalence of un- and under-
employment.
The data does not immediately support the surplus labor or the segmented labor market
model, because it does not suggest that movement is from the agricultural to the modern sector.
However, there is something to be said for differences in economies, and the role that unequal
distribution of technology and capital plays in making less capital-rich countries not so much an
“agricultural” sector as a less productive modern sector. It is conceivable from the data that
migrants are moving to areas where their skills can yield greater productivity. However, this
does not explain the entirety of migration, just a portion of the motivations.
The differences in income and job opportunities suggest that planned behavior theory
should fit the New Orleans Hispanic population’s migration. However, planned behavior theory
is too vague for this to lead to any conclusions that are significantly different than those of the
economic models. The data initially appears to completely contradict the information on gender
differences and migration, given the higher percentage than expected of both female migrants

McRae 38
and migrants with children. This contradiction most likely comes from the lowered costs and
increased benefits of the Honduran migration network in New Orleans.
The high percentage of Hondurans in the sample and the higher than expected frequency
of females within the Hondurans surveyed point to the existence of a strong migrant network.
The higher average age, low likelihood of having lived in another state, and significant
percentage of visitors with children also support the application of a migration network model to
the data. The benefits of a Honduran migrant network would explain why Hondurans migrate to
New Orleans despite its lower real income per capita and higher unemployment rates than the
rest of the United States. This is not to say that other migrant networks do not exist alongside the
Honduran migrant network, nor is it to say that New Orleans is not a nativity enclave for other
nationalities, the surveyed sample is too small to draw conclusions excluding either possibility.
What can be discerned is that the migrant network is the best model for describing migration to
New Orleans, though they may not be the exclusive force driving individuals.
Conclusions
This data stems from a single survey of self-selected sample of the New Orleans Hispanic
population, and as such the conclusions drawn may not apply perfectly to the entire population.
The economic models of migration that fixate on differences in wages or income motivating
migration—the neoclassical, surplus labor, and segmented labor market models—present a
partial picture of the motivations for migration to New Orleans, given the clear average wage and
income differentials. Income alone is not a sufficient motivator for the degree of migration to
New Orleans, nor for the demographic trends seen within the population. Models that attempt to
incorporate other factors—the osmosis, recent basic trends, and planned behavior theory

McRae 39
models—do not generally yield significant conclusions due to the vague assumptions on which
they are based. The New Orleans population appears to fit these models, but no valuable
conclusions can be drawn about this fit. The most significant theory for the New Orleans
Hispanic population is that of migration networks. The Honduran migration network in New
Orleans lowers the costs and increases the benefits of migration. As a result, there are more
migrants, more women, more families, a higher average age, and a lower likelihood of temporary
migration in the New Orleans population than would be expected without the migration network.

McRae 40
VII. Bibliography Borjas, G. J. (1982). The Earnings of Male Hispanic Immigrants in the US. Industrial and Labor Relations Review, 35 (3), 343-353. Cerrutti, M., & Massey, D. S. (2001). On the Auspices of Female Migration from Mexico to the United States. Demography, 38 (2), 187-200. CIA World Factbook 2006. Honduras. Accessed October 18, 2006. https://www.cia.gov/cia/publications/factbook/geos/ho.html CIA World Factbook 2006. Mexico. Accessed October 18, 2006. https://www.cia.gov/cia/publications/factbook/geos/mx.html CIA World Factbook 2006. Nicaragua. Accessed October 18, 2006. https://www.cia.gov/cia/publications/factbook/geos/nu.html CIA World Factbook 2006. United States. Accessed October 18, 2006. https://www.cia.gov/cia/publications/factbook/geos/us.html De Jong, G. F. (2000). Expectations, Gender, and Norms in Migration Decision-Making. Population Studies, 54 (3), 307-319. Doeringer, P. & Piore, M. (1971). International Labor Markets and Manpower Analysis. Lexington: Heath. Donato, K. M. (1993). Current Trends and Patterns of Female Migration: Evidence from Mexico. International Migration Review, 27 (4), 748-771. Lewis, W. (1954). Economic development with unlimited supplies of labour. Manchester School 22, 139-191. Passel, J. and R. Suro. 27 September 2005. “Rise, Peak and Decline: Trends in US Immigration 1992-2004.” Washington, D.C.: Pew Hispanic Center. Ranis, G. & Fei, J. (1964). Development of the Labor Surplus Economy: Theory and Policy. Homewood: Irwin. Reubens, E. P. (1981). Interpreting Migration: Current Models and A New Integration. New York: New York University Press. Stier, H., & Tienda, M. (1992). Family, Work and Women: The Labor Supply of Hispanic Immigrant Wives. International Migration Review, 26 (4), 1291-1313. Stewart, J. B., & Hyclak, T. (1984). An Analysis of the Earnings Profiles of Immigrants. The Review of Economics and Statistics, 66 (2), 292-296.

McRae 41
Stoltz Chinchilla, Norma and Nora Hamilton. “Central American Immigrants: Diverse Populations, Changing Communities,” The Columbia History of Latinos in the United States Since 1960. Ed. David G. Gutiérrez. Columbia University Press: 2004 New York. US Census Bureau. 2004 American Community Survey: New Orleans, Louisiana Data Profile. Accessed October 18, 2006. http://factfinder.census.gov/servlet/ADPTable?_bm=y&- qr_name=ACS_2004_EST_G00_DP3&-geo_id=16000US2255000&-ds_name=&- redoLog=false Yap, L. (1976). Rural-Urban Migration and Urban Underemployment in Brazil. Journal of Development Economics 3. 19 (6). 227-243.