Embed Size (px)
DESCRIPTION
business
Citation preview

2013 Number 4

Copyright © 2013 McKinsey & Company. All rights reserved.
Published since 1964 by McKinsey & Company, 55 East 52nd Street, New York, New York 10022.
Cover artwork by FOREAL™ (weareforeal.com)
McKinsey Quarterly meets the Forest Steward- ship Council (FSC) chain- of-custody standards.
The paper used in the Quarterly is certified as being produced in an environ- mentally responsible, socially beneficial, and economi- cally viable way.
Printed in the United States of America.

2013 Number 4
This Quarter
The essence of strategy is easy to define: it involves making wise choices about where and how to compete, so companies can counteract the competitive forces that inexorably deplete profits. By this definition, perhaps 3 to 5 percent of the world’s companies have extraordinarily successful strategies, and a similarly small proportion have colossally poor ones. A great many operate in the dynamic middle ground, neither quite mastering, nor yet being overcome by, the market forces swirling around them.
That has always been the case, but this reality is brought into sharp relief by a new analysis detailing the economic profit—what’s left after subtracting the cost of a company’s capital from its net operating profit—that nearly 3,000 global companies have created or destroyed. We also learned through this research that companies in a favor- able industry are three times more likely than others to generate a market-beating economic profit. But a below-average company in a good industry appears no more likely to win than an above-average company in a bad one.
The crucial question, of course, is how to be one of those good companies that create and execute market-beating strategies. Part of the answer, we believe, lies in following a strategy-formulation process that’s simultaneously rigorous—unlikely to ignore important issues—yet embraces the sort of ambiguity that allows executives to identify and harness valuable strategic insights. “Mastering the building blocks of strategy” proposes a way to strike the right balance. Another issue to think about in this context is regulatory strategy, a potentially vast source of value as companies work more closely with

governments to influence the ground rules of industries. “Organiz- ing the government-affairs function for impact” explains the principles that leading businesses adopt to get the best out of it.
But strategic insight and more agile organizational structures, on their own, aren’t enough to win. Research we unveiled 18 months ago suggested that companies exhibit a remarkable inertia in allocating resources across their business units from year to year. For the most part, they seem incapable of shifting scarce resources to put them in line with their strategies. We have now extended our analysis through the recent economic downturn, demonstrating that resource “activism” yields even greater returns in such periods. We also show that new CEOs who make significant resource moves early in their tenure outperform those who are slower to make changes—and tend to keep their jobs longer. To help leaders revamp their companies, we outline a set of practical adjustments to traditional corporate processes. In addition, we asked two prominent CEOs who have made major strategic shifts to share their stories. Jean-Pierre Clamadieu of global chemical producer Solvay describes its dramatic reorientation toward higher-growth markets. Randall Hogan of US-based Pentair relates how the manufacturing company shifted its business portfolio through acquisitions and divestitures.
Taken together, the ideas presented here for understanding the dynamics of strategic value creation, constructing powerful strategies, and then mobilizing resources to pursue them represent a state-of-the-art tour for senior executives. Every executive team could benefit from exploring how it might deploy these ideas to ensure that its strategy beats the odds.
Sven SmitDirector, Amsterdam office
Stephen HallDirector, London office

The strategic yardstick you can’t afford to ignore
Rethinking where to compete: An interview with the CEO of Pentair
Mastering the building blocks of strategy
24
4836
Chris Bradley, Angus Dawson, and Sven Smit
Chris Bradley, Angus Dawson, and Antoine Montard
A systematic scan of the economic-profit performance of nearly 3,000 global companies yields fresh insight about where and how to compete.
The US manufacturer has reinvented itself by switching out of power tools and into water and other resource-based businesses.
Increase your likelihood of developing effective strategies through an approach that’s thorough, action-oriented, and comfortable with debate and ambiguity.
Never let a good crisis go to waste
Avoiding the quicksand: Ten techniques for more agile corporate resource allocation
How quickly should a new CEO shift corporate resources?
56 60
64
Mladen Fruk, Stephen Hall, and Devesh Mittal
Stephen Hall and Conor Kehoe
New research shows that actively reallocating corporate resources is even more important in a downturn than it is in good times.
These tested ideas can help organizations overcome inertia and implement their strategies more effectively.
Moving early to reconfigure the business portfolio and top-management team improves corporate performance and the odds for a lengthy tenure.
Committing to strategy that beats the odds
Searching for strategy that beats the odds
Tilting the global balance: An interview with the CEO of Solvay
69
The Belgian company is reshaping its portfolio to focus harder on fast-growing markets.
Michael Birshan, Marja Engel, and Olivier Sibony
On the cover

Mobilizing your C-suite for big-data analytics
Measuring the full impact of digital capital
76
88
Brad Brown, David Court, and Paul Willmott
Jacques Bughin and James Manyika
Leadership-capacity constraints are undermining many companies’ efforts. New management structures, roles, and divisions of labor can all be part of the solution.
Although largely uncounted, intangible digital assets may hold an important key to understanding competition and growth in the Internet era.
Features
Doing well by doing good: A leader’s guide
Breaking the US growth impasse
100
112
Mary Brainerd, Jim Campbell, and Richard Davis
Susan Lund, James Manyika, and Scott Nyquist
Addressing community problems increasingly requires cooperation among the private, public, and not-for-profit sectors. Here, three executives explain how a civic alliance in America’s Minneapolis–Saint Paul region may point toward an operating model.
Business leaders can give the US economy a shot in the arm by stepping out of their comfort zones, pursuing innovative partnerships, and creating industry standards.

Building the social enterprise
Michael Chui, Martin Dewhurst, and Lindsay Pollak
By following a few simple principles, leaders can realize the vast potential of social technologies to engage employees and transform organizations.
New research shows there’s a surprising gap between the brand messages that suppliers offer to customers and what their customers really want to know.
8
The shifting global corporate landscape
Richard Dobbs, Jaana Remes, and Sven Smit
Cities in emerging markets will probably host many of the world’s major new companies—and become thriving hubs for capital, innovation, and talent.
16
Leading Edge
Industry dynamics
Retail: Bringing the voice of the customer into the factory
Airlines: The economics underlying airline competition
A quick look at research and analysis from selected sectors
18
20
How B2B companies talk past their customers
Tjark Freundt, Philipp Hillenbrand, and Sascha Lehmann
12
Picture ThisLighting up the last frontier
Departments
120 Extra PointDid your industry beat the market?
140
Managing the people side of risk
Three steps to a more productive earnings call
Alexis Krivkovich and Cindy Levy
Companies can create a powerful risk culture without turning the organization upside down.
Traditional earnings calls are painfully unhelpful. Here’s how companies and investors alike can get more out of them.
Organizing the government-affairs function for impact
Reinier Musters, Ellora-Julie Parekh, and Surya Ramkumar
The value at stake from government and regulatory intervention is huge. Companies that approach external engagement in a disciplined way capture more of it.
133
123
129
Applied Insight
Werner Rehm

McKinsey Quarterly editorsLuke CollinsFrank ComesTim Dickson Thomas FlemingAllen P. Webb, Editor in chief
Contributing editorsMichael T. BorrusoLisa RenaudDennis Swinford
Design and data visualizationElliot Cravitz, Design directorJake Godziejewicz, DesignerMary Reddy, Data visualization editorDelilah Zak, Associate design director
Editorial operationsNicole Adams, Managing editorAndrew Cha, Web production administratorRoger Draper, Copy chiefDrew Holzfeind, Assistant managing editorHolly Lawson, Editorial assistant
DistributionDevin A. Brown, Social media and syndicationDebra Petritsch, Logistics
McKinsey Quarterly ChinaGlenn Leibowitz, EditorLin Lin, Managing editorRebecca Zhang, Assistant managing editor
How to change your mailing address McKinsey clients and other [email protected]
McKinsey [email protected]
How to contact the QuarterlyE-mail customer service [email protected]
To request permission to republish an [email protected]
To submit an article proposal [email protected]
Web sitesmckinsey.com/insightsmckinsey.com/quarterlymckinseychina.com/insights-publications
Download the McKinsey Insights app on the Apple App Storehttp://bit.ly/McKInsightsApp
Download digital editions of McKinsey Quarterly From our Web site: http://www.mckinsey.com/insights/mckinsey_quarterly/digital_newsstand
From Zinio: http://bit.ly/mckinseydigitalissue
Audio and video podcasts on iTunes audio: http://bit.ly/mckinseyitunesaudio video: http://bit.ly/mckinseyitunesvideo
Follow us on Twitter@McKQuarterly
Join the McKinsey Quarterly community on Facebook facebook.com/mckinseyquarterly
Watch us on YouTubeyoutube.com/mckinsey
Digital offerings

Our latest thinking. Anytime. Anywhere. Stay up-to-date
Explore the latest insights
from McKinsey Quarterly,
the McKinsey Global
Institute, and our industry
and functional practices—
all delivered seamlessly to
your iPad or iPad mini.
Stay informed
Broaden and deepen
your perspective with
articles, reports, and
videos spanning the full
spectrum of McKinsey’s
knowledge. Create a
personalized reading list
that is accessible offline
and be notified when new
content is published.
Stay connected
Instantly share articles
via e-mail; post them to
social networks such
as Facebook, LinkedIn,
and Twitter; and connect
directly with McKinsey.
Introducing the
McKinsey Insights app for iPad®
Available on iPad running iOS 5.1.1 or higher

8
Why do so few companies capture the
full value of social technologies? There’s
no doubt organizations have begun
to realize significant value from largely
external uses of social.1 Yet internal
applications have barely begun to tap
their full potential, even though about
two-thirds of social’s estimated economic
value stems from improved collaboration
and communication within enterprises.2
Although more than 80 percent of
executives say their companies deploy
social technologies,3 few have figured
out how to use them in ways that could
have a large-scale, replicable, and
measurable impact at an enterprise level.
Michael Chui, Martin Dewhurst, and Lindsay Pollak
By following a few simple principles, leaders can realize the vast potential of social technologies to engage employees and transform organizations.
Building the social enterprise
Just over a quarter of executives say that
their companies have significantly
incorporated social technologies into
the day-to-day work flow by, for
example, adapting internal structures,
systems, processes, and practices
to the greater connectedness they enable.
Maximizing the odds of successful
integration by coupling them with a
robust organizational-change program
is generally an afterthought, at best.
Companies are missing a potentially
huge prize. The McKinsey Global
Institute last year estimated that $900 bil-
lion to $1.3 trillion in annual value could
Leading EdgeResearch, trends, and emerging thinking
8 Building the social
enterprise
18 Retail
Industry dynamics
12 How B2B
companies talk
past their customers
16 The shifting
global corporate
landscape
20 Airlines
16 The shifting
global corporate
landscape
9
be unlocked in just four sectors by
products and services that enable social
interactions in the digital realm. That’s
not easy to do, but a large part of
the problem is that many companies,
viewing social technologies as yet
another tool to be implemented rather
than as an enabler of organizational
transformation, fail to identify the
specific organizational problems social
technologies can solve.
These companies find that mind-sets
are hard to shift, whether they’re trying
to persuade employees to use social
technologies rather than e-mail or to
evolve into an environment where
information sharing is standard. Often,
leaders think social technologies can
be left to IT or marketing, while others
are simply intimidated by possible risks.
And many are so focused on the tech-
nologies themselves that their ability to
empower a dynamic, integrated
business- and cultural-change program
that drives productivity, innovation,
and collaboration in core business pro-
cesses is largely ignored.
So what should be done? We see four
principles that should guide the
implementation of social technologies.
Add value, not complexity
Social technologies add the most value
when they become central to the
organization and complement (or, ideally,
substitute for) existing processes.
They shouldn’t be distracting “extras”—
they should be embedded into the day-
to-day work flow. Consider the
experience of The MITRE Corporation,
a not-for-profit organization that
provides IT, research-and-development,
and systems-engineering expertise
to the US government. When the com-
pany identified an urgent need for
employees to collaborate more easily
with colleagues and external partners,
it used open-source social-networking
software to build and customize its
own social platform, called Handshake.
The platform is secure, invitation only,
and integrated with MITRE’s collaboration-
and knowledge-management tools,
so staff can start using the tool and make
it part of their daily work seamlessly.
Provide essential organizational support
No particular social technology can
transform organizations on its own. Com-
panies must define their objective,
select a technology, and then consider
the additional elements of organi-
zational change required to support it.
That might mean everything from
role modeling to fostering understanding
and conviction, building capabilities,
and aligning systems and structures. We
call this approach the influence model—
it encourages mind-set and behavioral
shifts that assist organizational
transformation.
When Canadian financial-services
company TD Bank Group launched an
internal social-media network, using

10 2013 Number 4
IBM’s Connections platform, for
example, individuals were designated
as “Connections Geniuses” to spur its
adoption. This group helped colleagues
learn how to use the platform and
evangelized for its ability to improve day-
to-day work, thus making the potential
impact more relevant to individual users.
The support that’s required to maxi-
mize the odds that social technologies
will be implemented successfully
should obviously be customized to the
needs and culture of individual
organizations. But make no mistake—
support is essential.
Experiment and learn
Top-down implementation directives
don’t work for social technologies—and
in fact directly contradict their very
purpose. Organizations should adopt
approaches that emphasize testing
and learning; any lack of impact must be
viewed not as a failure but as a lesson
learned. Developing an atmosphere of
experimentation enables organizational
learning and keeps alive the possibility
that technologies may have unexpected
successes.
The mantra “Think big, start small, show
impact” guided TD’s social-platform
launch for its 85,000 employees around
the world. A small pilot program
launched in 2011 allowed the company
to manage technology risks and thought-
fully identify communities for the plat-
form. As examples of success became
clear, TD leveraged its Geniuses to
help it scale up the effort. This process
of testing, learning, and thoughtful
growth was instrumental in expanding
the platform, which now has thousands
of communities, blogs, and wikis that
help colleagues find relevant knowledge
and skills quickly and easily.
Track impact and evolve metrics
The head of social media at global
shipping company Maersk Line,
Jonathan Wichmann, discovered some
14,000 images in its photographic
archive during his first week at work.4
Recognizing an opportunity to
share the company’s rich history and
engage both employees and outsiders,
Maersk Line launched a low-cost,
experimental social-media campaign.
No metrics were attached; at this
stage, the company was unsure of what
to measure.
After the initiative took off—it’s currently
delivering more than 170,000 unique
social interactions a month and has
doubled the number of the company’s
job applicants—appropriate metrics
were developed. What began as
an outward-facing effort is now driving
performance internally: Maersk Line
executives now seek to track social
media’s impact on everything from
persuading recruits that they should join
the company to aiding innovation and
the gathering of customer insights. This
is the best approach to metrics; while
it’s important to be open minded about
social initiatives, and not always possible

11Leading Edge
to have robust metrics from the start,
it’s critical to put rigorous ones in place
once you find that something clearly
adds value.
Employees, customers, external stake-
holders, and future talent are all embracing
social technologies. While the true
impact of building them into the culture,
structure, and work flow of organi-
zations remains to be seen, we know that
companies adapting to a more open,
sharing, and flexible world stand to create
tremendous value. They could also
be the pioneers of new, more nimble
and entrepreneurial operating models
that will change business as we know
it. In that sense, understanding social
media is now a critical element of
every executive’s tool kit.
1 Roxane Divol, David Edelman, and Hugo Sarrazin, “Demystifying social media,” McKinsey Quarterly, 2012 Number 2, mckinsey.com.
2 See the full McKinsey Global Institute report, The social economy: Unlocking value and productivity through social technologies, July 2012, mckinsey.com.
3 See “Evolution of the networked enterprise: McKinsey Global Survey results,” March 2013, mckinsey.com.
4 For more on Maersk Line’s social-media initiative, see Jonathan Wichmann, interview by David Edelman, “Being B2B social: A conversation with Maersk Line’s head of social media,” May 2013, mckinsey.com.
The authors wish to acknowledge the
contributions of Roxane Divol and James
Manyika to the development of this article.
Michael Chui is a principal of the
McKinsey Global Institute and is based in
McKinsey’s San Francisco office;
Martin Dewhurst is a director in the
London office; and Lindsay Pollak is a
consultant in the Silicon Valley office.
Copyright © 2013 McKinsey & Company. All rights reserved.

12 2013 Number 4
Although the digital-marketing
revolution’s clearest ramifications and
earliest impact may have come in
the consumer arena, it’s also roiling the
world of business-to-business (B2B)
brand building. Business customers, like
consumers, engage with companies
through search, online communities, and
Web-based video, so these are
potentially powerful tools for delivering
B2B brand messages and amplifying
their impact. Our research suggests a
potential stumbling block, though:
a marked apparent divergence between
the core messages companies
communicate about their brands and
the characteristics their customers
value most.
In our research, we examined publicly
available documents of Fortune 500
and DAX 30 companies to develop a
list of 13 themes and topic areas that
companies use to position their brands.
These were broad ranging, from
the extremely practical (low prices) to
the more elevated (corporate social
responsibility). We then selected the top
90 global B2B companies by market
capitalization across six surveyed
sectors.1 We reviewed the public docu-
ments of the companies to verify
how many of their brand messages were
clearly linked to the 13 themes that
emerged from the broader sample (3 of
them didn’t appear among the 90 com-
panies). Then we assessed the degree
to which the companies aligned
their brand messages with the remaining
10 themes.
To discover how customers viewed
these same themes, we surveyed more
than 700 global executives2 across the
six sectors, asking how important each
theme was to the way they evaluated
the brand strengths of their primary and
secondary suppliers. We used multiple
regression analysis to determine the
extent to which a theme influenced the
correlation.
The results were revealing (exhibit).
Themes such as social responsibility,
sustainability, and global reach, which
many B2B companies cast in a leading
role for brand imaging, appeared
to have a minimal influence on buyers’
Tjark Freundt, Philipp Hillenbrand, and Sascha Lehmann
New research shows there’s a surprising gap between the brand messages that suppliers offer to customers and what their customers really want to know.
How B2B companies talk past their customers

13Leading Edge
1 Correlations statistically significant at p <0.1.2Top 90 companies from 6 sectors by 2012 market capitalization.3Coefficient’s explanatory power on perceived brand strength expressed as a percentage; analysis based on 704 global executives’ ratings of the brand strength of their primary and secondary suppliers; figures do not sum to 100%, because of coefficients that are not statistically significant.
Source: 2012 McKinsey B2B branding survey of 1,408 global executives; McKinsey analysis
Q4 2013BrandingExhibit 1 of 1
The themes that many B2B companies consider important for brand imaging appear to have minimal influence on buyers’ perceptions of brand strength.
1
2
3
4
5
6
7
8
9
10
12
13
11
Correlation ranking1
Has low prices
Is a leader in its field
Fits in well with my values and beliefs
Has a high level of specialist expertise
Acts responsibly across its supply chain
Cares about honest, open dialogue with its customers and society
Brand theme
Provides a broad product portfolio
Is a driver of innovation
Role-models corporate social responsibility in its work
Shapes the direction of the market
Has global reach
Promotes diversity and equal opportunity
Promotes and practices sustainability in its products or services
0
0
0
4
36
43
68
86
72
79
64
84
19
Top global B2B companies’ stated affiliation with theme, %2
10
8
7
15
11
16
17
–4
Not statistically significant
Theme’s contribution to perceived brand strength, %3
Exhibit

14 2013 Number 4
perceptions of brand strength. The
inverse was true, as well: two of the most
important themes for customer percep-
tions of brand strength—effective supply-
chain management and specialist
market knowledge—were among those
least mentioned by B2B suppliers.
Honest and open dialogue, which cus-
tomers considered most important,
was one of the three themes not
emphasized at all by the 90 companies
in our sample. In addition to these
disconnects, our analysis showed a
surprising similarity among the brand
themes that leading B2B companies
emphasized, suggesting a tendency to
follow the herd rather than create
strongly differentiated brand messages.3
Here are three questions whose
answers may point to opportunities for
improvement.
Are you telling the same story as your competitors?
Given the prevalence of similar messages,
this is an important checkpoint for
many companies. For example, if both
you and your rivals claim that your (and
their) products derive from renewable
sources, this probably won’t move the
needle when customers consider your
brand. Contrast that with IBM’s Smarter
Planet branding effort, which tells a
story emphasizing the company’s special
capabilities in the digital economy and
guides not just external communications
but also product development and
other forms of employee engagement.
Does your sales force say it is facing headwinds?
Even in the digital era, our surveys show
that personal interactions with sales
reps remain the most influential factor—
across touch points—for B2B cus-
tomers.4 That makes salespeople a great
source of information about the degree
to which customers see your products
as differentiated or worth a premium.
Have an honest dialogue with your sales
staff. If you hear about consistent
pushback on pricing or an inability to
articulate a compelling argument for
the value of your products, you’ve got a
problem. It could be your product or
service, of course. But it also may involve
disconnects between what your cus-
tomers value and the messages you send
them in your broader (digital and more
traditional) marketing activities. Use
your sales force to inform these strategies.
Leading companies make extensive
use of frontline interaction and market
research to stay in tune with customer
needs and perceptions. For example,
Hilti, a maker of professional construc-
tion tools, has its salespeople do
double duty as distributors and hands-
on market researchers at customer
construction sites.
Do you deliver your brand in a consistent way?
Especially at a time when opportunities
to deliver brand messages are
proliferating as never before, consis-
tency is crucial. If anything, today’s

15Leading Edge
increasingly fragmented environment
calls for a more disciplined communica-
tion of values and messages across a
wider range of channels, including
some quite traditional ones, for a longer
period of time. DHL’s rebranding effort
after its acquisition by Deutsche Post is
one example. More than a hundred
planes, tens of thousands of trucks,
and countless uniforms were repainted
or replaced to boost brand visibility.
Internal company-wide training was
designed to turn employees into brand
ambassadors, and a set of binding
rules for corporate identity and design
govern all campaigns and materials.
Don’t mistake consistency for inertia,
though: changes in the market
environment should influence brand-
messaging priorities. To stay abreast of
market shifts, American Express, for
example, created Open Forum, a virtual
platform that helps small-business
owners connect with the company and
with one another. Amex acts as an
adviser, helping its small- and midsize
enterprise customers understand
the constant variations in the retail
marketplace—and learning, in the
process, how it can best differentiate its
own offerings. Consistently gathering
information such as this and evolving
in response are valuable ways of closing
any gaps that may be opening up
between your brand messaging and your
customers’ needs.
The authors would like to acknowledge
the valuable contributions of Agnes Claye,
Blair Crawford, and Jeff Jacobs.
Tjark Freundt is a principal in
McKinsey’s Hamburg office, where Sascha
Lehmann is an associate principal;
Philipp Hillenbrand is a consultant in the
Düsseldorf office.
Copyright © 2013 McKinsey & Company. All rights reserved.
1 The selected companies were publicly traded, with dominant share deriving from B2B activities. These 90 companies (by 2012 market cap) compete in six sectors: banking and insurance; machines and components; utility services; IT-related products and services; chemicals, commodities, and basic materials; and telecommunications products and services. The survey questionnaire also included a seventh sector, logistics services, which had to be excluded from this analysis as a result of insufficient answers for brand-strength ratings.
2 Executives chosen for the survey, conducted in mid-2012, had a substantial influence on the choice of their companies’ suppliers.
3 In additional research, we found that companies with brands that survey respondents considered strong often had higher EBIT (earnings before interest and taxes) margins than those with weaker brands.
4 Face-to-face and phone contact with sales repre- sentatives ranked highest among B2B customers considering, evaluating, and purchasing products, as well as in product-loyalty decisions. This was true across all industries and regions in our sample.

Growth rates in emerging markets may recently have slowed, but their long-term potential to generate a rising share of global consumption and GDP remains extraordinary. Also on the way: a tidal wave of new companies, many of which could soon rank among the world’s corporate giants and profoundly alter competitive dynamics. New McKinsey Global Institute research suggests that the emerging world’s share of Fortune Global 500 companies, which stood at only 5 percent in 2000, is on course to jump up to more than 45 percent by 2025.1 The Greater China region should be the biggest gainer: in little more than a decade, it could be home to the headquarters of more large companies than the United States or Western Europe.2
Richard Dobbs, Jaana Remes, and Sven Smit
Cities in emerging markets will probably host many of the world’s major new companies—and become thriving hubs for capital, innovation, and talent.
The shifting global corporate landscape
16
In 2025, cities in emerging markets are expected to be home to almost 230 Fortune Global 500 companies—up from 24 in 2000.
Emerging markets’ total share
1 Africa, Eastern Europe and Central Asia, Latin America, Middle East, South Asia, and Southeast Asia. 2China, Hong Kong, Macau, and Taiwan.
Source: McKinsey Global Institute CompanyScope database (comprising companies with revenues exceeding $1 billion a year)
The Fortune Global 500 by headquarters location, number of companies
Q3 2013CitiesExhibit 1 of 2
5% 5% 5% 17% 46%
1980 1990 2000 2010 2025projected
Developed regions
Greater China2
477 477 476415
271
Emerging markets,1 excluding China
12
31
54120
109
2 122 1221
2013 Number 4
1 Projections are based on the McKinsey Global Institute CompanyScope database of large companies, which tracks the world’s 8,000 largest public and private companies, including state-owned enterprises—all with annual revenues of $1 billion or more.
2 Even though the number of large companies will rise more in emerging markets than in North America and Western Europe, these mature regions are expected to be home to almost 2,000 new large companies, an increase of over 40 percent.
For more on headquarters in emerging-market cities, see the full McKinsey Global Institute report Urban world: The shifting global business landscape, on mckinsey.com.

Richard Dobbs is a director of the McKinsey Global Institute (MGI) and is based
in McKinsey’s Seoul office; Jaana Remes is a principal at MGI and is based in the San
Francisco office; and Sven Smit is a director in the Amsterdam office.
Copyright © 2013 McKinsey & Company. All rights reserved.
Share of GDP, % of global total
Q3 2013CitiesExhibit 2 of 2
Greater China, in little more than a decade, could host more headquarters of large companies than the United States or Western Europe.
Greater China2
Western Europe
Average company size
$10 billion
$5 billion
Projected shift from 2010 to 2025
Share of large companies by headquarters location, % of global total
20102025
0 2 4 6 8 10 12 14 16 18 20 22 24 260
4
8
12
16
20
24
28United States
Africa and Middle East
Latin America
1 Other developed regions: Australasia, Northeast Asia, and Canada; other emerging regions: Eastern Europe and Central Asia, South Asia, and Southeast Asia. 2China, Hong Kong, Macau, and Taiwan.
Source: McKinsey Global Institute analysis
Other developed regions1
Other emerging regions1
17Leading EdgeLeading Edge
Global companies need to stay on top of this shift and all it portends:
New competitors. The most direct and obvious change is that large companies in emerging regions will increasingly move beyond their home markets and shape global economic competition through their investment and expansion decisions. Business leaders should prepare to compete not only for global customers but also for talent, capital, and natural resources. Much as Japanese and South Korean companies successfully challenged incumbent industry leaders in the West, new strategic threats and innovative products or services may appear on the horizon quite suddenly.
New customers. Global B2B companies will find a large and fast-growing base of corporate customers in the up-and-coming business hubs of the emerging world. The challenge will be to rethink sales networks to better serve the needs of these customers and learn how their executives make purchasing decisions.
New footprints. Global companies need to think hard about whether their physical footprints and organizational structures fit the changing environment. The traditional single-headquarters model may have to give way to new approaches, with secondary headquarters or important functional units located in new emerging-market hot spots. That will help global players keep abreast of market developments, respond to new approaches by competitors, and build pipelines to local talent.

18 2013 Number 4
Many companies are quite successful
at outsourcing their design and manu-
facturing to cut costs or fill gaps in
expertise. Yet it’s always a good idea to
examine these relationships closely,
since there may be opportunities to
sharpen product features and further
reduce costs. The private-label offer-
ings of retailers, for example—despite
producing margins that are typically
more than 20 percent better than those
of similar branded goods—sometimes
contain features and specifications that
customers don’t particularly value,
while lacking others they consider critical.
For example, one hardware retailer’s
private-label measuring tape had
a sturdier, heavier retraction coil than
those of competitive models. But
what customers really wanted, the
retailer found, was a smooth retraction
movement, not a strong coil. By getting
the supplier to use a lighter, smoother one,
the retailer reduced the product’s cost
and increased its value to customers.
Product teardowns have revealed
similar “design to value” opportunities
across many other product categories.1
We estimate that global retailers could
save at least $55 billion by pushing
contractors to rewrite product designs
and specifications—while maintain-
ing or improving consumer perceptions
(exhibit). Those savings opportunities
extend far beyond consumer packaged
goods, to include consumer electronics,
auto parts, office supplies, and home-
improvement products.
Dave Fedewa and Guillermo Lopez Velarde
Consumer-facing companies typically know more about their end customers than contract manufacturers do. Passing that knowledge along is good for everyone.
Bringing the voice of the customer into the factory
Industry dynamics
1 Our research uses proprietary data from 4,870 product teardowns. For additional insights, see Ananth Narayanan, Asutosh Padhi, and Jim Williams, “Designing products for value,” McKinsey Quarterly, 2012 Number 4, mckinsey.com.
Dave Fedewa is a principal in McKinsey’s
Atlanta office, where Guillermo Lopez
Velarde is a specialist.

19Leading Edge
Q4 2012Industry dynamics: Private label DTVExhibit 1 of 1
Savings on product COGS1
Savings on global scale, $ billion
Affected industries
Design-to-value opportunities across a number of consumer-facing industries suggest the potential for $55 billion or more in aggregate annual savings.
9–11%
10–15%
12–17%
21–26 21–31 13–19
Total potential savings = $55 billion to $76 billion
• Groceries• Pharmacies
• Discount stores• Consumer electronics• Auto parts
• Department stores• Home improvement• Office products
1 Cost of goods sold.
Source: Industry experts; McKinsey analysis
Copyright © 2013 McKinsey & Company. All rights reserved.

20 2013 Number 4
Over the past quarter century, low-
cost-carrier (LCC) airlines have made
strong inroads in a number of short-
haul markets while largely shying away
from the long-haul routes that gene-
rate over 90 percent of the mainline
network carriers’ operating profits.
A comparison of the cost structures for
short- and long-haul routes suggests
an explanation: input costs, such as
labor rates and administrative expenses—
a sizable share of the LCC cost
advantage on short-haul routes—are a
much smaller share of the average
cost per available-seat kilometer on
long-haul ones (exhibit). At the same
time, government taxes, fees, and sur-
charges account for around 80 per-
cent of the ticket price in some long-
haul markets—particularly in lower-
fare categories—also leaving the LCCs
with less maneuvering room to
stimulate demand.
LCCs can reap savings on long-haul
routes by squeezing more people onto
the same types of planes, though this
strategy is one that network carriers
could imitate if they believed the volume
would make up for lost margins from
replaced business- or first-class seats.
Given these realities, some LCCs are now
turning their attention to medium-haul
routes in Asia, where the economics are
more favorable.
Urs Binggeli, Alex Dichter, and Mathieu Weber
Budget carriers face difficult odds moving into the most profitable sector of the airline industry.
The economics underlying airline competition
Industry dynamics
Urs Binggeli is a senior expert in
McKinsey’s Zurich office, Alex Dichter
is a director in the Tokyo office,
and Mathieu Weber is a specialist in
the Luxembourg office.

21Leading Edge
Q3 2013Industry dynamics AirlinesExhibit 1 of 1
Low-cost carriers’ input-cost edge is larger for short-haul flights than for long-haul ones.
1 Seat counts based on announced configurations by carriers that fit the respective archetypes; Airbus A320: 180 seats for low-cost carrier compared with 168 for mainline carrier; Boeing 787-8: 291 seats for low-cost carrier compared with 247 for mainline carrier.
Share of cost per available-seat kilometer (CASK), %
Cost breakdown:
Short-haul flight
100% = CASK for mainline network carriers: 11.4¢
Airbus A320 on 1.5-hour flight1
Boeing 787-8 on 8-hour flight1
5
31
64
13
74
13
Long-haul flight
100% = CASK for mainline network carriers: 6.2¢
Savings for low-cost carriers in input costs—eg, onboard services, labor, administrative
Savings available from higher seat density for either kind of carrier
Fixed costs common to mainline and low-cost carriers
Copyright © 2013 McKinsey & Company. All rights reserved.

Illus
trat
ion
by F
OR
EA
L™

23
24The strategic yardstick you can’t afford to ignoreChris Bradley,
Angus Dawson,
and Sven Smit
Just as the real world has relatively few elites, a very small number of global businesses grab the bulk of the corporate spoils. Learn in this package what distinguishes leaders from laggards and how to formulate a winning strategy. Then read a CEO’s reflections on strategic reinvention.
36Mastering the building blocks of strategy Chris Bradley,
Angus Dawson,
and Antoine Montard
48Rethinking where to compete: An interview with the CEO of Pentair
24
At first blush, “beating the market” might sound like an expression better suited to investing or financial management than to busi- ness strategy. When you think about it, though, overcoming the profit- depleting effects of market forces is the essence of good strategy—what separates winners from losers, headline makers from also-rans.1 A focus on the presence, absence, or possibility of market-beating value creation should therefore help transform any discussion of strategy from something vague and conceptual into something specific and concrete.
While there are many indicators of market-beating strategies, in our experience economic profit (EP)—what’s left over after subtracting the cost of capital from net operating profit—is highly revealing. Using this lens, individual companies can take a hard-boiled look at the effectiveness of their strategies. Recently, we undertook a large- scale analysis of economic profit for nearly 3,000 large nonfinancial companies in McKinsey’s proprietary corporate-performance database.2 That effort enabled us to test some deeply held truths and distill generalizable lessons about what it takes to win consistently.
The strategic yardstick you can’t afford to ignore
A systematic scan of the economic-profit
performance of nearly 3,000 global
companies yields fresh insight about where
and how to compete.
Chris Bradley, Angus Dawson, and Sven Smit
1 For more, see Chris Bradley, Martin Hirt, and Sven Smit, “Have you tested your strategy lately?,” McKinsey Quarterly, 2011 Number 1, mckinsey.com.
2 For technical details on the calculation of economic profit, including its relationship with the key drivers of corporate value (ROIC and growth), see chapter six and appendix A of Marc Goedhart, Tim Koller, and David Wessels, Valuation: Measuring and Managing the Value of Companies, fifth edition, Hoboken, NJ: John Wiley & Sons, 2010.

2525
For example, we saw that the corporate world, like the world beyond it, has a relatively small number of elites and that, just as society grapples with the contemporary challenge of limited social mobility, many companies seem stuck in their strategic “class.” Escaping the gravity of the corporate middle class, indeed, requires busi- nesses to expand or reinvent themselves unusually rapidly, often in the context of an industry whose overall performance is improving.
This article focuses on eight analyses emerging from our economic-profit exercise.
Strategy is rife with inequality
Economic profit is distributed in a far from democratic way (Exhibit 1). The 60 percent of companies in the middle three quintiles generate
Exhibit 1
Q4 2013Beat the marketExhibit 1 of 8
Distribution of economic profit
1 Actual sample = 2,875; excludes outliers and companies with insufficient data to calculate average economic profit for given period. Outliers are companies with economic profit >$10 billion (ie, Apple, BHP Billiton, China Mobile, Exxon Mobil, Gazprom, and Microsoft) and those with <–$5 billion.
2Defined as: I = average economic profit >$262 million; II = $262 million to $49 million; III = $49 million to –$24 million; IV = –$24 million to –$160 million; V = below –$160 million.
1,180
677,298
121
69,724
10 –80 –709
5,704 –45,991 –410,963
I II III IV V
Average = 102
Coca-Cola
Novo Nordisk
CostcoBaidu
7,500
10,000
5,000
–5,000
2,500
–2,500
0
Average economic profit for top 3,000 companies by FY2011 revenues, (excluding outliers),1 2007–11, $ million
Average
Quintiles2
Total
Total of 3 middle quintiles = $29,437 million
By quintile

26 2013 Number 4
a little over $29 billion in economic profit, or around $17 million each—only 10 percent of the total pie. This share is dwarfed by the $677 billion generated in the top quintile, where each company creates almost 70 times more economic profit than do companies in the middle three, and by the nearly $411 billion destroyed in the bottom quintile.
For companies in the majority group, at least, market forces appear to be a very powerful constraint to creating value.
What separates the corporate classes?
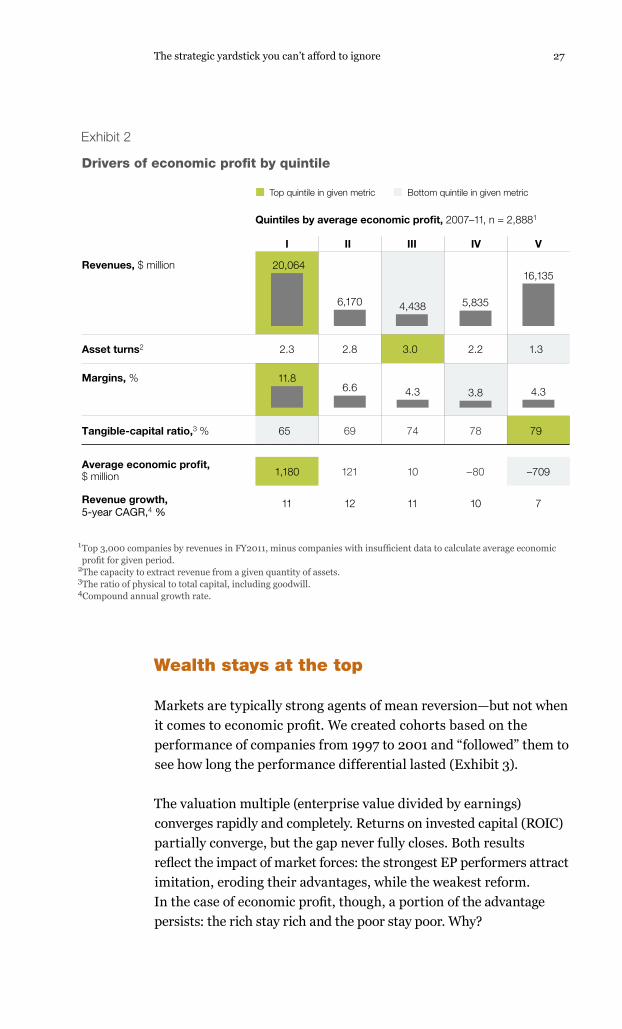
Economic profit has four components: revenues, margins, asset turns, and the tangible-capital ratio (TCR). Revenues and margins are familiar enough. Asset turns, sometimes described as asset leverage, measure the capacity to extract revenue from a given quantity of assets. TCR is the ratio of physical to total capital, including goodwill3 (the more M&A a company does, and the higher the pre- mium it pays over book value, the lower its TCR). Every company has a “fingerprint,” hinting at its value formula, across these drivers. Exhibit 2 decomposes the four determinants of value by quintile.
Size clearly matters: both the biggest creators and the biggest destroyers of economic profit are large. Low turns are the hallmark of the bottom quintile, which includes capital-intensive industries, such as airlines, electric utilities, and railroads. High margins clearly differentiate the top class of EP outperformers. Somewhat counterintuitively, however, the weakest EP performers have the best TCR and the strongest the worst. For top companies routinely engaged in M&A, the added cost of goodwill is apparently more than recouped in profitable scale.
Finally, it’s worth noting that the average company in the first four quintiles grows by double-digit rates a year—a compelling fact in its own right. Bottom-quintile companies grow one-third more slowly. This compounds their asset-intensity problem, as higher revenues don’t offset fixed investment.
3 There is, mathematically, a fifth dimension of economic value: funding. But the weight of evidence suggests that companies cannot directly influence it. For the purposes of this analysis, we use a global average cost of capital of 9 percent.
27
Wealth stays at the top
Markets are typically strong agents of mean reversion—but not when it comes to economic profit. We created cohorts based on the performance of companies from 1997 to 2001 and “followed” them to see how long the performance differential lasted (Exhibit 3).
The valuation multiple (enterprise value divided by earnings) converges rapidly and completely. Returns on invested capital (ROIC) partially converge, but the gap never fully closes. Both results reflect the impact of market forces: the strongest EP performers attract imitation, eroding their advantages, while the weakest reform. In the case of economic profit, though, a portion of the advantage persists: the rich stay rich and the poor stay poor. Why?
The strategic yardstick you can’t afford to ignoreQ4 2013Beat the marketExhibit 2 of 8
Drivers of economic profit by quintile
1 Top 3,000 companies by revenues in FY2011, minus companies with insufficient data to calculate average economic profit for given period.
2The capacity to extract revenue from a given quantity of assets.3The ratio of physical to total capital, including goodwill.4Compound annual growth rate.
Top quintile in given metric Bottom quintile in given metric
20,064
6,170 4,438 5,835
16,135
121 10 –80 –709
11.86.6 4.3 3.8 4.3
I II III IV V
11 12 11 10 7
2.3 2.8 3.0 2.2 1.3
7965 69 74 78
1,180
Quintiles by average economic profit, 2007–11, n = 2,8881
Revenues, $ million
Average economic profit, $ million
Revenue growth, 5-year CAGR,4 %
Margins, %
Tangible-capital ratio,3 %
Asset turns2
Exhibit 2

28 2013 Number 4
To the victors . . . the capital
How does the top cohort maintain its EP outperformance? An important clue lurks in Exhibit 4, which shows how top-quintile companies offset the impact of declining ROIC by attracting a disproportionate share of investment. Two opposing forces are at work here. ROIC convergence reduces the gap between the top and bottom quintiles by $409 million, while diverging capital flows increase the gap by $593 million. In fact, companies in the top quintile in 1997–2001 invested 2.6 times more fresh capital than bottom-quintile businesses did over the subsequent decade. So at least on average, companies in the elite class stay ahead, mostly because they get bigger.
The economic mobility of companies
Exhibit 5 shows the likelihood that companies will change class over a subsequent decade. The force of gravity is particularly strong in the three middle quintiles: 79 percent of the companies that start
Q4 2013Beat the marketExhibit 3 of 8
Three speeds of reversion to the mean
1 Top 3,000 companies by FY2011 revenues, minus companies with insufficient data to consistently calculate the 3 metrics for given period.
2Net enterprise value (NEV) divided by net operating profit minus adjusted taxes (NOPLAT).
1997 2000 2004 2008 2011
70
80
60
20
10
0
50
30
40
Cohort average based on companies’ quintile in 1997–2001, n = 2,1601
Rapid and close convergence
Valuation multiple,2 times Total return on invested capital, % Economic profit, $ million
Persistent gap after initial convergence
Low indication of convergence
Quintile I (top) Quintiles II, III, IV Quintile V (bottom)
1997 2000 2004 2008 2011
30
20
10
01997 2000 2004 2008 2011
1,000
–1,000
500
–500
0
Exhibit 3

29
there remain ten years later. In the top and bottom classes, a small majority of companies stay at their station.
Most strikingly, only 11 percent of companies in the middle make the leap to the top league. But companies at the top cannot rest on their laurels, because almost half drop out, and one in eight slides all the way to the bottom.
To find out more about upward mobility, we looked closely at the 37 companies that started in the middle quintile in the 1997–2001 period but rose to the top over the subsequent one. This breakout group seemingly improved its performance miraculously, increasing revenues by 21 percent and adding 18 percentage points to ROIC.
The strategic yardstick you can’t afford to ignore
Q4 2013Beat the marketExhibit 4 of 8
Shift in economic profit caused by changes in return on invested capital (ROIC) and invested capital (IC), n = 864,1 $ million
Quintile I
Quintile V
9%
4%
Starting quintile2 in 1997–2001
Why economic profit doesn’t converge
1 Actual sample = 2,160; for each quintile = 432; based on top 3,000 companies by FY2011 revenues, minus companies with insufficient data for longitudinal analysis over given period. Figures may not sum to total, because of rounding.
2Middle 3 quintiles showed no significant movement. Quintiles based on rankings for economic-profit generation from 1997 to 2001, averaged and held as a fixed cohort. Economic profit and total invested capital provided as total of cohort (not average).
3Compound annual growth rate from earlier time period (1997–2001) to later one (2007–11).
Revenue growth, CAGR
over time period3
377
–100
+309–108
+485
–296
762
Impact on EP of change in ROIC
Impact on EP of change in IC
Economicprofit, 2007–11
+ + =Economicprofit (EP), 1997–2001
–498
Exhibit 4

30 2013 Number 4
Something very special is needed to achieve results like these and escape the middle. So what’s the secret? Are these “social climbers” hauling themselves up the ladder primarily through their own efforts, or are wider industry forces at work?
Riding the megatrends
Of the 37 companies that started in the middle quintile and moved to the top, nearly 90 percent compete in industries that improved their economic-profit ranking (Exhibit 6). A rising tide helped lift these boats: the wireless-telecommunications-services industry, for example, pulled middling players to a conspicuously higher rank. Its average EP was 112th out of the 128 in our sample in 1997–2001, but by 2007–11 it had jumped up 102 spots, to 10th place. Two of our 37 big movers were wireless players.
On average, the 37 breakout companies were in industries that jumped up 39 places on the economic-profit league table. Only four came from industries with a flat or declining economic-profit rank. Overall, 75 percent of the increased economic profit of the
Q4 2013Beat the marketExhibit 5 of 8
Class mobility in economic profit
1 Actual sample = 2,240; based on top 3,000 companies by FY2011 revenues, minus companies with insufficient data for mobility analysis over given period. Quintiles based on rankings for economic-profit generation for 1997–2001, averaged and held as a fixed cohort.
Quintile ranking: 2007–11 compared with 1997–20011
54
46
Quintile I
79
1011
Quintiles II, III, IV
100% = 448 1,344 448
55
45
Quintile V
Moved up to Quintile I
Moved up from bottom quintile
Stayed within the middle quintiles
Stayed in the top quintile
% of companies that . . .
Stayed in the bottom quintile
Moved down from top quintile Moved down
to Quintile V
Exhibit 5

31
37 companies came from improvements in their markets or industries. The lesson is clear: riding on the coattails of an industry- moving trend is almost essential to escaping the middle class.
The more winners, the more losers
Much as we mapped companies by the economic value they create, so too we found that industries follow the same pattern of haves, have-nots, and a big, muddy middle (as shown by the S line in Exhibit 7).
The strategic yardstick you can’t afford to ignoreQ4 2013Beat the marketExhibit 6 of 8
Contribution of industry re-ranking to economic mobility
1 Ranking of 128 industries by average industry economic profit; industries with fewer than 10 breakout companies default to next level of industry classification.
Of the 37 companies that rose from Quintile III to Quintile I, nearly 90 percent were in industries that moved up in economic-profit (EP) ranking.
Industries lagging
Industries making big moves
Industries making moderate moves
251 11331
Number of companies
23111212111
1111
Wireless telecommunications services (+102)Diversified metals and mining (+96)Heavy electrical equipment (+64) Diversified chemicals (+59)Fertilizers and agricultural chemicals (+55)Automobile manufacturers (+51)Construction and farm machinery, heavy trucks (+41)Cable and satellite (+40)
Industries by change in EP ranking,1 actual shift in parentheses, 1997–2001 to 2007–11
Coal and consumable fuels (+33)Steel (+33)Health-care services (+18)Oil and gas equipment and services (+17)Industrial gases (+16)Construction and engineering (+14)Industrial machinery (+14)Biotechnology (+13)Semiconductor equipment (+10)Commodity chemicals (+6)Communications equipment (+4)
Research and consulting services (0)Electric utilities (–2)Auto parts and equipment (–24)Construction materials (–27)
46% of companies
43% of companies
11% of companies
Exhibit 6

32 2013 Number 4
Interestingly, though, the variation between companies is bigger at the top and the bottom, as indicated by the gap between the 25th- and 75th-percentile performers in the industry. In the best and worst industries, big winners and big losers have a big impact on total performance—so the graph looks like a tilted hourglass. The link between the performance of industries and companies, in other words, is more complex than meets the eye: besides facilitating
Q4 2013Beat the marketExhibit 7 of 8
Distribution of company economic profit within industry
Industry average
75th25th (bottom)
By EP percentile2
Market average (102)
Integrated oil and gas (39)
Pharmaceuticals (40)
Communications equipment (18)
Wireless telecom services (45)
Diversified metals and mining (46)
Top 5 industries (no. of companies)
Multi-utilities3 (42)
Independent power producers and energy traders (30)
Railroads (26)
Electric utilities (102)
Airlines (45)
Bottom 5 industries (no. of companies)
Strong industries
Weak industries
–1,000 –500 0 1,000 1,500500 2,000 2,500 3,000 3,500 6,0004,000
1 Top 3,000 companies by revenues in FY2011, minus companies with insufficient data to calculate average economic profit for given period. 128 industries analyzed; those with fewer than 3 companies default to next level of industry classification.
2Analysis based on the bottom 25th and top 75th percentiles illustrates the dispersion of a highly skewed distribution (eg, in some cases, average economic profit is in the top quartile).
3Utilities offering more than 1 service―eg, telephony, cable television, and Internet services.
Companies’ average economic profit (EP), 2007–11, n = 2,888,1 $ million
Exhibit 7

33
mobility, better performance by industries correlates with higher variance among the companies in them.
Of course, on average it is better to be in good industries, whose companies are three times more likely than others to generate a market-beating economic profit. But a below-average company in a good industry appears no more likely to win than an above- average company in a bad one. Warren Buffett once famously remarked,
“With few exceptions, when a manager with a reputation for bril- liance tackles a business with a reputation for poor fundamental eco- nomics, it is the reputation of the business that remains intact.” But our research suggests that he is only partly right.
Why do you make money?
So how do we untangle the forces of market selection versus company effects in explaining performance? How much does the neighbor- hood determine a company’s economic fate? The question is funda- mental because of the widespread confusion between performance
The strategic yardstick you can’t afford to ignore
Q4 2013Beat the marketExhibit 8 of 8
Industry vs company effect by quintiles
Share of contribution to company performance, 2007–11, n = 2,8881
Company effect2
Economic-profit quintiles
Average across all quintiles4
100%
Industry effect3 33
67
I
50
50
II
54
46
III
51
49
IV
38
62
40
60
V
1 Top 3,000 companies by revenues in FY2011, minus companies with insufficient data to calculate average economic profit for given period. 128 industries analyzed; those with fewer than 3 companies default to next level of industry classification.
2Defined as difference between company’s economic profit and its industry’s average economic profit.3Defined as difference between an industry’s average economic profit and the market average.4Weighted by absolute contribution to economic profit.
Exhibit 8

34 2013 Number 4
and capability (see “Mastering the building blocks of strategy,” on page 36).
At a granularity level of 128 global industries, we can explain 40 percent of a company’s economic profit by the industry in which it competes (Exhibit 8). We make this calculation from simple but powerful math by adding the three layers of the company’s EP: the market’s average EP, plus the difference between the average EP of the company’s industry peers and the market average (the industry effect), plus the difference between the company’s EP and the industry-average EP (the company effect). The industry’s contribution is smaller in the top and bottom quintiles—idiosyncratic factors explain more of the performance differences here.
The remaining 60 percent (the company effect) represents other drivers of value. These could be attributable, first, to a company’s more granular choices about market selection—not just broad industries, but subsegments and geographies too. After those are accounted for, there will be a gap representing a company’s unique proprietary advantage, encapsulated in privileged assets and special capabilities. It takes real work to isolate these factors, but the pay- off can be worthwhile: first, because market selection is in many ways a more practical lever of strategy than broad attempts to lift market share and, second, because it can clear up misconceptions about the (noisy) link between performance and capabilities.
So, what are the implications for CEOs and strategists?
• If you’re in the elite, “use it or lose it.” You have a privileged ability to mobilize capital. Really know the formula that got you there and vigilantly watch for signs of change. You can’t rest on your laurels, as the odds are almost 50–50 that you will slide down into the middle class—or lower.
• If you’re in the middle, you mostly face a battle of inches. A fortunate few companies will ride a favorable industry trend. But for the most part, it will take substantial strategic or operational shifts to escape the gravity of market forces. The odds are against you, which elevates the importance of looking at strategy with a high degree of rigor.

35
• If you’re at the bottom, growth without better performance will be the equivalent of throwing good money after bad. You will probably need a new trend to get out of the basement, but in the meantime focus on improving ROIC, which often requires improving asset turns.
Our research offers a yardstick on the empirical reality of strategy and can help create better rules of thumb for considering and assessing it. Individual companies should start by measuring whether they beat the market and by digging into the timeless strategic question of why they make money.
The authors would like to acknowledge the contributions of Alex Harper, Taichi Hoshino, Bin Jiang, Pia Mortensen, and the team at the McKinsey Strategy and Trends Analytics Centre (STAC) to the development of this article.
Chris Bradley is a principal in McKinsey’s Sydney office, where Angus Dawson is a director; Sven Smit is a director in the Amsterdam office.
The strategic yardstick you can’t afford to ignore

36
Left unchecked, market forces continually conspire to deplete profits. Powerful business strategies can counteract those tendencies, but good strategy is difficult to formulate.1 Indeed, the latest McKinsey research (see “The strategic yardstick you can’t afford to ignore,” on page 24) finds that a very small number of companies create most economic profit.2 The research also shows that a significant number of good companies outperform even in so-called bad industries, where the average economic profit is less than the market average.
How do they do it? In other words, where do powerful strategies come from? Sometimes it’s luck, or good timing, or a stroke of inspira- tion. In our experience, it’s also possible to load the dice in favor of developing good strategies by focusing on the core building blocks that often get overlooked. One is the need to gain agreement—before creating strategy—on the essential decisions and the criteria for making them. Another is to ensure that the company is prepared and willing to act on a strategy once it is adopted. Too much of what passes for strategy development, we find, consists of hurried efforts
Mastering the building blocks of strategy
Increase your likelihood of developing
effective strategies through an approach
that’s thorough, action-oriented, and
comfortable with debate and ambiguity.
Chris Bradley, Angus Dawson, and Antoine Montard
1 A 2011 McKinsey survey asked executives to evaluate their strategies against ten objective tests of business strategy. It found that 65 percent of companies passed just three or fewer tests. For more, see Chris Bradley, Martin Hirt, and Sven Smit, “Have you tested your strategy lately?,” McKinsey Quarterly, 2011 Number 1, mckinsey.com.
2 What’s left over after subtracting the cost of capital from net operating profit.

37
that skip one or more of the essentials. The resulting strategies are often flawed from the start.
It’s also easy, though, to go too far in the other direction and make the creation of strategy a rigid, box-checking exercise. Appealing as a formula-driven approach might be, it ignores the truth that strat- egy creation is a journey—and an inherently messy one at that. Proprietary insights are hard to come by. Shaping keen insights into good strategies requires deep interpersonal engagement and debate from senior executives, as well as the ability to deal with ambiguity in charged and often stressful circumstances. When would-be strategists overlook these dynamics, they cover the essentials in name only. Consequently, they miss opportunities and threats, or create great paper strategies that remain unfinished in practice.
In this article, we’ll outline a middle path—an end-to-end way of thinking that views the creation of strategy as a journey, not a project. This method, developed through our work with some 900 global companies over the past five years, can help senior executives approach strategy in a rigorous and complete way. We’ll also describe some principles that strategists should keep in mind as they use the method to ensure that their strategic-planning processes embody the spirit of debate and engagement, which, in turn, yields inspiration. By better understanding both the method and how to get the most out of it, companies can boost the odds that the strategies they create will beat the market.
Do justice to strategy’s building blocks
Most companies we’re familiar with demonstrate a variety of good habits when they create strategies, and they get many things right. But what they miss can be critical. Consider these examples:
• a technology company that prided itself on analytical rigor but never accurately diagnosed how difficult it would be for a targeted customer group to provide reasonable returns
• a beer company that rightly focused on industry structure in its core business but made a losing bet on a related business— wine—after failing to forecast declining returns stemming from structural shifts there

38 2013 Number 4
• a telecommunications company’s strategy team, which recognized the importance of involving senior managers but ended up alienating them by holding a series of time-consuming workshops that focused on alignment around strategic choices, though the full set of choices hadn’t yet been identified
These problems don’t have to happen. We find that companies do better when they ground all their strategy-development efforts and processes in an understanding of the building blocks of strategy. These straightforward modes of activity (exhibit) track the progression of a strategy from its roots as an idea through its emergence as an operational reality.
One central building block is deep insight into the starting position of the company: where and why it creates—or destroys—value (diagnose). Executives also need a point of view on how the future may unfold (forecast). By combining insights into a company’s starting position with a perspective on the future, the company can develop and explore alternative ways to win (search) and ultimately decide which alternative to pursue (choose). With the strategy selected, the company needs to create an action plan and reallocate resources to deliver it (commit).
Q4 2013Strategy methodExhibit 1 of 1
The building blocks of strategy help companies make strategic choices and carry them through to operational reality.
Frame What are the right questions?
Where and why do we make money? Diagnose
What futures do we need to plan for? Forecast
What are the potential pathways to winning?Search
What is our integrated strategy?Choose
How do we drive changes?Commit
How do we adapt and learn?Evolve
Exhibit

39
These five core building blocks are book-ended by two others. One is an initial block (frame) to ensure that the team properly identifies and agrees to both the questions asked and the decisions made as the strategy is developed. The final block (evolve) is dedicated to the constant monitoring and refreshing of the strategy as conditions change and new information becomes available.
To some extent, the building blocks simply represent a thorough list of activities that all good strategists perform. And while all are important and should be included in the creation of strategy, slavishly following this or any other framework won’t bring success. Depending on the situation, some blocks will be more critical than others and therefore require more attention (see sidebar,
“Re-create, recommit, and refresh”).
That’s why taking some time to frame issues at the outset is so important. When strategists do so, they are better able to identify the real choices and constraints facing their organizations and to see which building blocks are likely to matter most given the situ- ation at hand. Unfortunately, many executives feel that taking the time to frame strategy choices thoughtfully and to decide where to focus strategy-development efforts is a luxury they don’t have.
We’ve seen evidence of this pressure firsthand and in the responses to an executive survey we’ve been conducting as part of an ongoing research project. Fully two-thirds of the 200 executives we’ve surveyed so far report that they feel rushed to provide outputs in their strategic-planning processes. This pressure is understandable in today’s always-on, fast-changing environment, but it can be hazardous to a company’s strategic health. That’s especially true in the all-too-common situations when it’s not immediately obvious what factors will determine the success or failure of a change to strategy.
A financial-services institution in the Asia–Pacific region, for example, was investigating a growth opportunity involving the creation of an online business. Changing the company’s focus in this way would be a big undertaking, but the upside potential was large. Moreover, the members of the strategy team could already see that demonstrating the channel’s significant potential to the top team would be straight- forward. Before doing that, however, they stepped back to spend some
Mastering the building blocks of strategy

40 2013 Number 4
time thinking through the idea’s broader strategic context—framing, in other words.
When they did, they saw a serious risk of cannibalization for one of the company’s existing businesses. The new venture would also require substantial funding over the next three to five years before it contributed financially. This had important implications, and the team’s members needed to convince themselves that the risk was worth taking. Moreover, if the company made the move, would it
For a number of years, we, our
colleagues, and many others who are
engaged in the practice of strategy
have been pointing out how ill-suited
traditional strategic-planning
processes are to the dynamism and
pace of 21st-century business
life. Less clear is what should happen
to many organizations’ well-oiled
approaches. Shut them down? Morph
them into budgeting and operational-
planning processes? Use them
to synthesize the valuable insights
emerging from more frequent
strategic dialogues involving larger
numbers of executives?
The building blocks of strategy shed
fresh light on what strategic
planning should and shouldn’t try to
do. For starters, we’d emphasize
that periodically—perhaps as often
as every three to five years, if new
competitors arrive or markets
unexpectedly shift—companies
must re-create their strategies. This
cannot be accomplished through
typical planning processes,
as it requires broader skills, wider
engagement, and more flexibility to
make big strategic choices than
they allow. So forget about strategic
planning when you need to revamp
your strategy; instead, take a more
immersive strategy-development
approach using all of the
seven building blocks described
in this article.
At the other end of the spectrum is
what we would describe as the need
to recommit organizations to
established strategies. Traditional
strategic planning is tailor-made for
this purpose, and thinking about
the task in these terms helps elevate
it above the glorified budgeting
exercise into which some processes
lapse. Two of the building blocks
we have described in this article—
Re-create, recommit, and refresh

41
commit and evolve—are useful
reminders of what any such strategic-
planning process should accomplish:
the constant monitoring of strategy,
the reallocation of resources, the
alignment of management on
strategic priorities, and the creation
of targets, budgets, and opera-
tional plans.
Between these two extremes lies
the strategic refresh, which is
particularly relevant for organizations
where a lot of valuable, ongoing
strategy dialogue takes place among
members of the top team. Such
engagement can highlight nagging
issues that might one day
necessitate a strategic redo but
certainly merit attention now. For
example, if signs suggesting
that one or more key assumptions
have become less valid emerge from
strategic dialogues at the business-
unit level, it might be time to
update the company’s perspective on
long-term trends. This exercise
could be elevated in importance by
making it a core theme of the
upcoming strategic-planning process.
In such situations, it’s a good
idea to check all seven building blocks
quickly, with an emphasis on
understanding the strategic impli-
cations of underlying changes. If they
are big enough, that could be
a red flag signaling the need
to re-create the strategy and thus to
elevate the discussion beyond
strategic-planning parameters.
stick with the effort when the time came to provide funding for people and technology?
Instead of steaming ahead with analytical work to prove the potential, the team recognized that it would be critical to invest a dispro- portionate amount of time and effort to the commit building block. The strategy team did this, in part, by developing a powerful multimedia concept prototype to capture the imaginations of the top team and the executives representing key support functions. The
Mastering the building blocks of strategy
For a closer look at how to improve strategic planning, see “Managing the strategy journey” and “Dynamic management: Better decisions in uncertain times,” on mckinsey.com.

42 2013 Number 4
team’s focus on gaining commitment was prescient; the prototype and the communication around it helped convince the leaders that the concept was so compelling for consumers that if the company didn’t cannibalize its existing business, a competitor would probably come up with the idea. The effort also helped motivate the leaders of the finance and IT functions to support the new offer. The company launched it in record time, to promising early results in both cus- tomer acquisition and levels of customer engagement.
In retrospect, the team credits the conversations and debates held during this framing period as necessary to identify and resolve the potential stumbling blocks related to the organization’s strategic direction. Although messy at times, this activity helped build an organizational commitment to the strategy and its importance to the company.
Myth-bust your story
A focus on strategic building blocks also can help companies develop penetrating insights. While “insight” conjures up visions of research, data crunching, and “aha” moments, real strategic insight also rests on a seemingly mundane and easy-to-overlook factor: a thorough understanding of how and why a company, its competitors, and others in the industry value chain make money. Absent dumb luck, a strategy that doesn’t tap directly into such an understanding will underperform.
The difficulty, as professor Phil Rosenzweig of the International Institute for Management Development has explained so well,3 is that a company’s performance—good or bad—creates strong impressions that powerfully shape the way people perceive strategies, leaders, cultures, and organizational effectiveness. A commodity company, for instance, might falsely attribute its strong performance to the efficiency of its operations. Yet despite its efficiency, the economics of those operations could be swamped by market-structure changes that have significant pricing implications or by unex- pectedly volatile demand.
3 See Phil Rosenzweig, “The halo effect, and other managerial delusions,” McKinsey Quarterly, 2007 Number 1, mckinsey.com.

43
One way senior executives can address the challenge, we find, is explicitly questioning received corporate wisdom—much as the popular US television show MythBusters does when it takes apparent axioms, urban legends, and popular assumptions and (in entertaining fashion) tries to prove or disprove them. In the creation of strategy, this approach means dispassionately identifying the elements that contribute to performance, while discounting any factor contaminated by perceptions of the company’s supposed greatness. It also requires a curiosity that’s woefully lacking in some strategic-planning processes. Nearly eight in ten executives we surveyed, for example, say that the processes of their companies are more geared to confirming existing hypotheses than to testing new ones.
To see how these dynamics play out in practice, consider the experience of a global retailer that was revisiting its strategy after the previous one had delivered five years of strong earnings. The positive results, most in the company believed, reflected good execution and the success of a recent initiative to refresh the store format. Still, the leader of the business felt there could be more to the story and worried that continuing along the same path might not produce the same results in the future. To determine what was actually driving performance, the leader met with the company’s strategy team, as well as other executives.
This was time well spent. The resulting discussions sparked important insights—revealing, for example, that while overall performance was good, there were problems under the surface. On the positive side, the company was steadily improving its margins and winning customers from a higher-cost competitor. Nonetheless, the solid network growth at the top-line level appeared to be masking a
Nearly eight in ten executives say that the processes of their companies are more geared to confirming existing hypotheses than to testing new ones.
Mastering the building blocks of strategy

44 2013 Number 4
worrisome decline in the productivity of older stores. The big drag on performance, the team discovered, was the loss of mainstream customers to a cheaper competitor, which careful analysis showed to have an unassailable advantage on cost. Increasing promotional activity had so far seemed to stem the march of this aggressive rival, but the retailer was running out of steam and hitting practical limits. Significant changes would be necessary.
Let them grapple
This realization was the product of more than just number crunching. The thoughtful argument and debate surrounding the analysis from day one played a vital part in generating the insights. In our experience, many companies forget this truth when they create strategy. Instead, they put too much emphasis on preparing docu- ments and completing analyses and not enough on stimulating the productive debates that lead to better decisions.
Getting executives to grapple with the issues can be a messy process, and the debates may be quite personal. After all, formulating good strategies typically involves revisiting fundamental and deeply held beliefs about a company’s past and future, and people tend not to shift their views without a fight.4 But without the necessary fights, and without the use of carefully designed decision-making tech- niques, companies may end up with rubber-stamped strategies whose flaws are exposed during implementation—or afterward, by competitors.
When companies find ways to get executives grappling—throughout the strategy-development process—with the choices that matter, they make better, less biased decisions. They also improve the likeli- hood that the relevant stakeholders will be on board when the time comes to make and act on choices.5
4 We also know that executives exhibit a number of biases that lead them to be overconfident about their beliefs and adept at finding facts to confirm them and reject challenges. To learn more about addressing this problem, see Dan Lovallo and Olivier Sibony, “The case for behavioral strategy,” McKinsey Quarterly, 2010 Number 2, mckinsey.com.
5 The importance of gaining social support for a strategy is often overlooked. Fully 62 percent of executives in our survey say that their strategy processes focus on the strategy itself, not on building a support base of influencers who will drive implementation.
45
To exemplify our point, let’s look again at the retailer’s strategy team as it engaged with the company’s broader leadership group to share its observations. Most strategy teams interact with decision makers by presenting management with a summary report and recommendations. But this team understood that senior managers needed time to debate the issues themselves and reach their own conclusions—and that such collective discussions would improve the resulting strategy.
Because the senior managers had a very hands-on attitude, the strategy team designed a series of weekly meetings called think tanks to let them work through a profit-deconstruction exercise illumi- nating the company’s past. In each session, the analysis was tabled after a certain point, and the management team’s members took turns drawing out conclusions or identifying further questions that needed answering. The strategy team was prohibited from bringing any conclusions of the analysis to these meetings, much to its discomfort. This ensured that company leaders were invested in the decision-making process and could challenge the strategy team with new ideas.
Through a series of small-group meetings, the leadership team (with analytical help from the strategy team) debated the reasons for the company’s past success and how to continue it. By unpacking these complex dynamics together, the leadership team arrived at an accurate, sharp diagnosis: the company needed to restore main- stream shoppers’ trust in its prices. The result was a simple, focused strategy for delivering “value” products and reinforcing that mar- ket position with customers. Furthermore, because the management team was deeply involved in the diagnosis, its members had a strong incentive to drive implementation.
Don’t leave the strategy unfinished
In conversations with senior executives, we occasionally hear some version of this saying: “I’d rather have a good strategy and great execution than vice versa.” We believe that this attitude reflects con- fusion about what great strategy is. Such a strategy creates a path for action and is inherently incomplete without it. Yet many companies fail to get the conditions for successful implementation right, and
Mastering the building blocks of strategy

46 2013 Number 4
fully two-thirds of the executives in our survey admit that their companies struggle with the issue.
It’s a crucial struggle. No strategy, however brilliant, can be imple- mented successfully unless the people who have the most important jobs know what they need to do differently, understand how and why they should do it, and have the necessary resources. An added challenge, of course, is that strategic choices often involve big changes over long, three- to five-year time frames.
Finishing a strategy, therefore, requires creating tangible, proximate goals that connect to the longer-term strategy. It’s easy to create a high-level list of next steps and things to do differently on Monday morning. It’s much harder to roll back the future and connect it to the present so that people understand what they need to do differently and actually do it.
When companies fail to set proximate goals, the results can be disappointing. An Asian telecommunications company, for example, had landed on an intriguing and counterintuitive strategy involving two big shifts: it wanted to move its target customer base from big business to the midmarket and to standardize its products rather than provide customized service to large clients. Making the changes work, however, would require salespeople to start saying no to new business from large and complex clients so that the company could redirect its efforts to midmarket customers. The short-term pain (lower revenues and higher costs) would ultimately lead the company to a market-beating position.
The management team understood and encouraged the shift and was ready to act. But the strategy team did not do enough to prepare the organization for the moves, instead spending its time on detailed initiative-planning exercises. Absent any effort to translate the company’s strategic desires into proximate goals for its employees, those employees balked at the changes.
Sales managers, for example, not only viewed saying no to larger customers as a short-term loss for the business but also were simply not as excited about pursuing midmarket customers with simpler needs. They understood the strategy intellectually and believed the analysis, but their skills, incentives, and ways of working and even

47
thinking had not changed. Without such changes, they couldn’t connect the necessary steps to a longer-term goal and naturally reverted to their old ways, creating a backlash that inevitably undermined the strategy. Only afterward did the team recognize the kinds of activi- ties that might have helped—for example, changing the salespeople’s goals, resetting the overall budget to acknowledge the transition from one customer segment to another, and using the reallocated funding to generate a new product-development road map.
Creating strategy in today’s environment of complexity, ever-changing priorities, and conflicting agendas is a daunting task. Yet when senior executives invest the time and effort to develop a more thorough, thoughtful approach to strategy, they not only increase the odds of building a winning business but also often enjoy a positive spin-off: the gifts of simplicity and focus, as well as the conviction to get things done.
The authors wish to thank Matthew Chapman, Pia Mortensen, and Victoria Newman for their contributions to the development of this article.
Chris Bradley is a principal in McKinsey’s Sydney office, where Angus Dawson is a director and Antoine Montard is a senior expert.
Mastering the building blocks of strategy

48
Few large, established companies anywhere in the world effec- tively reinvent themselves overnight. But Minneapolis-based Pentair did just that. A decade ago, the company sold its core power-tools businesses—42 percent of group sales—and reinvested the proceeds in Wicor Industries, the water-systems subsidiary of Wisconsin Energy. In March 2012, Pentair made another big bet, roughly doubling its size to $8 billion by acquiring Tyco International’s flow-control business. Randall Hogan, chairman and chief executive officer and the man who led the transition, talked recently with McKinsey’s Rik Kirkland about strategy, capital reallocation, the importance of getting the board’s buy-in, and the vital art of thinking “right to left.”
The Quarterly: How do you approach strategy?
Randall Hogan: Before joining Pentair, in 1998, I had worked for GE and United Technologies. Both companies were in a lot of different and seemingly unrelated businesses, but the experience taught me that successful conglomerates exist because they’re good at moving capital, talent, and processes around. United Technologies, in particular, brought substantive operating discipline—using the Toyota Motor production system, for example—to its assets. That just threw a switch inside me; here, I thought, is a powerful way of running a diverse company. And it shaped my view that there had to be something more to Pentair than just a holding company—a set of common principles and common beliefs, for instance.
Rethinking where to compete: An interview with the CEO of Pentair
The US manufacturer has reinvented
itself by switching out of power
tools and into water and other resource-
based businesses.

49
The Quarterly: Was it a difficult decision to exit power tools?
Randall Hogan: The power-tools group was our largest business when I became CEO, in 2001, but I don’t think the board was surprised when I told them I thought it had the dimmest prospects. We didn’t control our own destiny. Lowe’s and Home Depot, the retail outlets which stocked our professional niche tools and helped drive growth in the 1990s, accounted for 55 percent of sales, and we were dependent upon them. Water, on the other hand, was looking interesting to a lot of people; its growth prospects were strong, its M&A potential was bright, and its industry dynamics—channel power, innovation, pricing fundamentals—seemed attractive. It was clear that we had to reduce our dependence on power tools and double down on at least one of our other businesses, maybe both.
The Quarterly: So, was the timing of the water acquisition a coincidence?
Randall Hogan: The purpose of the CEO, the leader of the company, is to create a brighter future. And that’s why I often talk about thinking “right to left.” Left is where you are now. The right-hand point is the goal—in our case, not just getting out of power tools but developing a water strategy. Even before we sold power tools and bought Wicor Industries, we were identifying interesting spaces and people in the water sector and making a number of small acquisi- tions. Our focus wasn’t just on the sale, it was on the buy—with the commitment and understanding that we would do the sell. In February 2004, we announced the purchase of Wicor, and then we had an auction to sell the power-tools business. It was hairy at times, but for a net difference of $75 million, the result was that we upgraded our entire portfolio, the stock price jumped, and as investors saw the promise of it, we were rewarded with a better multiple.
The Quarterly: How did the board react to the change of direction?
Randall Hogan: It was very important that the board was in on the discussions early—they were fully aligned on the “right point” of our strategy. I’m sure that this was easier to do 10 or 15 years ago than it is today, when many boards are a bit more focused on gover- nance. Yet engaging in strategy and resource allocation is really where boards can help the most to create value. That said, plenty of people in the know at the time argued that our move was too radical.

50 2013 Number 4
They pointed out that all our power-tools know-how was irrelevant to the water business and that there was a lot about the water business that we didn’t know. The role of the CEO is not to let those little voices carry the day. Listen to them, by all means, and understand them, but keep that point to the right in mind. And stick to it.
The Quarterly: Does the end goal of strategy have to be fully baked?
Randall Hogan: It’s really best to think of it as a destination with an infinite number of ways to get there. We knew we had to get out of power tools but initially we had no idea how. Most companies, in my experience, don’t have a destination; they just want to keep doing what they’re already doing, at an incremental pace.
The Quarterly: Was the financial crisis of 2007–08 a big test of nerve?
Randall Hogan: We actually got hit earlier than that, in 2006, because the water business we built was 50 percent residential and we had deliberately stayed small in municipal, where the margins are low. Between 2006 and 2008, Wall Street told us we were the dumbest people in the world. It was quite an education. The board wasn’t always easy when things were going badly: miss a few quarters and you’re going to hear about it. But luckily, I had enough of a relationship with them that we drew together a little tighter, and they stuck with us. Even then, we were still focused on that right-hand point—what is the long game?
The Quarterly: What prompted the Tyco deal?
Randall Hogan: We had taken the actions to get us through the financial crisis, but after that the target was to become a $10 billion company. We knew that we had to be bigger to control our own destiny. And the opportunity was there in what we call the “new–new world,” four billion middle-class people demanding energy, water, and food.
We first identified Tyco’s flow-control business in 2009 as a way to gain scale, diversify beyond residential consumers, and gain greater global coverage. We had no idea if it would ever be an option,

51
but the point of thinking right to left is to imagine where you’d like the company to be, and then to be open to the opportunities as they present themselves. You create the future you imagine.
When Tyco decided to spin off its f low-control business, they recognized that it needed some common operating disciplines and that we already had a corporate office we could leverage. Secondly, we had a strategic road map of how the businesses would fit together. Thanks to those operating disciplines, we’ve been able to
Rethinking where to compete: An interview with the CEO of Pentair
Randall Hogan Vital statistics Born in 1955, in Framingham, Massachusetts
Education Attended the US Coast Guard Academy from 1973 to 1975
Graduated with a BS in civil engineering in 1977 from the Massachusetts Institute of Technology and an MBA in 1981 from the University of Texas at Austin
Career highlights Pentair (1998–present)
Chairman (2002−present)
CEO (2001−present)
President and COO (1999−2000)
Executive vice president and president of Electrical and Electronic Enclosures Group (1998−99) United Technologies (1994–97)
President, Carrier Transicold Division (1995–97) GE (1988–94)
Various executive positions McKinsey & Company (1981–87)
Consultant
Fast factsReceived Ernst & Young’s Entrepreneur of the Year Lifetime Achievement Award (2013)
Serves as deputy chair of the board of the Federal Reserve Bank of Minneapolis
Sits on the board of trustees of American Public Media Group
Is a member of the board of directors for the Guthrie Theater, in Minneapolis
Is a member of the board of directors for Covidien

52 2013 Number 4
extract the necessary synergies to pay the bills. It was what we call a “Goldilocks” deal—the combination and price were just right.
The Quarterly: How do you routinely allocate capital to the best businesses?
Randall Hogan: Rarely do the business units have the altitude or the amplitude to think big. So it’s the job of the corporate center to say what’s next.
But the decisions on nurturing and pruning do happen inside the business units, and we try to encourage a dialogue around that. In the old days, we used to call the capital-allocation model “first pig to the trough,” and the biggest pig usually won. I’m not sure we’re totally weaned off that, but the process now starts with the 33 platforms we’ve identified across Pentair—platforms with a little p that could be anything from a $600 million product line to just an idea. We take a look at all the opportunities. Some are cash cows, and some need more resources put into them.
What we’re trying to do is to turn what’s been predominantly a budgeting process into a more strategic allocation of capital. My big focus right now is getting the business culturally ready for that. We have seven global business units run by really talented people who all want to run their own show. My challenge is to encourage the notion that they are part of Pentair, as opposed to running a Pentair division. In organizations, there is always deep inertia, a reluctance to change things. You have to introduce energy in a radical way to change the corporate gyro.
The Quarterly: How have you tried to change people’s thinking?
Randall Hogan: We’ve set questions at the outset of the planning process, listened to their ideas, provided feedback, and attempted to get them to think more nonlinearly—challenging them about markets that are not growing or ones where there is a clear mismatch of resources. How do you run a market with 25 percent of your sales but only 15 percent of your sales people? We’re not saying, “Do it.” We’re saying, “How would you do the thought exercise?” They may be big in the United States and Western Europe, but the opportunities are in Indonesia and Brazil.

53
For five years, I’ve been saying we need more talent in the fast-growth markets and our best talent against our best opportunities. At our global leadership meeting, one or two global business units sent 30 people, but only one of them came from Asia, despite the region’s representing 50 percent of their opportunities for growth. That doesn’t make sense.
The Quarterly: What’s next for Pentair?
Randall Hogan: We have been through a huge shift in the last few years, from 20 percent to 60 percent of our sales outside North America, and from $1 billion to more than $12 billion in market cap; from being the largest unknown company in Minnesota to one with a much higher, global profile. In the future, we’re going to be even bigger outside North America, because growth rates else- where will be higher. Our aim will be to grow faster organically in these markets. Although that doesn’t mean that we won’t do more acquisitions, we now really have to develop our organic-growth genes. Strategically, we’re interested in the food space and we’re really interested in energy.
A language of performance is important—our lean enterprise, pro- cess improvement, and talent-management principles are all about that. But we’re also working hard to clarify the underlying pur- pose of the company—improving the quality of life for people around the world—and to be the next great industrial company. Our values are about “winning right,” and we’re going through a process right now to tie that philosophy to our operating principles. I want to get 30,000 people all heading in the same direction, or, as Lee Walton, an old McKinsey mentor with Texas roots, said to me,
“You know, management is about getting everyone roughly heading west.” And I would modify that with these words: “as long as west is the direction you want to go.”
Copyright © 2013 McKinsey & Company. All rights reserved.
This interview was conducted by Rik Kirkland, senior managing editor of McKinsey Publishing, based in McKinsey’s New York office.
Rethinking where to compete: An interview with the CEO of Pentair

Illus
trat
ion
by F
OR
EA
L™
56Never let a good crisis go to waste Mladen Fruk,
Stephen Hall, and
Devesh Mittal

55
60Avoiding the quicksand: Ten techniques for more agile corporate resource allocationMichael Birshan,
Marja Engel,
and Olivier Sibony
69Tilting the global balance: An interview with the CEO of Solvay
Great strategic thinking goes for naught when corporate resources aren’t reallocated as strategies shift. This sounds like a truism, yet McKinsey research has repeatedly shown that inertia is the rule, not the exception. The financial and economic crisis didn’t change that equation, according to new research, which also highlights the value of decisive moves by new CEOs. Rounding out this package are ten techniques for overcoming inertia and ideas from a CEO who has boldly led the way.
64How quickly should a new CEO shift corporate resources?Stephen Hall and
Conor Kehoe

56
The vast majority of organizations are surprisingly slow to reshuffle their resources. When we conducted a large-scale analysis of the reallocation patterns of multibusiness companies, for instance, we found that most of them awarded each business in their portfolio an unchanging percentage of total corporate capital year after year between 1990 and 2005. Yet the returns were higher and the volatility lower at organizations that reallocated more actively.
When we present these findings (which we highlighted in a previous McKinsey Quarterly article1) to senior executives, they often ask us about the impact of the financial crisis and the downturn that followed. Surely, they argue, a tougher economic environment has led to more pronounced changes in resource-allocation patterns as companies were forced to look for new sources of value.
In fact, this proves not to be true. When we extended our analysis through 2010, thereby covering a full 20 years of performance by 1,500 companies, we found that the downturn had virtually zero impact on patterns of reallocation.2 There was apparently no
Never let a good crisis go to waste
New research shows that actively
reallocating corporate resources is even
more important in a downturn than it
is in good times.
Mladen Fruk, Stephen Hall, and Devesh Mittal
1 See Stephen Hall, Dan Lovallo, and Reinier Musters, “How to put your money where your strategy is,” McKinsey Quarterly, 2012 Number 2, mckinsey.com.
2 Resource allocation is measured as 1 minus the minimum percentage of capital expenditure received by distinct business units over the 20-year period from 1990 to 2010. We used Compustat data on 1,508 US-listed companies that reported capital expenditure in a minimum of two distinct four-digit Standard Industrial Classification (SIC) codes.

5757
greater aggregate corporate appetite for it in the tough recent years than there had been in the previous 15.
Yet the executives’ instincts are right: dynamic resource allocation became more critical than ever during the downturn. Compare the performance of companies in the top third of our pool (high reallocators) with the performance of those in the bottom third (low reallocators). As Exhibit 1 shows, the gap between the total returns to shareholders (TRS) of the high reallocators, on the one hand, and of the low reallocators, which evolved their allocations only modestly over the 20 years, on the other, increased from 2.4 percent- age points to 3.9 percentage points as a result of the extra five years. That may not sound like such a big gap, but 3.9 percentage points of annual incremental returns to shareholders implies that an investor’s stake in our sample’s typical high reallocator was worth more than twice as much as a stake in an average low reallocator by the end of the 20-year period (assuming all dividends were reinvested).
When we looked at companies sector by sector, the same broad pattern emerged: whether in basic materials, energy and utilities, information technology, or consumer products and retailing, the median TRS was consistently greater for the high reallocators than for the low ones.
A similar story is apparent in the corporate-survival statistics. Over the new, longer period of our study, the survival gap between
Q4 2013Resource AllocationExhibit 1 of 3
Companies that actively reallocated their resources continued to perform better through the 2007–10 economic downturn.
1 TRS = total returns to shareholders; CAGR = compound annual growth rate. Degree of reallocation measures share of capital expenditure shifted between business units over given period; low reallocators = bottom third by reallocation activity, medium = middle third, and high = top third.
Source: Standard & Poor’s Compustat; McKinsey analysis
Original analysis: 1990–2005, n = 1,616
Updated analysis: 1990–2010, n = 1,508
Median TRS CAGR for US companies, by degree of reallocation,1 %
Low reallocators
Medium reallocators
High reallocators
7.8
8.9
10.2
6.1
8.5
10.0
+2.4 +3.9
Exhibit 1
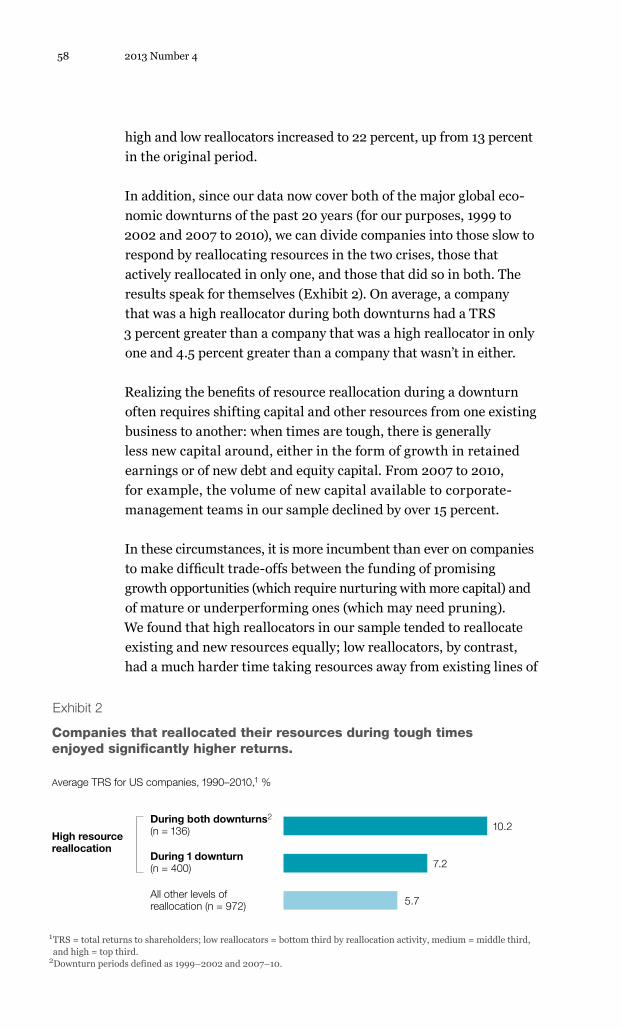
58 2013 Number 4
high and low reallocators increased to 22 percent, up from 13 percent in the original period.
In addition, since our data now cover both of the major global eco- nomic downturns of the past 20 years (for our purposes, 1999 to 2002 and 2007 to 2010), we can divide companies into those slow to respond by reallocating resources in the two crises, those that actively reallocated in only one, and those that did so in both. The results speak for themselves (Exhibit 2). On average, a company that was a high reallocator during both downturns had a TRS 3 percent greater than a company that was a high reallocator in only one and 4.5 percent greater than a company that wasn’t in either.
Realizing the benefits of resource reallocation during a downturn often requires shifting capital and other resources from one existing business to another: when times are tough, there is generally less new capital around, either in the form of growth in retained earnings or of new debt and equity capital. From 2007 to 2010, for example, the volume of new capital available to corporate-management teams in our sample declined by over 15 percent.
In these circumstances, it is more incumbent than ever on companies to make difficult trade-offs between the funding of promising growth opportunities (which require nurturing with more capital) and of mature or underperforming ones (which may need pruning). We found that high reallocators in our sample tended to reallocate existing and new resources equally; low reallocators, by contrast, had a much harder time taking resources away from existing lines of
Q4 2013Resource AllocationExhibit 2 of 3
Companies that reallocated their resources during tough times enjoyed significantly higher returns.
1 TRS = total returns to shareholders; low reallocators = bottom third by reallocation activity, medium = middle third, and high = top third.
2Downturn periods defined as 1999–2002 and 2007–10.
During both downturns2
(n = 136) High resource reallocation
During 1 downturn(n = 400)
Average TRS for US companies, 1990–2010,1 %
All other levels of reallocation (n = 972)
10.2
7.2
5.7
Exhibit 2

59
business and tended predominantly to reallocate new resources. The willingness to rob Peter to pay Paul is one of the hallmarks of a dynamic top team.
This is not to say, however, that sharp, one-time swings of focus in response to a changing external environment generally make sense. Rather, our new data suggest that markets most reward companies that do not overreact to short-term signals by making large, abrupt changes in business focus but instead pursue multiple, stepwise shifts in resources, year after year, in pursuit of a clear strategy. That approach tends to produce better returns and lower volatility than one or two Herculean changes to a corporate portfolio (Exhibit 3).
These results suggest to us that resource reallocation is a muscle that requires exercising in good times and even more in bad times. Companies should be on their guard against inertia at all stages of the cycle—and may need to be particularly ruthless in a downturn, especially when new sources of capital dry up.
Never let a good crisis go to wasteQ4 2013Resource AllocationExhibit 3 of 3
Companies that consistently reallocated their resources experienced higher and less variable returns.
1 TRS = total returns to shareholders.2A significant shift is one that moves >5% of total capital-expenditure allotment.
8.5%
–50
–25
0
25
50
8.5% 9.0% 9.4% 10.1%11.9%
Number of significant resource shifts2 over 20 years, 1990–2010, n = 932 US companies
Median TRS,11990–2010
Range of TRS,1990–2010,%
0–2 shifts 3–5 shifts 6–7 shifts 8–12 shifts 13–15 shifts ≥16 shifts
Exhibit 3
The authors would like to thank Reinier Musters for his contribution to the development of this article.
Mladen Fruk is a consultant in McKinsey’s Bucharest office, Stephen Hall is a director in the London office, and Devesh Mittal is a specialist in the McKinsey Knowledge Center in Gurgaon.

Insanity has been defined as doing the same thing over and over again
and expecting different results. Many senior executives face exactly
this situation in allocating critical corporate resources. Every year, they
turn the handle on the same strategy-development, capital-planning,
talent-management, and budgeting processes, and every year the outcome
is only marginally different from the one they reached in the previous
year and the year before that. Business leaders readily accept that strong
corporate performance demands bolder shifts in resources over time;
most even agree that this is one of the most important roles of a CEO and
top team. Yet they remain prisoners of management processes that
have evolved to deliver the exact opposite of what they are looking for.
Refocusing those processes can deliver different results. We do not yet
have an exhaustive list, but we’ve been collecting, refining, and adapting a
rich menu of ideas for shaking up the corporate status quo. Here are ten
proven techniques for putting better information on the table, encouraging
boldness, cutting through corporate politics, and improving accountability
in this critical area.
These tested ideas can help
organizations overcome inertia
and implement their strategies
more effectively.
60
Avoiding the quicksand: Ten techniques for more agile corporate resource allocationMichael Birshan, Marja Engel, and Olivier Sibony

Create a corporate-resource map. Some companies now choose to
allocate resources at the level of literally hundreds of product and market
“cells,” such as product or geography categories. While that’s too detailed for
others, the key, in any case, is to go beyond the big divisions and develop
a map that’s granular enough to see where resources are currently deployed.
Make sure it goes beyond capital spending, to include marketing expen-
ditures, R&D funds, and top talent. Such maps—which one company we know
brings to life on a tablet app highlighting resource requirements, returns,
and growth options—give corporate decision makers the visibility they need
for trade-offs between activities and initiatives a level or two below the business-
unit level. This detailed transparency is typically required to change the
allocation of resources in organizations that have powerful divisional leaders.
Benchmark your “resource inertia.” A number of companies have begun
to measure the correlation between the percentage of resources each
cell in their portfolios received in the most recent year and what it received
in previous years. We encourage you to do the same—like them, you’ll
be surprised by how often the answer is well above 90 percent. This provides
a good measure for tracking whether a company really reallocates its
main resources.
Reframe budget meetings as reallocation sessions, and run them
accordingly. This may mean introducing unorthodox approaches, such as
giving investment-committee participants a small pile of poker chips
and asking them to “place bets” on projects they think deserve funding. Such
an approach concentrates minds on the big picture, not individual silos,
and makes all of the people in the room aware that a company has other
priorities besides their own pet projects. Also useful is the technique of “stage
gating,” the common practice—in R&D- or capital-intensive organizations—
of setting performance milestones and releasing additional resources
only when intermediate targets are hit. This forces periodic debate when
new tranches of resources must be released.
Develop a formal “counteranchor.” One common cognitive bias, known
as “anchoring,” is to base next year’s allocation uncritically on the previous
year’s. Leaders can encourage debate by, for example, circulating inde-
pendent analysts’ reports on the growth outlook for their different markets.
One consumer-goods company uses external growth and profit-potential
data, down to the level of individual cities, to create a hypothetical allocation
of advertising expenditures. Often, it is so different from the company’s
current allocation that it shifts debate from whether spending should be
110 percent or 90 percent of last year’s figure to whether it should be 200 per-
cent or 50 percent.
1
2
3
4
61

Change your strategy-setting rhythm. While companies rightly want
their deliberations on strategy to influence resource shifts, too few allow
sufficient time between the conclusion of the strategic direction setting and
the locking down of resource-allocation decisions. This approach leads to
allocations that are very similar to the previous ones, because the planners
then say, “Our bottom-up planning process has spoken, and it’s too
late to change now.” Better to share unrefined strategic direction with the
wider organization early on rather than wait to issue a more complete
one that arrives too late to make a difference.
Build flexibility into the process. Opportunities—whether to nurture
existing businesses with additional capital or to acquire new assets at
knockdown prices—often pop up once annual allocations have been locked
down. One large natural-resources group allows its CEO to allocate 5
percent (in practice, usually well over $1 billion) of its capital expenditures at
his own discretion. A biotech company creates two budgets, red and blue:
one based on business as usual, the other ready to be implemented quickly
if a pending major clinical trial has a positive outcome. It’s also worth
considering the creation of a separate “rolling” budget: a discretionary pool
that can be allocated over the year rather than at a single point in the
calendar. This flexibility is particularly important for volatile emerging markets
and cyclical industries, where the benefits of moving resources quickly
are often high.
Learn to let go. One of the most difficult parts of allocating resources is
getting out of businesses that have served a company well in the past but
are now stagnant or worse. One useful approach is for the investment
committee, once a year, to conduct a formal exercise imagining that the
company isn’t in any of its businesses and then to ask whether the
market fundamentals would make investments in each of them compelling.
As a matter of policy, one large energy group makes sure that it disposes
of at least 2 to 3 percent of its portfolio every year.
Make it easier to move the top 100 to 300 people. Much manage-
ment talent works in the business units, and rightly so—that’s where companies
create value. But many business-unit heads tend to hang on to their star
executives, which complicates the people side of resource reallocation. Fighting
these natural instincts requires action at the top. Several global CEOs
think of their companies’ top ranks as a corporate asset to be applied to
opportunities that offer the highest returns. Tactics that facilitate this
approach include a corporate review of all top talent, as well as standardizing
job titles and role descriptions across the top 200 or so executives and
compensating them on the same basis regardless of geographic location.
Such ground rules make it easier for the top team to mix, match, and
move top talent.
5
6
7
8
62 2013 Number 4

The authors would like to acknowledge the contribution of Blair Warner to the development of this article.
Michael Birshan is a principal in McKinsey’s London office, Marja Engel is a consultant in the Minneapolis office, and Olivier Sibony is a director in the Paris office.
Ten techniques for more agile corporate resource allocation
Don’t forget about time. Even without moving capital or people, companies
can shift management’s emphasis dramatically by taking a clean-sheet
approach to the way the top team spends its time. Some companies set a
time “budget” for the top team to clarify how much leadership capacity
exists to “finance” initiatives and whether management is really focused on
the highest strategic priorities. Time can also feature on the resource map.
Look back and learn. Reviewing earlier investment decisions helps com-
panies refine the resource-allocation process. One company responded
to such a postmortem review by insisting that no future investment proposal
come forward for discussion unless independent technical- and business-
evaluation teams had formally signed off on it. The company also required
each individual executive on the investment committee to cast a formal vote
for or against every specific investment and recorded such votes for posterity.
We don’t pretend that each of these ideas for refocusing resource-allocation
processes is relevant to every business. Rather, we hope that they will
inspire management teams to talk through what adjustments they need to
make within their own organizations to deliver better resource outcomes.
Ultimately, it is the CEO’s job to adjust a company’s processes so that they
truly allocate resources strategically.
9
10
63

64
New CEOs face a critical strategic choice. Should they settle into the job, spend a year or more getting to know their businesses, and then start shifting the portfolio? Or is it better to act quickly and boldly early on to divert resources from mature activities to a new generation of corporate opportunities?
We observe CEOs following both approaches, but one appears to deliver superior results: between 1990 and 2010, chief executives who reallocated corporate resources early in their tenures generated materially stronger returns for shareholders than those who waited. In the process, these active CEOs also seem to have prolonged their own time at the top. What’s more, a similar decisiveness in changing the composition of the top team also brought disproportionate longer-term rewards.
In our database of more than 1,500 multibusiness public companies in the United States, we identified a subset that reported changing their CEOs. We then divided the 365 “new” CEOs in our database into two roughly equal groups: those who were slow to reallocate capital across the business portfolio during their first three years and those who were fast to reallocate it.1 When we correlated these results
How quickly should a new CEO shift corporate resources?
Moving early to reconfigure the business
portfolio and top-management team
improves corporate performance and the
odds for a lengthy tenure.
Stephen Hall and Conor Kehoe
1 For the first three years of a CEO’s tenure, we used flow-reallocation measurements calculated as 1 minus the minimum percentage of capital expenditure received by distinct business units. The CEOs of bottom-half companies were classified as slow reallocators and the top half as fast ones.

65
with a CEO’s individual tenure, we discovered that just over one-third of the relatively inactive CEOs had moved on by year six, but only a quarter of the fast leaders had.
The best results were achieved by CEOs who moved swiftly early on and then throttled back the rate of resource-allocation change to allow the market to understand and value their early actions. By contrast, late starters—those who were slow to reallocate capital during the first three years of their mandate but then picked up the pace of change—did not find themselves as well rewarded by the market. Exhibit 1 compares the total returns generated by companies with “fast–slow” versus “slow–fast” CEOs.
As we have argued in our companion article focused on the downturn, (see “Never let a good crisis go to waste,” on page 56), the key to allocating resources actively lies not just in acquisitions and disposals but also in the undoubtedly more difficult challenge of taking capital away from mature, often well-performing businesses and reinvesting it in faster-growing alternatives. Fast CEOs are much
Q4 2013CEO longevityExhibit 1 of 3
Slow CEOs (n = 182)
Slow CEOs (n = 75)
Fast CEOs(n = 32)
Slow CEOs (n = 40)
Fast CEOs(n = 78)
Fast CEOs (n = 183)
Median TRS2 % of CEOs who survived for at least 6 years
Median TRSIn years 1–3 In years 4–6
Speed of resource reallocation and 6-year median TRS, based on 365 US-listed companies1
1 Includes companies with a change in CEO, subsequent CEO tenure of at least 3 years, and reallocation data available for the first 3 years of tenure; slow reallocators = bottom half by reallocation activity; fast = top half; TRS = total returns to shareholders.
2Deflated to account for survivor bias; excludes companies whose resource-reallocation data were not available for the 4–6 year period.
CEOs who initiated resource reallocations early in their tenures—but slowed down the pace later—generated superior returns.
8.8%
6.6%
6.8%
3.2%
10.4%
8.9%
65%
75%
Exhibit 1

66 2013 Number 4
more inclined to do so than their slow counterparts are (Exhibit 2). Interestingly, CEOs recruited from outside a company appear to find it easier to undertake such nurturing and pruning of existing portfolio businesses than do those appointed from the inside.2 Internal candidates, notwithstanding their more intimate knowledge of the company, may be more reluctant than outsiders to prune businesses overseen by their former peers. New inside CEOs, moreover, may have a bias in favor of the existing portfolio. After all, it is always hard to be objective about children you yourself have raised.
The value to CEOs of making swift and meaningful changes in the allocation of resources applies not only to capital but also to top talent. Our data show that CEOs who add or subtract members of their executive committees within the first year of their tenure are likely to survive longer and to achieve higher total returns to shareholders (TRS) in their first three years as chief executive. Our analysis shows that the greatest impact comes from moving swiftly to change the top team rather than from the actual
Q4 2013CEO longevityExhibit 2 of 3
% of companies executing given activities, based on 365 US-listed companies1
Speed of resource reallocation2
Nurturing ongoing businesses Pruning ongoing businesses
Entering businesses Exiting businesses
1 Includes companies with a change in CEO, subsequent CEO tenure of at least 3 years, and reallocation data available for the first 3 years of tenure.
2Slow reallocators = bottom half by reallocation activity; fast = top half. Nurturing = increasing an ongoing business’s share of company’s overall capital-expenditure budget; pruning = decreasing that share.
The difference between fast and slow CEOs appears to be most pronounced with respect to nurturing and pruning.
Slow CEOs
Fast CEOs
Slow CEOs
Fast CEOs
32
82
+50
31
77
+46
5
8
+3
5
14
+9
Exhibit 2
2 The CEO is considered an external one if the date when the executive assumed that office was not more than one year from the date when he or she joined the company.
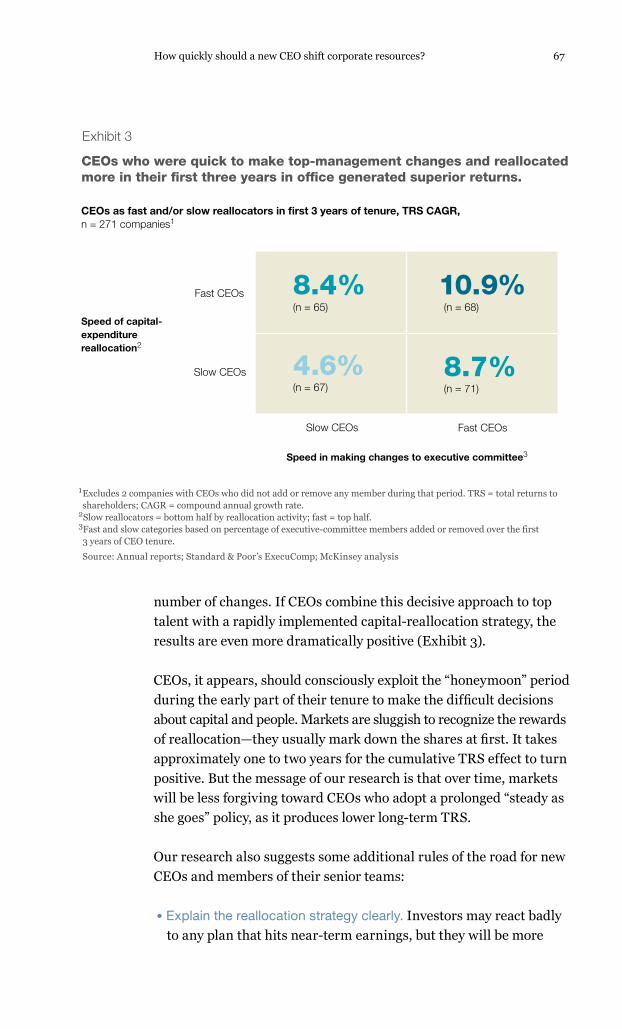
67How quickly should a new CEO shift corporate resources?
number of changes. If CEOs combine this decisive approach to top talent with a rapidly implemented capital-reallocation strategy, the results are even more dramatically positive (Exhibit 3).
CEOs, it appears, should consciously exploit the “honeymoon” period during the early part of their tenure to make the difficult decisions about capital and people. Markets are sluggish to recognize the rewards of reallocation—they usually mark down the shares at first. It takes approximately one to two years for the cumulative TRS effect to turn positive. But the message of our research is that over time, markets will be less forgiving toward CEOs who adopt a prolonged “steady as she goes” policy, as it produces lower long-term TRS.
Our research also suggests some additional rules of the road for new CEOs and members of their senior teams:
• Explain the reallocation strategy clearly. Investors may react badly to any plan that hits near-term earnings, but they will be more
Q4 2013CEO longevityExhibit 3 of 3
Speed of capital- expenditure reallocation2
Speed in making changes to executive committee3
CEOs as fast and/or slow reallocators in first 3 years of tenure, TRS CAGR, n = 271 companies1
1 Excludes 2 companies with CEOs who did not add or remove any member during that period. TRS = total returns to shareholders; CAGR = compound annual growth rate.
2Slow reallocators = bottom half by reallocation activity; fast = top half.3Fast and slow categories based on percentage of executive-committee members added or removed over the first 3 years of CEO tenure.
Source: Annual reports; Standard & Poor’s ExecuComp; McKinsey analysis
CEOs who were quick to make top-management changes and reallocated more in their first three years in office generated superior returns.
8.4% 10.9%
4.6% 8.7%(n = 67) (n = 71)
(n = 65) (n = 68) Fast CEOs
Slow CEOs
Slow CEOs Fast CEOs
Exhibit 3

68 2013 Number 4
understanding if they know what’s happening, the reasons behind it, and the projected time frame for the results. As far as possible, nurture long-term investors—and do not pander to “short-termists.”
• Be bold. Don’t worry about reallocating too much. We imagined we would find some companies that had reallocated so much that TRS declined as a result. No such example existed in our data- base covering US multibusiness companies over 20 years. Managers seem strongly biased to do much less than is needed to optimize TRS.
• ‘Own’ the careers of senior corporate talent. CEOs must ensure that they are free to deploy good people to manage new or expanded activities across the corporate portfolio. The ability to exert a strong influence over the career moves of a company’s top 100 to 300 executives is vital for successful corporate reallocators.
• Enlist board support. The most effective board directors, according to a recent McKinsey survey,3 focus on overseeing the execution of strategy (making sure that people, processes, and resources are in place to carry it out) and on holding management accountable. CEOs should use their boards to reinforce and oversee the changes required to increase the pace and scale of resource reallocation by engaging board members to become challenging but supportive “coaches.”
3 See “Improving board governance: McKinsey Global Survey results,” August 2013, mckinsey.com.
The authors would like to thank Mladen Fruk, Martin Hirt, Devesh Mittal, Reinier Musters, and Kurt Strovink.
Stephen Hall and Conor Kehoe are directors in McKinsey’s London office.

69
Many companies talk about placing a greater emphasis on emerging economies. Solvay, with headquarters in Brussels, has acted decisively in this respect—first by freeing up resources through the €5.2 billion sale of its core pharmaceutical business in 2010, then in 2011 by acquiring Rhodia, a French rival with an enterprise value of €6.6 billion. Rhodia complemented Solvay’s chemical portfolio and added a substantial Chinese business.
Responsibility for directing Solvay’s latest international expansion lay initially with Christian Jourquin (CEO, 2006–12) and, more recently, with Jean-Pierre Clamadieu, who had been Rhodia’s chairman (2008−11) and CEO (2003−11) and became head of the enlarged group in May 2012. Mr. Clamadieu won many plaudits in his native France a decade ago for leading a radical restructuring at Rhodia, and the task ahead is more complex and no less challenging. He recently talked with McKinsey’s Hervé de Barbeyrac and Ruben Verhoeven about the importance of strategic agility, radical plans for the group’s top talent, the dangers of “sequential” thinking, and the appropriate role for a global CEO seeking to build a fresh culture.
The Quarterly: Can you summarize the rationale for the Rhodia acquisition?
Jean-Pierre Clamadieu: I think it was very unusual for a group like Solvay to sell its pharma business without having a specific target in mind for how to spend the proceeds. There was a clear
Tilting the global balance: An interview with the CEO of Solvay
The Belgian company is reshaping
its portfolio to focus harder on fast-
growing markets.

70 2013 Number 4
understanding in 2009 that Solvay did not have the scale or the innovative potential to grow in pharma—and an equally firm belief that the group had the fundamentals to succeed in chemicals with the right acquisition. But there was nothing more than an agreement in principle to reinvest in that sector. In my view, that could only have happened because of the controlling shareholding of the Solvay families. Over the past 150 years, these shareholders have demon- strated their commitment to a long-term strategy for the business. In most companies, investors would have wanted their money back and asked for a special dividend.
The Quarterly: How important was it for Solvay to increase its exposure to emerging markets?
Jean-Pierre Clamadieu: Solvay was too much tilted toward Europe, so this was a significant factor in the choice of Rhodia. If things go according to plan, by the end of the year we will end up with one-third of our sales in Europe, one-third in Asia, and one- third in the Americas. That will be a unique position in the global chemical industry. Asia gets a lot of attention these days, of course, but we shouldn’t forget that North America is also a very attrac- tive market because of the very favorable energy scenario which has developed there over the last three to four years. Energy is the key input factor for a large number of our chemical products.
The Quarterly: How do you ensure that Solvay stays focused on these high-growth opportunities?
Jean-Pierre Clamadieu: The fact that our headquarters is in Brussels and that our top team is still largely European in origin and culture means it is a challenge. We’re organized into global busi- ness units, or GBUs, not regions, so it is up to each GBU separately to make sure that it has a clear strategy for what Asia and Latin and North America can offer. The job of the corporate team, mean- while, is to give GBUs the right amount of resources and make sure we exploit our group synergies.
Twelve of our 17 GBUs already operate in Asia—an example is our specialty-polymers business, for which the region is a particular priority. That global business unit has grown historically out of Europe and North America, but it’s likely that 40 percent of its sales

71Tilting the global balance: An interview with the CEO of Solvay
will soon be in Asia. So the business is scrambling to develop its Asian teams, something that is certainly much easier thanks to the fact that Solvay, as a group, already has around 5,000 people in Asia, of whom about 3,000 are in China. We also have assets, like our large R&D lab in Shanghai. We have some excellent Chinese executives in the other businesses who are helping with the recruitment.
The Quarterly: Is talent a constraint in these markets?
Jean-Pierre Clamadieu: Solvay has been in Brazil for more than 90 years, China for about 30, and South Korea for 35. In all these countries, we have mostly locals in the key jobs. We bring Westerners in for short, very specific assignments, but the days of sending expatriates in large numbers are largely past. The challenge is that whereas 30 years ago there were few Western companies in a country like China, today most multinationals are there, Chinese companies are developing very fast, and the job market is very competitive. We have to work harder than ever to demonstrate that we can offer local talents a rewarding and exciting career path and opportunities to develop their skills.
The Quarterly: How do you get the best people in the Solvay group as a whole matched with the most exciting opportunities in the business units?
Jean-Pierre Clamadieu: In some ways, capital is easier to reallocate than people—you can sit in Brussels, look at the annual capital flows of the different businesses, and act accordingly. With people, there is always a tendency to manage in geographic or business “silos.” That’s why we have recently established a new principle: that the top 300 people in the group are corporate assets. That means we will take a corporate view, obviously in discussion with the GBUs, about the best role for these key individuals. The ten- dency up to now has been for each business to want to hang on to the good ones. In my view, though, it’s important that we offer our top people the chance to contribute to different businesses and acquire different know-how. I am still rather amazed when I travel around and someone says, “This guy started his career in chemicals; now he is in plastics. That’s incredible!” This should be the rule, not the exception.

72 2013 Number 4
The Quarterly: How do you actually manage the capital-reallocation process?
Jean-Pierre Clamadieu: Following the acquisition of Rhodia by Solvay, we ended up with a large and diverse set of activities, so it was important to establish at the outset the strategic intent for each one. Which ones would be growth engines? Which ones sustainable cash generators? And which ones were struggling?
This exercise led to the development of what we call a five-year strategic road map, which we will update each year. In some cases, that update is simple because things have worked out much as we expected; in other cases, it calls for a brand-new road map because the industry environment has changed. The annual review allows us to see where the units are allocating their resources, which ones
BIO
Jean-Pierre Clamadieu
Vital statistics Born August 15, 1958, in Chambéry, France
Education Graduated with a degree in engineering in 1983 from the Ecole Nationale Supérieure des Mines de Paris
Career highlights Solvay (2011−present)
CEO (2012−present)
Vice chairman of the executive committee (2011−2012)
Rhodia (2003−11)
Chairman (2008−11)
CEO (2003−11)
Fast factsAwarded the title of Chevalier of the Légion d’honneur in 2005
Serves as chairman of the Mouvement des Entreprises de France’s (MEDEF) Sustainable Development Commission
Serves as a vice president on the board and executive committee of the European Chemical Industry Council
Sits on the board of directors for Faurecia and AXA

73Tilting the global balance: An interview with the CEO of Solvay
are generating cash, which ones consuming cash, and whether the overall financial equation makes sense for the group. Out of this, we are able to see where the capital is flowing and what capital expenditure is required for the individual GBUs.
These annual discussions are intended to send a clear signal to the different management teams: if we agree that you are going to grow, tell us what resources are needed; if we agree that you are there to generate cash and maintain your industry position, you equally know what’s expected. Where businesses are struggling—which inevitably they are in the economic environment of mid- 2013—you have to make midterm strategic adjustments. An example of this is that by the end of the year, we hope to have constituted a 50–50 joint venture in polyvinyl chloride with INEOS, a leading industry player.
The Quarterly: Do you think managing this sort of change is more difficult in Europe than in North America?
Jean-Pierre Clamadieu: It is true we have certain regulations, particularly social ones, which make movement and change more complex. But this is just the way everyone in Europe has to operate. Europe has its place, and exciting things are happening here too. A significant number of our R&D facilities are located in this region, we have excellent relationships with universities here, and innovations continue to flow from our European labs. Even though automotive-industry volumes are suffering in Europe, it is still by far the global leader in technology and innovation. When our businesses come up with innovations linked to automotive, the first markets to respond are in Europe. The reality of Solvay is that we are based in Europe and we have a European culture. There is no reason to fight that reality. We have to fight to maintain the competitiveness of our operations here, and we can’t and don’t want to put chemical assets on a boat and ship them to Asia or North America.
The Quarterly: How do you manage your own time to keep that global perspective?
Jean-Pierre Clamadieu: I obviously travel around the group. But I am starting to wonder if the classic two- to three-day business

74 2013 Number 4
trip is still the right way to get this sort of global exposure. For the moment, the priority for Solvay’s executive committee is probably to spend time together and to learn to work as a team. The next step, though, could be for members of the top team to spend more signifi- cant amounts of time in different geographies. Two to three weeks in a place like Shanghai or Singapore, for example, allows you not only to sit down with local managers but to get to know key sup- pliers and customers.
I find it quite frustrating when I look at my calendar and see so many dates for next year that are “must do.” It’s good to organize ahead, of course, but doing so sometimes inhibits flexibility. I am sure it’s going to make more sense in the future to take longer trips, and I am now starting to prepare for 2014 with this mind-set. A couple of months ago, I met the global COO of a large Europe-based consumer- goods group who is based permanently in Singapore. After a couple of hours with him, I realized how being based in the European headquarters of a global company gives you a completely different outlook. I am not planning to move to Singapore, but with the benefit of high-quality video and other technology, these days I think we need to spend less time at HQ and longer periods in different regions of the world.
The Quarterly: How do you think about your own role in the transformation?
Jean-Pierre Clamadieu: Broadly speaking, there are two types of things that I can do as CEO of a global group like Solvay, and it’s very important to keep a balance between them. The first is what I would describe as conceptual work: developing strat- egies with colleagues, preparing plans for better operations and processes, thinking about the appropriate interventions to change the culture. The second role is to be an active change agent in aligning people’s energy with the group’s priorities: meeting employees, meeting customers, meeting public officials. There’s an important loop here—what I get out of an interaction with stakeholders informs the next conceptual exercise and vice versa. It’s what makes the job fascinating and rewarding. One day you are thinking about high- level strategy, the next day you are at a plant explaining to people why they should follow you.

75
In the 18 months since the integration of Solvay and Rhodia got under way, we have pushed ahead simultaneously on developing a common culture for the enlarged group, on devising a new strategic direction for the businesses, and on driving operational improvements. It would have been easier for us to have moved sequentially—to spend the first two years on integration, the next two on operational excellence, and then get around to thinking about strategy and portfolio management in years five and six. Our markets are changing quickly, and there is no alternative but to move forward in parallel. The destination is probably changing as fast as we are moving.
The Quarterly: Solvay celebrates its 150th anniversary this year. Has this prompted any reflections?
Jean-Pierre Clamadieu: There is a saying that nice trees have strong roots—and I think that’s a good image. It’s interesting that in the same year, we can both celebrate our 150th birthday and make important changes. The history makes me more confident that the transformation will be successful. Looking back, the group has taken many different turns and made many breakthroughs.
Some people think that for the first 150 years of Solvay’s existence life was nice and simple and that now everything is changing. That’s just not the reality. Before World War I, we were already very international—indeed, we were the largest multinational in the world— but over the years we have faced a lot of challenges and entered and exited many businesses. The one constant is that we have been supported by long-term-minded family shareholders. My mandate is very clear: to carry out the necessary actions so that in 20, 30, and 50 years Solvay remains a leader in the global chemical industry, an industry that is likely to be very different from what it is today.
Tilting the global balance: An interview with the CEO of Solvay
This interview was conducted by Hervé de Barbeyrac, an associate principal in McKinsey’s Paris office, and Ruben Verhoeven, a director in the Antwerp office.
Copyright © 2013 McKinsey & Company. All rights reserved.

Art
wor
k by
Jac
opo
Ros
atti

77
Brad Brown, David Court, and Paul Willmott
Leadership-capacity constraints are undermining many
companies’ efforts. New management structures, roles, and
divisions of labor can all be part of the solution.
The problem
As data and analytics transform the
business landscape, they place a
range of new demands on top teams,
which often lack the management
capacity to respond.
Why it matters
Without sufficient senior leadership,
it’s difficult to catalyze the
widespread organizational change
needed to capture data-analytics
opportunities.
What to do about it
The biggest leadership gaps span
six areas. Decide how to fill them by
assessing the importance of
centralized databases and analytics
resources, as well as the ability
of business-unit leaders to drive front-
line change. Then take action by
enhancing the mandates of existing
functional or business-unit leaders,
adding new roles to provide support
for them, or creating new top-
management capacity such as a
chief data or analytics officer.
Mobilizing your C-suite for big-data analytics

78 2013 Number 4
Over the past 30 years, most companies have added new C-level roles in response to changing business environments. The chief financial officer (CFO) role, which didn’t exist at a majority of com- panies in the mid-1980s, rose to prominence as pressures for value management and more transparent investor relations gained traction.1 Adding a chief marketing officer (CMO) became crucial as new channels and media raised the complexity of brand building and customer engagement. Chief strategy officers (CSOs) joined top teams to help companies address increasingly complex and fast- changing global markets.
Today, the power of data and analytics is profoundly altering the business landscape, and once again companies may need more top- management muscle. Capturing data-related opportunities to improve revenues, boost productivity, and, sometimes, create entirely new businesses puts new demands on companies—requiring not only new talent and investments in information infrastructure but also significant changes in mind-sets and frontline training.2 It’s becoming apparent that without extra executive horsepower, stoking the momentum of data analytics will be difficult for many organizations.
Because the new horizons available to companies typically span a wide range of functions, including marketing, risk, and oper- ations, the C-suite can evolve in a variety of ways. In some cases, the solution will be to enhance the mandate of the chief information, marketing, strategy, or risk officer. Other companies may need new roles, such as a chief data officer, chief technical officer, or chief analytics officer, to head up centers of analytics excellence. This article seeks to clarify the most important tasks for executives playing those roles and then sets out some critical questions whose answers will inform any reconfiguration of the C-suite. Daunting as it may seem to rethink top-management roles and responsibilities, failing to do so, given the cross-cutting nature of many data-related opportunities, could well mean jeopardizing top- or bottom-line growth and opening the door to new competitors.
1 For more on the rise of the CFO role, see Dirk Zorn, “Here a chief, there a chief: The rise of the CFO in the American firm,” American Sociological Review, 2004, Volume 69, Number 3, pp. 345–64.
2 See Dominic Barton and David Court, “Making advanced analytics work for you,” Harvard Business Review, 2012, Volume 90, Number 10, pp. 79–83; and David Court, interview with Frank Comes, “Putting big data and analytics to work,” September 2012, mckinsey.com.

79Mobilizing your C-suite for big-data analytics 79
Six top-team tasks behind data analytics
Crafting and implementing a big-data and advanced-analytics strategy demands much more than serving up data to an external provider to mine for hidden trends. Rather, it’s about effecting widespread change in the way a company does its day-to-day busi- ness. The often-transformative nature of that change places serious demands on the top team. There’s no substitute for experienced hands who can apply institutional knowledge, navigate organiza- tional hazards, make tough trade-offs, provide authority when deci- sion rights conflict, and signal that the leadership is committed to a new analytics culture. In our experience, the concerted action that’s required falls into six categories. Leaders should take full measure of them before assigning responsibilities or creating roles.
Establishing new mind-setsSenior teams embarking on this journey need both to acquire a knowledge of data analytics so they can understand what’s rapidly becoming feasible and to embrace the idea that data should be core to their business. Only when that top-level perspective is in place can durable behavioral changes radiate through the organization. An important question to ask at the outset is “Where could data ana- lytics deliver quantum leaps in performance?” This exercise should take place within each significant business unit and functional organi- zation and be led by a senior executive with the influence and authority to inspire action.
Leaders at one large transportation company asked its chief strategy officer to take charge of data analytics. To stretch the thinking and boost the knowledge of top managers, the CSO arranged visits to big data-savvy companies. Then he asked each business unit to build data-analytics priorities into its strategic plan for the coming year. That process created a high-profile milestone related to setting real business goals and captured the attention of the business units’ executives. Before long, they were openly sharing and exploring ideas and probing for new analytics opportunities—all of which helped energize their organizations.
Defining a data-analytics strategyLike any new business opportunity, data analytics will underdeliver on its potential without a clear strategy and well-articulated initiatives and benchmarks for success. Many companies falter in

80 2013 Number 4
this area, either because no one on the top team is explicitly charged with drafting a plan or because there isn’t enough discussion or time devoted to getting alignment on priorities. At one telecommuni- cations company, the CEO was keen to move ahead with data analytics, particularly to improve insights into customer retention and pricing. Although the company moved with alacrity to hire a senior analytics leader, the effort stalled just as quickly. To be sure, the analytics team did its part, diving into modeling and analysis. However, business-unit colleagues were slow to train their midlevel managers in how to use the new models: they didn’t see the poten- tial, which, frankly, wasn’t part of “their” strategic priorities.
As we have argued previously,3 capturing the potential of data ana- lytics requires a clear plan that establishes priorities and well-defined pathways to business results, much as the familiar strategic-planning process does. Developing that plan requires leadership. At a North American consumer company, the CEO asked the head of online and digital operations, an executive with deep data knowl- edge, to create the company’s plan. The CEO further insisted that it be created in partnership with a business-unit leader who was not familiar with big data. This partnership—combining a data and analytics expert and an experienced frontline change operator—ensured that the analytics goals outlined in the plan were focused on actual, high-impact business decisions. Moreover, after these executives shared their progress with top-team counterparts, their collaborative model became a blueprint for the planning efforts of other business units.
Determining what to build, purchase, borrow, or rentAnother cluster of decisions that call for the authority and experience of a senior leader involves the assembly of data and the construc- tion of advanced-analytics models and tools designed to improve per- formance. The resource demands often are considerable. With multitudes of external vendors now able to provide core data, models, and tools, top-management experience is needed to work through
“build versus buy” trade-offs. Do strategic imperatives and expected performance improvements justify the in-house development and ownership of fully customized intellectual property in analytics? Or is reaching scale quickly so important that the experience and
3 See Stefan Biesdorf, David Court, and Paul Willmott, “Big data: What’s your plan?,” McKinsey Quarterly, 2013 Number 2, mckinsey.com.

81Mobilizing your C-suite for big-data analytics 81
talent of vendors should be brought to bear? The creation of powerful data assets also can require the participation of senior leadership. Locking in access to valuable external data, for instance, may depend on forging high-level partnerships with customers, suppliers, or other players along the value chain.
The radically diverging paths different retailers have chosen under- score the range of options leaders must weigh. Several retailers and analytics firms have established long-term contracts covering a broad sweep of analytics needs. Other large players, both brick- and-mortar and online, have invested in deep internal data and ana- lytics expertise. Each of these choices reflects a dynamic set of strategic, financial, and organizational requirements that shouldn’t be left to middle management.
Securing analytics expertiseUnder almost any strategic scenario, organizations will need more analytics experts who can thrive amid rapid change. The data-analytics game today is played on an open and (frequently) cloud-based infrastructure that makes it possible to combine new external and internal data readily and in user-friendly fashion. The new environment also requires management skills to engage growing numbers of deep statistical experts who create the predictive or optimization models that will underwrite growth.
The hunt for such talent is taking place in what has become the world’s hottest market for advanced skills. Retaining these valued employees and then getting them to connect with business leaders to make a real difference is a true top-management task—one that often demands creative solutions. The leader of a big-data campaign at a major consumer company, for instance, decided to invest in an analytics unit distant from company headquarters. This other locale had abundant talent and a cultural environment preferred by data scientists and engineers. The leader then closed the loop, ensuring that each unit of the analytics team had a direct connection to a business-unit team at the company.
Mobilizing resourcesCompanies often are surprised by the arduous management effort involved in mobilizing human and capital resources across many functions and businesses to create new decision-support tools and

82 2013 Number 4
help frontline managers exploit advanced analytics models. An empowered senior player is vital to breaking down the institutional barriers that frequently hamper efforts to supercharge decisions through data analytics. Success requires getting a diverse group of managers to coalesce around change—encouraging alignment across a wide phalanx of IT, business-lines, analytics, and training experts. The possibility of failure is high when companies don’t commit leadership.
Take the example of a second transportation company, where middle managers across product areas were tasked with identifying data-analytics opportunities and then pushing them forward. The analytics managers were routinely frustrated when data teams failed to deliver data on schedule or in usable formats. When it came time to embed the resulting analytics into customized tools, managers faced additional frustrations as urgent requests worked their way through routine budgeting and planning processes. The company gave the task of stepping up the pace of its analytics agenda to a top marketing and sales executive, who assembled cross-functional teams including database managers, analysts, and software programmers. The teams rotated across analytics opportunities, steering them from launch to implementation in six- to eight-week bursts. Through this rapid mobilization, the company checked off several analytics priorities only months after the marketing leader took charge.
Building frontline capabilitiesThe sophisticated analytics solutions that statisticians and scientists devise must be embedded in frontline tools so simple and engaging that managers and frontline employees will be eager to use them daily. The scale and scope of this adoption effort—which must also involve formal training, on-the-job coaching, and metrics that clearly define progress—shouldn’t be downplayed. In our experience, many com- panies spend 90 percent of their investment on building models and only 10 percent on frontline usage, when, in fact, closer to half of the analytics investment should go to the front lines.
Here, again, we have seen plenty of cases where no one on the top team assumed responsibility for sustained ground-level change. Lacking senior accountability and engagement, one financial-services company weathered several waves of analytics investment and interest only to have efforts fizzle when training and adoption fell short. Dismayed, business-unit leaders then took charge, investing

Mobilizing your C-suite for big-data analytics 83
in ongoing training sessions for managers and end users, pushing for the constant refinement of analytics tools, and tracking tool usage with new metrics. Over time, thanks to the consistent application of analytics, the transformation effort gained the hoped-for momentum.
Putting leadership capacity where it’s needed
As companies size up these challenges, most will concede that they need to add executive capacity. But that leaves unanswered important decisions about where, exactly, new roles will be located and how new lines of authority will be drawn. As we’ll outline below, our expe- rience shows that companies can make a strong case for leading their data-analytics strategies and talent centrally or even for estab- lishing a formal data-analytics center of excellence. However, frontline activities (mobilizing resources, building capabilities) will need to take place at the business-unit or functional level, for two reasons. First, the priorities for using data analytics to increase revenues and productivity will differ by business. Second, and just as important, companies best catalyze frontline change when they connect it with core operations and management priorities and reinforce it with clear metrics and targets.
Beyond this bias for pushing frontline mobilization responsibility to business units, there is no single prescription for where and how a company should add leadership capacity. Given the relative imma- turity of data-analytics applications, that shouldn’t be surprising. Yet as leaders review their options, they needn’t fly blind. Pushing for answers to three key questions, in our experience, brings strategic clarity to the needed organizational changes:
1. Will a central customer or operational database be used across business units?
2. Is there a compelling need to build substantial analytics resources internally to retain talent and build proprietary assets and advantages?
3. Within each business unit, can the current functional executives handle the change-management challenge or should the com- pany dedicate new executive capacity specifically for the data-analytics change effort?

84 2013 Number 4
We’ll illustrate the importance of these issues through examples of companies that have addressed them in different ways.
When central data assets are key At many consumer-services businesses, exploiting analytics involves combining transaction data across a number of businesses or channels. That approach allows these companies to shape insights such as how consumers engage with Web sites or decide between shopping online or in stores. These companies often have (or are building) new central data warehouses or data environments, as well as related data-management capabilities. In addition, they often are working through new rules of the road on issues such as how they can access data while protecting consumer privacy or ensure that key cus- tomers aren’t hassled by unnecessary contacts.
In such cases, an enhanced role for the CIO—spearheading the development of the data-analytics strategy and talent building—is a popular path. Operationally, the CIO takes charge of efforts to develop the data and analytics infrastructure while letting the business units mobilize change aimed at exploiting it.
At one multibusiness consumer-services company, for instance, the board and senior-leadership team recognized that a significant step-up in performance could be achieved if it fully exploited analytics opportunities across business lines by harnessing its multi- channel databases. Recognizing the overarching role that the central databases play in the company’s agenda, the leadership desig- nated the chief information officer to direct the effort and to define the data and analytics strategy.
The leaders realized that each business unit, by necessity, would have its own targeted analytic priorities, such as strengthening pro- motional offers or optimizing inventory levels. Moreover, a differ- ent group of managers would be applying the insights across business units. The leadership concluded that under these circumstances, managing analysis and frontline training from the center would be a mistake and decided instead that the CIO should partner with business-unit leaders, sharing with them a tiered set of responsibilities.
At present, the CIO is immersed in two key projects. The first is creating a new infrastructure that unites the company’s multichannel

85Mobilizing your C-suite for big-data analytics
transaction data with external social-media and competitive infor- mation and delivers the result to business units through an intuitive interface. The second involves building up analytics expertise that can be assigned to different business units but managed centrally, at least for the next couple of years as the effort gains critical mass. The analytics team is led by a deeply experienced executive who reports to the CIO and provides a crucial injection of top-management capacity. In parallel, business-unit leaders are hammering out analytics priorities and building the skills of frontline managers who will use new models to, for example, redirect spending across media channels.
When substantial internal analytics expertise is core to performanceWe are also seeing a second approach, which shares some of the centralized aspects we touched on above but specifically involves companies that decide to build rather than outsource a critical body of advanced analytics expertise. That decision often leads organi- zations to locate the expertise centrally, where it serves as a common platform for creating value across business units.
At one consumer-facing company, analytics expertise and leadership were concentrated in the finance and risk-management team, which historically had accounted for significant data-related value creation. When the company began pursuing a more aggressive analytics strategy, the CFO took responsibility for several tasks, including defining the basic strategy, overseeing make-versus-buy decisions for the core risk-management analytics tools, mobilizing resources within the function’s analytics team, and building expertise.
However, having made these primary decisions about analytics, the CEO and CFO soon realized that significant complementary efforts were needed to secure better data for the analytics team and to reinforce change efforts and revamp several processes across the business units. To lead these initiatives, they established a new position—chief data officer—within the CFO’s organization. This CDO proactively manages information, working with business managers to identify both internal and external data they may not even realize exists. Delivered ready for analysis, the data can be applied rapidly to needed tasks by modeling experts and, just as important, continually refreshed for new experiments and broader application. Many companies may find they need this type of

86 2013 Number 4
leadership to support business leaders as they identify sources of data-driven advantages, work through analytics priorities, and try to accelerate frontline adoption.
When managing scale and complexity within business units is paramount
Whether elements of the effort are managed centrally or not, much of the data-analytics heavy lifting will fall on business or functional leaders within individual business units. A core question at the business-unit level is whether to add a new role or ask a key functional leader (such as the CMO or the head of operations) to add new responsibilities to what in all likelihood is already a pretty full plate.
When the senior leaders of a large financial-services company took a wide-ranging look at its strategy, they decided that one business unit could gain a significant competitive edge if it doubled down on data analytics. To push the strategy ahead decisively, the company recruited a chief analytics officer, who reports to the business-line president and oversees a new center of excellence drawing on internal consultants, analytics modelers, and software programmers.
This approach, which represents a significant organizational change, is accelerating the business unit’s data-transformation effort. As a top-team member, the CAO can drive a broad range of decisions, from setting analytics strategy to defining the responsibilities of frontline managers. Since the center of excellence spans multiple disciplines, the CAO can mobilize analytics and software-programming resources swiftly, which has sped up the creation of frontline tools. Meantime, operating from within the business unit has given him a deeper understanding of what makes it tick—its priorities, patterns of working, and ongoing challenges. This has paid off in sharper decisions about which tools to develop and a keener sense of the skills that training programs need to foster. The fact that the business unit’s leaders are engaged with the CAO on a day-to-day basis helps keep them focused on their analytics and adoption agendas.
Building on this success, the company has recently taken the further step of adding another new role, a chief data officer, who reports to

87Mobilizing your C-suite for big-data analytics
the CIO but works daily with the chief analytics officer to help knit together data and new analytics tools and to speed frontline change.
For companies pursuing the potential of data analytics, a decision about leadership capacity looms—regardless of where in the end they decide to place it. For some, such as the consumer-facing com- panies described earlier, current top-team members will be asked to step up and assume broader leadership responsibilities, often with additional support from new, senior lieutenants. For others, such as the financial-services company we explored, establishing one or more new senior posts to drive the analytics agenda will be the best solution.
At all companies, top teams, and probably board members as well, need a better understanding of the scale of what’s needed to ensure data-analytics success. Then they must notch these responsibilities against their existing management capacity in a way that’s sensitive to the organization’s core sources of value and that meshes with existing structures. None of this is easy, but it’s the only serious way to pursue data analytics as a new frontier for growth.
The authors would like to acknowledge the contributions of Matthew Ariker, Amit Garg, Joshua Goff, Lori Sherer, and Isaac Townsend to the development of this article.
Brad Brown is a director in McKinsey’s New York office, David Court is a director in the Dallas office, and Paul Willmott is a director in the London office.
Copyright © 2013 McKinsey & Company. All rights reserved.

Jacques Bughin and James Manyika
Although largely uncounted, intangible digital assets
may hold an important key to understanding competition
and growth in the Internet era.
Measuring the full impact of digital capital

Measuring the full impact of digital capital 89
On July 31, 2013, the US Bureau of Economic Analysis released, for the first time, GDP figures categorizing research and development as fixed investment. It joined software in a new category called intellectual-property products.
In our knowledge-based economy, this is a sensible move that brings GDP accounting closer to economic reality. And while that may seem like an arcane shift relevant only to a small number of economists, the need for the change reflects a broader mismatch between our digital economy and the way we account for it. This problem has serious top-management implications.
To understand the mismatch, you need to understand what we call digital capital—the resources behind the processes key to developing new products and services for the digital economy. Digital capital takes two forms. The first is traditionally counted tangible assets, such as servers, routers, online-purchasing platforms, and basic Internet

90 2013 Number 4
software. They appear as capital investment on company books. Yet a large and growing portion of what’s powering today’s digital economy consists of a second type of digital capital—intangible assets.
They are manifold: the unique designs that engage large numbers of users and improve their digital experiences; the digital capture of user behavior, contributions, and social profiles; the environments that encourage consumers to access products and services; and the intense big-data and analytics capabilities that can guide operations and business growth. They also include a growing range of new business models for monetizing digital activity, such as patents and processes that can be licensed for royalty income, and the brand equity that companies like Google or Amazon.com create through digital engagement.
Conventional accounting treats these capabilities not as company investments but as expenses, which means that their funding isn’t reflected as capital. Since the amounts spent aren’t amortized, they take a large bite out of reported income. Spending on those capa- bilities sometimes should be treated as capital, though, since they can be long-lived. Amazon.com’s development of an internal search process that promotes recurring sales or the efforts of Netflix to fine-tune personal recommendations to increase video viewing and retain customers are certainly more than expenses. Such capa- bilities, which are complex to build and replicate, can often help companies create enduring competitive strengths.
We’re acutely aware of misguided efforts to justify sky-high valuations during the late-1990s Internet bubble by claiming that finance and accounting fundamentals were no longer relevant. We also recognize that we’re far from the first to note the relationship among intan- gibles, company-level growth and productivity, and overall economic growth.1 What we want to suggest here is that those relationships, which once represented a small minority of business activities, are becoming the rule in the digital economy. In fact, much of today’s digital spending could pay for long-lived intangible assets that will
1 See, for example, Lowell L. Bryan, “The new metrics of corporate performance: Profit per employee,” McKinsey Quarterly, 2007 Number 1, mckinsey.com. At a country level, see Carol Corrado and Charles Hulten, “How do you measure a ‘technological revolution’?,” American Economic Review, 2010, Volume 100, Number 5, pp. 99–104.
91Measuring the full impact of digital capital 91
define the competitive landscape going forward.2 The rising stakes are seen in the copyright battles between Internet and consumer-electronics companies and in major spending on patent portfolios.
Above all, we want to emphasize the importance, for many business leaders, of making the mind-set shift required to embrace the importance of digital capital fully. The disruptive nature of digital assets is intensifying in markets such as search, e-commerce, and social media (where attackers can build business models with near-limitless scale). Disruptive digital assets are also impor- tant in segments where behavioral data and user participation can be monetized, by defining entirely new business opportunities or fostering breakthroughs in collaborative innovation. As the mobile- payments start-up Square is demonstrating in the credit-card arena, increasingly, companies that deploy these assets have the potential to threaten large existing profit pools thanks to the challengers’ vastly different economics or radically new ways of doing things.
The big picture
There are parallels between what’s occurring today and during the period, 100 years ago, when electric motors gained widespread adoption. Early in that cycle, companies invested in physical motors, which like today’s servers and routers provided a new growth platform. But the more important kind of value appeared after com- panies began to understand how motors could change almost every process, improve productivity, and stimulate innovation. Com- panies that captured these benefits were more successful and more valuable than others.
Today, the market valuations of many Internet-based companies are higher than those of their counterparts in other sectors, including high tech. Many Internet leaders earn lower returns on equity than established technology companies do, yet there’s no reason to
(continued on page 94)
2 It’s noteworthy that today’s valuations coincide with the equity markets’ slow recovery from their financial-crisis doldrums. In the late 1990s, when the relative importance of intangibles seemed to be on a continuous upward trajectory, market conditions were quite different.

The valuation premium investors
place on digitized companies
becomes clearer when intangible
assets are counted as invest-
ments rather than expenses. To
illustrate this point, we’ll define
three pro-forma companies. The
first, Company A, represents
a baseline: a publicly quoted enter-
prise that mirrors the US econ-
omy across several business variables
as compiled by researchers at
NYU’s Stern School of Business.1
These variables include total
value added,2 employee costs, invest-
ments, depreciation, debt levels,
the cost of capital, five-year earnings-
growth rates, and taxation.
By early 2013, this pro-forma
company was generating a return
above its cost of capital in the
range of 4 percent. Recently, earnings
had grown by 3.8 percent a year.
Although the market valued the com-
pany at 2.1 times its book capital,
historical accounting data suggest
that the computed ratio of equity
value to book capital should be more
like 1.5. Why the gap? Our thesis is
that intangible capital is now creating
both additional capital and greater
marginal returns on it. Highly efficient
financial markets recognize this
and therefore credit the company
with improved growth prospects.
We explore this hypothesis through
Company B, which matches our
first pro-forma one except that we
assume a different stock of and
growth rate for invested intangible
capital. Here we use estimates by
Carol Corrado and Charles Hulten.3
As the exhibit shows, recognizing
the intangible capital at work bridges
much of the valuation gap. That’s
true even though the return on total
equity remains flat—intangible-
capital returns for Company B are
roughly the same as those for
tangible capital—and intangible
capital depreciates at an accelerated
rate, over 7 rather than 20 years.
Implicit in the multiple that helps
to close the valuation gap is a higher
prospective growth rate: 4.3 per-
cent a year.
Finally, we push the analysis to a
strong digital player, Company C. Its
digital-capital investment, calcu-
lated using estimates from our own
research, is one-third of its total
capital; two-thirds of that digital cap-
ital is intangible. As a conse-
quence of fast-changing digital com-
petition, assets are depreciated
even more quickly, so Company C’s
total net capital will be smaller
than Company B’s. Yet even with a
smaller capital base, the valuation
gap is closed, since the shift in the
asset mix toward digital capital
boosts the company’s earnings-
growth rate to 5.5 percent. A large
part of the premium results from
the higher returns (and growth pros-
pects) flowing from digital capital.
Of course, this result, like all of the
preceding analysis, simply confirms
Valuation and intangibles: Viewing the numbers differently
92 2013 Number 4

the core principle of corporate
finance: value creation is a function
of returns on capital and rates of
growth.4 The scenarios and assump-
tions that we’ve described here
in accounting terms (to illustrate the
implications of thinking about
digital capital in different ways) also
reflect the bedrock reality that,
ultimately, only improving cash
flows can create value.
93Measuring the full impact of digital capital 93
Treating intangible investments as assets rather than expenses acknowledges the value added by digital capital and helps explain typical market valuations.
Adding either intangibles or digital capital to the valuation restates equity and implied growth rates, explaining the difference.
Yet, analysis based on historical data and traditional accounting assumptions for tangible capital suggests:
Q1 2013Digital capital Exhibit 1 of 1
Pro-forma analysisof a public enterprise that mirrors the US economy across several business variables1 yields:
1 Based on research by Aswath Damodaran.2Numbers are approximated for simplicity of communication.3Based on US estimates.
Source: Aswath Damodaran, “Valuing companies with intangible assets,” New York University Stern School of Business, September 2009; Carol Corrado and Charles Hulten, “How do you measure a ‘technological revolution’?,” American Economic Review, 2010, Volume 100, Number 5, pp. 99–104; McKinsey analysis
Book valueof capital
59(tangible)
Market value 124
Price-to-book ratio
x 2.1
59(tangible)
89
x 1.5
82(tangible + intangible)
123
x 1.5
71(tangible + digital)
Mix of tangibleand digital capital(2/3 of whichis intangible)
Mix of tangibleand intangiblecapital3
Differences in the price-to-book ratio fordifferent mixes of tangible and intangiblecapital reflect growth assumptionsassoicated with those capital forms.2
121
x 1.7
Company A1 Company A2 Company B Company C
1 Aswath Damodaran, “Valuing companies with intangible assets,” New York University Stern School of Business, September 2009. The author has also compiled a large data set, which we used subsequently in this analysis. See “The Data Page,” on stern.nyu.edu.
2 Value added in this case is defined as revenue minus all cost of goods sold.
3 Carol Corrado and Charles Hulten, “How do you measure a ‘technological revolution’?,” American Economic Review, 2010, Volume 100, Number 5, pp. 99–104.
4 See Richard Dobbs, Bill Huyett, and Tim Koller, “The CEO’s guide to corporate finance,” McKinsey Quarterly, 2010 Number 4, mckinsey.com.

94 2013 Number 4
believe that markets are making irrational bets on the growth poten- tial of digitally adept companies. As the sidebar “Valuation and intangibles: Viewing the numbers differently” illustrates, treating dig- ital intangibles as assets rather than expenses clarifies the logic behind valuations. (We based these pro-forma valuation calculations on data compiled by academic researchers, as well as assumptions about rates of intangible and digital investment from our own and outside research.)
Macroeconomic studies we have done suggest that digital capital is growing rapidly.3 We examined the national-accounts data of 40 countries, assigning values to tangible and intangible assets. In 2005, digital-capital investment represented barely 0.8 percent of GDP for those countries. This year, it will exceed 3.1 percent of GDP. Likewise, the accumulating global value of digital-capital investments has reached more than $6 trillion, about 8.5 percent of nominal world GDP. Globally, levels of digital intangible invest- ment are more than half those of digital tangible investment. In more highly digitized economies, such as Israel, Japan, Sweden, the United Kingdom, and the United States, spending on intangibles represents two-thirds of digital capital’s total value.
This activity is also starting to become a major contributing factor in global economic growth. We estimate that digital capital is the source of more than one percentage point of global GDP growth (roughly one-third of total growth). Intangible capital already accounts for two-thirds of that slice, tangible investment for the rest. This growth flows from not only capital deepening but also increased labor productivity—a remarkable thing, since the digital economy has emerged in the relatively brief space of 15 years. By contrast, it took 80 years for steam engines to increase labor productivity to the same extent, about 40 for electricity, and more than 20 for conventional information and communications technologies.4 (For more on the relationship between capital
3 See the McKinsey Global Institute report Internet matters: The Net’s sweeping impact on growth, jobs, and prosperity, May 2011, mckinsey.com.
4 For more details on the estimated impact of global technologies on growth, see Nicholas Crafts, “Fifty years of economic growth in Western Europe: No longer catching up but falling behind?,” World Economics, 2004, Volume 5, Number 2, pp. 131–45; and Nicholas Bloom, Mirko Draca, Tobias Kretschmer, John Van Reenen, and Raffaella Sadun, The Economic Impact of ICT, Centre for Economic Performance, London School of Economics and Political Science, 2010.

Measuring the full impact of digital capital 95
formation and productivity, see sidebar “Innovation, capital, and productivity growth.”)
Navigating the new terrain
Intangible digital capital’s role in economic growth gives policy makers one more reason to favor investments in broadband and other forms of Internet infrastructure. Such investments correlate strongly with overall digital-capital levels. In our experience, though, the implications are even greater for executives, who often are not tuned into their organizations’ digital strengths or weakness. Few com- panies have gone through the internal exercise of reclassifying expen- ditures or segregating benefits from spending on intangibles. And of course, companies can boast a high ROE thanks to strong legacy-product margins but may nonetheless have muted growth prospects as a result of underinvesting in digital capital. To set a more effective digital course, leaders should consider the following ideas.
Take stock of your assetsSince identifying intangible assets is difficult, companies may be missing growth opportunities. Many have realized only recently that they can use social-media interactions with their best customers to leverage innovation efforts or that they may have unused data they could restructure into valuable big-data assets to sharpen business strategy. Similarly, companies should take stock of how digital capital they don’t own may be relevant to the business. A retailer that doesn’t have access to digital behavioral data on consumers, for example, may be at a disadvantage. So could a bank whose customers access products through a third-party platform that limits the bank’s ability to capture information.
Conversely, companies may wrongly assume that their growth results from conventional capital spending and therefore compromise growth by underinvesting in digital competencies. One online company, for example, stuck to a subscriber pay model in hopes of boosting returns on tangible investments such as server farms. It wound up missing a massive social-networking opportunity that would have yielded far greater returns on advertising revenues.
96 2013 Number 4
Our global research shows that the stock of intangible assets varies considerably by region. Some markets have larger numbers of strong digital contenders, others fewer. Companies could make those differences a factor in deciding which markets to enter and where to place digital bets.
Face up to looming threatsAssume that digital leaders in your competitive zone are relentlessly expanding their intangible assets both to attack existing markets and to create new ones. Amazon.com, for instance, won share from brick-and-mortar retailers with its ease-of-purchase model and its ability to reach long-tail customers. Now it’s launching new business models (such as Amazon Prime) to further leverage its user base and logistics capabilities. It’s also using tangible server assets to offer cloud-based labor services (Mechanical Turk) that match freelance workers with demand for their labor.
A good first step is to identify which areas of your value chain are most vulnerable—for example, service delivery or weak digital brands. Competitors can slide vertically or horizontally into large gaps, so you’ll need to build digital assets quickly as a counterweight. Even companies that have a considerable stock of digital assets should understand that capturing value from them isn’t a given. Instead, such companies must define (and relentlessly innovate with) business models that can be scaled up to match those assets.
One clue suggesting that a company might face emerging digital challenges is the existence of businesses that have unusually high levels of revenue per employee in adjacent market spaces. Amazon.com’s employee productivity, for example, is double that of traditional retailers. Netflix, similarly, generates more revenue per employee than traditional cable operators do, by leveraging intangibles such as its highly evolved recommendation algorithms. Unusual financial profiles are another warning sign. Since digital funding is counted as operating expenditure, digital leaders often have small capital-investment levels relative to their size and growth potential. They also borrow less, both because they may not need to (some reap sizable market rents from, for example, search licensing fees or patent income) and because banks may be less likely to lend against intangible assets.

97Measuring the full impact of digital capital
Partner with careMost companies rely on digital agencies for things like optimizing search marketing. In such cases, they may be ceding digital capital, since they never develop a full understanding of consumer segments or what inspires a customer who searches for their products. Seeing such capability building as an investment may change the logic of using third parties. Similarly, when companies look to established tech players for partnerships shoring up weaknesses, they should be cautious: some seemingly high performers may be on the wrong path and could burden you with outmoded standards and platforms. Alternatively, if you deal with strong players, you may be leaving yourself vulnerable by letting them lead.
The need for growth and competitiveness will force companies to build strong digital capabilities. Viewing them as assets rather than additional areas of spending requires a new set of management and financial lenses. Embracing them is a major shift—but one worth making for companies striving to master a still-evolving landscape.
Jacques Bughin is a director in McKinsey’s Brussels office; James Manyika is a director of the McKinsey Global Institute and is based in the San Francisco office.
Copyright © 2013 McKinsey & Company. All rights reserved.
98 2013 Number 4
Digital capital is an important and
growing contributor to many forms of
innovation, but other factors are
at work, as well. To better understand
the range and value of innovation-
related assets that contribute to pro-
ductivity and economic growth,
we developed a measure of inno-
vation capital. The metric has
three components:
Physical capital refers to investments
in information and communication
equipment. Across the 16 economies
we analyzed,1 physical capital
represents 16 percent of innovation
capital. These “hard” assets are
counted as investments and thus
elements of national GDP.
Knowledge capital arises from invest-
ments that build a company’s
intellectual property and brand equity.
This form of innovation capital—
including investments in computer-
ized information, R&D and mar-
keting investments, and relevant
research spending in universities—
represents 60 percent of the total and
embodies significant amounts
of digital capital.
Human capital is formed by invest-
ments to build individual or organiza-
tional skills that drive productivity
growth. It includes public and private
investments in tertiary STEM2 edu-
cation, employee-based training
programs, and investments to develop
organizational efficiencies—for
example, the redesign of business
processes or the adoption of
new business models. Human capital
represents 24 percent of inno-
vation capital.
The stock of innovation capital is
substantial, totaling $14 trillion,
or more than 40 percent of the GDP
of the 16 nations in our study.
(Our colleagues—the authors of the
accompanying article—estimate
that digital capital represents just
under 30 percent of innovation
capital.) Over the period we studied
(1995–2008), innovation capital
grew at an annual rate of 4.6 percent.
We also found a strong correlation
between levels of innovation capital
as a proportion of gross domestic
product and labor-productivity
growth (exhibit).
Innovation, capital, and productivity growth
Eric Hazan, Nathan Marston, and Tamara Rajah
1 Austria, Canada, the Czech Republic, Denmark, Finland, France, Germany, Italy, Japan, the Netherlands, Russia, Slovenia, Spain, Sweden, the United Kingdom, and the United States.
2 Science, technology, engineering, and mathematics.

99Measuring the full impact of digital capital
0.50
0.55
0.45
0.40
0.35
0.30
0.25
0.20
0.15
0.10
0.05
00 0.5 1.0 1.5 2.0 2.5 3.0 3.5 4.0
Innovation stock has a strong correlation with productivity growth.
Innovation capital,% of GDP, 2007
Labor productivity growth,CAGR,1 % (1995–2007)
Q1 2013Innovation capitalExhibit 1 of 1
ItalySpain
Denmark
France
Germany
Netherlands
Austria
Sweden
Finland
United States
United Kingdom
r2 = 52%
r2 is the proportion of variance that is explained by a regression.1 2005 real prices; CAGR = compound annual growth rate.
Source: Carol Corrado, Jonathan Haskel, Massimiliano Iommi, and Cecilia Jona-Lasinio, “Intangible capital and growth in advanced economies: Measurement and comparative results,” Centre for Economic Policy Research working paper, Number DP9061, July 2012; McKinsey analysis
Eric Hazan is a principal in McKinsey’s Paris office; Nathan Marston and Tamara Rajah are principals in the London office.
Copyright © 2013 McKinsey & Company. All rights reserved.

©Ji
m K
ruge
r/G
etty
Imag
es

101
Mary Brainerd, Jim Campbell, and Richard Davis
Addressing community problems increasingly requires
cooperation among the private, public, and not-for-
profit sectors. Here, three executives explain how a civic
alliance in America’s Minneapolis–Saint Paul region
may point toward an operating model.
Doing well by doing good: A leader’s guide
The vitality of our communities has always required the involvement of the private sector, not just governments or not-for-profit organizations. Unfortunately, despite business leaders’ best intentions, these collaborative efforts often founder, fueling skepticism about the private sector’s ability to contribute meaningfully to civic advancement.
Changing this equation is in the interest of corporate leaders, for whom the ability to work across sectors is becoming a business necessity.1 It’s in the interest of their companies, which require talented employees attracted to vibrant communities. And it’s in the interest of the world’s cities, which are confronting unprecedented challenges at a time when many national governments’ resources and support mechanisms are wobbling.
1 Dominic Barton, Andrew Grant, and Michelle Horn, “Leading in the 21st century,” McKinsey Quarterly, 2012 Number 3, mckinsey.com.

102 2013 Number 4
Our group, the Itasca Project, has been experimenting for more than a decade with fresh collaborative approaches aimed at boosting the economic and social health of the Minneapolis–Saint Paul region of the United States, America’s 16th-largest metropolitan area, with about 3.4 million people. If you’ve been to any meeting of your local Chamber of Commerce or Growth Association, you may think you know what a civic alliance such as Itasca does. Ten years ago, we would have thought so, too, because we and our companies had long been trying to work productively with governments and not-for-profit groups in the Twin Cities. But we would have been wrong. Although other organizations play a critical role in communities, Itasca is different. It’s an employer-led civic alliance with no individual members, no office, and no full-time staff. We are quite prepared to end Itasca the minute we feel it is no longer adding value. In fact, we debated that very issue—should we continue?—at our fifth birthday and again this year, at our tenth.
We keep going because of the opportunities we see to make a differ- ence. In the past decade, Itasca has forged links between the busi- ness community and our region’s biggest university. It has improved the financial fitness of the region through educational programs and cast a national spotlight on growing socioeconomic disparities. Today, Itasca is working to improve higher education and gener- ating quality-job growth, as well as advancing efforts to address transportation issues comprehensively.
We don’t claim to have cracked the code to successful trisector partner- ships. But we do think our approach—how we’ve organized, focused our efforts, relied on hard facts, and involved, personally, our region’s key leaders—is different enough to spark useful ideas for corporate leaders in other communities. This article outlines that approach, which has not only made a difference in Minneapolis and Saint Paul but also been extraordinarily rewarding for us as individuals.
Who we are
Understanding Itasca requires understanding its origins. After World War II, the state of Minnesota enjoyed dramatic economic growth, driven by locally based Fortune 500 companies such as General Mills, Minnesota Mining and Manufacturing (3M), and Northwest Airlines,
103Doing well by doing good: A leader’s guide 103
as well as private, family-owned empires, including Cargill, Dayton, and Pillsbury. That lineup’s not bad for a region that is, for many, flyover country. We don’t enjoy sunshine 300 days a year. We don’t have beautiful mountains or gorgeous seashore. But for the four decades from the 1950s onward, our focus on those factors we could control—such as the quality of life, education, and the arts—made our state incredibly special and a place where people wanted to live.
As the new century approached, though, our competitive edge dulled. Between 1990 and 1999, Minnesota’s share of the nation’s initial public offerings and venture-capital investment fell. We began losing the battle for emerging high-technology businesses and slipped as a hub for research and development. By March 2000, David Kidwell, then the dean of the University of Minnesota’s Carlson School of Management, delivered a speech titled “Has the Twin Cities economy lost its blue chip status?” Deep down, we all knew the answer. The question was what could be done about it.
Later that year, Mark Yudof, at the time the president of the University of Minnesota, convened 1,200 civic and business leaders to discuss regional competitiveness, and a task force of around 50 local leaders from all sectors was formed. It was a disaster. A group of that many people, representing diverging constituencies and priorities, barely agreed on the shape of the table let alone a path to revitalize our competitiveness.
Yet a fuse had been lit. Rip Rapson, then the president of the McKnight Foundation,2 organized a breakfast meeting with a small group of business leaders who by now were convinced that something had to be done. Itasca eventually emerged from this, though its creation was far from a foregone conclusion in a region awash with groups ostensibly promoting economic growth and competitiveness.
To decide whether we could do anything worthwhile, we got in touch with leaders throughout the region and conducted interviews aimed at examining the Twin Cities’ strengths and weaknesses and the degree to which those issues could be addressed collectively. What we found was room for a different kind of organization: one that was
2 The Minnesota-based McKnight Foundation, created in 1953 by 3M president and CEO William McKnight and his wife, Maude, provided seed money for Itasca and continues to be a financial supporter.

104 2013 Number 4
business led while demanding all other perspectives as well and that took a long-term view, peering decades into the future rather than just to the next legislative session. Such an organization should prioritize regional vitality over business self-interest and be willing to take on issues that are inherently difficult to solve.
On September 12, 2003, Minnesota’s governor, the mayors of both Minneapolis and Saint Paul, and about 30 other business and civic leaders attended the first organizational meeting. Ten minutes had been set aside for introductions; this stretched to nearly half an hour as participants expressed their passion for the Twin Cities and their hope that the new organization could make a difference. We all believed that a group driven by private enterprises but including a broad set of stakeholders could play a constructive role in reviv- ing the economic competitiveness of Minneapolis and Saint Paul.
When it came to a name, we were inspired by what many regard as the Twin Cities’ golden era of business-leader civic engagement. In the 1950s and 1960s, regional business leaders would assemble annually at a state park to discuss critical issues, setting aside rivalries between their companies to contribute to the state’s prosperity. The park’s name was Itasca.
Our different approach
All regions are unique. All have strengths and weaknesses. And all have organizations that see their role as promoting economic vitality, business growth, and community well-being. On this basis, you could consider Itasca and the Minneapolis–Saint Paul region as entirely ordinary. Yet we like to think that our results have been extraordinary—and that they are a direct result of the conscious, deliberate ways we sought to think differently about how a civic alli- ance should operate.
If the day comes when we find there are no issues to address, we will walk away and Itasca will be no more.

105Doing well by doing good: A leader’s guide 105
Organize for actionIn the case of Itasca, “organization” refers to how we operate, not what we are. We’re not an organization. We work virtually, without a formal office. There’s no full-time staff, but we have been fortunate to receive support3 with operations and logistics—such as preparing agendas and documents for meetings—as well as some of the fact-gathering, which is so critical to our work. We leverage personal relationships rather than sell memberships. We have no public-relations people or thirst for recognition. And our budget process comprises a single annual meeting where the total estimated expenses for the year ahead are presented. Invoices are then sent to member companies, with payment optional. We collectively spend some two hours each year worrying about funding.
We do have some external financial supporters.4 However, we believe other civic alliances have the ability to adopt our overarching approach—all communities have smart people, companies, and insti- tutions that can provide support—especially when the benefits of being freed from traditional organizational structures are so obvious. Being a virtual organization frees us to focus entirely on picking issues and driving for results. It’s a collective effort; while working groups are responsible for individual issues, none of us will hesi- tate to pitch in if we believe we can make a difference. We don’t expend time or energy perpetuating an organization for an organization’s sake, and if the day comes when we find there are no issues to address, we will walk away and Itasca will be no more.
Focus on specificsEveryone learns from mistakes, and Itasca is no exception. When we first tried to determine which issues we wanted to be involved in, we wrote all of them on a white board, voted, and chose six. A shorter list would have been better.
It’s difficult to overstate the importance of carefully selecting issues where you believe you actually can make a difference, rather
3 Our support comes in the form of pro bono service from McKinsey & Company. However, potential sources of support include partnerships with universities, rotating personnel from member organizations serving in a full-time capacity for fixed periods, or both.
4 Itasca receives funding from the Bush Foundation, the Greater Twin Cities United Way, the McKnight Foundation, the Minneapolis Foundation, and the Saint Paul Foundation.
106 2013 Number 4
than those where you would like to. The key is to select the pressure points of issues on which a group such as Itasca—driven by the private sector but working collaboratively with all—can have an impact. When we targeted higher education in 2011, for example, our principal task was to narrow down potential action areas. Our task- force, led by Cargill chairman and CEO Greg Page, included executives from major employers, such as Andersen Corporation, General Mills, Target, and Wells Fargo. It recommended four priority areas: training students to meet the needs of employers, fostering a private–public ecosystem of research and innovation, forming new collaborations among higher-education institutions to improve efficiency, and helping to increase the number of students who graduate.
We immediately decided not to address the final priority—that’s the responsibility of institutions themselves, with little role for the business community. But we knew Itasca could have an impact on the other three, and implementation teams have worked on each since late last year. Although the work is ongoing, early results are encouraging. To give just two examples: our state’s conversation around the issue of higher education has shifted from cutting spending to increasing investment. In fact, Minnesota’s 2013 legis- lative session was dubbed “the education session” for the way it prioritized investment. And the Minnesota State Colleges and Universities (MnSCU) system and Associated Colleges of the Twin Cities (ACTC) have been working in parallel on efficiencies. In fact, by adopting modern procurement practices, MnSCU has saved more than 30 percent on copier paper, and ACTC’s board is determining the business case for shared services.
The effort to bridge the gap between education and employment fits neatly with Itasca’s broader priorities. We view education, jobs, and transportation as a triangle, with socioeconomic disparities in the center, influenced by the other three. These centerpieces of our work have a critical factor in common: they are local. Education involves our children and students of all ages, as well as teachers. Jobs relate directly to our community and what we can do to increase oppor- tunities and the region’s attractiveness. Transportation includes our roads, bridges, and infrastructure. And the degree of disparity among our residents is influenced by all three factors. The

Doing well by doing good: A leader’s guide 107
bottom line is that these are challenges where we believe Itasca can make a difference.
Take a fact-based approachGathering the facts is critical to our success. While our working groups may be hypothesis driven, before any recommendation is contem- plated they spend weeks or even months examining best practices in the United States and around the world, gathering data via inter- views, surveys, and other approaches. Because every recommendation is firmly grounded in fact, this approach underpins our credibility with partners and the broader community. They know that Itasca is— to the greatest extent possible—objective, nonpartisan, and driven only by the desire to improve our community.
Consider the issue that is central to all that we do: disparities. While the issue of socioeconomic inequality has taken center stage nationally in the past five years, Itasca prioritized it from our first formal meeting, in 2003. Even at that point, it was evident anecdotally that the Twin Cities were increasingly dividing into haves and have-nots, with all manner of deleterious effects on our community. Yet we weren’t aware of any organization in our region tackling this issue, and, frankly, we were concerned that it couldn’t be tackled—it was simply too big to be addressed, especially by a small, fledgling civic alliance.
Then we got lucky. We discovered that one of our primary supporters, the McKnight Foundation, was already working with the Brookings Institution’s Metropolitan Policy Program to examine publicly available census data on several US cities and determine the types and impact of disparities. We immediately saw an opportunity to become involved, and the eventual report, Mind the Gap,5 was sobering. Although our region is generally regarded as highly educated, with relatively low rates of poverty and unemployment, the report showed worrisome trends emerging. In particular, it showed that fewer people of color attended college, their household incomes were lower, and they tended to live farther from areas where jobs were.
5 For more, download the full report, Mind the Gap: Reducing Disparities to Improve Regional Competitiveness in the Twin Cities, Brookings Institution, October 2005, on brookings.edu.

108 2013 Number 4
What made the report, released in 2005, so powerful was that it was grounded in facts—in this case, publicly available data—and that the recommendations based on our analysis came from a unique business perspective. Because all of our member companies are major employers, the fact that we were expressing concern about growing socioeconomic disparities and their potential impact on the future vitality of our region carried significant weight. Some eight years later, we can’t claim to have solved the disparities issue. But it is now squarely at the center of all conversations about what kind of com- munity people want the Twin Cities to be and the initiatives that should be pursued to achieve this goal. That would never have happened without the credibility of Itasca as a messenger and the rigor of our approach to understanding and analyzing issues.
Get leaders involvedWhen it comes to getting things done, there’s no substitute for the direct involvement of those with authority. The members of Itasca who make up our working groups are private-sector chairmen and chief executives, the mayors of Minneapolis and Saint Paul, the governor of Minnesota, and presidents of universities and other insti- tutions. There’s no concern about miscommunication or making false promises that require the approval of others. We are all principals with decision-making authority, sitting in meetings as equal par- ticipants with equal voices.

109Doing well by doing good: A leader’s guide
Although this practice sounds like common sense, many civic alliances devolve into endless rounds of meetings attended by designated representatives who report back to others, adding layers of complexity and delays. Having principals at the table—principals whose time is precious and who are accustomed not only to making decisions but also to seeing tangible results—ensures our relevance and focuses our attention on what really matters. We all know that the work we do must be worth our time.
At one of our first meetings, for example, we discussed research and development undertaken by companies and public institutions in the Twin Cities. A vast amount of groundbreaking work was being done, yet there was little cooperation—research organizations worked in isolation and had done so for as long as anyone could remember. We all agreed this made little sense, and the then chairman and chief executive of 3M, Jim McNerney (who now holds the same roles at Boeing), immediately volunteered to chair a task force on the issue. Within seconds, another attendee, the president of the University of Minnesota, Bob Bruininks, piped up: “I’ll co-chair.” Six months later, the working group chaired by Jim and Bob had studied best practices, developed a deep fact base, formed recommendations, and pushed for changes that have transformed private–public sector collaboration across the state.
Finding deeper meaning
The effort Jim and Bob spearheaded had obvious direct benefits for both of their organizations. Yet not all Itasca initiatives do, which raises the question: why bother? Why do so many leaders of com- panies, organizations, and institutions devote so much time and effort— our core working group typically meets weekly—to do work that, in many cases, may not bear fruit for years or perhaps decades? If you ask these leaders, the answer is universal and simple: it’s incredibly meaningful. The personal return on investment from their Itasca involvement exceeds that of pretty much anything else they’ve done, including their corporate careers. It’s that significant.
Itasca provides a couple of rare opportunities at a personal level. Members interact in a noncompetitive environment with fellow leaders, and they exercise different parts of their brains. While we like to

110 2013 Number 4
think that managing a major corporation is all about influence, the fact is that it’s often just management: leaders make decisions, and others fall into line. At Itasca, it’s all about influence. Ideas sur- vive and thrive on the ability of members to bring their colleagues along with them. It’s also creative. Our members have risen to their current positions by being very skilled at specific tasks in specific industries. Yet at Itasca, they may be examining a problem they have little expertise in, which is itself exhilarating. Not only that, they also have permission to try more things and make more mistakes—a luxury that quickly disappears in their day jobs. Don’t get us wrong; we are determined to reach the right answer to a given problem as quickly as possible. But there is leeway for experimentation and learning.
At a broader level, there’s no doubting the significance and satisfaction from the altruistic element of civic work, as any executive involved in community groups can attest. We like to imagine it’s more intense for participants in Itasca, who are at the front line of efforts to reinvigorate a region that is responsible for the livelihoods of millions of people, not to mention the well-being of the participants’ com- panies. While the percentage of revenue that these companies derive from the Minneapolis–Saint Paul area has certainly declined in recent decades, the happiness and prosperity of our employees is linked as tightly as ever to the region’s vitality. Knowing we are working to improve it is incredibly gratifying, even if the full benefits may not be realized in our time at Itasca or even our lifetimes.
Finally, Itasca provides lessons that can be applied day-to-day. Some members learn from observing their peers, gaining insight into the way other chief executives think, solve problems, or interact. Others directly implement changes based on findings from our work; for example, our deep understanding of socioeconomic disparities has resulted in formal goals at HealthPartners—to reduce health-care disparities and increase the leadership team’s diversity— as well as changes to the company’s incentive plan to drive results. All mem- bers grow personally as a result of their involvement and relish the opportunity to be involved. We’ve never had to recruit participants; they welcome the opportunity to be part of something bigger than they could be elsewhere.

111Doing well by doing good: A leader’s guide
We’re obviously proud of our work at Itasca and believe the approach we’ve adopted can be implemented elsewhere. Yet we know none of this is easy. We have false starts when it comes to selecting issues. Some of our initiatives struggle to gain traction. And we have our share of executives who become consumed by their day jobs, letting Itasca fall by the wayside. However, while we are sometimes discouraged, we are never dissuaded. We know personally how mean- ingful it has been to try to improve the community in which we live and work. The way we see it, leaders spend decades acquiring influence that typically peaks when they reach the very top of their organizations. Wouldn’t it be wonderful to have the opportunity, at that point in your life, to engage with others in the same position and do something bigger than all of you?
The authors wish to thank Tim Welsh, a director in McKinsey’s Minneapolis office, and colleagues Allison Barmann, Beth Kessler, Jennifer Ford Reedy, and Julia Silvis, for their collective contributions to the Itasca Project since 2003.
Mary Brainerd, president and CEO of HealthPartners, was chair of Itasca from 2008 to 2012. Jim Campbell, a retired chairman and CEO of Wells Fargo Bank Minnesota, was chair of Itasca from 2003 to 2008. Richard Davis is chairman, president, and CEO of US Bancorp and Itasca’s current chair.
Copyright © 2013 McKinsey & Company. All rights reserved.
For more on the Itasca Project, see the online version of this article, on mckinsey.com, for a video interview with current Itasca chair Richard Davis and former chairs Jim Campbell and Mary Brainerd.


Breaking the US growth impasse 113
Susan Lund, James Manyika, and Scott Nyquist
Business leaders can give the US economy a shot in the
arm by stepping out of their comfort zones, pursuing
innovative partnerships, and creating industry standards.
Breaking the US growth impasse
As the weak recovery drags on, a hard reality has become clear: the US growth engine isn’t what it was in decades past. For domestic and international companies alike, this painful realization has been heightened by the slow emergence of Europe from its long recession and the serious speed bumps that emerging economies are now hitting.
Earlier this year, we spent several months investigating catalysts with the potential to revitalize the US economy. Five game changers emerged, with particular promise for adding momentum to the recovery and setting the nation on a higher long-term trajectory.1 These five are increasing shale-energy production, which could provide a competitive edge for the next 10 to 15 years; reversing the US trade deficit in knowledge-intensive goods, such as automo- biles and aerospace products; harnessing big-data analytics to make broad areas of the economy more efficient; investing in infrastruc- ture while transforming the selection, operation, and delivery of projects; and, finally, fully developing US human capital through better education and workforce training. We estimate these
1 See the full report, Game changers: Five opportunities for US growth and renewal, McKinsey Global Institute, July 2013, mckinsey.com.

114 2013 Number 4
opportunities could raise US productivity and boost GDP by hundreds of billions of dollars over the next seven years (Exhibit 1). Three of them—energy, trade, and infrastructure—could create more than 1.5 million jobs each by 2020.
Market forces and simple self-interest are already prodding companies to move in some of these areas, such as developing shale energy or adopting big data in sectors like retailing and financial services. But others will need a concerted push from business leaders and policy makers, and grasping their full economic potential is far from assured. New standards and partnerships, as well as a focus on local innovation, can jump-start momentum. Above all, progress will require a willingness to stretch for new opportunities rather than wait for the old economy to bounce back—and a fresh mind-set that looks beyond this quarter’s results or the next election cycle. For business leaders in particular, four priorities loom large.
Q4 2013Game ChangersExhibit 1 of 2
Five economic catalysts could dramatically boost US GDP by 2020.
1 Based on a partial-equilibrium analysis that estimates first-order effects only; cannot be summed together to calculate full economic impact.
2Data are for retail and manufacturing sectors only. Big data may also yield cost savings in government services and health care ($135 billion–285 billion), but these do not directly translate into additional GDP.
Source: Economist Intelligence Unit; IHS Global Insight; McKinsey Global Institute analysis
Energy
Share of 2020 GDP1
Incremental annual GDP by 2020,low and high estimate, $ billion
2.0–3.7% 380–690
Trade 1.1–3.1% 200–590
Big data2 0.8–1.7% 155–325
Infrastructure 1.4–1.7% 270–320
Talent 0.9–1.4% 165–265
$600 billion
Even greater impact by 2030
$1.7 trillion
Exhibit 1

115Breaking the US growth impasse 115
1. Cooperate in developing industry standards
Lingering uncertainties are slowing progress in a number of areas, but business leaders can move these issues forward without waiting for legislative or regulatory action. In big data, for example, standards for sharing consumer information and protecting privacy need to be resolved. Some companies already are working with universities and nonprofits to find technical and legal solutions for assuring privacy and cybersecurity.
In shale energy, oil and gas players can help mitigate environmental risks by pursuing standards for all producers to follow in fracking—and by continuing to improve drilling and well technologies to reduce its environmental impact. Some energy companies are joining with environmental groups, academic researchers, and foundations to monitor the risks and create operational standards. The Center for Sustainable Shale Development, for example, is a coalition of envi- ronmental groups (including the Clean Air Task Force and the Environmental Defense Fund) and energy firms (including Chevron and Shell). Mitigating these risks is crucial to protecting the air and groundwater while allowing the economy as a whole to reap the full benefits of shale development.
2. Build new types of partnerships
As the cybersecurity and shale examples suggest, companies hoping to stay in the vanguard of the new economy must look beyond their own boundaries and find new forms of collaboration. Big data, for example, is tailor-made for partnerships, such as a joint effort by Google and the US Patent and Trademark Office to create a new searchable database of intellectual property. Biotech and pharma- ceutical companies are entering new multidisciplinary research part- nerships to analyze enormous open databases of clinical and genetic information and collaboratively develop new drugs and diagnostics.
Or take the challenge of building a more competitive workforce. Some employers, facing mounting skill shortages, are forming industry associations to develop joint training programs, with agreements to

116 2013 Number 4
protect participants from talent poaching. In one instance, AMTEC,2 a consortium of automotive manufacturers, has successfully teamed up with community and technical colleges to train skilled workers. Individual companies can work directly with educa- tional institutions, as PG&E has done with California community colleges to create a training curriculum for future utility tech- nicians. Competitors can also collaborate to develop industry-wide competency standards that enable educational institutions and private training providers to tailor individual programs.
Educational partnerships may be most important in STEM3 fields, for the United States has one of the lowest shares of college degrees awarded in science and technology. Relatively few incoming freshmen choose these subjects, and only half complete their degrees. Industry participation could help close the gap, with corporate internships, mentoring, and real-world research projects to keep students engaged. And companies can prime the talent pipeline even earlier, at the K–12 level. One intriguing experiment is P-TECH, a six-year New York City high school recently created through a part- nership with IBM. Its STEM-intensive curriculum prepares students for entry-level IT jobs, offers one-on-one interaction with IBM mentors, and ultimately provides students with an associate’s degree.
Finally, innovative public–private partnerships (PPPs) may offer cash-strapped local and state governments the means to tap private expertise and capital for infrastructure projects. Such partner- ships have, for example, built new high-occupancy toll lanes for the Capital Beltway, outside Washington, DC; a major light-rail expan- sion in Denver; and multiple toll roads in Texas. There is a new willing- ness to experiment with different types of financial vehicles and operating arrangements that can make public-works projects more efficient while creating more attractive opportunities for private-sector firms.
3. Drive local change
Local innovation is the key to realizing the game changers on a national level. Efforts to revitalize advanced manufacturing and US
2 Automotive Manufacturing Technical Education Collaborative.3 Science, technology, engineering, and mathematics.

117Breaking the US growth impasse 117
exports, for example, will naturally revolve around the industry-specific regional clusters that help fuel US economic vitality. Local business leaders not only set the direction for these innovation hubs but also sustain them through start-up incubators, coordinating organi- zations, venture capital, and collaboration with research universities. While Silicon Valley is the most compelling example, the United States has hundreds of innovative clusters, such as the Gulf Coast (chemicals), Ohio (polymers and advanced materials), South Carolina (automotive manufacturing), and Wichita, Kansas (aerospace).
Industry leaders can work with city and state officials to build on these local capabilities. The New Orleans Business Alliance, for example, recently unveiled a new five-year economic-development plan that focuses on supporting strategic industries. In Minneapolis, the Itasca project, a business-led economic-development task force, has made major contributions for more than a decade. (For a perspec- tive on Itasca from three of its corporate leaders, see “Doing well by doing good: A leader’s guide,” on page 100.) These types of organi- zations should move the opportunities presented by the game changers to the top of the local agenda by expanding vocational training, developing infrastructure, promoting export industries, supporting the use of big data, and assessing the role a region can play in the shale-energy revolution.
4. Step out of your comfort zone
Fully exploiting the opportunities we have outlined so far will also require business leaders to stretch their thinking and their capabilities. For instance, the energy sector’s huge needs for new pipelines, drilling rigs, and related infrastructure equipment offers manufac- turers a fast-growing market for existing and retooled offerings. In infrastructure, public–private partnerships are creating opportu- nities for not only engineering and construction firms but also insurance companies, pension funds, and other providers of long- term capital. In education, technology companies are seizing on the adoption by 45 states of Common Core standards—guidelines that create a much larger and less fragmented market for new digital learning tools.
The potential in energy, big data, and knowledge-intensive industries is large enough to spark the development of whole new supply chains.

118 2013 Number 4
That could stimulate growth among a wide range of B2B goods, from fabricated metals to electronic controls, as well as among service providers in areas such as logistics and data storage. What’s more, the big-data revolution is forging large new markets at the intersection of information technology and traditional economic sectors, such as health care, manufacturing, and retailing. Exploiting these oppor- tunities could spur new zones of business activity as data aggregators and service providers analyze millions of medical records to lower costs and improve patient outcomes or comb through volumes of social- media data to glean insights for consumer-goods companies.
A number of multinationals headquartered outside the United States have been making bold bets in pursuit of these opportunities. Consider the recent surge of foreign direct investment into the United States from well-known international firms such as Airbus, Sasol, Shell, and Volkswagen. Domestic companies can similarly take advantage of changing factor costs and new technologies to expand—or even reimagine—their US footprints.
None of this is to suggest that business leaders can do everything themselves. Policy makers have a role to play, as well, but they need to take a nuanced approach. For game changers such as shale energy and the private sector’s use of big data, the government’s role will largely be laying the groundwork by setting legal and regu- latory frameworks, often in conjunction with businesses.
In other areas, the main roles of the government will be to create an attractive business environment and to streamline the entire permitting process (which ranges from applications to inspection, disclosure, certifications, and, finally, the issuance of permits)— and then to get out of the way. To improve trade competitiveness, for example, national policy plays an important role in leveling the global playing field on taxes, foreign investment, and export promo- tion. Other countries, such as Ireland and Singapore, provide examples of how government agencies can coordinate their actions to create an attractive environment for investment and take these efforts to the next level.
For several game changers, government can accelerate change. To realize the enormous potential of big data to cut costs in health care

Breaking the US growth impasse 119Q4 2013Game ChangersExhibit 2 of 2
A majority of the investment needed to realize each catalyst will come from the private sector and from state and local governments.
Source: McKinsey Global Institute analysis
Energy
Estimated share of investment, by source, %
Trade
Big data
Infrastructure
Talent
Private State/local Federal
90–95 1–5 1–5
70–80
60–70
25–45
10–25
15–25
20–30
40–50
65–75
25–35
5–15
3–5
5–15
Exhibit 2
and government services, for example, policy makers will have to take a more active role in speeding its adoption and creating the right incentives. For infrastructure and talent, state and local governments will need to provide around half to three-quarters of the necessary investment (Exhibit 2).
Yet the private sector can create considerable momentum—and realize large opportunities—even if gridlock in Washington persists. It will take vision to recognize new markets, invest early, and create unconventional partnerships, but companies that act now may be able to seize first-mover advantages. They can also help to close out a period of sluggish US growth that has become nothing less than a slow-motion crisis for the unemployed, the underem- ployed, and future generations.
Susan Lund is a principal with the McKinsey Global Institute (MGI) and is based in McKinsey’s Washington, DC, office; James Manyika is a director of MGI and is based in the San Francisco office; Scott Nyquist is a director in the Houston office.
Copyright © 2013 McKinsey & Company. All rights reserved.

120
Picture This
Source: National Geophysical Data Center; National Oceanic and Atmospheric Administration; US Air Force Weather Agency; McKinsey Global Institute analysis
Seen from outer space at night, Myanmar is dimmer than its neighbors. It has changed remarkably little over the past two decades: the vast majority of its citizens still live in the countryside, and only the cities of Yangon and Mandalay approach the size of urban areas in neighboring countries. Low rates of labor productivity and a heavy reliance on agriculture help account for this picture—which could change significantly in the years ahead. McKinsey Global Institute (MGI) research suggests that dramatic improvements in labor-productivity growth to 7 percent a year, from today’s 2.7 percent,
Heang Chhor, Richard Dobbs, and Doan Nguyen Hansen
Lighting up the last frontier
1992
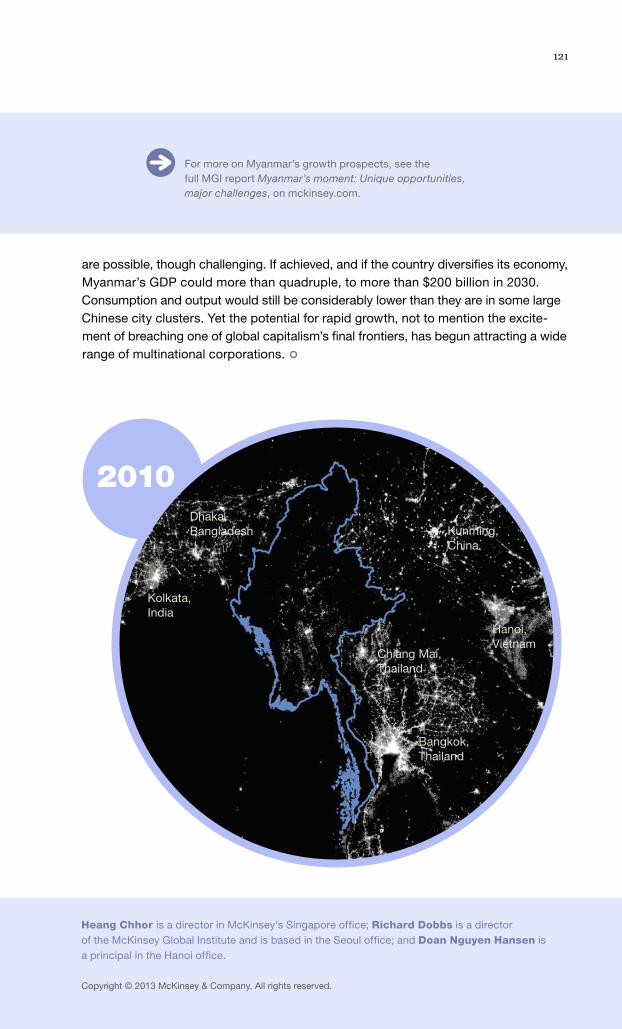
121
For more on Myanmar’s growth prospects, see the full MGI report Myanmar’s moment: Unique opportunities, major challenges, on mckinsey.com.
Heang Chhor is a director in McKinsey’s Singapore office; Richard Dobbs is a director of the McKinsey Global Institute and is based in the Seoul office; and Doan Nguyen Hansen is a principal in the Hanoi office.
Copyright © 2013 McKinsey & Company. All rights reserved.
are possible, though challenging. If achieved, and if the country diversifies its economy, Myanmar’s GDP could more than quadruple, to more than $200 billion in 2030. Consumption and output would still be considerably lower than they are in some large Chinese city clusters. Yet the potential for rapid growth, not to mention the excite- ment of breaching one of global capitalism’s final frontiers, has begun attracting a wide range of multinational corporations.
2010
Kunming, China
Hanoi, Vietnam
Chiang Mai, Thailand
Kolkata, India
Dhaka, Bangladesh
Bangkok, Thailand

Applied InsightTools, techniques, and
frameworks for managers
133
Organizing the government-affairs function for impact
123
Managing the people side of risk
129
Three steps to a more productive earnings call
Illus
trat
ion
by B
rian
Sta
uffe
r

123
Companies can create a powerful risk culture without turning the organization
upside down.
Most executives take managing risk
quite seriously, the better to avoid the
kinds of crises that can destroy value,
ruin reputations, and even bring a com-
pany down. Especially in the wake
of the global financial crisis, many have
strived to put in place more thorough
risk-related processes and oversight
structures in order to detect and correct
fraud, safety breaches, operational
errors, and overleveraging long before
they become full-blown disasters.
Yet processes and oversight structures,
albeit essential, are only part of the story.
Some organizations have found that
crises can continue to emerge when they
neglect to manage the frontline attitudes
and behaviors that are their first line of
defense against risk. This so-called
risk culture1 is the milieu within which the
human decisions that govern the day-
to-day activities of every organization
are made; even decisions that are
small and seemingly innocuous can be
critical. Having a strong risk culture does
not necessarily mean taking less risk.
Companies with the most effective
risk cultures might, in fact, take a lot of
risk, acquiring new businesses, entering
new markets, and investing in organic
growth. Those with an ineffective risk
culture might be taking too little.
Of course, it is unlikely that any program
will completely safeguard a company
against unforeseen events or bad actors.
But we believe it is possible to create a
culture that makes it harder for an outlier,
be it an event or an offender, to put
the company at risk. In our risk-culture-
profiling work with 30 global com-
panies, supported by 20 detailed case
studies, we have found that the most
effective managers of risk exhibit certain
traits—which enable them to respond
quickly, whether by avoiding risks or
taking advantage of them. We have also
observed companies that take con-
crete steps to begin building an effective
risk culture—often starting with data
they already have.
Managing the people side of risk
Alexis Krivkovich and Cindy Levy

2013 Number 4124
Traits of strong risk cultures
The most effective risk managers we
have observed act quickly to move
risk issues up the chain of command as
they emerge, breaking through rigid
governance mechanisms to get the right
experts involved whether or not,
for example, they sit on a formal risk-
management committee. They can
respond to risk adroitly because they
have fostered a culture that acknowl-
edges risks for what they are, for better
or for worse; they have encouraged
transparency, making early signs of
unexpected events more visible; and
they have reinforced respect for internal
controls, both in designing them and
in adhering to them.
Acknowledging risk
It takes a certain confidence among
managers to acknowledge risks.
Doing so—especially to the point of
discussing them internally, as well
as with shareholders or even regulators—
requires that managers rely on their
own policies and procedures to work
through issues that could lead to
crisis, embarrassment, or loss.
The cultural differences between com-
panies that acknowledge risk and
those that do not are quite stark. Con-
sider, for example, two global financial
institutions that take similar risks and
share a similar appetite for risk. The first
has built a culture, at all levels of the
organization, that prizes staying ahead
of the trend. This might mean conven-
ing a group of executive peers to discuss
issues faced by the entire industry or
responding to regulatory trends early—
for example, on capital and liquidity
requirements or compensation practices.
The stance it takes is, “If we see
it, identify it, and size it, then even if it’s
horrible, we’ll be able to manage it.”
Where risks cannot be sized, they are
at least discussed in qualitative terms.
The institution’s candor and its plans to
rectify cultural issues in response to
a number of risk incidents has won it the
respect of regulators and built credi-
bility with investors.
The second institution, in contrast,
has a reactive and back-footed culture—
one focused more on staying out of
trouble, ensuring regulatory compliance,
and making sure all the boxes are ticked.
Its managers are generally content
to move with the pack on risk issues,
preferring to wait for regulatory criticism
or reprimand before upgrading sub-
par practices. They are afraid of knowing
what they don’t know, and they fear
the reaction of the board, regulators, and
investors. Many would rather ignore
undesirable behaviors because they don’t
know how to manage them and because
managing them would demand time
and might affect their cost base. This
organization’s stance is, “Let’s wait
until we really need to deal with these
unpleasant things, because they’re
anomalies that may turn out to be nothing
at all.”
A separate institution had such a mind-
set during the mortgage crisis. Managers
did not trust their own models, which
accurately predicted the severity of the
issues to come. They knew that if the
models were correct, they would be in
more trouble than they knew how to
125Applied Insight
handle, and so they found it easier to
assume that the models were wrong—or
to hope that the risk would crest and
fall before the model’s estimates came
true. Whether from fear or hubris,
managers convinced themselves that
they were safer than they really were.
Even as the crisis developed, they were
confident that they would not experience
the mishaps befalling similar compan-
ies. In the end, the company’s refusal to
acknowledge and address risk left
it far more vulnerable than managers
expected, and it was hit particularly hard.
Encouraging transparency
Managers who are confident that
their organizational policies and controls
can handle—and even benefit from—
openness about risk are more likely to
share the kinds of information that
signal risk events and allow the institution
to resolve emerging issues long before
they become crises. This means they
spot a risk issue developing and mobilize
the organization to analyze and remedy
it—at the board level if needed, and often
within a few working days. In one situa-
tion, a division of an energy-services
company was operating a contract in an
emerging country in which it had not
previously worked. There, the division
discovered employment practices
among subcontractors that ran counter
to its own policies and practices. The
operating leadership swiftly escalated
the issue to the company’s global
management board to decide whether
specific contractors were acceptable.
It was able to reallocate project
tasks among contractors, manage time-
line slippage and the budget, and
consequently reduce the company’s
employment-practices risk and safe-
guard project returns.
Companies with a culture that dis-
courages such discussions—as well as
those in which overconfidence leads
to denial—are prone to ignoring or failing
to recognize risks. In some cases,
employees fear telling the boss bad news
because they worry about the financial
downside of slowing commercial prog-
ress, they know the boss doesn’t
want to hear it, or they fear being blamed.
As a result, they alert managers to risks
only when further delay is impossible.
In other cases, companies promote prac-
tices that unintentionally reduce
transparency regarding risk. For example,
at one global pharmaceutical company,
the culture thrives on competitive teams.
Competitiveness is so strong that
product-development teams use subtly
different risk classifications so that
their respective projects can’t be directly
compared. To the teams, it can feel
like good management to deal with issues
close to home rather than raise them
to higher levels—especially since reveal-
ing their true risks might place them
at a disadvantage in the next planning
round. For the company, though, this
practice has obscured risks that were
identified by one unit but went unnoticed
by others, which continued to make
errors that had been resolved elsewhere.
The best cultures actively seek informa-
tion about and insight into risk by
making it everyone’s responsibility to
flag potential issues. For example,
managers at one global oil-exploration
company explicitly begin every meeting

2013 Number 4126
and behaviors. Companies often uncon-
sciously celebrate a “beat the system”
mind-set, rewarding people who
create new businesses, launch projects,
or obtain approvals for things others
cannot—even if it means working around
control functions in order to get credit
lines or capital allocations, for example.
In the best of cases, respect for rules
can be a powerful source of com-
petitive advantage. A global investment
company had a comprehensive due-
diligence process and sign-off require-
ments for investments. Once these
requirements were fulfilled, however, the
board was prepared to make large,
early investments in asset classes or
companies with the collective support
of the senior-executive team, which was
ultimately accountable for perfor-
mance. Company-wide confidence in
proceeding resulted from an exhaustive
risk debate that reduced fear of failure
and encouraged greater boldness rela-
tive to competitors. Confidence also
stemmed from an appropriately gauged
set of risk controls and an understand-
ing that if these controls were followed,
failure would not be regarded as a
matter of poor decision making.
Building an effective risk culture
Companies that want to reshape
their risk culture should be aware that
patience and tenacity are crucial.
Changing the operating environment of a
large organization takes at least two
to three years, as individuals come up
against specific processes—such
as policy decisions, project approvals,
and interaction with a discussion about
safety. Participants know they must
be able to make an observation or raise
a concern if called on randomly, which
keeps them on the lookout for safety
issues at all times. Most of the
issues they raise are minor and easily
addressed. But bigger questions
often lead to longer conversations and
inquiries from leadership, which clarify
the problem and identify by name those
responsible for resolving the issue.
Ensuring respect for risk
Most executives understand the need for
controls that alert them to trends and
behaviors they should monitor, the better
to mobilize in response to an evolving
risk situation. And while managers are
unlikely to approve of skirting the very
guidelines and controls they have put in
place, some unintentionally promote
situations and behaviors that undermine
them. For example, while too few
controls can obviously leave companies
in the dark as a situation builds, too
many can be even more problematic.
Managers in such cases mistake more
controls for tighter management of
risk, though they may be inadvertently
encouraging undesired behaviors. In one
large hospital system, managers had
implemented so many guidelines and
controls for ward procedures that the
staff saw them as impractical. As a result,
they routinely circumvented them,
and the culture became increasingly
dismissive of all guidelines—not just
the less practical ones—to the detriment
of patients.
Even companies with the right number of
controls in place encounter difficulty if
managers do not monitor related trends

127Applied Insight
or even personnel reviews—that have
changed in line with new risk-culture
principles. In our observation, companies
wrestle with two challenges: building
consensus among senior executives and
sustaining vigilance over time.
Finding consensus on culture
Improving a company’s risk culture
is a group exercise. No one executive—
or even a dozen—can sufficiently
address the challenge. In most global
organizations, CEOs and CFOs who
want to initiate the process must build a
broad consensus among the company’s
top 50 or 60 leaders about the current
culture’s weaknesses. Then they must
agree on and clearly define the kind
of culture they want to build. This is no
small task, typically requiring agree-
ment on four or five core statements of
values about the desired culture
that imply clear process changes. For
example, in one organization, mana-
gers often adopted new products or took
on new customers without consider-
ing whether the company’s infrastructure
could support them. Often, it could
not; this ran up costs and created huge
operational risks. When leaders gathered
to define the risk culture they wanted
to see, one of their statements was, “We
will always understand the infrastruc-
ture implications of the risk decisions
we make.”
The consequence of committing to
such statements is that the company will
need to change the way it approves
activities, whether those are transactions
at banks, capital projects in heavy
industry, or even surgical procedures at
hospitals. It cannot let them proceed
if the risk infrastructure does not support
them—and business-unit COOs must
be held accountable for risk events
related to infrastructure in their areas.
To make aspirations for the culture
operational, managers must translate
them into as many as 20 specific
process changes around the organiza-
tion, deliberately intervening where
it will make a difference in order to signal
the right behavior. In some companies,
this has meant changing the way gover-
nance committees function or modify-
ing people processes, such as training,
compensation, and accountability.
And while fine-tuning some of these areas
may take a fair number of cycles,
even a few symbolic changes in the first
cycle can have a profound impact on
the culture.
For example, in one global organization,
a simple announcement that certain
risk-related data would be incorporated
into one round of promotions radiated
through the organization almost overnight,
encouraging some behaviors and
discouraging others. In the next round of
promotions, managers created reports
using the data so that every staff member
had tangible risk indicators next to
his or her name. At that point, the new
approach to risk started to become
part of the infrastructure—sending loud
signals to the organization about what
would be celebrated and what would not.
Although these were big changes, they
were accomplished without turning the
organization upside down.
Sustaining vigilance
Since cultures are dynamic by definition,
sustaining the right attitudes and
behaviors over time requires continuing
effort. An ongoing risk committee

2013 Number 4128
Rather, leadership teams must tackle
risk culture just as thoroughly as any
business problem, demanding evidence
about the underlying attitudes that
pervade day-to-day risk decisions.
might start off by keeping on top of key
issues but become stale and mechanical
as people lose energy over time. Or a
discontinuity—new leadership or a new
set of market pressures, for instance—
could send the culture in a different direc-
tion. To monitor for such shifts and
make sure things continue moving in the
right direction, managers at one pharma-
ceutical company conduct spot-checks
every year on employee attitudes and
minor risk infractions.
The responsibility for maintaining the
new risk culture extends to boards of
directors, which should demand
periodic reviews of the overall company
and individual businesses to identify
areas that merit a deeper look. This need
not be complicated. Indeed, most
companies can aggregate existing data:
a people survey, which most com-
panies conduct, can provide one set of
indicators; a summary of operational
incidents, information on financial per-
formance, and even customer complaints
can also be useful. Combined, these
data could be displayed in a dashboard
of indicators relevant to the company’s
desired risk culture and values. Such a
review process should become part
of the annual risk strategy on which the
board signs off.
Obviously, a shortage of risk conscious-
ness will lead to trouble. But it is all
too easy to assume that a thorough set
of risk-related processes and oversight
structures is sufficient to avert a crisis.
Companies cannot assume that a
healthy risk culture will be a natural result.
Copyright © 2013 McKinsey & Company. All rights reserved.
1 The concept of risk culture featured prominently in a 2008 report by the Institute of International Finance on the failings that led to the credit and liquidity crisis among global banks and the consequent bank collapses and losses. See Final Report of the IIF Committee on Market Best Practices: Principles of Conduct and Best Practice Recommendations, Institute of International Finance, July 2008, on iif.com.
Alexis Krivkovich is a principal in
McKinsey’s San Francisco office, and
Cindy Levy is a director in the London
office.

129Applied Insight
say little about value creation.
Clearly, the quarterly earnings call needs
an overhaul.
Short of eliminating them entirely—
a step many managers are unwilling to
contemplate—what’s a senior execu-
tive to do? There’s plenty of room for
experimentation with more insightful
formats. Beyond the formal and legally
required 10-K forms, managers are
free to innovate their quarterly (or semi-
annual) interactions—around both the
Traditional earnings calls are painfully unhelpful. Here’s how companies and
investors alike can get more out of them.
As every earnings season comes to an
end, it is striking how often executives
and investors alike complain that earnings
calls are a colossal waste of time. It’s
no wonder. Even a determined listener
would be tested by an executive
reading highly scripted texts of revenue,
margin, and earnings data that would
be better presented in tables. And few
analysts or investors work up much
enthusiasm for earnings-per-share (EPS)1
data that heed the generally accepted
accounting principles (GAAP)—data that
Three steps to a more productive earnings callWerner Rehm
Illus
trat
ion
by K
en O
rvid
as

130
2
1
format and the content of their calls.
Most stakeholders would likely be
delighted. Three ideas could greatly
improve the dialogue.
Ditch the prepared text—and allow more time for thinking
Today, very little time passes between
a written announcement of earnings and
the earnings call. Most companies
send around a press release minutes
before the call or, at best, the evening
before, after the markets close. The call
itself often starts with a prerecorded
and legalistic review, most often a senior
executive reading data from a script,
followed by a mundane question-and-
answer session in which the company
usually selects who asks the questions.
The value of this setup is questionable.
Nobody has time to analyze the data
before the Q&A session, and the remarks
are often a more convoluted way
to convey data than simple tables. To
improve the dialogue, companies should
eliminate the prepared remarks and
give investors more time to digest and
analyze the data. For example, they
could release—a few days in advance of
the call—detailed tables and exhibits,
as well as a targeted overview in text and
perhaps even full quarterly filings.
If investors and analysts have enough
time to review the prereleased data
prior to the call, companies could likely
eliminate the usual prepared remarks
and go right to a Q&A session. The advan-
tage of such an approach is obvious—
questions are better when the data are
clear and understood by the partici-
pants. And while executives might worry
about volatility in stock price between
the release of the data and the earnings
call, they should not be. What matters
is the longer-term value appreciation, not
the day-to-day volatility—and in any
case, volatility can be avoided if data are
presented clearly in the release and
the state of the company is described in
a consistent and meaningful way.
Be creative in the way the Q&A is structured
Most Q&A discussions are broken.
Sell-side analysts often ask questions—
“even bad ones,” as one analyst told
us—just so clients can hear their voice
on the call or see their name in the
transcript. Managers using sophisticated
call-management software often
invite questions only from the sell-side
analysts they know and like. And
buy-side analysts, arguably the most
important participants on the call,
are reluctant to reveal their thinking, and
so are primarily just listening. The
result is mediocre at best, routinely requir-
ing numerous follow-up calls, and
many questions remain unasked.
We need to start experimenting with
systems where more investors can ask
more pertinent questions, and perhaps
a different way of selecting which ones
get answered. New technologies make
this fairly easy. If a company sends out
data several days in advance of a call, it
could, for instance, encourage investors
and analysts to submit questions online
and then have an online vote on which are
the most important. The questions
2013 Number 4

131Applied Insight
3
could be posted with the names of
the people who sent them in, or perhaps
even anonymously, to reduce bias in
the vote.
Google, for example, experimented with
such an approach in 2009, albeit
without sending advanced data.2 Real-
estate company Zillow took another
tack to encourage real-time questions
during its last earnings call. Anybody
could ask a question via Twitter, encour-
aging analysts and investors in “listen
only” mode to speak up. While this
doesn’t make the poster anonymous,
the company “now has less control
over who can ask questions and what
people can ask, and . . . everyone
can see which questions management
chose to ignore.”3
Some companies might even choose to
go further. Expeditors International of
Washington, a global logistics company,
has a long-standing policy not to have
earnings calls at all. Instead, managers
respond to written questions in writing
in a Securities and Exchange Commission
filing. A 2000 disclosure form explains,
“We do not currently plan to host a
conference call. . . . We . . . believe that
investors will benefit from real written
answers to thoughtful questions. It’s a
little more work for us, but we feel that the
quality of the information disclosed will
be better with a more formal process.”4
Stop talking so much about EPS
Given how little investors care about EPS
and how far GAAP is away from true
operating metrics in many cases, there is
still too much emphasis on both in earn-
ings calls, press releases, and announce-
ments, at least with US companies.
Managers should leave those numbers
to the accountants and lawyers and
focus instead on more operating-oriented
numbers that make sense for their
business. In the simplest form, these
would be true pre- or posttax operating-
earnings numbers, adjusted for amorti-
zation of intangibles, other nonoperating
charges like the nonoperating portion
of pension costs, and nonrecurring
charges. Investors are likely to react posi-
tively to such a shift, and some large
companies are indeed already reporting
a non-GAAP operating margin.
In extreme cases, however, managers
should be even more creative, espe-
cially those with business models where
GAAP rules significantly distort eco-
nomics. For example, capital expendi-
tures, operating income, and other
consolidated GAAP data do not reflect
the underlying economics of one large
industrial company, which is forced by
GAAP to recognize some revenue as
product revenue and some—from similar
assets and contracts—as lease revenue.
Managers and investors would be better
off focusing their dialogue on a restated
set of numbers that treats all revenue
equally.5 Other examples can be found in
businesses that combine manufactur-
ing and large projects, where percentage-
of-completion accounting, and in
extreme cases even real-estate account-
ing, can significantly distort aggregated
data to the point of irrelevance for a value
assessment. Here, managers should
clearly separate the data for different busi-
nesses and focus on non-GAAP metrics
to convey the state of the business.

132
Finally, managers should eliminate
the need for the endless clarifying ques-
tions that take up the bulk of most
earnings calls by releasing more—and
more transparent—data. That means
full operating-income statements and key
operating-balance-sheet items for
business units, ideally by geography,
reconciled to the consolidated state-
ments. A number of companies routinely
publish full income statements and
balance sheets for their financial busi-
nesses, either in their regular filings,
like GE, or as a separate full report, like
Caterpillar Financial Services. Non-
financial companies that come closest
to the ideal, such as Novartis, often
offer a full income statement and capital
schedule per business unit, in annual
statements. These data are typically avail-
able internally, and given the size of
larger business units, investors deserve a
deeper look into the financials than they
are getting from the required disclosure.
For competitive reasons, not every
company can be equally transparent.
However, most are too conservative.
A table with historical volume and price
movements by region, for instance,
would clarify where growth opportunities
are. This kind of transparency allows
a clearer, more focused discussion
without giving away a strategic position
that competitors wouldn’t know
already. It is hard to imagine why every
company can’t disclose data more
readily unless they’re deliberately being
obscure or simply unable to measure
the data internally. Either possibility
should make investors more skeptical
about underlying performance.
Simple actions can greatly improve
investor communication. It’s time for com-
panies to modernize their approach.
2013 Number 4
Copyright © 2013 McKinsey & Company. All rights reserved.
1 Companies in the United States can report data that are not based on the generally accepted accounting principles (GAAP) but need to reconcile to the GAAP information, which has to be presented with equal prominence in the announcement.
2 See Dominic Jones, “Google brings transparency to the earnings call question queue,” irwebreport
.com, October 15, 2009, and “Google announces fourth quarter and fiscal year 2009 results,” investor.google.com, January 21, 2010.
3 See Benjamin Romano, “Zillow takes questions via Twitter in real-time during earnings call,” xconomy.com, May 8, 2013.
4 From a 2000 Form 8-K filing. The policy is still in place.
5 Unfortunately, this might not be allowed, as some publications by accounting authorities in the United States seem to indicate that companies are not allowed to publish a complete set of non-GAAP financials even if reconciled with GAAP financials.
Werner Rehm is a senior expert in
McKinsey’s New York office.

133
The value at stake from government and regulatory intervention is huge.
Companies that approach external engagement in a disciplined way capture
more of it.
Organizing the government-affairs function for impact Reinier Musters, Ellora-Julie Parekh, and Surya Ramkumar
€30 million for every employee involved
in handling the company’s regulatory
affairs. Another large global company
estimated that in a major acquisition,
it was €500 million a year over a decade.
Since there’s so much money on the
table, you might assume that companies
would organize government relations as
carefully as they do other business
functions. Surely, for example, companies
The business value at stake from gov-
ernment and regulatory intervention
is huge: about 30 percent of earnings1
for companies in most industries, we
estimate, and higher still in the banking
sector, where the figure tops 50 per-
cent.2 Translating those percentages
into euros, dollars, or yen can yield
eye-popping results: one European utility
found that the ongoing value at stake
from regulation was €1.5 billion, or about
Applied Insight
Illus
trat
ion
by K
eith
Neg
ley
2013 Number 4134
have people in place to understand
the relevant economics, structures, and
processes to drive this understanding
into important business activities, and
regulatory-affairs professionals who
work in a collaborative and integrated
fashion with business-unit leaders to
capture value.
Yet the reality is quite different. In our
most recent annual survey, fewer than
30 percent of the executives respond-
ing said that their external-affairs groups
had the organizational setup and
talent necessary to succeed.3 Only about
20 percent of executives reported
frequent success at influencing govern-
ment policy and regulatory decisions—
a proportion that has not increased
in the four years we’ve conducted the
survey. Our conversations with external-
affairs executives at global companies
highlight the challenges:
• “ The government-affairs team in our
company is buried under a support
function, with limited clout and
without the business leaders really
understanding what they do.”
• “ We have separate government-
affairs and external-communications
functions. They operate indepen-
dently and don’t report to the same
executive. We don’t always com-
municate on key regulatory issues as
much as we should.”
• “ Within the company we have different
functions involved in external
engagement; identifying the number
of employees involved at the
corporate, business, and country
levels is a gigantic exercise for us.”
• “ Our public-policy team works in the
shadows, so no one really knows
what the worst outcome could have
been if they had not engaged
stakeholders smartly. Tracking and
quantifying impact is very difficult.”
In this article, we’ll highlight three orga-
nizational principles that we’ve observed
leading companies apply to decrease
the likelihood of such problems and to
increase the value they get from their
regulatory functions. The importance of
these groups will only grow as indus-
tries such as food and beverages come
under new forms of regulatory scrutiny
(say, related to issues of obesity), while
others (notably the extractive industries,
such as mining) receive heightened
attention from regulators in resource-rich
emerging markets.
1. Clarify scope and structure
Regardless of what the groups are called
(public affairs and government affairs
are common choices) top companies
make sure that these organizations
excel at economic analysis and stake-
holder engagement, not just at lobby-
ing and industry-group participation. By
having staff dedicated to handling
tasks such as identifying issues, develop-
ing positions, and gathering compelling
international benchmarks, leading
government-affairs units can anticipate
a much broader range of possible
regulatory outcomes. Notably, leading

135Applied Insight
groups quantify the impact of these
outcomes on all parties involved, not just
their own companies, by including the
regulator and even the broader industry
in their analyses. This approach
dramatically improves the quality of
engagement and can even break through
seemingly deadlocked situations—for
example, when a company can quickly
and accurately show a regulatory
proposal’s negative consequences for
national employment rates or tax
revenues.
Top companies identify important
stakeholders up front and work with
them using a key account management–
style approach that borrows from best-
practice sales organizations. Designating
senior executives as “owners” for
important relationships, including those
in social media, allows for smoother
scheduling and coordination of day-to-
day activities. More important, this
approach makes it easier for a
regulatory-affairs group to provide
consistent, coherent, and proactive
communication supporting a company’s
regulatory strategy.
One telecommunications company
learned the hard way how important it is
to map connections, when its regulatory-
affairs team discovered, after the fact,
that one of its business-unit heads was
often golfing on weekends with the
president of the country in which it is
based. To avoid such missed
opportunities in the future, it explicitly
mapped out its most important
relationships and designated executives
as either primary or secondary contacts
to manage them. A mining company in
an African country adopted a similar
approach after learning that each of its
business units was engaging separately
with an important government minister—
an arrangement that made it impossible
for the company to communicate a
consistent message.
All of the companies we studied tend to
structure their government-affairs units
in one of four ways (exhibit). Yet they
face a host of design considerations,
such as the size of the team, as well as
its physical location (including special
ones chosen for strategic reasons, such
as Brussels; Washington, DC; and,
increasingly, Beijing). In situations where
decentralized regulatory-affairs teams
are required—say, in highly regulated
industries calling for deep country-level
expertise—we’ve seen companies
successfully create dual-reporting
relationships to link external affairs with
both the country head and the corporate
function. The home office helps quantify
the value at stake, shares best practices,
and makes sure the company’s broader
interests are accounted for.
An alcoholic-beverage maker, for
instance, designates corporate-level
“champions” responsible for regulatory
issues involving taxation and marketing
rules. These executives gather best
practices in areas such as engaging
stakeholders and assessing strategic
options, and then bring them to
countries or regions as needed.
Regardless of how the government-
affairs function may be structured,
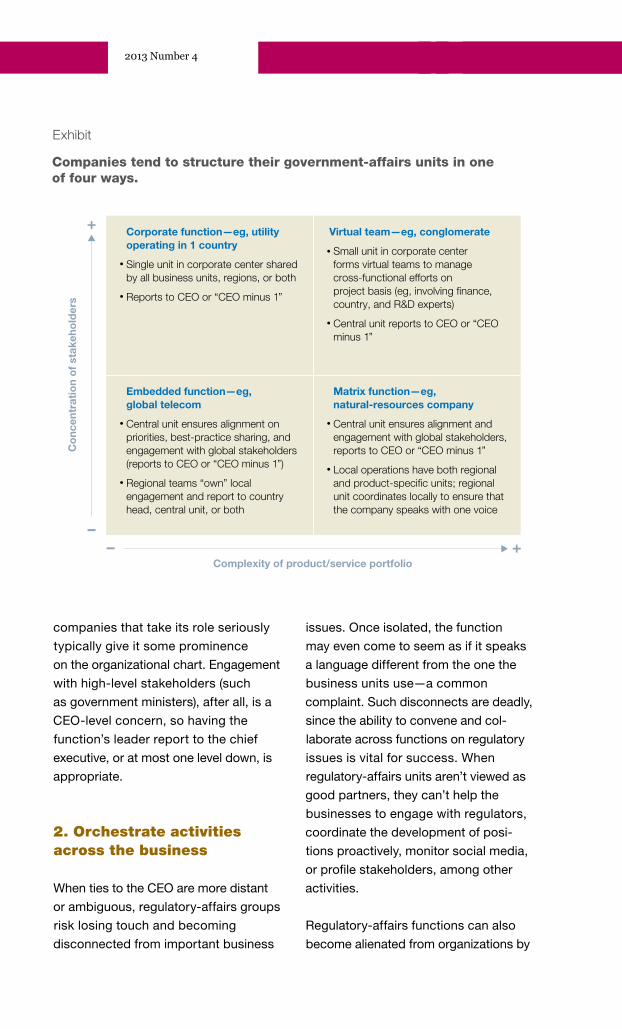
2013 Number 4136
companies that take its role seriously
typically give it some prominence
on the organizational chart. Engagement
with high-level stakeholders (such
as government ministers), after all, is a
CEO-level concern, so having the
function’s leader report to the chief
executive, or at most one level down, is
appropriate.
2. Orchestrate activities across the business
When ties to the CEO are more distant
or ambiguous, regulatory-affairs groups
risk losing touch and becoming
disconnected from important business
issues. Once isolated, the function
may even come to seem as if it speaks
a language different from the one the
business units use—a common
complaint. Such disconnects are deadly,
since the ability to convene and col-
laborate across functions on regulatory
issues is vital for success. When
regulatory-affairs units aren’t viewed as
good partners, they can’t help the
businesses to engage with regulators,
coordinate the development of posi-
tions proactively, monitor social media,
or profile stakeholders, among other
activities.
Regulatory-affairs functions can also
become alienated from organizations by
Q4 2013Regulatory organizationsExhibit 1 of 1
Companies tend to structure their government-affairs units in one of four ways.
Complexity of product/service portfolio
Co
ncen
trat
ion
of
stak
eho
lder
s
–
+
+–
Corporate function—eg, utility operating in 1 country
• Single unit in corporate center shared by all business units, regions, or both
• Reports to CEO or “CEO minus 1”
Embedded function—eg, global telecom
• Central unit ensures alignment on priorities, best-practice sharing, and engagement with global stakeholders (reports to CEO or “CEO minus 1”)
• Regional teams “own” local engagement and report to country head, central unit, or both
Matrix function—eg, natural-resources company
• Central unit ensures alignment and engagement with global stakeholders, reports to CEO or “CEO minus 1”
• Local operations have both regional and product-specific units; regional unit coordinates locally to ensure that the company speaks with one voice
Virtual team—eg, conglomerate
• Small unit in corporate center forms virtual teams to manage cross-functional efforts on project basis (eg, involving finance, country, and R&D experts)
• Central unit reports to CEO or “CEO minus 1”
Exhibit

137Applied Insight
getting involved with issues too late—for
example, reviewing proposals from other
departments after they are completed.
This often breeds misunderstandings and
casts the regulatory group in the role
of naysayer, a perception that’s tough to
overcome. Late involvement can have
substantial economic costs as well, if, for
example, a product is developed with-
out input from regulatory affairs and later
fails to get approval from regulators.
By contrast, an airport-management
company we studied views the regulatory-
affairs group as a “broker of intelligence”
and has processes to ensure that it
works closely with other functions. For
example, biweekly meetings at the
middle-management level bring together
representatives from strategy, pricing,
legal, finance, operations, and safety to
work with regulatory affairs on pressing
concerns. Individuals are designated to
lead the necessary analyses on an
issue-by-issue basis.
Similarly, a large European insurance
company holds ongoing roundtables to
help colleagues in other functions
understand how to address and respond
to regulatory issues. These forums are
popular among managers and help the
regulatory group remain part of the
company’s inner circle of management
decision making.
The European arm of a diversified manu-
facturer aims to avoid organizational
disconnects by maintaining a small group
of geographic and topic experts
who help the business units with priority
issues, project by project. When the
company wants quick but deep engage-
ment on an issue (say, the taxation of
a category of offerings in a particular
geography), product and country experts
can join colleagues from the local
finance and operations teams to work
with the relevant business unit.
3. Build talent and accountability
Once a company clarifies what the
external-affairs group will do, how it
should be structured, and how it
should collaborate with other functions,
the next task is staffing it with good
people. Among most companies,
we have observed three types of leaders:
industry veterans, with deep legal
or economic training (the role’s classic
profile); high-profile lobbyists or former
politicians, who bring credibility and
clout (useful when companies face
pressure on a particular issue); or inter-
nally promoted business insiders
(useful in strengthening cross-functional
connections and gaining buy in).

2013 Number 4138
Any of these three can work well, so
long as the leader coordinates effectively
across business units while getting—
and keeping—the respect and attention
of senior management. Increasingly,
leading companies tap all three types—
for instance, by choosing people who
are strong in one area and complementing
their skills with those of others outside
the function, including providers such as
specialist lobbying firms.
Moreover, some companies are starting
to use rotation programs that move
staffers between the regulatory function
and the business units to give these
employees experience and improve the
odds that their insights will be relevant
to the businesses. Companies that
combine the regulatory and strategy
functions, as some utilities do, tend
to be best at this approach. The instinct
to cross-pollinate talent is a good one:
among low-performing companies, very
few external-affairs personnel have line
experience. At one company we studied,
only the department head had it; more
junior colleagues played supporting
roles. Such arrangements not only deny
these employees valuable opportunities
but also put companies at consider-
able risk if experienced staffers decide
to leave.
By contrast, more sophisticated com-
panies appear to view the relationship
between the businesses and the
government-affairs function as a two-
way street. A European telecom operator,
for example, integrates regulatory
skills into the training that every C-suite
occupant receives upon promotion.
Similarly, a tobacco company holds
regular academies for its marketing and
sales personnel to keep their engage-
ment skills sharp.
To increase understanding of the regu-
latory function’s importance, a European
power company publishes an internal
newsletter that keeps senior manage-
ment abreast of evolving regulatory
topics and aware of the considerable
value at stake. The newsletter keeps
the group more connected to business
issues and improves morale by raising
its profile in the company.
Even among companies that other-
wise excel on the talent dimension, nearly
all struggle to measure the impact of
regulatory affairs in a structured way and
Even among companies that otherwiseexcel on the talent dimension, nearly all struggle to measure the impact of regulatory affairs.

139Applied Insight
thus provide meaningful incentives for
staffers. While few best practices have
been identified so far, some companies
are taking the same analyses they use to
understand the regulatory value at
stake for a given issue and adapting
them to their performance-management
systems. These quantitative measure-
ments are then complemented by more
indirect indicators, such as the quality
of relationships with important stake-
holders or changes in the level of access
to them over a period of time. Such
approaches, while still in their early days,
could prove a useful means of linking
performance to real business outcomes.
Good regulatory management starts
with good organizational design. Com-
panies can increase the odds of getting
more business value from this important
function by picking the right design
and making the most of it, breaking silos
and building bridges with other func-
tions, and developing talented people and
quantifying their impact.
1 Earnings before interest, taxes, depreciation, and amortization (EBITDA).
2 For more, see Robin Nuttall and Sergio Sandoval, “The new value at stake in regulation,” January 2010, mckinsey.com.
3 From January 29 to February 8, 2013, we surveyed 2,186 executives on external affairs at their companies. The respondents represented the full range of regions, industries, company sizes, tenures, and functional specialties.
Copyright © 2013 McKinsey & Company. All rights reserved.
The authors wish to acknowledge the
contributions of David Dyer, Luis
Enriquez, and Robin Nuttall to the
development of this article. Reinier Musters is a principal in
McKinsey’s Amsterdam office, where
Surya Ramkumar is a consultant;
Ellora-Julie Parekh is a consultant in
the London office.

140
Copyright © 2013 McKinsey & Company. All rights reserved.
Did your industry beat the market?
Extra Point
For more on industry winners and losers, see “The strategic yardstick you can’t afford to ignore,” on page 24.
Different companies and industries create and destroy value at vastly different
rates. Just how different? The exhibit shows the distribution across industries
of economic profit: what’s left of a company’s net operating profit after its capital
costs are subtracted. Between 2007 and 2011, a number of industries (those
on the left of the chart) created substantial economic profit, a significant slice (on
the right) had negative results, and many were in the middle. To a large extent,
these differences reflect industry-wide trends—shifting tides can lift or submerge
many boats. But performance isn’t a foregone conclusion—not all companies
conform to the ebb and flow of industries. In fact, our research also shows that a
below-average company in a good industry appears no more likely to beat
the market than an above-average company in a bad one.
Chris Bradley is a principal in McKinsey’s Sydney office, where Taichi Hoshino is a consultant.
Chris Bradley and Taichi Hoshino
Q4 2013Extra point: Beat the market cost curveExhibit 1 of 1
1 For 2,888 companies in 60 industries; column width proportionate to number of companies in industry. Widespread creation of economic profit = >$0.1 billion per company; minimal creation or actual destruction = $0.1 billion to –$0.1 billion per company; and widespread destruction = below –$0. 1 billion per company.
2.5
3.0
2.0
–2.0
1.5
–1.5
1.0
–1.0
0.5
–0.5
0
Widespread creation of economic pro�t
Minimal creation or actual destruction
Widespread destruction
Average economic profit by industry,1 2007–11, $ billion
Pharmaceuticals
Wireless telecom services
Computers and peripherals
Oil, gas, and consumable fuels
Metals and mining
Industrial conglomerates
Chemicals
Software
Beverages
Machinery
Food products
Media
Hotels, restaurants, and leisure
Electric utilities
Road and rail
Airlines
Construction materials


mckinsey.com/quarterly
Highlights:
New McKinsey thinking on
strategy, corporate performance,
and the building blocks
of market-beating strategies
Reallocating corporate
resources: setting the right
pace as a new CEO, making
bold changes in a downturn,
and ten techniques that can
work anytime
Mobilizing your C-suite for
big-data analytics
A leader’s guide to civic
engagement, by three
executives on the front lines
The CEOs of Pentair and
Solvay reflect on recent
strategic transformations
Organizing your government-
affairs function for impact
Building the social enterprise
How B2B companies talk
past their customers