Embed Size (px)
Citation preview

McGraw-Hill Education Q3-2017 Update November 14, 2017
This presentation has been prepared for investors in the currently outstanding debt of McGraw-Hill Global Education Holdings, LLC and MHGE Parent, LLC. Final

Important Notice
2
Forward-Looking Statements
This presentation includes statements that are, or may be deemed to be, “forward-looking statements.” These forward-looking statements can be identified by the use of
forward-looking terminology, including the terms “believes,” “estimates,” “anticipates,” “expects,” “intends,” “plans,” “may,” “will” or “should” or, in each case, their
negative or other variations or comparable terminology. These forward-looking statements include all matters that are not historical facts. They appear in a number of
places throughout this presentation and include statements regarding our intentions, beliefs or current expectations concerning, among other things, our results of
operations, financial condition, liquidity, prospects, growth, strategies and the industry in which we operate.
By their nature, forward-looking statements involve risks and uncertainties because they relate to events and depend on circumstances that may or may not occur in the
future. We caution you that forward-looking statements are not guarantees of future performance and that our actual results of operations, financial condition and liquidity,
and the development of the industry in which we operate, may differ materially from those made in or suggested by the forward-looking statements contained in this
presentation. In addition, even if our results of operations, financial condition and liquidity, and the development of the industry in which we operate are consistent with the
forward-looking statements contained in this presentation, those results of operations, financial condition and liquidity or developments may not be indicative of results or
developments in subsequent periods.
Any forward-looking statements we make in this presentation speak only as of the date of such statement, and we undertake no obligation to update such statements.
Comparisons of results for current and any prior periods are not intended to express any future trends or indications of future performance, unless expressed as such, and
should only be viewed as historical data.
Non-GAAP Financial Measures
Certain financial information included herein, including Billings, EBITDA and Adjusted EBITDA, are not presentations made in accordance with U.S. GAAP, and use of such
terms varies from others in our industry. Billings, EBITDA and Adjusted EBITDA should not be considered as alternatives to revenue, net income from continuing operations,
operating cash flows or any other performance measures derived in accordance with U.S. GAAP as measures of operating performance, debt covenant compliance or cash
flows as measures of liquidity. Billings, EBITDA and Adjusted EBITDA have important limitations as analytical tools, and you should not consider them in isolation or as
substitutes for analysis of our results as reported under U.S. GAAP. This presentation includes a reconciliation of certain non-GAAP financial measures to the most directly
comparable financial measures calculated in accordance with U.S. GAAP.
Adjusted EBITDA, which is defined in accordance with our debt agreements, is provided herein on a segment basis and on a consolidated basis. Adjusted EBITDA by
segment, as determined in accordance with Accounting Standards Codification Topic 280, Segment Reporting, is a measure used by Management to assess the performance
of our segments. Adjusted EBITDA on a consolidated basis is presented as a debt covenant compliance measure. Management believes that the presentation of Adjusted
EBITDA is appropriate to provide additional information to investors about certain material non-cash items and about unusual items that we do not expect to continue at
the same level in the future as well as other items to assess our debt covenant compliance, ability to service our indebtedness and make capital allocation decisions in
accordance with our debt agreements.

Business Review

4
McGraw-Hill Education
Total MHE Performance: YTD 9/30/172
MHE Billings $1,527M (-1.6%) MHE EBITDA Before Pre-Publication $478M (-0.4%) MHE Pre-publication Investment $74M (+33.9%) MHE Adjusted EBITDA $405M (-4.8%) MHE Digital Billings $701M (+14.5%) % MHE Digital Billings 46% +700bps Direct-to-Student E-Commerce Net Sales $195M (+15.3%) (Updated as of YTD 10/31/17)
Market Share
Higher Ed3 - LTM 9/30/17 +100 bps K-124 – YTD 9/30/17 +10 bps Key Indicators Connect/LearnSmart Paid Activations 3.5M (+7.7%) (Updated as of YTD 10/31/17)
ALEKS Unique Users 3.5M (+22.4%) (as of YTD 9/30/17)
MHE Inc. Liquidity at 9/30/17 Cash $305M Credit Line Capacity $350M Total Liquidity $655M
McGraw-Hill Education Q3-2017 Results Back-to-school peak season complete for U.S.; performance in line with preliminary results
12017 front-list represents 2018 and 2017 copyrights sold in 2017 2Effective Q4-16 and prospectively, MHE no longer incudes the change in deferred royalties within the change of deferred revenue. On a FY basis, the net change is immaterial; prior periods do not reflect the change 3Per Management Practice, Inc. (MPI) 4Per AAP
McGraw-Hill continued to take share in Higher Ed; expanded its market share in K-12 Open Territory and performed well despite a prior-year tough comparison in K-12 Adoptions
Higher Ed business stabilizing as anticipated and performing well vs. prior year
- Stronger performance in front-list titles1, primarily
2018 ©; continued digital growth led by e-commerce; and more normalized ordering and return patterns among largest channel partners
Maintained a leadership position in CA and FL K-12 Adoptions despite competing against a +400 bp Adoption market share gain in 2016; gained share in a smaller K-12 Open Territory market
Pre-publication investment increasing in advance of sizeable Higher Ed front-list opportunities and large upcoming K-12 Adoptions
Cash continuing to build seasonally with line of credit fully repaid in September
Company fully compliant with all debt agreements
Note: Connect paid activations and direct-to-student e-commerce sales updated as of YTD 10/31/17 Amounts may not sum due to rounding.

McGraw-Hill Higher Ed Performance: YTD 9/30/172
Billings (net of accrued returns) $574M (+2.1%) Digital Billings $359M (+12.0%) % Digital Billings 63% +600bps Direct-to-Student E-Commerce Net Sales $195M (+15.3%) (Updated as of YTD 10/31/17)
Net Sales (net of actual returns)3 $582M (+3.4%) Front-list Sales (net of actual returns) $250M (+6.6%) Back-list Sales (net of actual returns) $331M (+1.1%) McGraw-Hill Higher Ed Actual Product Returns Actual Returns Change -$31M (-15.3%) (Updated as of YTD 10/31/17)
vs. Industry Performance: (net actual returns basis)4
Industry Net Sales YTD 9/30/17 +1.3% MHE Market Share Change LTM 9/30/17 +100 bps Key Indicators Connect/LearnSmart Paid Activations 3.5M (+7.7%) (Updated as of YTD 10/31/17)
ALEKS Unique Users 1.5M (+30.2%) (as of YTD 9/30/17)
Higher Education
McGraw-Hill Higher Education Q3-2017 Results Investment in front-list and digital leadership drive top-line stability in Higher Ed
12017 front-list represents 2018 and 2017 copyrights sold in 2017 2Effective Q4-16 and prospectively, MHE no longer incudes the change in deferred royalties within the change of deferred revenue. On a FY basis, the net change is immaterial; prior periods do not reflect the change 3Total net sales include the impact of accounting accruals/reversals; accrued returns not included 4Per Management Practice, Inc. (MPI) 5
Higher Ed performed well in the back-to-school season,
achieving results significantly better than prior year
Digital transition continues with a 6 percentage point improvement in digital Billings mix to 63%
- YTD e-commerce net sales surpassed full-year 2016, exceeded net sales of three largest distribution channels combined and accounted for 1/3 of total YTD net sales
- Strong digital growth continued into October
Larger front-list1 led by 2018 ©, drove positive net sales
growth and mitigated normal decline in back-list print
- YTD front-list print net sales growth improved from -36% in 2016 vs. +3% in 2017
Returns tracking favorably YTD (through mid-November) with trend expected to continue through seasonally large return period that concludes at end of this month
Continuing to invest in robust front-list for calendar year 2018 (2019 ©) and expect to expand rental program in 2018 based on 2017 pilot learnings
Continued to improve collaboration with some key distribution channel partners
Note: Connect paid activations and direct-to-student e-commerce sales updated as of YTD 10/31/17 Primary difference between Billings and net sales (industry market share measure) is the accrual of returns

6
McGraw-Hill Higher Ed Performance Overview Key MHE drivers for a successful 2017 – So far, so good….Q4 remains important
Timing Seasonal Considerations & Drivers Results/Status
Jan. – Feb. Digital sales / paid activations Strong results driven by e-commerce and paid activations
Feb. – Apr. Actual product returns Improvement in product returns vs. 2016
Apr. – June Low digital;
Start of print ordering by channel
Digital sales later in season
- Digital ordering continues to shift to the start of school (Q2 to Q3) as direct-to-student sales increase
End of June – early Sept.
Digital & print shift from Q2 to Q3 Sell-through of larger front-list
Abatement of print channel destocking
Solid Performance - Anticipated digital & print shift from late June to closer to school
year did occur - Net sales +3.4% YTD Sept. 30th 2017 vs. -10.7% YTD Sept. 30th
2016
Aug. – Sept. Direct-to-student e-commerce sales
Paid digital activations
Strong results - Direct-to-student e-commerce +15.3% YTD Oct. 31st - Connect/LearnSmart paid activations +7.7% YTD Oct. 31st
Oct. – Nov. Actual product returns
Digital growth continues into Oct.
- Actual returns down $31M or -15.3% YTD Oct. 31st 2017.; rest of Nov. is critical
- Some shifting of digital activations and sales from Sept. as students trial digital and activate in Oct.
Dec. Continue to shift to Jan. direct-to-student digital
sales with the ongoing digital transition Too early in the season to determine impact of sales shift to Q1
Note: Connect paid activations and direct-to-student e-commerce sales updated as of YTD 10/31/17

McGraw-Hill K-12 Performance: YTD 9/30/17 Billings (net of accrued returns) $680M (-3.4%) Digital Billings $269M (+21.2%) % Digital Billings 40% +800bps vs. Industry Performance as per AAP1: YTD 9/30/17 MHE Net Sales (-3.2%) Industry Net Sales (-3.8%) MHE Market Share Change +~10 bps MHE Adoption Net Sales (-3.1%) Industry Adoption Net Sales (-1.0%) MHE Market Share Change -~70 bps MHE Open Territory Sales (-3.3%) Industry Open Territory Net Sales (-6.3%) MHE Market Share Change +~60 bps Key Indicators: YTD 9/30/17 ConnectED Unique Users 7.2M (+22.4%) ALEKS Unique Users 2.0M (+17.0%)
7
1 As per Monthly AAP data - Cohort of publishers for monthly AAP data differs from that of annual AAP data - Monthly data reflects net sales on an actual returns basis submitted by 6-7 publishers - Annual data reflects net sales on an actual returns basis submitted by 5 publishers
K-12
McGraw-Hill K-12 Q3-2017 Results Held market share overall despite tough CA comp; gained market share in Open Territory
Expect to retain a leadership position in second year of the California ELA Adoption despite tough comparison to outsized 2016 performance and to lead Florida Social Studies Adoption
- 2017 CA English Language Arts Billings in line with August estimate with total MHE CA sales greater than $200M
- 2017 FL Social Studies Billings ahead of prior estimate with total MHE FL sales greater than $60M
Gained market share in Open Territory YTD Sept 30th
, while market contracted 6% YTD, contrary to broad industry expectations for market growth
- Some schools ordered later than normal this year and some school districts have deferred purchase decisions
- Q4 is a seasonally small period
Preparations for 2018 and 2019 new adoptions remain on track, specifically California Social Studies (2018), Florida Science (2018), Texas Reading (2019), California Science (2019) and Florida Math (2019)
- On November 9th
, McGraw-Hill’s Social Studies program was approved for sale in California
Note: Primary difference between Billings and net sales (industry market share measure) is the accrual of returns
8
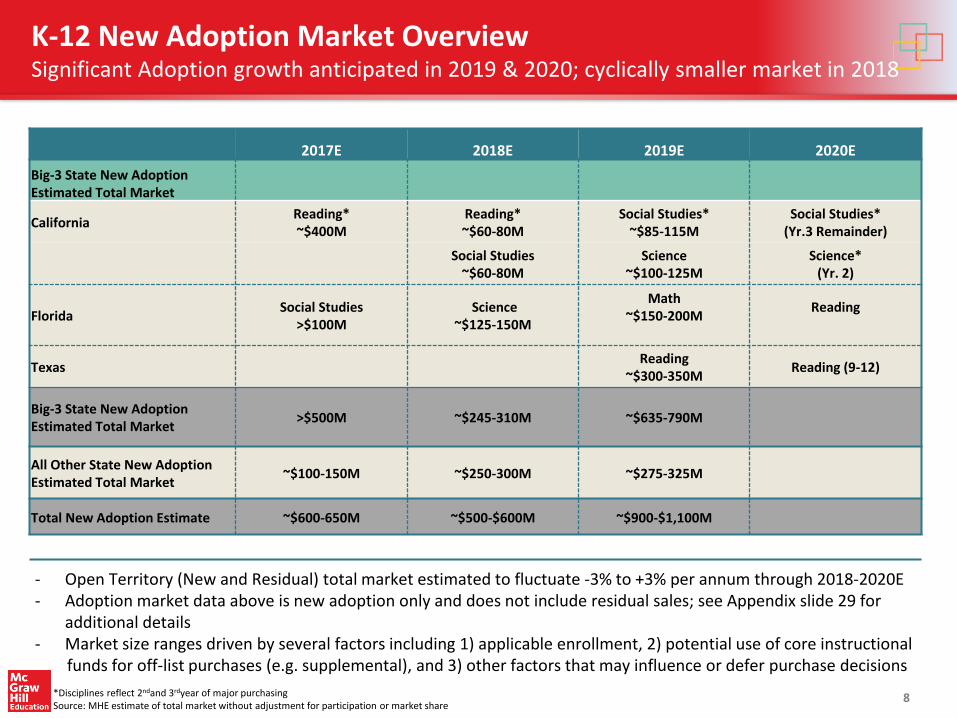
K-12 New Adoption Market Overview Significant Adoption growth anticipated in 2019 & 2020; cyclically smaller market in 2018
*Disciplines reflect 2ndand 3rdyear of major purchasing Source: MHE estimate of total market without adjustment for participation or market share
2017E 2018E 2019E 2020E
Big-3 State New Adoption Estimated Total Market
California Reading* ~$400M
Reading* ~$60-80M
Social Studies* ~$85-115M
Social Studies* (Yr.3 Remainder)
Social Studies
~$60-80M Science
~$100-125M Science*
(Yr. 2)
Florida Social Studies
>$100M Science
~$125-150M
Math ~$150-200M
Reading
Texas Reading
~$300-350M Reading (9-12)
Big-3 State New Adoption Estimated Total Market >$500M ~$245-310M ~$635-790M
All Other State New Adoption Estimated Total Market
~$100-150M ~$250-300M ~$275-325M
Total New Adoption Estimate ~$600-650M ~$500-$600M ~$900-$1,100M
- Open Territory (New and Residual) total market estimated to fluctuate -3% to +3% per annum through 2018-2020E - Adoption market data above is new adoption only and does not include residual sales; see Appendix slide 29 for
additional details - Market size ranges driven by several factors including 1) applicable enrollment, 2) potential use of core instructional funds for off-list purchases (e.g. supplemental), and 3) other factors that may influence or defer purchase decisions

9
International & Professional International
Digital transition continues but not enough to offset declining print sales in several regions including Europe, India and Asia
Billings on large Middle East contract to be recognized in fourth quarter; similar to prior year
- Middle East contract is largely digital content
Billings impact of $4M from sale of Canadian K-12 business in Q2
YTD favorable FX impact versus prior year of $2M on Billings and $3M on EBITDA
Professional
Digital subscription Billings favorable YTD, nearly offsetting print decline, with a strong pipeline built for Q4 as the digital conversion continues
- YTD Access digital Billings subscription growth up 5%
Margin improvement from continued growth in digital, coupled with operating expense reductions from earlier restructuring
McGraw-Hill International Performance: YTD 9/30/17 Billings (constant FX) 1 $189M (-6.8%) Digital Billings $31M (+2.1%) Digital Billings % 16% +100bps YTD 9/30/17 Key Indicators - International Connect/LearnSmart Paid Activations +~330K (+21%) ALEKS Unique Users +~123K (+27%) McGraw-Hill Professional Performance: YTD 9/30/17 Billings $80M (-1.5%) Digital Billings $40M (+2.7%) Digital Billings % 50% +200bps Key Indicators - Professional Access Platform Renewal Rate2 93%
1K-12 business in Canada was sold in May 2017 2As of December 2016; updated on an annual basis
McGraw-Hill International & Professional Q3-2017 Results Digital transition continues but sales growth not enough to offset print headwinds

0.7 1.0 1.6 2.0 1.7 2.0 0.8
0.9
1.1 1.3
1.2 1.5
1.5 2.0
2.7
3.3 2.9
2013 2014 2015 2016 YTD Sept2016
YTD Sept2017
K-12 Higher Ed
2.2 2.6 3.0 3.3 3.1
3.4
2013 2014 2015 2016 YTD Sept2016
YTD Sept2017
CONNECT/LEARNSMART PAID ACTIVATIONS (US HIGHER ED)
ALEKS UNIQUE USERS (GLOBAL HIGHER ED, K-12)
(Millions)
ConnectED UNIQUE USERS (K-12)
2.2
3.5
5.2
7.1 5.9
7.2
2013 2014 2015 2016 YTD Sept2016
YTD Sept2017
+7%
+22%
+22%
LONG-STANDING LEADER IN DIGITAL ADAPTIVE LEARNING
MHE digital adaptive learning exhibiting growth in users, paid activations and interactions
Continued growth in Connect/LearnSmart paid activations +7.7% YTD 10/31/17
Back-to-school season extended well into October as the successful digital transition has driven additional purchases through mid-terms/first assignment
~74M assignments submitted through Connect, up 10% Y/Y
~8.5B interactions (questions answered) on LearnSmart since 2009
~6.2B interactions (questions answered) on ALEKS since 2010
McGraw-Hill Education Q3-2017 Digital Ed Tech Highlights ~15 billion cumulative adaptive interactions providing valuable insights into learning outcomes
10
3.5
International Connect/LearnSmart Paid Activations of ~330K+ not incl.in Connect/LearnSmart totals above; International ALEKS Unique Users of ~123K+ incl. within total ALEKS Unique Users above.

34% 38% 45% 56% 57% 63%
66% 62% 55% 44% 43% 37%
2013 2014 2015 2016 YTD 2016 YTD 2017
Digital Print (Traditional + Custom)
DIGITAL VS. PRINT BILLINGS MIX %1
11
YTD NINE MONTH E-COMMERCE NET SALES SURPASS FY 2016
Digital Billings continue to grow as a share of total Higher Ed Billings and reached 63% of total in YTD Sept. 30
th, up 6
percentage points1
Digital sales benefited in part from more professors transitioning to digital when the new front-list editions became available
Direct-to-student e-commerce sales represented 32% of total Higher Ed Billings in the YTD period (seasonally impacted)
E-commerce is now a larger channel than the next three distribution channel partners combined, which each grew net sales YTD September
August and September remain largest months for e-commerce but growth continues into October
McGraw-Hill Education Higher Ed Q3-2017 Digital Billings 6 percentage point gain in digital mix driving revenue stability and predictability
$67
$105
$140 $172 $162
$186
2013 2014 2015 2016 YTD 2016 YTD 2017
E-COMMERCE NET SALES*
+15% ($ in Millions)
YTD Sept 2016
YTD Sept 2017
(Traditional + Custom)
YTD Sept 2016
YTD Sept 2017
*Direct-to-student e-commerce net sales of $195, up +15% as of YTD 10/31/17
1Effective Q4-16 and prospectively, MHE no longer incudes the change in deferred royalties within the change of deferred revenue. On a FY basis, the net change is immaterial; prior periods do not reflect the change.

Financial Review

$13 $14
$39 $40
46% 46% 48% 50%
$16 $16
$30 $31
17% 19% 15% 16%
$130 $141
$222
$269
34% 39% 32% 40%
$170 $202
$320 $359
$329 $373
$612 $701
40% 45% 39% 46%
13
($ in Millions)
MCGRAW-HILL EDUCATION1
+14%
K-12 HIGHER ED1
PROFESSIONAL INTERNATIONAL
% of Total Billings
% of Total Billings
% of Total Billings
% of Total Billings
% of Total Billings
+12% +21%
+3% +2%
Q3-16 Q3-17
Q3-16 Q3-17
57% 63%
+18%
Q3-16 Q3-17
+9%
Q3-16 Q3-17
+2% +6%
Q3-16 Q3-17
+13%
McGraw-Hill Education Q3-2017 Digital Billings Mix Digital Billings up across all business units in Q3 and YTD
Higher Ed favorably impacted by growth in e-commerce sales
K-12 driven by product mix with strong sales of 6-12 digital Literature in California and Social Studies in Florida
52% 58%
YTD Sept 2016 YTD Sept 2017
YTD Sept 2016 YTD Sept 2017
YTD Sept 2016 YTD Sept 2017 YTD Sept 2016 YTD Sept 2017
YTD Sept 2016 YTD Sept 2017
1Effective Q4-16 and prospectively, MHE no longer incudes the change in deferred royalties within the change of deferred revenue. On a FY basis, the net change is immaterial; prior periods do not reflect the change.

BILLINGS1
MHE YTD Billings down 1.6%
Higher Ed business turned around in 2017 with outperformance in front-list, stabilization of back-list and continued growth in digital
K-12 gained market share in an Open Territory market that declined. Adoption state Billings were strong but down vs. a tough comp in 2016
EBITDA BEFORE AND AFTER PRE-PUBLICATION EXPENSE
EBITDA before pre-publication investment flat YTD as digital product mix and previous cost containment efforts more than offset lower Billings
YTD pre-publication investment of $74M, up $19M or +34% as the company invests in a larger Higher Ed front-list in 2018 and ahead of large K-12 adoptions in 2018-2020; FY 17 pre-publication anticipated at $100-105M
FY 2018 pre-publication investment anticipated to be up ~$10-15M, driven by K-12
$433 $417
$480 $478
Q3-16 Q3-17 YTD Sept 2016 YTD Sept 2017
$409 $392 $425 $405
49% 48% 27% 27%
$832 $823
$1,551 $1,527
MHE TOTAL BILLINGS1
14
($ in Millions)
Digital %
(2%)
40% 45%
Constant FX (-1%) $820 (-2%) $1,525
McGraw-Hill Education
Q3-16 Q3-17
39% 46%
(1%)
MHE EBITDA BEFORE PRE-PUBLICATION INVESTMENT
(0%)
Constant FX (-5%) $391 (-6%) $402
(4%)
McGraw-Hill Education Financial Review Strong performance in line with October preliminary report
MHE ADJUSTED EBITDA2
Margin %
Q3-16 Q3-17
YTD Sept 2017 YTD Sept 2016
YTD Sept 2016 YTD Sept 2017
1Effective Q4-16 and prospectively, MHE no longer incudes the change in deferred royalties within the change of deferred revenue. On a FY basis, the net change is immaterial; prior periods do not reflect the change.
2Includes the impact of pre-publication costs incurred in advance of future year sales. Pre-publication costs relate to the cost of developing products and are capitalized and amortized over
the life of the new product for GAAP purposes and in Adjusted Post-Plate EBITDA reflected as cash investment.
52% 51% 31% 31% Margin %
(4%) (5%)

BILLINGS
YTD Billings driven by solid front-list performance (in both print and digital) and continued digital strength
Front-list print increased 3% vs. a decline of 36% in prior year
Net sales to each of three largest distribution partners increased YTD
YTD 9/30/17 Connect activations up 7% and e-commerce sales grew 15%
Expect product returns to continue to trend favorably and in-line with management expectations
1% of YTD Billings growth driven by change in deferred royalty calculation change; will reverse itself in Q4
EBITDA BEFORE AND AFTER PRE-PUBLICATION INVESTMENTS
YTD EBITDA before pre-publication up 7% as stronger top line results and historical cost savings drove margin expansion
YTD pre-publication investment of $24M, up $6M or +35% to support investment in current year and 2018-2020 front-list
$202 $208
$212
$228
Q3-16 Q3-17 YTD Sept 2016 YTD Sept 2017
$192 $199 $194 $204
$326 $347
$562 $574
15
($ in Millions)
HIGHER ED TOTAL BILLINGS1
+2%
52% 58% 57% 63%
+6%
59% 57% 35% 35%
Q3-16 Q3-17
1Effective Q4-16 and prospectively, MHE no longer incudes the change in deferred royalties within the change of deferred revenue. On a FY basis, the net change is immaterial;
prior periods do not reflect the change. 2Includes the impact of pre-publication costs incurred in advance of future year sales.
Higher Ed Financial Review Investment in front-list & continued digital leadership drove strong YTD performance
+3% +5%
+7%
+3%
HIGHER ED EBITDA BEFORE PRE-PUBLICATION INVESTMENTS
Margin %
Higher Education
YTD Sept 2016 YTD Sept 2017
62% 60% 38% 40%
Q3-16 Q3-17 YTD Sept 2017 YTD Sept 2016
HIGHER ED ADJUSTED EBITDA2
Digital %
Margin %

K-12 ADJUSTED EBITDA1
$193 $180
$234 $217
Q3-16 Q3-17 YTD Sept 2016 YTD Sept 2017
$185 $168 $210
$181
48% 47% 30% 27%
$383 $360
$704 $680
16
($ in Millions)
K-12 TOTAL BILLINGS
(3%)
(14%)
34% 39% 32% 40%
(6%)
Q3-16 Q3-17
(9%)
Q3-16 Q3-17
BILLINGS
YTD Billings declined slightly due to a tough comparison vs. 2016 CA performance and despite taking market share in a declining Open Territory market where some local district buying decisions were postponed
MHE preparations on track and progressing for future new Adoption opportunities in 2018 and 2019
EBITDA BEFORE AND AFTER PRE-PUBLICATION EXPENSE
YTD EBITDA before pre-publication down 7% as margins were impacted by the lower Billings
YTD pre-publication investment of $36M, up $13M or +57% reflecting investment in 2018 and 2019 adoption opportunities
K-12 Financial Review Held market share despite tough comparison in adoption market
YTD Sept 2016 YTD Sept 2017
YTD Sept 2016 YTD Sept 2017
K-12
K-12 EBITDA BEFORE PRE-PUBLICATION INVESTMENTS
(7%)
(7%)
Margin %
1Includes the impact of pre-publication costs incurred in advance of future year sales.
50% 50% 33% 32%
Digital %
Margin %

$22
$14 $16
$6
Q3-16 Q3-17 YTD Sept 2016 YTD Sept 2017
$17 $13
$7
(-$2) 18% 15% 4% -1%
$95 $86
$203 $191
INTERNATIONAL ADJUSTED EBITDA1
17
($ in Millions)
INTERNATIONAL TOTAL BILLINGS
Q3-16 Q3-17
Q3-16 Q3-17
BILLINGS
YTD Billings down 6% in reported currency, and decreased 7% in constant currency
Excluding Canadian K-12 divestiture, reported YTD Billings declined 4% versus prior year
EBITDA BEFORE AND AFTER PRE-PUBLICATION EXPENSE
YTD decline in EBITDA resulting from Billings decline and Middle East contract related expense timing
YTD pre-publication investment of $8M, down $1M or -10% YTD Sept 2016 YTD Sept 2017
YTD Sept 2016 YTD Sept 2017
International
INTERNATIONAL EBITDA BEFORE PRE-PUBLICATION INVESTMENTS
Margin %
International Financial Review Digital transition continues; Middle East contract billings anticipated in Q4
Constant FX (-13%) $83 (-7%) $189
17% 19% 15% 16%
(6%)
(10%)
* % Y/Y change not meaningful
Constant FX nm $11 nm -$5
K-12 business in Canada was sold in May 2017. 1Includes the impact of pre-publication costs incurred in advance of future year sales
* % Y/Y change not meaningful
Digital %
Margin % 23% 16% 8% 3%

$9 $10
$16 $19
$10 $12
$21 $25
Q3-16 Q3-17 YTD Sept 2016 YTD Sept 2017
$28 $30
$81 $80
PROFESSIONAL ADJUSTED EBITDA1
18
($ in Millions)
PROFESSIONAL TOTAL BILLINGS
Q3-16 Q3-17
Q3-16 Q3-17
BILLINGS
Digital growth in Access product line is offset by continuing expected declines in trade print portfolio
EBITDA BEFORE AND AFTER PRE-PUBLICATION EXPENSE
YTD growth in EBITDA from margin growth as a result of higher digital Billings, coupled with operating expense savings from earlier restructuring
YTD pre-publication investment of $5M, up $0.1M or +3%
Professional Financial Review Digital growth continues with digital pipeline building in Q4
YTD Sept 2016 YTD Sept 2017
YTD Sept 2016 YTD Sept 2017
Professional
PROFESSIONAL EBITDA BEFORE PRE-PUBLICATION INVESTMENTS
+17%
+18%
Margin %
1Includes the impact of pre-publication costs incurred in advance of future year sales.
37% 42% 26% 31%
(1%)
+5%
46% 48% 50% 46%
31% 35% 20% 24%
+22%
+19%
Digital %
Margin %

MHE’s cash position is building in the second half of
the year with $668M of liquidity at Sept. 30th
and
continuing to grow in Q4
- Revolver fully repaid; $350M undrawn capacity
$50M repurchase authorization for 8.5% 2019
PIK/Toggle Notes remains available as of today with
cash held at Holdco
- No repurchases made in Q3-17; $8M
repurchases made subsequently
- Debt callable at par
Term Loan Restricted Payment capacity was ~$160M
at Sept. 30, 2017 and will fluctuate seasonally1
- Not impacted by subsequent repurchases as
cash used was already at Holdco
Capital Structure and Liquidity Significant seasonal cash balances building; bank revolver fully repaid
Senior Secured Term Loan due 2022 $1,555 Revolving Credit Facility due 2021 ($350M) 0 Total First Lien Indebtedness $1,555 Less: McGraw-Hill Global Education Cash and Cash Equivalents (246) Net First Lien Indebtedness $1,309 Last Twelve Months Covenant EBITDA $402 Net First Lien Leverage Ratio 3.3x Senior Unsecured Notes Due 2024 400 Net Total Indebtedness $1,709
Cash and Cash Equivalents McGraw-Hill Global Education Holdings $246 MHGE Parent LLC (Holdco) / MHE Inc. 59 Total McGraw-Hill Education, Inc. $305 Available under Credit Facilities at Sept. 30, 2017 350 Total Liquidity $655
MCGRAW-HILL EDUCATION INC. (MHE INC.) LIQUIDITY: 9/30/17
Notes ˗ Net Total Indebtedness calculation excludes $451M debt held at MHGE Parent LLC and cash held at MHGE Parent LLC and MHE Inc. as of Sept. 30th ˗ Net First Lien Leverage covenant takes effect only if 30% of revolving line of credit is drawn at quarter-end. Usage was less than 30% at Sept. 30, so covenant did
not apply. Covenant level is 5.25x in Q2 and 4.8x in Q1, Q3 and Q4. 19
MCGRAW-HILL GLOBAL EDUCATION HOLDINGS COVENANT LEVERAGE
($ in Millions)
1Includes $100M general RP basket

20
MHE performed competitively in both Higher Ed and K-12 YTD Sept. 30th
Higher Ed plan was to rebuild the front-list and to continue growing digital
- Successfully drove Billings stabilization YTD vs. decline of 11% last year
K-12 plan was to aggressively compete in Adoption market against a tough 2016 outperformance
comparison and to take market share in Open Territory
- Plan was successful in retaining leading market share in the two largest adoption markets and taking
market share in Open Territory
International business continues in transition with revenue related to large Middle East contract expected
in Q4
Professional business continues digital growth with success of Access platform
Revolving line of credit fully repaid and significant seasonal cash balances building
Reinvesting in 2018 front-list for Higher Education and 2018-2020 Adoption opportunities in K-12
- Particularly K-12 large opportunities in 2019 and 2020
Summary Stabilization in Higher Ed; competitive performance in K-12 with large opportunities ahead

Appendix

Financial Terms and Acronyms
22
Financial Terms Description
Adjusted EBITDA
Non-GAAP financial measure that includes adjustments required or permitted in calculating covenant compliance under our debt agreements. Adjusted EBITDA is a non-GAAP financial measure defined as net income from continuing operations plus net interest, income taxes, depreciation and amortization (including amortization of pre-publication investment cash costs) and adjusted to exclude unusual items and other adjustments required or permitted in calculating covenant compliance under our debt agreements less cash spent for pre-publication investment in addition to the change in deferred revenue.
Billings (formerly referred to as Adjusted Revenue)
Non-GAAP financial measure that we define as U.S. GAAP revenue plus the net change in deferred revenue excluding the impact of purchase accounting. Billings, a measure used by management to assess sales performance, is defined as the total amount of revenue that would have been recognized in a period if all revenue were recognized immediately at the time of sale.
Change in Deferred Revenue
The Company receives cash up-front for most product sales but recognizes revenue (primarily related to digital sales) over time recording a liability for deferred revenue at the time of sale. This adjustment represents the net effect of converting deferred revenues to a cash basis assuming the collection of all receivable balances.
Change in Deferred Royalty
Represents royalties primarily associated with digital sales which are deferred and amortized over the subscription period. It is the net effect of converting deferred royalties to a cash basis assuming the payment of all amounts owed in the period incurred.
Digital Billings (formerly referred to as Digital Adjusted Revenue)
Represents standalone digital sales and, where digital product is sold in a bundled arrangement, only the value attributed to the digital component(s) is included. The attribution of value in bundled arrangement is based on relative selling prices (inclusive of discounts).
EBITDA Earnings before interest (net), income tax, depreciation and amortization.
Front-list and Back-list Front-list represents brand new titles and new revisions of existing titles previously published. For example, the 2017 front-list represents 2018 and 2017 copyrights sold in 2017. Back-list represents copyrights from 2016 and prior sold in 2017.
Net Sales Gross sales less actual returns; net sales are not adjusted for the impact of accruals / net change in deferred revenue.
Pre-publication Investment
Pre-publication costs reflect the costs incurred in the development of instructional solutions, principally design and content creation. These costs are capitalized when the title is expected to generate future economic benefits and are amortized upon publication of the title over its estimated useful life of up to six years.
Sell-through Represents the percentage of net sales a new or revised title generates vs. prior editions of the same title.
KPI Terms Description
Paid Activation A user who accesses a purchased digital product for the first time. Access can be through a physical access card purchased from a bookstore or directly over MHE’s e-commerce channel.
Unique User on a platform
An individual who authenticates a product at least once during a given period of time.

Product Description Higher Education K-12 International Professional
Access Digital subscription platform that provides easily searchable and customizable digital content integrated with dynamic and functional workflow tools
ALEKS Adaptive learning technology for the K-12 and Higher Ed markets
Connect Open learning environment for students and instructors in the Higher Education market and K-12 students taking AP courses
Connect2 Collaborative teaching and learning environment for the International Higher Education market
ConnectED Content delivery platform for the K-12 market
ELLevate English Six level English Language Learning (ELL) course
Engrade Developer of an open digital platform for K-12 education that unifies the data, curriculum and tools to drive student achievement and inform district educational strategy
LearnSmart Adaptive learning program which personalizes learning and designs targeted study paths for students
Redbird A leading digital personalized learning company that offers courses in K-12 math, language arts and writing, and virtual professional development programs for educators
SmartBook Adaptive reading product designed to help students understand and retain course material by guiding each student through a highly personal study experience
StudyWise Adaptive offering that supports students in adaptive practice on smartphones. StudyWise extends the reach of Connect and Connect2 allowing students to efficiently learn in their natural environment
Digital Product Offering Descriptions
23

Supplemental Financial
Disclosure

25
Billings is a non-GAAP sales performance measure that provides useful information in evaluating our period-to-period performance because it reflects the total amount of revenue that would have been recognized in a period if we recognized all print and digital revenue at the time of sale. We use Billings as a sales performance measure given that we typically collect full payment for our digital and print solutions at the time of sale or shortly thereafter, but recognize revenue from digital solutions and multi-year deliverables ratably over the term of our customer contracts. As sales of our digital learning solutions have increased, so has the amount of revenue that is deferred in accordance with U.S. GAAP. Billings is a key metric we use to manage our business as it reflects the sales activity in a given period, provides comparability from period-to-period during this time of digital transition and is the basis for all sales incentive compensation. In the K-12 market where customers typically pay for five to eight year contracts upfront and the ongoing costs to service any contractual obligation are limited, the impact of the change in deferred revenue is most significant. Billings is U.S. GAAP revenue plus the net change in deferred revenue. EBITDA, a measure used by management to assess operating performance, is defined as net income from continuing operations plus net interest, income taxes, depreciation and amortization (including amortization of pre-publication investment cash costs). Adjusted EBITDA is a non-GAAP debt covenant compliance measure that is defined in accordance with our debt agreements. Adjusted EBITDA is a material term in our debt agreements and provides an understanding of our debt covenant compliance, ability to service our indebtedness and make capital allocation decisions in accordance with our debt agreements. Each of the above described measures is not a recognized term under U.S. GAAP and does not purport to be an alternative to revenue, income from continuing operations, or any other measure derived in accordance with U.S. GAAP as a measure of operating performance, debt covenant compliance or to cash flows from operations as a measure of liquidity. Additionally, each such measure is not intended to be a measure of free cash flows available for management’s discretionary use, as it does not consider certain cash requirements such as interest payments, tax payments and debt service requirements. Such measures have limitations as analytical tools, and you should not consider any of such measures in isolation or as substitutes for our results as reported under U.S. GAAP. Management compensates for the limitations of using non-GAAP financial measures by using them to supplement U.S. GAAP results to provide a more complete understanding of the factors and trends affecting the business than U.S. GAAP results alone. Because not all companies use identical calculations, our measures may not be comparable to other similarly titled measures of other companies. Management believes Adjusted EBITDA is helpful in highlighting trends because Adjusted EBITDA excludes the results of decisions that are outside the control of operating management and can differ significantly from company to company depending on long-term strategic decisions regarding capital structure, the tax rules in the jurisdictions in which companies operate, and capital investments. In addition, Billings and Adjusted EBITDA provides more comparability between the historical operating results and operating results that reflect purchase accounting and the new capital structure post the Founding Acquisition as well as the digital transformation that we are undertaking which requires different accounting treatment for digital and print solutions in accordance with U.S. GAAP. Management believes that the presentation of Adjusted EBITDA is appropriate to provide additional information to investors about certain material non-cash items and about unusual items that we do not expect to continue at the same level in the future as well as other items to assess our debt covenant compliance, ability to service our indebtedness and make capital allocation decisions in accordance with our debt agreements.
Note: In compliance with SEC interpretative guidance, we now refer to ‘Adjusted Revenue’ as ‘Billings’ throughout the presentation.
Billings and Adjusted EBITDA

Twelve Months Ended December 31 Nine Months Ended
2012 2013 2014 2015 2016 Sept. 30, 2016 Sept. 30, 2017
Digital Net Sales
Front-list $100 $126 $132 $156 $149 $115 $127
Back-list 137 153 194 220 263 211 232
Total Digital Net Sales $237 $278 $326 $376 $411 326 $359
Y/Y %
Front-list (6.0%) 25.1% 5.2% 18.2% (4.7%) (5.9%) 10.7%
Back-list 53.7% 11.8% 27.1% 13.4% 19.2% 19.9% 9.8%
Total Digital Net Sales 21.1% 17.4% 17.2% 15.3% 9.3% 9.3% 10.1%
Print Net Sales
Front-list $317 $323 $291 $233 $149 $120 $123
Back-list 205 215 233 178 152 117 100
Total Print Net Sales $523 $538 $524 $411 $302 $237 $223
Y/Y %
Front-list (23.9%) 1.9% (9.9%) (20.0%) (35.9%) (35.8%) 2.7%
Back-list 0.6% 4.7% 8.5% (23.6%) (14.6%) (19.7%) (14.7%)
Total Print Net Sales (15.9%) 3.0% (2.6%) (21.6%) (26.7%) (28.7%) (5.9%)
Total Net Sales
Front-list $418 $449 $423 $389 $298 $235 $250
Back-list 342 368 427 398 415 328 331
Total Net Sales 2 $760 $817 $851 $787 $713 $563 $582
Y/Y %Front-list (20.3%) 7.5% (5.7%) (8.1%) (23.4%) (24.0%) 6.6%
Back-list 16.7% 7.5% 16.2% (6.8%) 4.1% 2.0% 1.0%
Total Net Sales (7.0%) 7.5% 4.2% (7.4%) (9.5%) (10.7%) 3.4%
Other (Accounting Accruals/Reversals) 2 (1) 4 5 (2) (6) (5)
Total Net Sales3 $762 $816 $855 $793 $711 $556 $576
Y/Y % (7.5%) 7.1% 4.8% (7.3%) (10.3%) (10.9%) 3.6%
26
($ in Millions)
12017 front-list represents 2018 and 2017 copyrights sold in 2017; they do not begin to impact current year until very late Q2.
2Gross sales less actual returns; net sales are not adjusted for the impact of accruals / net change in deferred revenue.
3Reflects the impact of accounting related to accruals / deferrals.
MHE Higher Ed Front-List / Back-List Net Sales1

27
($ in Millions)
1MPI data reflects gross and net sales on an actual returns basis and includes other adjustments, eg. Advanced Placement products, which are reported in the K-12 business.
Amounts may not sum due to rounding.
Higher Ed Industry and MHE Higher Ed Sales Trend
2011 2012 2013 2014 2015 2016 Sept 2016 Sept 2017
Higher Ed Industry per Management Practice, Inc.1
Higher Ed Market
Gross Sales $5,726 $5,420 $5,453 $5,465 $5,302 $4,695 $3,646 $3,477
Returns 1,323 1,311 1,262 1,214 1,377 1,250 829 621
Net Sales $4,403 $4,110 $4,191 $4,251 $3,925 $3,446 $2,817 $2,855
Y/Y %
Gross Sales n/a (5.3%) 0.6% 0.2% (3.0%) (11.4%) (9.8%) (4.7%)
Returns n/a (0.9%) (3.7%) (3.8%) 13.5% (9.2%) (1.6%) (25.0%)
Net Sales n/a (6.7%) 2.0% 1.4% (7.7%) (12.2%) (11.9%) 1.3%
McGraw-Hill Education Return Detail
Actual Returns $263 $276 $257 $252 $277 $237 $163 $134
Reserve for Returns Adjustment (3) (13) 9 16 (31) (23) (10) 3
Reported Returns $260 $263 $266 $268 $246 $215 $153 $138
Return Accrual % 24.4% 25.8% 25.1% 24.4% 23.4% 22.7% 22.7% 21.2%
Nine Months EndedTwelve Months Ended December 31

28
1Excludes new state adoptions in non-core disciplines such as career and technical education, music, art, world languages, health, etc.
Purchases from AR and IN classified as open territory effective 2015. GA has revised its adoption schedule to “local school system decisions” for 2017 and, as a result, predictability is not assured, so the schedule above will not reflect GA adoptions post-2016. 2Mississippi swapped Science (now 2018) with Social Studies (now 2019).
*Disciplines reflect 2nd
and 3rd
year of major purchasing.
K-12 Industry New Adoption Market Overview
2012 2013 2014 2015 2016 2017 2018E 2019E 2020E
Largest Adoption States
Reading Reading* Science Science*
Math Social Studies Social Studies* Social Studies*
Reading (K-5) Reading (6-12)
Math (K-5) Math (6-12)
Math (K-8) Math (9-12)
Social StudiesScience*
All Other Adoption States
Alabama Math Reading Social Studies Science Math
Arkansas Math
Math*
Reading
Idaho Science Reading Math Social Studies Reading Science
Indiana Reading Reading*
Math (K-8)
Social Studies
North Carolina Math Science Social Studies Reading
New Mexico Science Math Reading Social Studies Science Math
Math
Social Studies (6-12)
Math ReadingSocial Studies* Science
Social Studies
Math
Science
Social Studies 2
MathReading
Math Reading*
Social Studies
Reading Math (9-12) Reading Science 2
Social Studies Science Reading Math
Social StudiesScienceMathReading*Reading
Social Studies
Reading
Social Studies
Social Studies (K-5)Reading
Science
Science
Social Studies
Louisiana
New State Adoptions by Purchase Year1
California (K-8)
Florida
Texas
Georgia
Science Reading (K-8)
MathScienceSocial Studies
Math
Social Studies
Math* Reading Reading*
West Virginia
Mississippi
Oklahoma
Oregon
South Carolina
Tennessee
Virginia
Reading (9-12) Reading (K-6) Social Studies Math Science
Reading Science Math Reading
Social Studies
Reading (K-12)
Reading (9-12)
Math
Reading

29
($ in Millions)
Twelve Months Ended December 31 Nine Months Ended
2012 2013 2014 2015 2016 Sept. 30, 2016 Sept. 30, 2017
K-12 Industry per Association of American Publishers (AAP)
AAP U.S. Net Sales 1
Total Adoption $1,311 $1,391 $1,860 $1,621 $1,250 $1,234 $1,221
Open Territory 1,423 1,563 1,425 1,431 1,467 1,424 1,335
Total Net Sales $2,734 $2,954 $3,285 $3,052 $2,717 $2,658 $2,556
Y/Y %
Total Adoption n/a 6.2% 33.6% (12.8%) (22.9%) n/a (1.0%)
Open Territory n/a 9.8% (8.8%) 0.4% 2.5% n/a (6.3%)
Total Net Sales n/a 8.1% 11.2% (7.1%) (11.0%) n/a (3.8%)
McGraw-Hill Education K-12
McGraw-Hill Education Billings 2
Total Adoption $320 $318 $366 $450 $411 $391 $380
Open Territory / Other 378 359 369 348 348 313 300
Total K-12 Billings $698 $677 $734 $798 $758 $704 $680
Y/Y %
Total Adoption n/a (0.5%) 15.0% 23.0% (8.6%) (5.6%) (2.8%)
Open Territory / Other n/a (5.0%) 2.6% (5.7%) (0.1%) (1.3%) (4.2%)
Total K-12 Billings n/a (3.0%) 8.5% 8.6% (4.9%) (3.7%) (3.4%)
MHE Adoption Participation % 96% 79% 67% 76% 87% 87% 96%
1AAP annual data reflects unrestated net sales on an actual returns basis submitted by five publishers; data reflects US sales & includes sales of AP products, software & platforms, etc.
AAP includes front-list and back-list net sales; annual data prior to 2015 has not been restated for the shift of AR and IN from adoption to open territory. Monthly AAP data reflects net sales on an actual returns basis submitted by six - seven publishers; YTD 2016 data has been restated. 2MHE Billings reflect an accrued returns basis and will not reconcile to AAP submission due to classification of revenue; total adoption includes new adoption and residual.
MHE Billings have not been restated for the shift of AR and IN in prior periods.
K-12 Industry and MHE K-12 Sales Trend

30
Figures are represented on a cash basis inclusive of actual returns but excluding purchase accounting adjustments. Accrued returns are reflected in print revenue. 1Effective Q4-16 and prospectively, MHE no longer incudes the change in deferred royalties within the change of deferred revenue. On a FY basis, the net change is immaterial; prior periods do not reflect the change.
($ in Millions) Q3-2017 Billings Detail by Component
YTD Sept. 2017 Billings Detail by Component
Digital vs. Print Billings Detail
2015 2016 2017 2016 2015 2016 2017 2016 2015 2016 2017 2016
Higher Ed1 $288 $320 $359 12.0% $342 $242 $215 (11.0%) $630 $562 $574 2.1%
K-12 276 222 269 21.2% 456 482 411 (14.7%) 731 704 680 (3.4%)
International 24 30 31 2.1% 193 173 160 (7.3%) 217 203 191 (5.9%)
Professional 37 39 40 2.7% 46 42 40 (5.4%) 82 81 80 (1.5%)
Other 2 0 1 N/M 0 1 0 N/M 2 1 1 N/M
Total MHE $627 $612 $701 14.5% $1,036 $939 $826 (12.0%) $1,663 $1,551 $1,527 (1.6%)
% of Total
Higher Ed 46% 57% 63% 54% 43% 37% 100% 100% 100%
K-12 38% 32% 40% 62% 68% 60% 100% 100% 100%
International 11% 15% 16% 89% 85% 84% 100% 100% 100%
Professional 45% 48% 50% 55% 52% 50% 100% 100% 100%
Total MHE 38% 39% 46% 62% 61% 54% 100% 100% 100%
% D vs % D vs % D vs
Sep YTD Digital Billings Sep YTD Print Billings Sep YTD Total Billings
2015 2016 2017 2016 2015 2016 2017 2016 2015 2016 2017 2016
Higher Ed1 $160 $170 $202 18.4% $226 $156 $145 (6.8%) $386 $326 $347 6.4%
K-12 169 130 141 8.7% 266 253 219 (13.4%) 435 383 360 (5.9%)
International 13 16 16 2.1% 87 79 70 (12.1%) 100 95 86 (9.7%)
Professional 11 13 14 6.1% 19 15 16 4.8% 30 28 30 5.4%
Other 1 0 0 N/M (0) 0 0 N/M 0 0 0 N/M
Total MHE $355 $329 $373 13.5% $597 $503 $450 (10.6%) $952 $832 $823 (1.1%)
% of Total
Higher Ed 42% 52% 58% 58% 48% 42% 100% 100% 100%
K-12 39% 34% 39% 61% 66% 61% 100% 100% 100%
International 13% 17% 19% 87% 83% 81% 100% 100% 100%
Professional 38% 46% 46% 62% 54% 54% 100% 100% 100%
Total MHE 37% 40% 45% 63% 60% 55% 100% 100% 100%
% D vs % D vs% D vs
Q3 Digital Billings Q3 Print Billings Q3 Total Billings

Free Cash Flow
31
($ in Millions)
Cash Flow Comparison 2016 2017 Y/Y $
Adjusted EBITDA 425 405 (21)
∆ in Accounts Receivable, net (188) (208) (19) AR: sales growth in Sep and timing of collections
∆ in Inventories, net (18) 1 19 Inventory: higher Dec-16 balances in anticipation of future K-12 opportunities
∆ in Prepaid & Other Current Assets (20) (7) 14 Prepaid: non-operational Transitional Services Agreement receivable changes
∆ in Accounts Payable and Accrued Expenses (107) (46) 61 (~$15M) and settlement of available-for-sale balances (~$5M) in FY 16
∆ in Other Current Liabilities (31) (26) 4 AP / Accrued: lower spend in FY 16 and timing of AP payments in FY 15 and FY16
∆ in Reported Working Capital Accounts (364) (286) 78 (~$40M), lower compensation accruals at Dec-16 (~$15M)
Adjustments to Derive Operational Working Capital1 29 5 (24) Other Current: driven by timing of expense and new capital lease obligations
∆ in Adjusted Working Capital Accounts (335) (281) 54 beginning in FY 16
Adjusted EBITDA less Adjusted ∆ in Working Capital Accounts 90 124 34
Pre-publication Investment 55 74 19 Pre-pub: driven by investment in Higher Ed front-list and K-12 new adoption
Restructuring and Cost Savings Implementation Charges (10) (9) 0 opportunities
Sponsor Fees (3) (3) 0
Cash Interest (140) (121) 19 Cash Interest: largely driven by refinancing
Net (loss) from Discontinued Operations (2) (0) 1
Operational Working Capital Adjustments and Other2 (2) (8) (6)
Cash (used for) provided by operating activities (11) 56 67
∆ in NWC including Adjustments to Derive Operational Working Capital
2016 2017 Y/Y $
Adjusted EBITDA less ∆ in Working Capital Accounts per above 90 124 34 ∆ in Accounts Receivable, net (184) (223) (39)
- Capital Expenditures & Payment of Capital Lease Obligations (29) (38) (9) ∆ in Inventories, net (17) (2) 15
Operating Free Cash Flow2 61 86 25 ∆ in Prepaid & Other Current Assets (8) 11 19
∆ in AP and Accrued Expenses (108) (44) 64
∆ in Other Current Liabilities (18) (23) (5)
Cash Balance at Beginning of Period 553 419 (134) Total (335) (281) 54
Cash (used for) provided by operating activities (11) 56 67
Dividends (320) (4) 317 Pre-Publication Investment Detail
Net Debt (Payments) / Receipts 146 (12) (158) 2016 2017 Y/Y $
Repurchase of MHGE PIK Toggle Notes - (48) (48) Higher Education 18 24 6
Pre-publication Investment (55) (74) (19) K-12 23 36 13
Capital Expenditures (26) (32) (5) International 9 8 (1)
Investments, Acquisitions & Divestitures, net - 7 7 Professional 5 5 0
Payment of Capital Lease Obligations (2) (6) (4) Total 55 74 19
Repurchase of Equity (6) (6) 0
Other (12) 4 17
Cash Balance at End of Period 266 305 40
Source: Consolidated Statement of Cash Flows and Adjusted EBITDA reconciliation
1 includes the impact of certain non operational, Cash EBITDA or capital structure working capital items
(i.e., purchase accounting, accrued interest, deferred royalties, income taxes, available for sale assets, etc.)2 includes adjustment for deferred royalties included in calculation of Adjusted EBITDA
Nine Months Ended Sep 30,
Key Drivers
Key Variance Drivers

Adjusted EBITDA Reconciliation
32
($ in Millions)
($ in Millions) Year Ended LTM
Sept. 30, 2016 Sept. 30, 2017 Sept. 30, 2016 Sept. 30, 2017 Dec. 31, 2016 Sept. 30, 2017
Net Income 139$ 125$ (89)$ (35)$ (135)$ (82)$
Interest (income) expense, net 43 46 155 133 200 178
Provision for (benefit from) taxes on income 4 4 9 10 15 16
Depreciation, amortization and plate investment amortization 60 73 158 180 202 224
EBITDA 247$ 248$ 233$ 288$ 282$ 336$
Change in deferred revenue (a) 190 188 211 205 173 167
Change in deferred royalties (b)1 (12) (29) (17) (35) (18) (36)
Restructuring and cost savings implementation charges (c) 3 3 10 9 17 17
Sponsor fees (d) 1 1 3 3 4 4
Loss on extinguishment of debt (e) - - 27 - 27 -
Other (f) 4 6 14 8 29 23
Pre-publication investment cash costs (g) (24) (25) (55) (74) (90) (108)
Adjusted EBITDA 409$ 392$ 425$ 405$ 423$ 402$
Three Months Ended Nine Months Ended
Amounts above may not sum due to rounding. 1Effective Q4-16 and prospectively, MHE no longer incudes the change in deferred royalties within the change of deferred revenue. On a FY basis, the net change is immaterial; prior periods do not reflect the change.

Adjusted EBITDA Footnotes
33
(a) We receive cash up-front for most sales but recognize revenue (primarily related to digital sales) over time recording a liability for deferred revenue at the time of sale. This adjustment represents the net effect of converting deferred revenues to a cash basis assuming the collection of all receivable balances. (b) Represents royalties primarily associated with digital sales which are deferred and amortized over the subscription period. It is the net effect of converting deferred royalties to a cash basis assuming the payment of all amounts owed in the period incurred (c) Represents severance and other expenses associated with headcount reductions and other cost savings initiated as part of our formal restructuring initiatives to create a flatter and more agile organization. (d) Beginning in 2014, $3.5 million of annual management fees was recorded and payable to Apollo. (e) This amount represents the write-off of unamortized deferred financing fees, original debt discount and other fees and expenses associated with the Company’s refinancing of its existing indebtedness on May 4, 2016. (f) For the three and nine months ended September 30, 2017 the amount represents (i) non-cash incentive compensation expense and (ii) other adjustments required or permitted in calculating covenant compliance under our debt agreements. For the three and nine months ended September 30, 2016, the amount represents (i) non-cash incentive compensation expense and (ii) other adjustments required or permitted in calculating covenant compliance under our debt agreements. (g) Represents the cash cost for pre-publication investment during the period.

Revenue Bridge & Segment Detail
34
($ in Millions)
Amounts above may not sum due to rounding.
Sept. 30, 2016 Sept. 30, 2017 Sept. 30, 2016 Sept. 30, 2017
Reported Revenue 642$ 635$ 1,340$ 1,321$
Change in Deferred Revenues 190 188 211 205
Billings 832$ 823$ 1,551$ 1,527$
Billings by segment
Higher Education1 326$ 347$ 562$ 574$
K - 12 383 360 704 680
International 95 86 203 191
Professional 28 30 81 80
Other 0 0 1 1
Total Billings 832$ 823$ 1,551$ 1,527$
Adjusted EBITDA
Higher Education 192 199 194 204
K - 12 185 168 210 181
International 17 13 7 (2)
Professional 9 10 16 19
Other 6 2 (2) 3
Total Adjusted EBITDA 409$ 392$ 425$ 405$
Three Months Ended Nine Months Ended
1Effective Q4-16 and prospectively, MHE no longer incudes the change in deferred royalties within the change of deferred revenue. On a FY basis, the net change is immaterial; prior periods do not reflect the change.

35
($ in Millions)
Adjusted Operating Expenses Bridge
Sept. 30, 2016 Sept. 30, 2017 Sept. 30, 2016 Sept. 30, 2017
Operating Expense Bridge
Total Reported Operating Expenses 299$ 315$ 899$ 908$
Less: Depreciation & Amortization of intangibles (31) (33) (97) (100)
Less: Amortization of prepublication costs (29) (40) (61) (80)
Less: Restructuring and cost savings implementation charges (3) (3) (10) (9)
Less: Other adjustments (5) (7) (16) (24)
Adjusted Operating Expenses 230$ 231$ 715$ 695$
Three Months Ended Nine Months Ended
Amounts above may not sum due to rounding.