Embed Size (px)
Citation preview

November 1, 2009
Authors/reseArchers
David F. D’Alessandro
Paul D. romary
Lisa J. scannell
Bryan Woliner
MBTA Review
p. 1MBtA review | November 2009
Mission . . . . . . . . . . . . . . . . . . . . . . . . . . . . . . . . . . . . . . . . . . . . . . . . . . . . . . . . . . . . . . . . . . 2
the outlook Is Bleak . . . . . . . . . . . . . . . . . . . . . . . . . . . . . . . . . . . . . . . . . . . . . . . . . . . 3
the starting Point — the Promise of Forward Funding . . . . . . . . . . . . . . 5
Forward Funding — What Was supposed to happen . . . . . . . . . . . . . . . . 6
What really happened — A Promise unfulfilled . . . . . . . . . . . . . . . . . . . . . . . 7
expenses . . . . . . . . . . . . . . . . . . . . . . . . . . . . . . . . . . . . . . . . . . . . . . . . . . . . . . . . . . . . . . . 8
Fuel & utilities . . . . . . . . . . . . . . . . . . . . . . . . . . . . . . . . . . . . . . . . . . . . . . . . . . . . . . . . . 8
Payroll & Fringe Benefits . . . . . . . . . . . . . . . . . . . . . . . . . . . . . . . . . . . . . . . . . . . . . . 9
the ride . . . . . . . . . . . . . . . . . . . . . . . . . . . . . . . . . . . . . . . . . . . . . . . . . . . . . . . . . . . . . 10
commuter rail . . . . . . . . . . . . . . . . . . . . . . . . . . . . . . . . . . . . . . . . . . . . . . . . . . . . . . . 11
revenue — A Mixed result . . . . . . . . . . . . . . . . . . . . . . . . . . . . . . . . . . . . . . . . . . . 12
sales tax revenue . . . . . . . . . . . . . . . . . . . . . . . . . . . . . . . . . . . . . . . . . . . . . . . . . . . 12
transportation revenue . . . . . . . . . . . . . . . . . . . . . . . . . . . . . . . . . . . . . . . . . . . . . . 13
Non-operating revenue . . . . . . . . . . . . . . . . . . . . . . . . . . . . . . . . . . . . . . . . . . . . . 14
the real Picture . . . . . . . . . . . . . . . . . . . . . . . . . . . . . . . . . . . . . . . . . . . . . . . . . . . . . . . 15
Debt service to the rescue — temporarily . . . . . . . . . . . . . . . . . . . . . . . . . . . 17
Debt — the Faustian Bargain . . . . . . . . . . . . . . . . . . . . . . . . . . . . . . . . . . . . . . . . 20
At risk — system safety & reliability . . . . . . . . . . . . . . . . . . . . . . . . . . . . . . . . 22
review summary & General recommendations . . . . . . . . . . . . . . . . . . . . 29
Acknowledgments . . . . . . . . . . . . . . . . . . . . . . . . . . . . . . . . . . . . . . . . . . . . . . . . . . . . 33
reference Materials . . . . . . . . . . . . . . . . . . . . . . . . . . . . . . . . . . . . . . . . . . . . . . . . . . . 35
table of contents

p. 2 MBtA review | November 2009
Mission
This document is the result of an independent review of the Massachusetts Bay Transportation Authority (MBTA) requested by Governor Deval Patrick. Begun in late August 2009, the review’s mission was to examine the MBTA’s financial condition, operations and organization. The Governor asked us to provide a “frank assessment of the MBTA’s condition.” He directed his administration and MBTA officials to cooperate with this review and they did so fully. At no time did anyone in the administration interfere with or attempt to influence our process or findings. No government or MBTA official read or edited this report in advance of its delivery to the Governor.
Our findings deadline was November 1, 2009. Within this time frame it was possible to conduct a top-line review of the MBTA’s performance versus past plans and future expectations. We were able to determine “what works well, what doesn’t work well and the extent of its challenges.” While it was unfortunately impossible to meet with all of the MBTA’s many constituencies, we conducted hundreds of relevant interviews.
our work involved these basic aspects:
• Reviewing numerous internal and external documents, analyses and plans
• Interviewing current and former MBTA and transportation officials at many different levels, meeting with external experts and related constituents
• Interviewing a number of government officials
• Analyzing all of the data gathered and forming a set of conclusions
We were not asked for specific recommendations.
In forming our conclusions, we verified and utilized data from a variety of reports, public documents, MBTA and Executive Office of Transportation documents as well as information generated from interviews and meetings. Most of the MBTA financial information is from MBTA audited statements and/or its Chief Financial Officer and his staff.
As regards other urban transportation systems, we note that many also face deficits and great challenges. We focused on the MBTA’s issues, as every system is very different in terms of age, size, modes of transportation and funding mechanisms. Generally, we did examine major market comparisons in wages, fare prices and cost per mile and determined the MBTA was within reasonable ranges.
But, in our time frame of 60 days, our primary assignment was to review one system—the MBTA. Here is what we found.
What works well, what doesn’t work
well and the extent of its challenges.

p. 3MBtA review | November 2009
the outlook Is Bleak
The legislation known as “Forward Funding” that was implemented in July 2000 to make the MBTA financially self-sufficient was a great idea. Unfortunately, the MBTA plan developed to implement Forward Funding was unrealistic and destined to fail. As a result, a structural operating deficit between expenses and revenue has existed for many years—predating this administration.
Through depleting cash reserves, restructuring debt and delaying planned debt payments, the MBTA has managed to meet its requirement to balance its annual budget. Unfortunately, the repeated restructuring of hundreds of millions of dollars in debt payments achieved the exact opposite intent of the legislation that sought to transform the MBTA, and postponed the day of reckoning for repaying deferred interest and principal.
As homeowners painfully learned in the sub-prime mortgage debacle, it is only a matter of time before those delayed payments are due.
That time has arrived.
The MBTA must now face larger and growing deficits over the next few years as a result of these restructurings, added debt and many unavoidable costs that are now built into the system.
This year the MBTA’s FY10 budget faced a deficit of $186M. After MBTA management exercised $26M in budget cuts, the remaining shortfall was resolved when the Legislature authorized the transfer of $160M in new sales tax revenues to the MBTA, on top of the MBTA’s existing sales tax revenue base. Assuming this $160M amount is dedicated each year for the next four, it represents only a partial solution to emerging deficits.
Based on current revenue and expenditure trends, the MBTA will post cumulative deficits through FY14 as follows:
(1,200)
(900)
(600)
(300)
FY 2011 FY 2012 FY 2013 FY 2014
$ M
illio
ns
$70M
$230M
$155M
$475M
$329M
$809M
Without new sales tax revenue
With $160M in new sales tax revenue
0
$550M
$1.19B
our “frank assessment”
concludes that a structural operating
deficit has existed for many years.
Projected MBtA cumulative Deficits
FY11-FY14
p. 4 MBtA review | November 2009
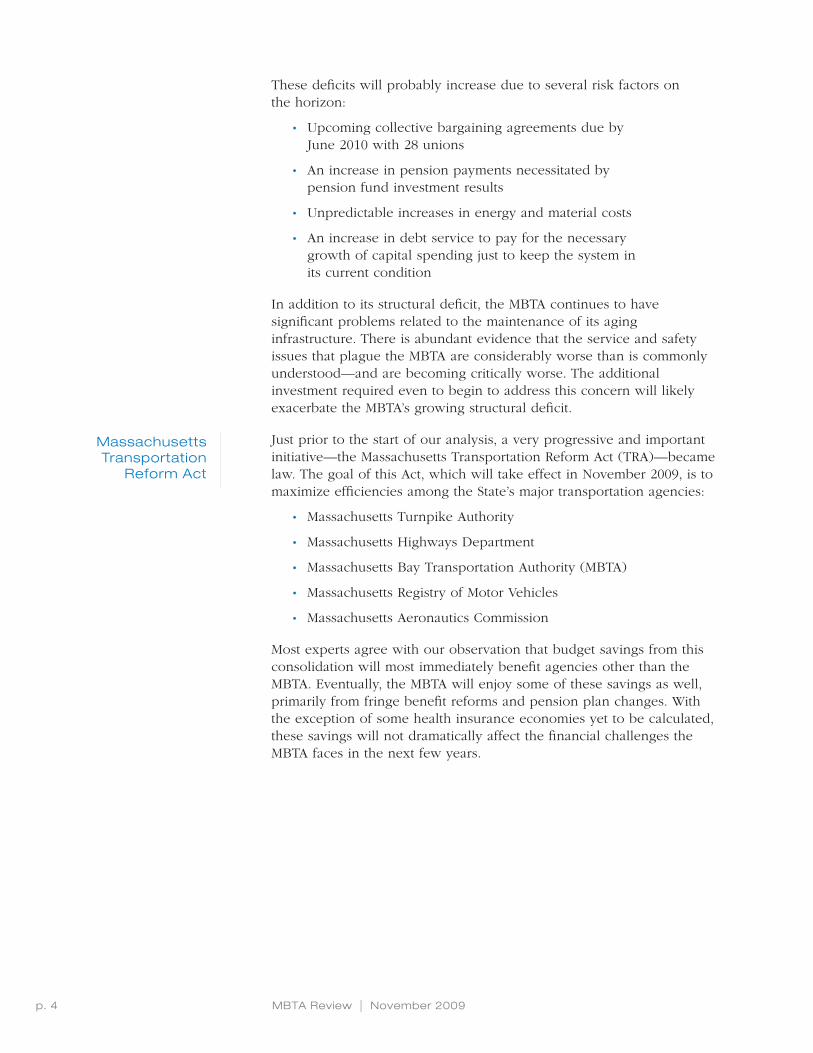
These deficits will probably increase due to several risk factors on the horizon:
• Upcoming collective bargaining agreements due by June 2010 with 28 unions
• An increase in pension payments necessitated by pension fund investment results
• Unpredictable increases in energy and material costs
• An increase in debt service to pay for the necessary growth of capital spending just to keep the system in its current condition
In addition to its structural deficit, the MBTA continues to have significant problems related to the maintenance of its aging infrastructure. There is abundant evidence that the service and safety issues that plague the MBTA are considerably worse than is commonly understood—and are becoming critically worse. The additional investment required even to begin to address this concern will likely exacerbate the MBTA’s growing structural deficit.
Just prior to the start of our analysis, a very progressive and important initiative—the Massachusetts Transportation Reform Act (TRA)—became law. The goal of this Act, which will take effect in November 2009, is to maximize efficiencies among the State’s major transportation agencies:
• Massachusetts Turnpike Authority
• Massachusetts Highways Department
• Massachusetts Bay Transportation Authority (MBTA)
• Massachusetts Registry of Motor Vehicles
• Massachusetts Aeronautics Commission
Most experts agree with our observation that budget savings from this consolidation will most immediately benefit agencies other than the MBTA. Eventually, the MBTA will enjoy some of these savings as well, primarily from fringe benefit reforms and pension plan changes. With the exception of some health insurance economies yet to be calculated, these savings will not dramatically affect the financial challenges the MBTA faces in the next few years.
Massachusetts transportation
reform Act

p. 5MBtA review | November 2009
the starting Point — the Promise of Forward Funding
A virtual mountain of studies, papers and data has been written about the MBTA’s finances. Some of it is thorough and relevant; some of it is not. Unfortunately, much of it relies on different comparison points, which contributes to confusion surrounding the MBTA’s woes.
In order to best understand the MBTA’s current and future issues, it was important for this review to establish a common historical comparison point. What better place than the point in time ten years ago when the MBTA’s entire operation and direction was altered by the promise of “Forward Funding,” which sought to forever change the MBTA for the better.
Prior to July 2000, the MBTA was essentially a “backward funding” operation. It was not expected to and indeed did not operate with a goal of generating a surplus. Backward funding created no expectations or incentives for the MBTA to control spending or grow its revenues because the State was required to cover its deficits. As the size of the deficits grew larger, the annual bill presented to the State was aptly deemed a “budget buster.”
After years of debate, the Legislature and Governor resolved in 1999 that the MBTA should become self-sufficient starting with FY01, which began July 1, 2000. The stated goal was to “transform the MBTA from an agency that bills the State for its operating deficits to a system that sustains itself from an identifiable revenue stream. In terms of the MBTA’s operations, this would require greater cost efficiency and revenue enhancement.”
The State would assure the ability to achieve self-sufficiency by guaranteeing 20% of the State’s sales tax collections (exclusive of meals taxes) to the MBTA, commonly referred to as “a penny on every nickel.” Without the fallback of backward funding, the MBTA was now expected to balance each year’s budget by enhancing revenues and controlling costs. The phrase “Forward Funding” was born out of this transformation from funding deficits in arrears to achieving self-sufficiency on the foundation of balanced budgets using dedicated revenues from the Commonwealth.
The MBTA thus began a new era based on the discipline and opportunities enabled by Forward Funding. It was immediately expected to begin achieving a small surplus that would grow over the years into a self-sustaining financial model capable of generating larger surpluses and weaning the MBTA from long-term debt.
Our analysis began with examining how the MBTA’s actual finances compared with Forward Funding’s financial assumptions.
Forward Funding
“transform the MBtA from an agency that bills the state for its
operating deficits to a system that sustains
itself from an identifiable revenue stream.”

p. 6 MBtA review | November 2009
Forward Funding — What Was supposed to happen
To implement Forward Funding, the MBTA developed a Finance Plan that set revenue and expenditure benchmarks for FY01 through FY08. We have compared actual results with the Finance Plan’s benchmarks and projections to measure the Forward Funding’s success.
the Finance Plan called for the MBtA to:
• Decrease operating costs 2% per year from FY01 through FY06
• Balance each year’s budget
• Meet cash flow needs without short-term debt by building working capital reserves from $64M to $100M
• Decrease long-term debt by generating cash surpluses worth 5% to 10% of gross revenues that would fund capital investment
While there was no expectation that all these goals would be achieved immediately, it was expected that the MBTA would soon be in a self-sufficient position.
Our comparison of the benchmarks with actual results clearly demonstrates why the plan was unsuccessful, why since 2003 there have actually been large deficits that have not been apparent, and why deficits are now growing so quickly.

p. 7MBtA review | November 2009
What really happened — A Promise unfulfilled
The Forward Funding Finance Plan proved unrealistic in many of its assumptions and nine years later can be deemed a failure.
Many promises from the Financial Plan were unfulfilled. Increased surpluses and $100M annual cash reserves never happened. Instead of paying for capital investment, cash reserves were used to cover deficits.
The main driver, however, of why Forward Funding failed was unavoidable cost explosions.
In order to begin building cash surpluses and balance the budget, the Finance Plan called for a “two percent annual decrease in operating costs” between FY01 and FY06. Not only was this not achieved, cumulative costs grew $558M above projections by FY08. Instead of the 2% annual decrease, operating costs grew an average of 5% higher each year or by a cumulative 35%. These cost increases are at the heart of the real deficits of the past nine years and form the basis for the reasons the projected deficits in the coming years are so dramatic.
FY 2001 FY 2006 FY 2008
$ M
illio
ns
5% annual operating cost increases that actually occurred
0
600
500
400
300
200
100
$329M
$558M
2% annual operating cost reductions projected by the Finance Plan
$414M
MBtA costs
Actual vs. Finance Plan FY01-FY08

p. 8 MBtA review | November 2009
expenses
The following charts and tables represent the four major expense categories that drove the deficits. This information, provided by the MBTA financial staff, demonstrates the variance between Finance Plan projections and actual results from the base year of FY01 through FY08, the last year of the Plan’s projections. The bars above the line represent favorable results; the bars below the line indicate negative or unfavorable financial results.
Energy costs increased dramatically over the decade for the economy as a whole, a trend not foreseen by the Finance Plan. As the single largest electricity consumer in Massachusetts, as well as the purchaser of tens of millions of dollars in gasoline, diesel and compressed natural gas, the MBTA’s energy and utility consumption is immense.
• Fuel and utility costs at the MBTA grew by a remarkable 122% from FY01 to FY08, far surpassing the 22% growth that the Finance Plan projected.
• These costs cumulatively exceeded Finance Plan projections by $256M.
• Fuel and utility costs account for an increasing share of the MBTA’s overall budget, ballooning from 6.6% of total operating expenses in FY01 to 10.4% in FY08.
Since the implementation of Forward Funding, the MBTA has attempted to mitigate the impact of fluctuating energy costs by entering into hedge contracts for fuel and by competitively bidding its electricity purchases.
Fuel & utilities expenses
Actual vs. Finance Plan FY01–FY08
Cumulative negative
$256 million
(80)
(60)
(40)
(20)
0
20
40
60
$ M
illio
ns
FY 2001 FY 2002 FY 2003 FY 2004 FY 2005 FY 2006 FY 2007 FY 2008
MBTA Expenses Actual v. Forward Funding Plan 2001-2008
Horizontal axis at 0 represents original Forward Funding Plan projections. Bars above and below represent the actual favorable and negative deviations from those projections.

p. 9MBtA review | November 2009
The MBTA currently employs 6,346 workers, of which roughly 600 are in part-time jobs.
All but 263 of these workers are represented by one of 28 unions. Total headcount at the MBTA is actually down by approximately 200 since the Forward Funding Plan began, while total payroll and benefits costs have increased.
• Total payroll and benefits costs increased from $412.8M to $548.9M between FY01 and FY08 due to increases in wage, health care and pension costs.
• This cumulatively exceeded Finance Plan projections by $113M.
• Between FY01 and FY08, the unionized workers received average annual wage increases of 3.0%, while MBTA executives received average annual increases of 1.9%.
• Non-union MBTA employees have not received wage increases since 2005.
• Wage increases for union workers are comparable to the 3.5% annual growth in the Consumer Price Index-Urban Boston and Massachusetts median household income for the same time period.
• The MBTA’s wage rates and total wage costs are similar to those of other top U.S. transit systems, as is shown in the table at left.
The Finance Plan inexplicably projected no increases in health care costs between FY01 and FY08.
• In reality, employee and retiree health benefits costs increased 73%, growing from $60.6M in FY01 to $104.9M in FY08.
As mentioned previously, the Transportation Reform Legislation passed in July 2009 has the potential at some point to help the MBTA lower its health care and pension costs by switching MBTA employees and retirees to coverage under the Group Insurance Commission (GIC), although MBTA unions have filed a lawsuit that challenges the legality of forcing benefit changes outside of the collective bargaining process.
(60)
(40)
(20)
0
20
40
$ M
illio
ns
FY 2001 FY 2002 FY 2003 FY 2004 FY 2005 FY 2006 FY 2007 FY 2008
MBTA Expenses Actual v. Forward Funding Plan 2001-2008
Payroll & Fringe Benefit expenses
Actual vs. Finance Plan FY01–FY08
Cumulative negative
$113 million
MBtA hourly Wages comparison of ten
Largest transit Agencies
Transit SystemOperator Top Rate
san Francisco $29.19
New York city $26.92
chicago $26.87
Boston $26.56
Washington $25.93
seattle $25.34
New Jersey $24.27
Philadelphia $23.54
Los Angeles $21.27
Atlanta $19.25
(As of 1/2008)

p. 10 MBtA review | November 2009
Among the MBTA’s fastest-growing expense categories is the “complementary paratransit” system known as The Ride, which offers door-to-door jitney and van service for individuals with physical and other disabilities. The MBTA is obligated to offer The Ride to any eligible individual, consistent with the Americans with Disabilities Act, in order to qualify for Federal capital funds.
The MBTA’s flexibility to control costs is constrained by Federal regulations that
• Govern maximum fares, minimum service areas, trip destinations and disability eligibility criteria.
• Prohibit any restriction that sets a different access standard for the disabled than would apply to the non-disabled population.
The service is contracted out to three vendors that carry an average of 5,800 riders per day throughout a service area that is defined by the system’s fixed corridor routes, excluding commuter rail.
• Expenses increased 116% between FY01 and FY08 due primarily to ridership growth, increased vendor fees and fuel costs.
• To prevent fraud and promote efficiency, a variety of vendor payment methodologies have been tried since the program’s inception in the late 1970s. The current contract (2009-2014) pays vendors on a per-trip basis.
• The total number of trips rose from 1.58M to 1.76M between FY07 and FY08. This growth is projected to continue as the population ages and funding is cut to other agencies that transport the disabled.
(60)
(40)
(20)
0
20
40
$ M
illio
ns
FY 2001 FY 2002 FY 2003 FY 2004 FY 2005 FY 2006 FY 2007 FY 2008
MBTA Expenses Actual v. Forward Funding Plan 2001-2008
the ride expenses
Actual vs. Finance Plan FY01–FY08
Cumulative negative
$95 million
Average cost of a trip on the ride
2001 2008 2009
$20.32 $31.02 $34.86

p. 11MBtA review | November 2009
Commuter rail costs have more closely tracked the Finance Plan’s projections than other expense categories because annual vendor increases were contractually fixed between FY03 and FY08. Nonetheless, it is among the MBTA’s largest expense categories, growing by 43% between FY01 and FY08 - from $172.5M in FY01 to $247M by FY08.
Costs have grown under the recent three-year contract extension, which uses a different inflation methodology that more realistically accounts for the vendor’s costs for maintaining the aging infrastructure and for the steel used for rail replacement. The growth in wages and health benefits for the vendor’s mostly unionized employees has been comparable to the experience of the MBTA.
The 14 commuter rail lines typically carry 143,000 passengers on 491 trips each weekday.
• Annual ridership has doubled in 20 years—from 19.7M riders in 1990 to 39.7M in 2008—due in large part to system expansions required by the Central Artery/Tunnel Administrative Consent Order.
• Net costs per passenger mile ranged from $.47 on the Needham line to $9.25 on the Fairmount line.
• Operating costs ranked among the lowest of the 20 commuter rail peer systems, based on 2007 comparison data.
(60)
(40)
(20)
0
20
40
$ M
illio
ns
FY 2001 FY 2002 FY 2003 FY 2004 FY 2005 FY 2006 FY 2007 FY 2008
MBTA Expenses Actual v. Forward Funding Plan 2001-2008
the commuter rail expenses
Actual vs. Finance Plan FY01–FY08
Cumulative negative
$37 million

p. 12 MBtA review | November 2009
revenue — A Mixed result
Recognizing the reality that a certain level of state subsidy is necessary to sustain a transit system, Forward Funding dedicated 20% of statewide sales tax collections to the MBTA. At the same time, the MBTA was expected to increase its system-generated revenues from sources such as fares, parking, real estate and advertising. The following three charts compare FY01 through FY08 actual results to the Finance Plan’s projections.
The Finance Plan projected that dedicated sales tax revenue would grow by 3% per year from FY01 through FY08.
• In reality, sales tax revenue grew only an average of 1% per year.
• This fell short of the Finance Plan target by a cumulative $460M.
The shortfall in sales tax collections was not this dramatic, however, because the Forward Funding enabling legislation established a revenue floor for the MBTA in the event that sales tax revenue growth was diminished. As the chart shows, the difference between the 3% growth rate and the actual amount of sales tax revenue guaranteed by the enabling legislation was $150M short of the Finance Plan’s expectations.
Despite widely held opinions, the shortfall in sales tax revenue has not by itself accounted for the MBTA’s growing deficits, as evidenced by this review.
(60)
(40)
(20)
0
20
40
$ M
illio
ns
FY 2001 FY 2002 FY 2003 FY 2004 FY 2005 FY 2006 FY 2007 FY 2008
MBTA Expenses Actual v. Forward Funding Plan 2001-2008
sales tax revenue
Actual vs. Finance Plan FY01–FY08
Cumulative negative
$150 million

p. 13MBtA review | November 2009
One revenue source that performed better than Finance Plan expectations was transportation revenue.
• As a result of the three fare increases implemented since Forward Funding, transportation revenue was cumulatively $95 million better than Finance Plan projections.
Fare increases implemented in 2001, 2004 and 2007 raised revenues consistent with the Finance Plan’s timetable. The last fare hike actually exceeded the Plan’s target, in part because ridership grew despite the fare hike.
(40)
(20)
0
20
40
60
80
100
$ M
illio
ns
FY 2001 FY 2002 FY 2003 FY 2004 FY 2005 FY 2006 FY 2007 FY 2008
MBTA Expenses Actual v. Forward Funding Plan 2001-2008
transportation revenue
Actual vs. Finance Plan FY01–FY08
Cumulative POSitive
$95 million

p. 14 MBtA review | November 2009
Non-operating revenues, generated by sources such as advertising and real estate sales and leasing proceeds, exceeded Plan projections in the early years. These advertising and real estate gains helped to pay for some of the higher costs from other areas, but were too diminutive to make a great difference. Since FY04, non-operating revenues, with the exception of parking revenues, have been below expectations.
This negative trend accelerated in FY09 and will be negative for the next few years, as few prime properties are left to lease or sell. The sale of garages might generate one-time revenue but, after satisfying outstanding debt financing requirements, the loss of market-based parking revenues from these properties will not create a long-term gain and does not make a great incremental difference, considering the oncoming deficits.
(60)
(40)
(20)
0
20
40
$ M
illio
ns
FY 2001 FY 2002 FY 2003 FY 2004 FY 2005 FY 2006 FY 2007 FY 2008
MBTA Expenses Actual v. Forward Funding Plan 2001-2008
Non-operating revenue
Actual vs. Finance Plan FY01–FY08
Cumulative negative
$2 million

p. 15MBtA review | November 2009
the real Picture
As the prior discussion demonstrates, MBTA operating costs have exceeded Finance Plan projections by $500M for the cost centers we highlighted, while revenues from all sources underperformed Finance Plan expectations by $58M. The combined effect has produced a cumulative variance of $558M against the Finance Plan for the first eight years under Forward Funding, as the following chart illustrates:
(250)
(200)
(150)
(100)
(50)
0
50
100
$ M
illio
ns
FY 2001 FY 2002 FY 2003 FY 2004 FY 2005 FY 2006 FY 2007 FY 2008 TOTAL
Non-Operating RevenueTransportation Revenue
Sales Tax RevenueCommuter Rail Expenses
The Ride ExpensesPayroll & Fringe Benefit Expenses
Fuel & Utilities Expenses
MBTA Revenues and Expenses Actual v. Finance Plan 2001-2008
Positive (negative) actual compared to Forward Funding Finance Plan ($ millions)
Fuel & Utilities Expenses (16) (17) (24) (14) (26) (40) (51) (68) (256)
Payroll & Benefit Expenses 11 9 7 0 (17) (39) (44) (40) (113)
The Ride Expenses 3 (1) (4) (7) (13) (19) (24) (30) (95)
Commuter Rail Expenses 11 3 2 (14) (10) (4) (4) (21) (37)
Sales Tax Revenue 0 0 0 (21) (21) (35) (36) (37) (150)
Transportation Revenue 20 1 (13) (16) (16) 1 35 83 95
Non-Operating Revenue 26 10 7 (8) (9) (1) (5) (22) (2)
(558)
cumulative revenue & expenses
Actual vs. Finance Plan FY01–FY08
Cumulative negative
$558 million

p. 16 MBtA review | November 2009
We acknowledge that the MBTA’s costs are not easy to contain due to the unavoidable staffing and capital investment demanded by its size and antiquity. But even the kinds of savings that could have been found on the margins are now inadequate to rebalance the growing structural deficit.
A private sector firm faced with this mountain of red ink would likely fold or seek bankruptcy.
the Bottom Line

p. 17MBtA review | November 2009
Debt service to the rescue — temporarily
While there is little question that total debt for the MBTA is a problem, conventional wisdom holds that a major driver behind the MBTA’s inability to be self-sufficient was the debt service payments. That is not true.
In fact, debt service payments between FY01 and FY08 were $515M lower than the Finance Plan’s projections. This is demonstrated in the following chart, where the blue bars indicate the annual debt payments the MBTA committed to as part of the Finance Plan and red bars demonstrate the actual payments.
Various factors account for the difference between projected and actual debt service payments; primary among them was debt refinancing and restructuring, which effectively lowered each year’s debt service payment obligations, particularly against Finance Plan projections.
The chart and table on the following page display the variance between results and projections for debt service, operating costs and revenue sources. Without the benefit of the debt service “savings” shown as red bars on the chart, the Finance Plan would have been wholly unworkable as a road map to self-sufficiency.
Debt service Payments
Actual vs. Finance Plan FY01–FY08
$ M
illio
ns
0
500
400
300
200
100
$26M $35M$71M
$102M$117M
$88M$83M
+$8M
FY 2001 FY 2002 FY 2003 FY 2004 FY 2005 FY 2006 FY 2007 FY 2008
Actual Debt Service Payments
Finance Plan Debt Service Projected Payments
Total difference betweenprojected and actual
debt payments FY01-FY08 = $515M

p. 18 MBtA review | November 2009
(250)
(200)
(150)
(100)
(50)
0
50
100
150
200
250
300
350
400
450
$ M
illio
ns
FY 2001 FY 2002 FY 2003 FY 2004 FY 2005 FY 2006 FY 2007 FY 2008 TOTAL
Non-Operating RevenueTransportation Revenue
Sales Tax RevenueCommuter Rail Expenses
The Ride ExpensesPayroll & Fringe Benefit Expenses
Fuel & Utilities Expenses
Debt Service
500
This bar shows that the MBTA paid
substantially less ($515M) in debt
service from FY01-FY08 than was
forecast by the Finance Plan.
By deferring this debt, the MBTA
balanced its annual budgets.
Unfortunately, this contributed to
overall increased debt.
cumulative revenue & expenses with
Debt service
Actual vs. Finance Plan FY01–FY08
Cumulative negative
$43 million

p. 19MBtA review | November 2009
The bottom row of the preceding table displays the amounts saved each year against Finance Plan projections. The cumulative effect of these savings is compared with the cumulative growth of operating costs and underperforming revenues.
FY 2001 FY 2002 FY 2003 FY 2004 FY 2005 FY 2006 FY 2007 FY 2008 TOTAL FY01-FY08Positive (negative) actual compared to Forward Funding Finance Plan ($ millions)
Fuel & Utilities Expenses (16) (17) (24) (14) (26) (40) (51) (68) (256)
Payroll Expenses 11 9 7 0 (17) (39) (44) (40) (113)
The Ride Expenses 3 (1) (4) (7) (13) (19) (24) (30) (95)
Commuter Rail Expenses 11 3 2 (14) (10) (4) (4) (21) (37)
Sales Tax Revenue 0 0 0 (21) (21) (35) (36) (37) (150)
Transportation Revenue 20 1 (13) (16) (16) 1 35 83 95
Non-Operating Revenue 26 10 7 (8) (9) (1) (5) (22) (2)
Cumulative Deficit 55 5 (25) (80) (112) (137) (129) (135) (558)
Debt Service (8) 26 35 71 102 117 88 83 515
TOTAL: (43)

p. 20 MBtA review | November 2009
Debt — the Faustian Bargain
The Finance Plan explicitly cautioned the MBTA against accruing excessive debt: “…relying entirely on debt to fund the non-federal share of the Authority’s Capital Program is no longer sustainable under Forward Funding.”
The Finance Plan also warned against excessive debt restructuring:
“The Authority can achieve some of its liquidity and capital financing objectives in the near term by restructuring a portion of its Prior Obligations debt service. However this technique defers debt service to future periods and burdens the Authority’s operations with substantial additional interest payments. This technique must be used judiciously as extensive use of debt restructuring will cause future debt service to consume larger percentages of each fare dollar.”
Both admonitions were prophetic. MBTA debt finances are exactly opposite the position advocated by the Finance Plan, as if these warnings had never been issued.
The Finance Plan assumed the MBTA would rapidly amortize the $5.62B in outstanding principal and interest that it had inherited from the State, known as “Prior Obligation” debt. As this amount was repaid, corresponding debt service payments would shrink, thus freeing up resources to invest in the Pay-as-You-Go capital program known as PAYGO. The chart at left compares outstanding debt at the beginning of Forward Funding with what is currently owed.
Over the decade, the MBTA was able to amortize roughly 60% of the Prior Obligation principal to $1.6B, but this was offset by substantial new borrowing for the capital program, in direct contradiction to the Finance Plan’s first warning. This new borrowing proved necessary because the Finance Plan made two unrealistic assumptions: that the MBTA could afford the Finance Plan’s higher debt service payments, and that the Plan’s projected higher revenues and reduced operating costs would materialize to generate cash surpluses that would wean the MBTA from long-term borrowing.
As noted in the last section, debt service payments between FY01 and FY08 were $515M lower than the Finance Plan had projected. Reduced payments were economical when $169.5M in debt was refinanced to take advantage of lower interest rates. Reduced payments were simply expedient when debt was restructured to paper over structural deficits by deferring principal and interest payments into the future. In FY07, FY08 and FY09, approximately $238M in debt service was restructured, leaving the problem of paying for that deferral to another year’s budget.
total outstanding Debt
FY01 & FY09
0
2
4
6
8
10
FY 2001 FY 2009
$ B
illio
ns
$3.87
$1.75
$5.62
$5.19
$3.33
$8.52
Interest
Principal
Both admonitions were prophetic.
MBTA debt finances are exactly opposite
the position advocated by the Finance Plan, as
if these warnings had never been issued.
p. 21MBtA review | November 2009
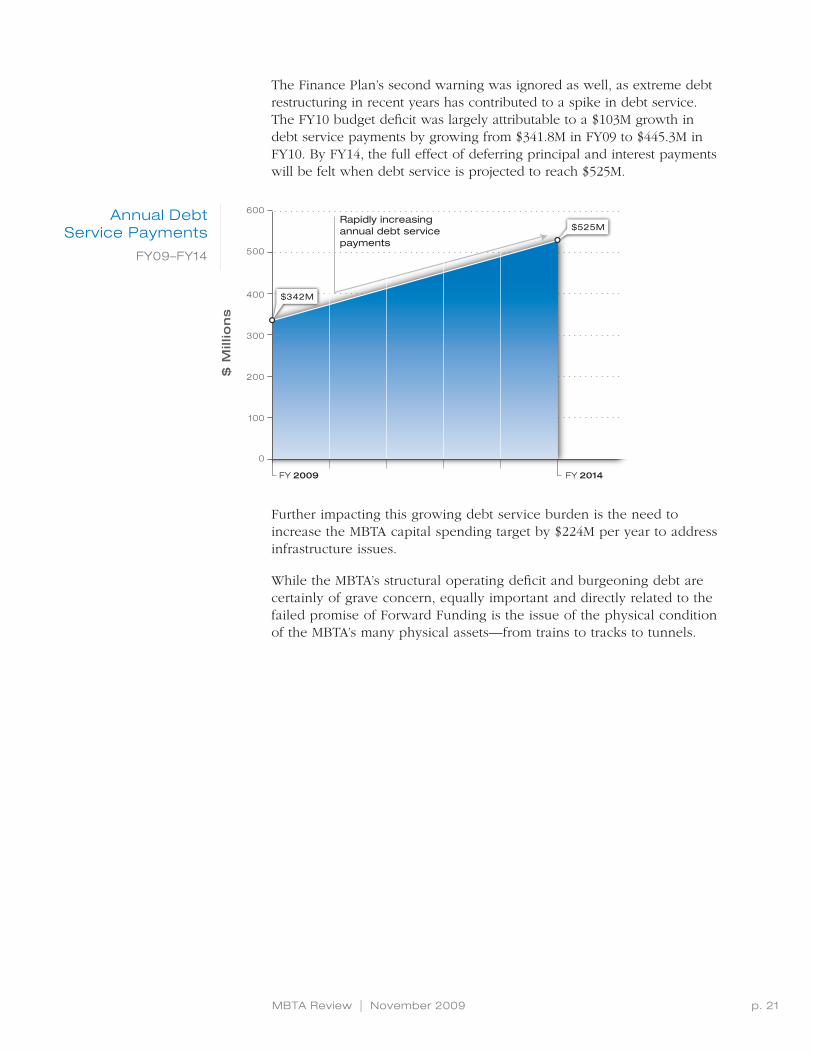
The Finance Plan’s second warning was ignored as well, as extreme debt restructuring in recent years has contributed to a spike in debt service. The FY10 budget deficit was largely attributable to a $103M growth in debt service payments by growing from $341.8M in FY09 to $445.3M in FY10. By FY14, the full effect of deferring principal and interest payments will be felt when debt service is projected to reach $525M.
Further impacting this growing debt service burden is the need to increase the MBTA capital spending target by $224M per year to address infrastructure issues.
While the MBTA’s structural operating deficit and burgeoning debt are certainly of grave concern, equally important and directly related to the failed promise of Forward Funding is the issue of the physical condition of the MBTA’s many physical assets—from trains to tracks to tunnels.
Annual Debt service Payments
FY09–FY14
FY 2009 FY 2014
$ M
illio
ns
Rapidly increasing annual debt service payments
0
600
500
400
300
200
100
$525M
$342M

p. 22 MBtA review | November 2009
At risk — system safety & reliability
The MBTA has accomplished many impressive achievements in enhancing safety and service, yet the fact remains that it is dealing with an extensive, aging infrastructure that requires continuous maintenance, refurbishment and replacement. Unfortunately, the cost of the projects required to address these concerns far exceeds the MBTA’s capital improvement budget, which is constrained by the structural deficit discussed in the previous section. As a result, many projects that would address critical safety or system reliability issues are not funded each year.
state of Good repair
The MBTA and transit systems across the country have adopted the “State of Good Repair” (SGR) standard to determine how much capital is required to maintain and/or replace existing infrastructure.
The definition used by the MBTA for a State of Good Repair is “a standard wherein all capital assets are functioning at their ideal capacity within their design life”—or said differently, “Maintain the assets so they perform as they should.”
For FY10, over $3B worth of projects were identified by the MBTA as needed to address SGR issues. Only 15 of those 201 projects totaling $203M were funded. In other words, all but 6% of what was requested to address SGR issues went unfunded.
Examples of SGR projects that went unfunded range from rehabbing bridges to replacing the stairways to the Newtonville station platform; from replacing the backup power generator turbines to repairing system-wide tunnel lighting; from overhauling the journal bearings on Orange Line cars to replacing 60-year-old cable.
state of Good repair
“...a standard wherein all capital assets are
functioning at their ideal capacity within their
design life”
sGr Project Funding requests
FY10
FunDing ReQueSteD
$3.2B
FunDing gRanteD
$203m
15 Funded sGr Projects totaling $203m
186 unfunded sGr Projects totaling $3B
6%94%

p. 23MBtA review | November 2009
A Large and Growing Backlog
Since the current capital planning process was implemented in 2001, the MBTA has invested between $246M and $594M each year towards SGR projects.
As of 2004, the backlog of SGR projects totaled $2.7B. To prevent the SGR backlog from growing larger, $470M in capital spending was needed annually. The approach has been “we may not be able to spend $2.7B and eliminate the SGR backlog, but at least it is not getting worse.”
It is getting worse.
The MBTA maintains an SGR database to capture information on all of its capital assets. The most recent update of the database indicates that the SGR backlog exceeds $3B and the annual allocation needed to prevent it from growing larger will be $694M, $224M more than the annual level of recent years.
The MBTA can only fund a small portion of the immense backlog of projects annually, given its structural operating deficit. Each year, all capital project requests, including those addressing SGR, are prioritized and submitted by each MBTA department to the MBTA Budget Department for consideration as part of the annual Capital Investment Program (CIP).
To determine which projects receive funding, each submission is scored by the Budget Department against predetermined criteria. The entire list of projects, with their scores and associated costs, is reviewed by the Authority’s management to determine which ones will receive funding.
sGr Backlog
FY04 & FY10
$ B
illio
ns
3.0
2.9
2.8
2.7
2.6
FY 2004 FY 2005 FY 2006 FY 2007 FY 2008 FY 2009 FY 2010
>$3B
$2.7B
The MBTA would have had to invest an average of
$470M each year in capital spending FY04-FY09
in order to prevent the SGR backlog from growing.
However, the backlog has grown to over $3B for
FY10, meaning that the MBTA would now need to
invest $694M each year in capital spending just
to prevent the SGR backlog from growing further.

p. 24 MBtA review | November 2009
Each proposed capital improvement project is given a score by the Budget Department, with the maximum score being 100. The scoring criteria allots these maximum points for the following categories:
safety
health
environment
sGr
operations Impact
cost/Benefit
Legal commitments
1 2 3 4 5 6 7 8 9 10 11 12 13 14 15 16 17 18 19 20
unfunded But critical safety Projects
Given the MBTA’s budget for all capital improvement projects, there are many projects that are not funded even though they address urgent safety issues.
For the FY10 budget cycle, there were 57 projects, totaling $590M, that scored a “10” on safety, the highest possible value for that criterion. However, only six of those projects, totaling $47.2M, were funded. In other words, $543M in safety-critical projects are NOT being funded.
capital Investment Program (cIP)
scoring criteria
safety criterion
“Project corrects an existing safety-
oriented deficiency. A critical project must
demonstrate imminent danger to life or limb
of passengers and/or employees.”
6 Funded safety “Level 10” Projects totaling $47.2m
51 unfunded safety “Level 10” Projects
totaling $543m
9%91%
safety “Level 10” Project Funding
requests
FY10
FunDing ReQueSteD
$590m
FunDing gRanteD
$47.2m
Low Priority crit ical

p. 25MBtA review | November 2009
One example of an unfunded project that received the maximum safety score of “10” is the floating slabs and tunnel leak repair project between Alewife and Harvard stations on the Red Line.
This $80M project involves the complete removal and replacement of the existing system of floating concrete slabs beneath the Red Line tracks from Alewife to Harvard stations. “Floating” slabs rest atop a series of rubber disks that are designed to absorb the vibration of a train as it travels along the track.
Water leaking through the tunnel walls is creating several problems:
• The leaking water is deteriorating the slabs themselves, causing sinking and misalignment of some slabs.
• The water is corroding the fasteners that attach the track to the concrete.
• In some areas, the fasteners are no longer holding the track in place, causing track to move out of alignment and presenting the possibility of train derailment.
• In addition, the water is corroding the signal system along the track and compromising the cable and wire conduits.
the MBtA Fleet: Aging, underfunded & underperforming
The MBTA’s trains, subway cars and buses provide 1.2 million rider trips each weekday. Maintaining the fleet is a Herculean and expensive task, particularly since it is aging and many vehicles are due for overhauls or replacement. Many vehicle-related projects score high in the SGR category, but due to their extraordinary cost, are not getting funded. There is a direct connection between this issue and breakdowns and service delays.
• Industry standards define the “useful life” for each type of vehicle in the MBTA fleet. These guidelines recommend when vehicles should receive mid-life overhauls to assure safety and optimal performance, as well as when they should be retired and replaced. As the chart on the next page illustrates, a large concentration of MBTA vehicles are either approaching or have already surpassed their useful life. Wholesale replacement of such a large number of vehicles is extraordinarily expensive and also results in less funds available for maintenance of vehicles still in service.
• In many instances the MTBA cannot complete a major overhaul of certain vehicles due to limited funding. Instead they will do a partial overhaul of specific systems, such as suspension and braking, which doesn’t address all the maintenance necessary to ensure optimal performance.
The following chart illustrates the age and useful life of each type of vehicle in the MBTA fleet.
Alewife to harvard
The Alewife/Harvard Project has been
proposed and unfunded for three straight years as conditions worsen.
In addition to the potential of derailment, if
the situation exacerbates, speed along that portion
of the Red Line could slow to 10 mph. This will have a residual service impact
with delays along the entire Red Line.
state of Good repair criterion
“Project proposed must replace or renew an
asset that is currently over-age or approaching
its useful life. Project receives a score based on the degree to which the asset is overdue for replacement/renewal.”

p. 26 MBtA review | November 2009
Line/Mode Fleet Qty. Service Date Age (yrs) Useful Life
Heavy Rail
Red No. 1 Fleet 74 1969 40 25
No. 2 Fleet 58 1988 21 25
No. 3 Fleet 86 1994 15 25
Blue No. 4 Fleet 18 1979 30 25
No. 5 Fleet 92 2008-09 1 25
Orange No. 12 Fleet 120 1981 28 25
Total Number of Heavy Rail Cars 448
Light Rail
Green No. 7 Fleet 48 1986-87 23-22 25
No. 7 Fleet 46 1987-88 22-21 25
No. 7 Fleet 20 1997 12 25
No. 8 Fleet 95 2000-06 9-3 25
PCC Cars 10 1945-46 64-63 25
Total Number of Light Rail Cars 219
Commuter Rail Coaches
CR Pullman Coaches 57 1979 30 25
MBB Coaches 67 1987-88 22-21 25
Bombardier A Cars 40 1987 22 25
Bombardier B Cars 106 1989-90 20-19 25
Double-Decker Kawasaki Coaches 75 1990-91 19-18 25
Double-Decker Kawasaki Coaches 17 1997-98 12-11 25
Double-Decker Kawasaki Coaches 15 2001 8 25
Double-Decker Kawasaki Coaches 33 2005-06 4-3 25
Total Number of Coaches 410
Commuter Rail Locomotives
CR F40PH-2 Locomotives 18 1978-80 31-29 25
F40PH-2C Locomotives 25 1987-88 22-21 25
F40PH-2M Locomotives 12 1991, 93 18-16 25
GP40-MC Locomotives (Remanufactured) 25 1997-98 12-11 25
Total Number of Locomotives 80
Compressed Natural Gas (CNG) Buses
Bus New Flyer CNG 40-ft 17 2001-02 8-7 12
NeoPlan CNG 60-ft (a) 44 2003 6 12
NABI CNG 40-ft 299 2004 5 12
Diesel Buses
Bus “Zero-Series” 40-ft 110 1995 14 12
NeoPlan ECD 40-ft 193 2004 5 12
New Flyer ECD 40-ft 310 2006-08 3-1 12
Alternative Power Buses
Bus Flyer Trackless Trolleys 5 1976 33 15
Prototype Alternative-Fuel 2 1999 10 12
Electric Trolley Buses 28 2004 5 15
Dual Mode Articulate 60-ft (b) 32 2005-06 4-3 12
Total Number of Buses 1,040
FTA USeFUL LiFe PArAMeTerS:
rail vehicles: at least 25 years
Large, heavy-duty transit buses: at least 12 years of service or an accumulation of at least 500,000 miles.
Fixed guideway electric trolley-bus with rubber tires obtaining power from overhead catenary: at least 15 years.
MBtA Fleet Age & useful Life

p. 27MBtA review | November 2009
Fleet 19
68
19
69
19
70
19
71
19
72
19
73
19
74
19
75
19
76
19
77
19
78
19
79
19
80
19
81
19
82
19
83
19
84
19
85
19
86
19
87
19
88
19
89
19
90
19
91
19
92
19
93
19
94
19
95
19
96
19
97
19
98
19
99
20
00
20
01
20
02
20
03
20
04
20
05
20
06
20
07
20
08
20
09
20
10
20
11
20
12
20
13
20
14
20
15
20
16
20
17
20
18
20
19
20
20
20
21
20
22
20
23
20
24
20
25
20
26
20
27
20
28
20
29
20
30
20
31
20
32
20
33
20
34
20
35
Heavy Rail
Red No. 1
Red No. 2
Red No. 3
Blue No. 4
Blue No. 5
Orange No. 12
Light Rail
Green No. 7
Green No. 7
Green No. 7
Green No. 8
Green PCC
Commuter Rail Coaches
Pullman
MBB
Bombardier A
Bombardier B
Kawasaki
Kawasaki
Kawasaki
Kawasaki
Commuter Rail Locomotives
F40PH-2
F40PH-2C
F40PH-2M
GP40-MC
Compressed Natural Gas (CNG) Buses
New Flyer
NeoPlan
NABI
Diesel Buses
“Zero-Series”
NeoPlan ECD
New Flyer ECD
Alternative Power Buses
Flyer Trackless
Prototype
Elec. Trolley Bus
Dual Mode Artic.
FY10-FY14 CIP
Pre-overhaul
Pre-overhaul
Pre-overhaul fleet goes back to 1945
Pre-overhaul

p. 28 MBtA review | November 2009
surprises
It stands to reason that an aging, complex and underfunded transportation system will have to confront unpleasant surprises that can result in safety hazards and service delays.
A recent issue on the Red Line, when a fire erupted from old cable, illustrates such a situation. Buried under wet muck, the aging cable caught fire, resulting in a shutdown of Red Line service during rush hour. Buses and drivers were called into service—some pulled from spare inventory that was available to be deployed and some pulled off of existing routes in order to service passengers on the Red Line. This resulted in diminished service along some bus routes so that bus passengers, in addition to Red Line passengers, were unhappy and inconvenienced.
A visible and well-publicized incident such as this one demands immediate attention and action. Fixing this problem becomes a priority that supersedes previously approved projects. The MBTA will require approximately $140M to replace the aging cable, and that money will be diverted from other projects such as overhauling vehicles.
Looking to the future, in spite of the MBTA’s best efforts to tackle those capital repairs and improvements it deems most pressing, it is virtually guaranteed that issues will arise that will require diverting allocated funding to address problems that demand immediate attention, including the hundreds of capital projects that are awaiting funding.
In order to maintain a system that is safe and reliable for its riders, the MBTA will have no choice but to devote significant funds to capital maintenance and improvement in years to come.
red Line Fire surprise
the MBtA will require approximately $140 million
to replace the aging cable and that money
will be diverted from other projects.
ensuring safety and reliability

p. 29MBtA review | November 2009
review summary
The transfer of $160M this summer to close the MBTA’s FY10 budget deficit marked a return to “backward funding.”
In 2000, Forward Funding was intended to end chronic deficit spending by providing the MBTA with the tools, including dedicated revenues, to achieve self-sufficiency. A decade later, our analysis indicates that the promise of Forward Funding could not succeed as costs grew inexorably, revenues proved inadequate and the need to sustain capital investment outgrew the MBTA’s ability to “live within its means.” The Finance Plan that was devised to implement the goal of self-sufficiency was well intentioned, but founded upon a combination of optimistic, unrealistic and untested assumptions.
Critics may argue that the MBTA did not “try hard enough” to embrace Forward Funding because it failed to control the growth of operating costs. These costs indeed grew by a cumulative half-billion dollars more than the Finance Plan had anticipated between FY01 and FY08, and their continuing growth defines the deepening structural deficits of the next five years.
The Finance Plan substantially underestimated the system’s cost drivers, both for costs within the MBTA’s control, such as wages, but especially for costs outside its control, such as energy, health insurance and contracted services like commuter rail and The Ride.
Contrary to not trying, we found evidence that the MBTA did make some hard expense choices. Across-the-board cuts were routinely made to departmental budgets. Periodic layoffs and hiring freezes restrained the headcount. Individual managers took pride in eliminating inefficiencies and redundancies, while embracing a new organizational ethic of customer service. Yet in the end, they could not pare staff below the number needed to move hundreds of thousands of riders across hundreds of routes each workday. Add the complexity and cost of sustaining the system’s aging infrastructure, and it became evident that the cost inflation and savings assumptions in the Finance Plan were never tested against the daily grind.
Several studies have proposed that the debt the MBTA inherited from the State, and resulting debt service, are the primary reasons for the MBTA’s failure to thrive under Forward Funding. Yet as we learned, debt service payments were much lower than projected over the decade because it was frequently refinanced and restructured. If any decision by the MBTA is worth second-guessing, it was the repeated deferral of principal and interest payments into a future that now looks even harder to fix, given the growing structural deficit.
Backward Funding – Déjà Vu
The net result of the Forward Funding
experiment is that the MBTA has come full
circle, with staggering debt, burgeoning deficits
and “hat in hand.” The MBTA is again in
Backward Funding mode.

p. 30 MBtA review | November 2009
Assuming present trends continue, the deficit in FY14 could exceed $300M, or $160M less if this year’s lifeline remains available. This deficit will be exacerbated by the imperative to finance the multi-billion-dollar backlog of capital projects, most of which is categorized as State of Good Repair investments. To grow capital spending from $470M to $694M per year in order to whittle down a $3B SGR projects list, not to mention $2B in other capital needs, will require $130M more to cover annual debt service payments ten years from now. Yet, failing to invest in these expensive maintenance and replacement projects will jeopardize the system’s safety, reliability and service to the regional economy.
We were asked to conduct a “frank assessment” of what’s gone right and what’s gone wrong with the MBTA. Our review has concluded that the choices ahead are difficult and stark. Stakeholders and decision makers will need to accept the reality that extremely difficult decisions must be made by the new governance structure created for the MBTA and other agencies by the Transportation Reform Act.
Why Is the MBtA so Important?
While the financial picture is grim, it is important to note that the MBTA is too valuable an economic asset to permit its further deterioration or even collapse. A robust public transportation system provides vital economic and quality-of-life benefits to residents from all walks of life and to businesses in the communities it serves. The MBTA has played an integral role in the development of Boston and surrounding cities and towns for more than a century, and on an average weekday over 1.2 million trips are made on the subways, buses, commuter trains and other services that make up the system.
• The MBTA provides access to job markets for Massachusetts residents and a larger employment pool for Massachusetts businesses, while at the same time removing cars from the highway system.
• Transit-oriented commercial and residential development, supported by a steady stream of pedestrians and MBTA riders, is being used as a tool to encourage business growth, to revitalize declining urban neighborhoods and to enhance tax revenues for cities and towns.
• Investments in the MBTA system lead to a chain reaction in business activity that far exceeds the initial investment. Whether a capital investment or transit operation project, thousands of jobs in a wide array of industries are created each year as a result of investments in the MBTA.
• Allowing Eastern Massachusetts to gain a widespread reputation for having a remarkably inefficient and unsafe system would eventually be devastating for the economy and for Massachusetts.
In the over-used jargon of our times, the MBtA is
“too Big to Fail”

p. 31MBtA review | November 2009
General recommendations — No Quick Fixes
There are no “quick fixes” to this myriad of issues. While we were not asked to provide specific recommendations, there are some general ones that we would suggest:
• A high-level MassDOT examination of safety and capital projects is in order. With 51 projects classified as “a danger to life or limb of passengers and/or employees,” prioritizing these projects against public safety needs is imperative. It may require an extended period to address them properly, but what could be more important?
• There is no question that the MBTA is an expensive and complex system. It requires large expenditures just to continue operating. Any thought that these problems can be addressed primarily through expense reductions is misguided. However, MassDOT should require more transparency in these expenses, so there is better control and more oversight in their uses.
• The underlying debt issues should be reexamined in the context of this review’s findings. In addition, the MBTA should not be able to enter into new debt obligations without MassDOT oversight.
• It makes little sense to continue expanding the system when the MBTA cannot maintain the existing one. Slow expansion until the safety and maintenance priorities can be addressed.
• If there is any chance for the MBTA to begin to close its deficit gap, there is little question that secure new revenue sources will have to be developed over time.
• The only major long-term operational success of Forward Funding is the fact that the riding public paid three fare increases in the last eight years. That resulted in a cumulative $95M gain. Asking that same public in 2010 for yet another fare increase because Forward Funding did not work defies credibility. The riding public deserves to have tangible evidence that the MBTA is improving safety and service—not deteriorating further.
Properly Prioritize safety Issues
Make expenses transparent
Develop secure New revenue sources
Improve safety and service Before
Increasing Fares
slow expansion
reexamine Debt

p. 33MBtA review | November 2009
Acknowledgments
MBTA officials and employees were particularly helpful and worked diligently to answer our questions.
It is important to point out there have been many excellent reports about the MBTA and other transportation systems in recent years, including but not limited to those conducted by:
• MBTA Advisory Board
• Massachusetts Taxpayers Foundation
• 2007 Transportation Finance Commission
• MASSPIRG Education Fund
• Pioneer Institute
• U.S. Department of Transportation
• American Public Transportation Association
• MBTA Blue Ribbon Commission
Most of the data utilized in our analysis was data provided by the MBTA. A complete listing of source materials can be found in the following reference materials list.

p. 35MBtA review | November 2009
reference Materials
American Public Transit Association. Stranded at the Station: The Impact of the Financial Crisis in Public Transportation. August 2009
Barclays Capital. “MBTA Credit Analysis.” September 2009
Cambridge Systematics, Inc. Building Massachusetts’ Economy through Transportation Investment: A Review of Potential New Funding Sources for Transportation. April 13, 2009 (Prepared for “A Better City”)
Energy Information Administration. “Average Retail Prices of Electricity, 1960-2008” http://www.eia.doe.gov/emeu/aer/txt/ptb0810.html
Federal Transit Administration, United States Department of Transportation. Transit State of Good Repair: Beginning of the Dialogue. October 2008
Federal Transit Administration. “National Transit Database” http://www.ntdprogram.gov/ntdprogram/pubs/dt/2007/DataTables07TOC.htm
Goldman, Sachs & Co. (chart). “Forward-Looking State of Good Repairs Issuance: Level Debt Structuring Around FY2013.” September 23, 2009
Kane, Brian, MBTA Advisory Board. Born Broke: How the MBTA found itself with too much debt, the corrosive defects of this debt and a comparison of the T’s deficit to its peers. April 2009
KPMG. Massachusetts Bay Transportation Authority Independent Auditors’ Report.
Financial Statements
June 30, 2008
June 30, 2007
June 30, 2006
June 30, 2005
June 30, 2004
June 30, 2003
June 30, 2002
June 30, 2001
Larson, John and Eric Bourassa, MassPIRG Education Fund. Derailed by Debt: Unhealthy Choices the MBTA Will Be Forced to Make in FY2009-FY2013. Fall 2007 www.masspirg.org
Massachusetts Bay Commuter Railroad Company. “Boston’s Commuter Rail Service: Briefing to Mr. David D’Alessandro.” October 6, 2009
Massachusetts Board of Conciliation and Arbitration. “Arbitration Award re: Massachusetts Bay Transportation Authority and Local 589, Amalgamated Transit Union, AFL-CIO, Case Number PS-101-2007.” July 7, 2008
Massachusetts Taxpayers Foundation. (With contributions from the Pioneer Institute for Public Policy Research.) MBTA Capital Spending: Derailed by Expansion? February 2002
Massachusetts Taxpayers Foundation. “Business Community’s Transportation Reform and Finance Plan.” March 3, 2009 www.masstaxpayers.org/files/Business%2
Massachusetts Taxpayers Foundation. “MTF Recommendations: Saving $1 Billion in Unaffordable Health Care Costs at the MBTA.” March 30, 2009 http://www.masstaxpayers.org/files/MBTA%20report%20-%20NT.pdf
Massachusetts Transportation Finance Committee. “Transportation Finance in Massachusetts: An Unsustainable System.” March 28, 2007 http://www.eot.state.ma.us/downloads/tfc/TFC_Findings.pdf
Massachusetts Transportation Finance Committee. “Transportation Finance in Massachusetts: Volume 2 Building a Sustainable Transportation Financing System.” March 28, 2007 http://www.eot.state.ma.us/downloads/tfc/TFC_Findings.pdf
references
Documents and reports reviewed for this
report are listed below. Additional information too
voluminous to reference was also consulted,
including spreadsheets, personnel manuals,
contracts, organizational charts and budget
materials.

p. 36 MBtA review | November 2009
MBTA Advisory Board Finance Committee. Final Report to the MBTA Advisory Board: Fiscal Year 2010 Budget Request. May 28, 2009
MBTA Advisory Board. “Advisory Board Approved FY2001 Budget.” June 18, 2000
MBTA Blue Ribbon Committee. Taking the T to the Next Level of Progress: Report on Forward Funding. April 2000
MBTA Budget Office. “Statement of Revenue and Expenses: FY 2001 to FY 2010.”
MBTA Chief Financial Officer. “Ten Year Update: Forward Funding Summary of Progress; MBTA Blue Ribbon Committee.” August 24, 2009
MBTA Energy and Utilities Department. “MBTA Energy/Utility Costs: FY 2000-FY2010.”
MBTA Financial Planning Office. (chart). “Summary of Refunding Savings/(Costs) from Fiscal 2000 to Fiscal 2009.”
MBTA Financial Planning Office. (chart). “Legal Commitments under the Administrative Consent Order, Status Update.” September 2009
MBTA Financial Planning Office. “FY2010 Approved Budget with Risk List, Pro Forma FY10-FY15.”
MBTA Financial Planning Office. “MBTA (Forward Funding) Pro Forma Proposal by the MBTA: FY01-FY08.” April 2000
MBTA Financial Planning Office. “MBTA Pro Forma, FY10-FY15.”
MBTA Financial Planning Office. “MBTA Revenues and Expenses Detail Chart: Expenses Actual vs. Finance Plan: FY01-FY08.”
MBTA General Manager’s Office. Capital Investment Program, FY2010-FY2014.
MBTA General Manager’s Office. MBTA Forward Funding Finance Plan. May 2000
MBTA General Manager’s Office. The MBTA FY2009 Budget and The MBTA FY2010 Budget.
MBTA Office of the Chief Financial Officer. “Massachusetts Bay Transportation Authority’s Efforts to Maximize Non-Transportation Revenue,” report to the General Court pursuant to C.161A §11. April 12, 2009
MBTA Office of the Chief Financial Officer. Budget monitoring tool. “MBTA Weekly Report Package.” June 30, 2009 and July 31, 2009
MBTA Official Statement. Massachusetts Bay Transportation Authority Senior Sales Tax Bonds, 2008 Series B. April 24, 2008
MBTA Operations Directorate. Bus Fleet Management Plan: FY2008-FY2018. March 2008
MBTA Operations Directorate. Commuter Rail Fleet Management Plan: 2008-2022 Fleet Plan. 2008
MBTA Operations Directorate. Subway Operations Fleet Management Plan. FY2009-2016. February 16, 2009
MBTA Operations Directorate. MBTA State of Good Repair Report: Key Infrastructure and Capital Spending Issues. 2006 Edition
MBTA Preliminary Official Statement. Massachusetts Bay Transportation Authority Senior Sales Tax Bonds, Series C and D. October 2009
The National Business Coalition for Rapid Transit. “The Economic Importance of Public Transit.” November 2003 http://www.apta.com/resources/reportsandpublications/Documents/economic_importance.pdf
Transit Works. “Bicycle Transportation Survey.” Spring 2009
Transit Works. “2008 Ridership Survey.” 2009
United States Department of Transportation. 49CFR§37.121, et seq “Paratransit as a Complement to Fixed Route Service.” October 2007

report Design: christina Van Vleck