Embed Size (px)
Citation preview
MBTA Pension Update
June 27, 2016
FMCB

Fiscal and Management Control Board
2
Draft for Discussion & Policy Purposes Only
• MBTA Retirement Fund is governed by the Pension Agreement between the MBTA and the L589 Carmen’s Union
› Agreement covers administration of the fund, contributions made to the fund, benefits paid to retirees, management of fund assets, and eligibility for retirement
› Latest agreement went in effect on 7/1/2014 and lasts until 6/30/2018
• MBTA Retirement Fund is independent and run by the MBTA Retirement Board
• MBTARF is governed by a 7 member board with union and management representation
› Makes decisions concerning the investment of funds, determination of benefits paid to members, level of required contributions by the MBTA, and the release of public information on the fund
› The MBTA management and employees have no direct control over these decisions
Overview of MBTA Retirement Fund:MBTA RF critical to the MBTA’s employees and its financial stability
Introduction

Fiscal and Management Control Board
3
Draft for Discussion & Policy Purposes Only
MBTA Main Fund pension assets have declined by 13% over the past 10 years
Main Fund – Asset Trend
0.0
0.5
1.0
1.5
$2.0B
Year-End Main Fund Pension Net Assets: Market Value
(not including unfunded liability)
CY05
1.71
CY06
1.86
CY07
1.92
CY08
1.31
CY09
1.42
CY10
1.49
CY11
1.39
CY12
1.48
CY13
1.61
CY14
1.59
CY15
1.50
-13%-13%
Note: As of 6/23/16, Buck (Actuaries) has received final 12/31/15 asset valuation of the Main Fund. Estimate is $1.498B.Source: MBTARF Annual Reports
Fiscal and Management Control Board
4
Draft for Discussion & Policy Purposes Only
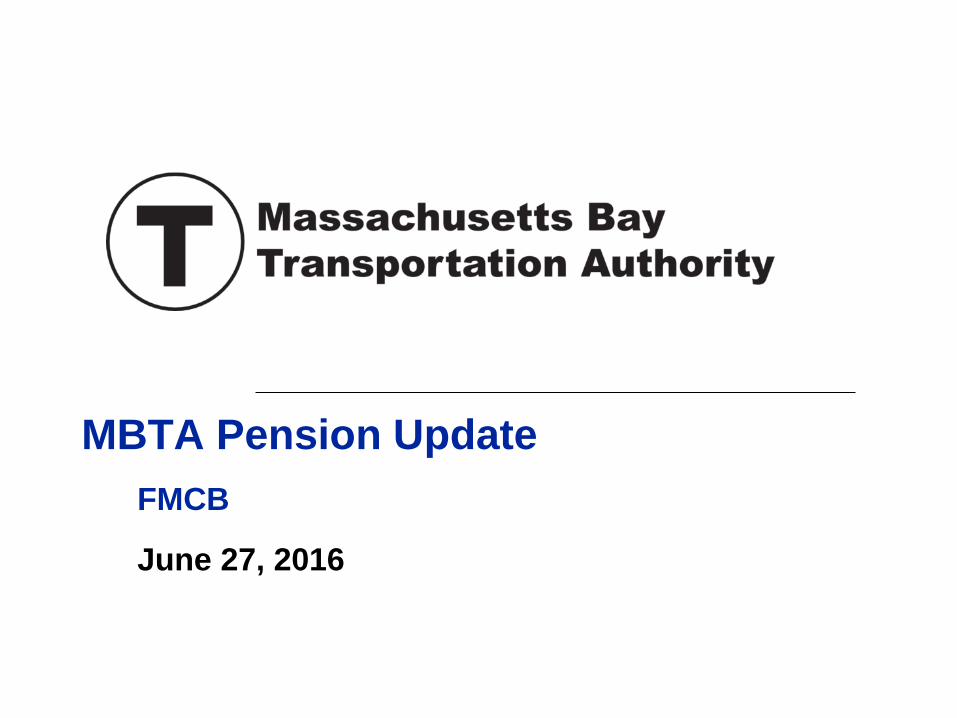
While MBTA RF asset balance has declined, other state pensions have increased
Main Fund – Asset Trend
0.0
0.8
0.9
1.0
1.1
1.2
1.3
1.4
1.5
1.6
Market Value of Assets (2005=1)
2005
2006
2007
2008
2009
2010
2011
2012
2013
2014
-7%
+54%
+25%+32%
'05-'14Change
$1.7B
$3.7B
$20.0B$17.9B
$1.6B
$5.7B
$25.0B$23.6B
MA State Emp.
Retirement System MA Teacher's
Retirement System
State-Boston
Retirement System
MBTA Main Fund
2005
Assets2014
Assets
Source: MBTARF Annual Reports; PERAC
Fiscal and Management Control Board
5
Draft for Discussion & Policy Purposes Only
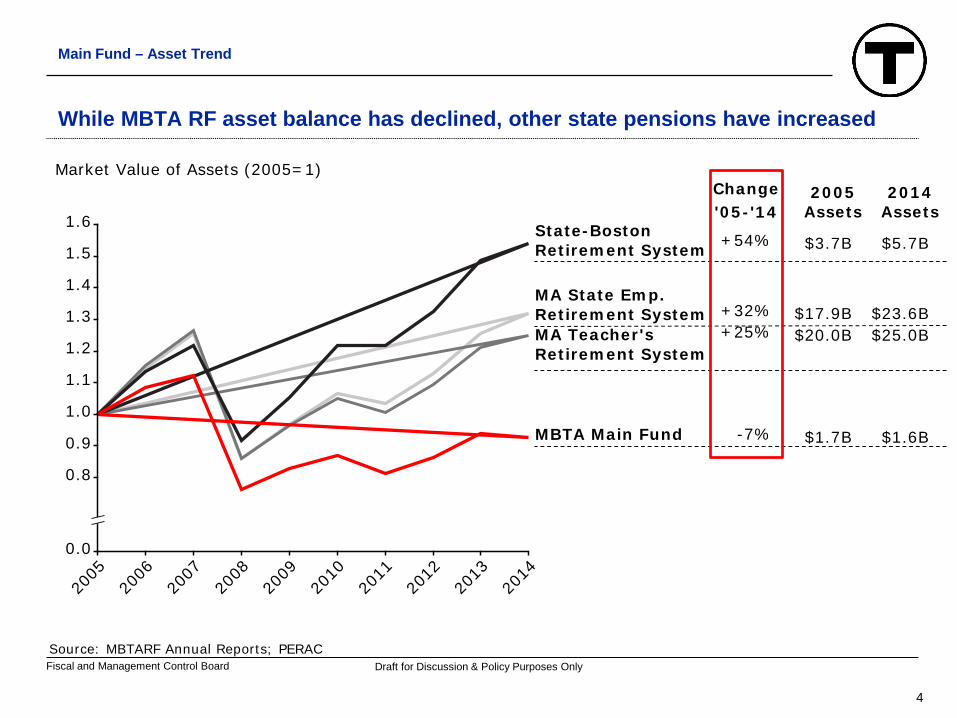
Why have MBTA Main Fund assets declined over past 10 years?
Main Fund – Asset Trend
• Two factors have driven the decline in MBTA Main Fund assets over past 10 years:
1. Fund is in a “net outflow” position (annual benefits paid to retirees exceed contributions by MBTA and members)
• MBTA has more retirees than active members
2. Fund net outflow % has exceeded fund investment return %
• Fund assets will decline in any year in which net outflow % exceeds investment return %
Fiscal and Management Control Board
6
Draft for Discussion & Policy Purposes Only
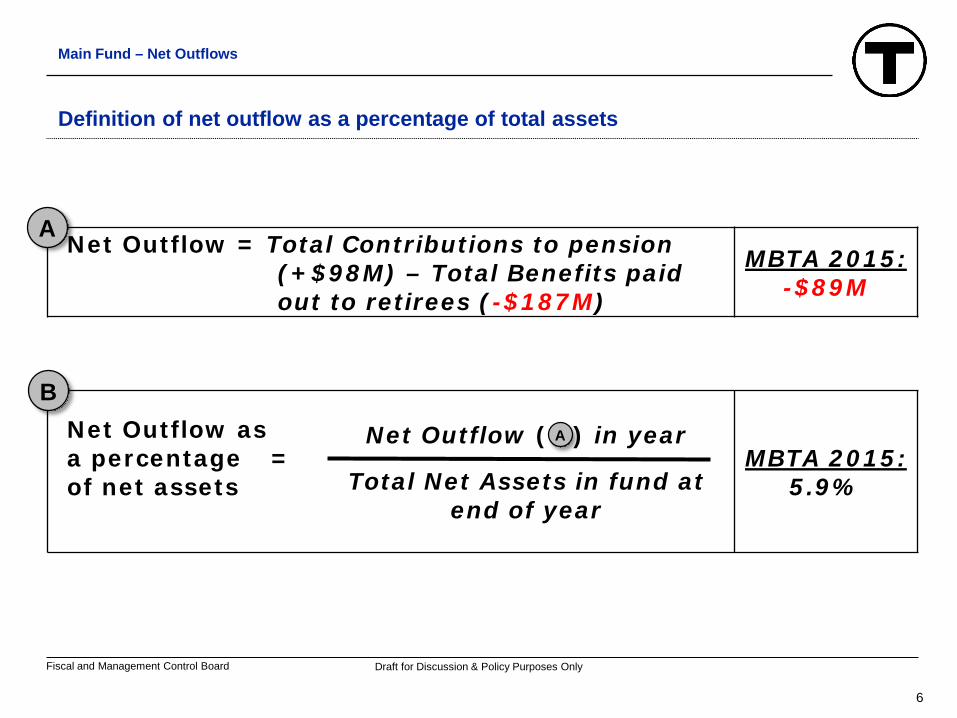
Definition of net outflow as a percentage of total assets
Main Fund – Net Outflows
Net Outflow as a percentage of net assets
=Net Outflow ( ) in year
Total Net Assets in fund at end of year
MBTA 2015:5.9%
Net Outflow = Total Contributions to pension (+$98M) – Total Benefits paid out to retirees (-$187M)
MBTA 2015:-$89M
A
BA
Fiscal and Management Control Board
7
Draft for Discussion & Policy Purposes Only
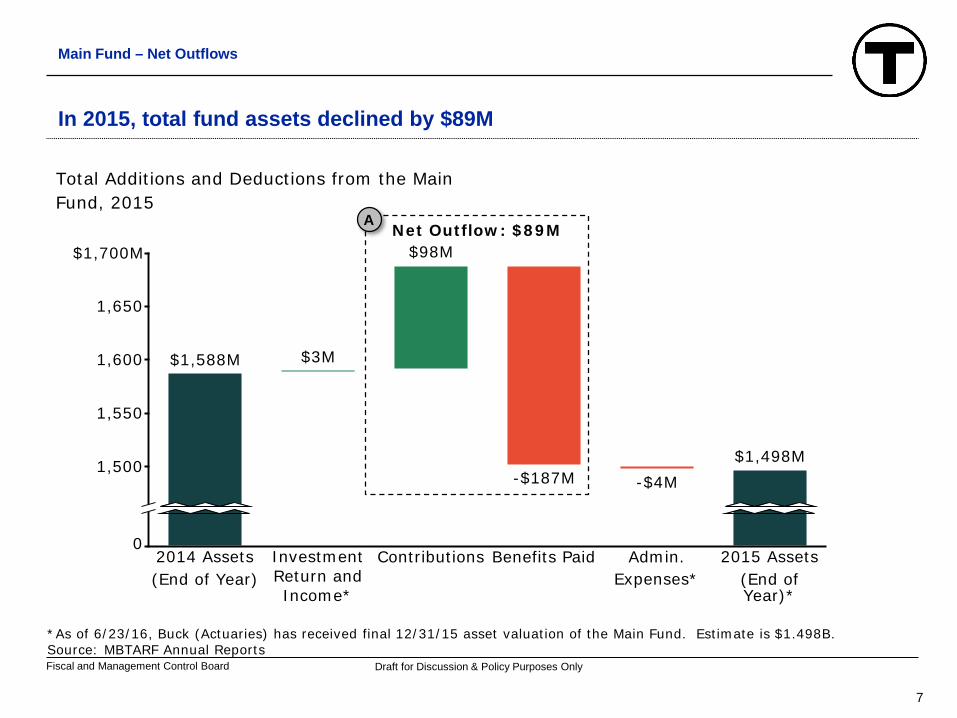
In 2015, total fund assets declined by $89M
Main Fund – Net Outflows
*As of 6/23/16, Buck (Actuaries) has received final 12/31/15 asset valuation of the Main Fund. Estimate is $1.498B.Source: MBTARF Annual Reports
0
1,500
1,550
1,600
1,650
$1,700M
Total Additions and Deductions from the Main
Fund, 2015
2014 Assets
(End of Year)
$1,588M
Investment
Return and
Income*
$3M
Contributions
$98M
Benefits Paid
-$187M
Admin.
Expenses*
-$4M
2015 Assets
(End of
Year)*
$1,498M
Net Outflow: $89MA

Fiscal and Management Control Board
8
Draft for Discussion & Policy Purposes Only
0
2
4
6%
2015 net outflow as a % of total assets
(not including investment return)
MBTARF
5.9%
State-Boston
Retirement
System
(SBRS)
1.2%
Mass.
Teachers'
Retirement
System
(MTRS)
3.4%
Mass. State
Employees'
Retirement
System
(MSERS)
2.5%
MBTA RF net outflow % is higher than other MA pension funds
Main Fund – Required Returns
• MBTARF has net outflow of (-$89M) on net assets of $1.5B in CY15 before investment returns
• SBRS had net outflow of (-$67M) on assets of $5.7B in FY14 before investment returns
• MTRS had net outflow of (-$865M) on assets of $25B in FY15 before investment returns
• MSERS had net outflow of (-$595M) on assets of $23.8B in FY15 before investment returns
Net Outflow as a %of net assets =
Net Outflow
Total Fund Assets
B
Source: MBTA Pension Fund Data; PRIM Annual Report
Fiscal and Management Control Board
9
Draft for Discussion & Policy Purposes Only
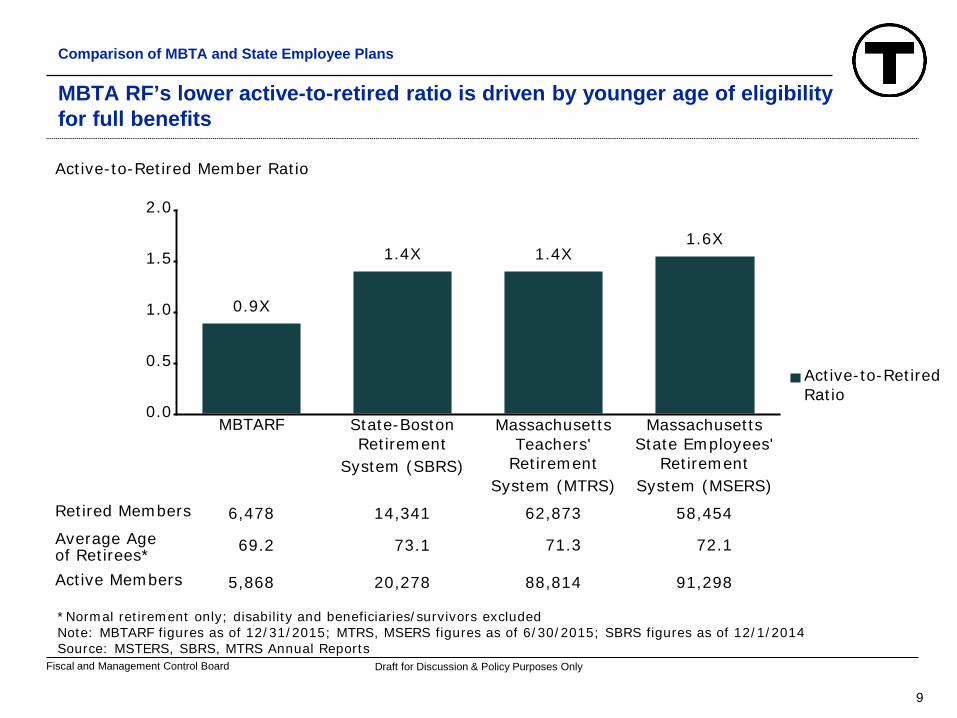
MBTA RF’s lower active-to-retired ratio is driven by younger age of eligibility for full benefits
Comparison of MBTA and State Employee Plans
0.0
0.5
1.0
1.5
2.0
Active-to-Retired Member Ratio
MBTARF
0.9X
State-Boston
Retirement
System (SBRS)
1.4X
Massachusetts
Teachers'
Retirement
System (MTRS)
1.4X
Massachusetts
State Employees'
Retirement
System (MSERS)
1.6X
6,478 14,341 62,873 58,454Retired Members
69.2 73.1 71.3 72.1Average Age
of Retirees*
5,868 20,278 88,814 91,298Active Members
Active-to-Retired
Ratio
*Normal retirement only; disability and beneficiaries/survivors excludedNote: MBTARF figures as of 12/31/2015; MTRS, MSERS figures as of 6/30/2015; SBRS figures as of 12/1/2014Source: MSTERS, SBRS, MTRS Annual Reports

Fiscal and Management Control Board
10
Draft for Discussion & Policy Purposes Only
MBTA calculation uses higher rate of benefit for younger retirees than state
Comparison of MBTA and State Employee Plans
Years of service
Age at retirement Employer Annual multiplier*
Pension % of highest wages
25 55MBTA 2.46% 61.5%
State 1.50% 37.5%
25 60MBTA 2.46% 61.5%
State 2.00% 50.0%
25 65MBTA 2.46% 61.5%
State 2.50% 62.5%
32 65MBTA 2.46% 75%^
State 2.50% 80%
*Uses age rates for state employees hired before 4/2/2012^Calculation produces result >75%, which is adjusted down to maximum benefitNote: MBTARF benefits do not get automatic COLAs; retirees in State systems do (those covered by Chapter 32)
Years of service x Annual Multiplier = Pension % of Highest Wages
Because MBTA pension multiplier does not grow with age, benefits for early retirees are significantly higher than those for state employees
Fiscal and Management Control Board
11
Draft for Discussion & Policy Purposes Only
0
5
10
15%
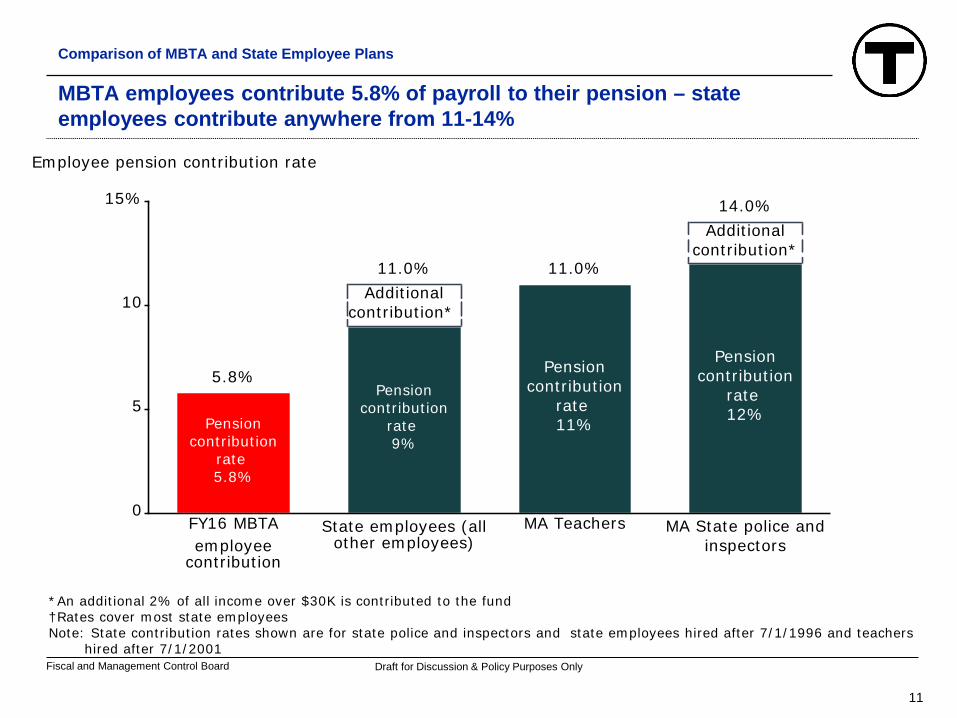
Employee pension contribution rate
FY16 MBTA
employee
contribution
Pension
contribution
rate
5.8%
5.8%
State employees (all
other employees)
Pension
contribution
rate
9%
Additional
contribution*
11.0%
MA Teachers
Pension
contribution
rate
11%
11.0%
MA State police and
inspectors
Pension
contribution
rate
12%
Additional
contribution*
14.0%
MBTA employees contribute 5.8% of payroll to their pension – state employees contribute anywhere from 11-14%
Comparison of MBTA and State Employee Plans
*An additional 2% of all income over $30K is contributed to the fund†Rates cover most state employeesNote: State contribution rates shown are for state police and inspectors and state employees hired after 7/1/1996 and teachers
hired after 7/1/2001
Fiscal and Management Control Board
12
Draft for Discussion & Policy Purposes Only
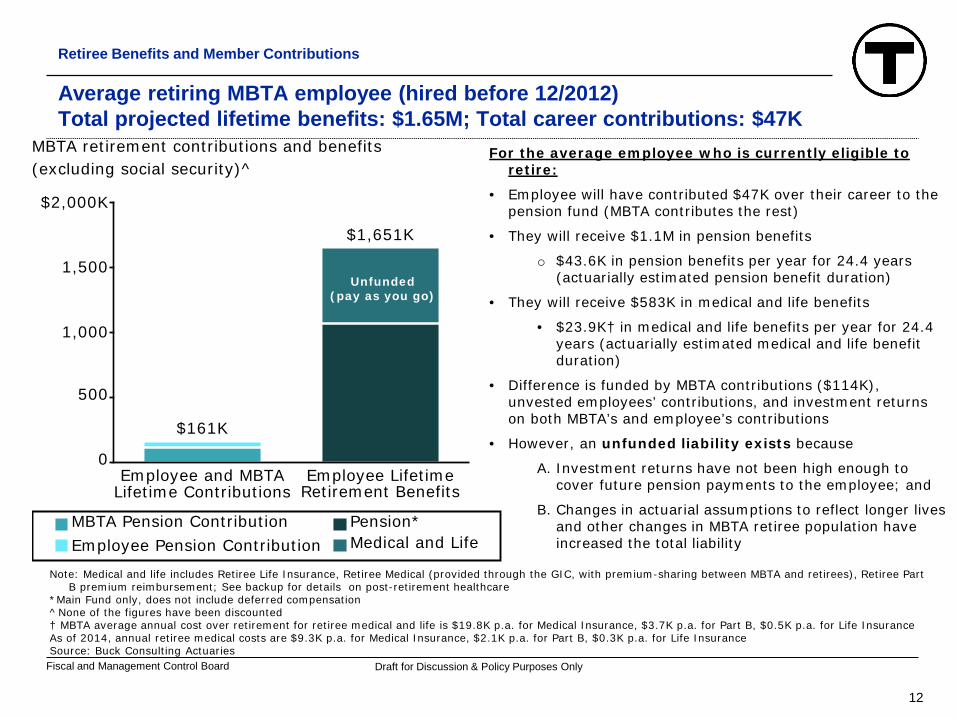
Average retiring MBTA employee (hired before 12/2012) Total projected lifetime benefits: $1.65M; Total career contributions: $47K
Retiree Benefits and Member Contributions
Note: Medical and life includes Retiree Life Insurance, Retiree Medical (provided through the GIC, with premium-sharing between MBTA and retirees), Retiree Part B premium reimbursement; See backup for details on post-retirement healthcare
*Main Fund only, does not include deferred compensation^None of the figures have been discounted† MBTA average annual cost over retirement for retiree medical and life is $19.8K p.a. for Medical Insurance, $3.7K p.a. for Part B, $0.5K p.a. for Life InsuranceAs of 2014, annual retiree medical costs are $9.3K p.a. for Medical Insurance, $2.1K p.a. for Part B, $0.3K p.a. for Life InsuranceSource: Buck Consulting Actuaries
0
500
1,000
1,500
$2,000K
MBTA retirement contributions and benefits
(excluding social security)^
Employee and MBTA
Lifetime Contributions
$161K
Employee Lifetime
Retirement Benefits
$1,651K
Employee Pension ContributionMBTA Pension Contribution Pension*
Medical and Life
U
For the average employee who is currently eligible to retire:
• Employee will have contributed $47K over their career to the pension fund (MBTA contributes the rest)
• They will receive $1.1M in pension benefits
o $43.6K in pension benefits per year for 24.4 years (actuarially estimated pension benefit duration)
• They will receive $583K in medical and life benefits
• $23.9K† in medical and life benefits per year for 24.4 years (actuarially estimated medical and life benefit duration)
• Difference is funded by MBTA contributions ($114K), unvested employees’ contributions, and investment returns on both MBTA’s and employee’s contributions
• However, an unfunded liability exists because
A. Investment returns have not been high enough to cover future pension payments to the employee; and
B. Changes in actuarial assumptions to reflect longer lives and other changes in MBTA retiree population have increased the total liability
Unfunded (pay as you go)

Fiscal and Management Control Board
13
Draft for Discussion & Policy Purposes Only
MBTA Main Fund recent annual returns compared to target return rate
Main Fund – Investment Returns
0
5
10
15
20%
Main Fund Annual Rate of Net Return
7.75%
CY2011
0.8%
CY2012
14.0%
CY2013
16.4%
CY2014
4.8%
CY2015*
0.5%
YTD CY2016
(Jan-May)*
1.5%
7.75%
Net Annual
Return Below
Target
Target Rate of
Return (as of
2/19/2016)Net Annual
Return Above
Target
Target rate of returnis the rate at which a fund is expected to return over the long
term; fund is not expected to beat target
rate each year
*CY15 is an estimate and won’t be complete until the audit is finalized; CY16 returns are for the first 5 months, January to May; CY16 includes 1-3 month valuation lag of alternative investmentsSource: MBTA Pension Fund Data

Fiscal and Management Control Board
14
Draft for Discussion & Policy Purposes Only
0
1,000
2,000
$3,000M
3%
4%
5%
6%
6.75%
7.75%
2015
2016
2017
2018
2019
2020
2021
2022
2023
2024
2025
2026
2027
2028
2029
2030
2031
2032
2033
2034
2035
2036
2037
2038
211 215 219 223 227 230 234 237 240 243187 244 244 244 243 241 238189 193 195 199 201 204 208
122 125 128 132 135 139 143 147 151 15598 159 163 167 172 177 18196 104 106 109 112 115 118
-90 -90 -91 -92 -92 -91 -91 -90 -90 -88-89 -85 -81 -76 -71 -64 -56-93 -89 -89 -89 -89 -89 -89
Main Fund Pension Assets
2%
Outflow
Contribution
Net ($M)
7.75%6.75%6.00%5.00%4.00%3.00%2.00%
Sensitivity Analysis: MBTA Main Fund asset base at various levels of investment return
PROJECTION: Main Fund Assets in a 4% return environment
Assumed Rate of Return
MBTA Pension Sensitivity
$1.5BValue on12/31/15
Note: Model used is preliminary has not undergone actuarial peer reviewSource: MBTA Main Fund Asset and Contribution Projection Model
DRAFT FOR DISCUSSION
Key Assumptions
• Contribution rate as a percentage of payroll remains constant at 24%−MBTA rate
17.7%• Payroll grown at 2.7%, the ten year historic avg.

Fiscal and Management Control Board
15
Draft for Discussion & Policy Purposes Only
0
500
1,000
$1,500M
Main Fund Pension Assets
(not including unfunded liability)
2015
$1,498M
2020
$1,325M
2025
$1,117M
2030
$856M
2035
$576M
Sensitivity Analysis: What is the trend on asset balance of MBTA Main Fund if future investment returns averaged 4%?
PROJECTION: Main Fund Assets in a 4% return environment
Note: Model used is preliminary has not undergone actuarial peer reviewSource: MBTA Main Fund Asset and Contribution Projection Model
Key Assumptions
• Fund returns 4% annually
• Contribution rate % of pay roll remains constant: 24% (of which MBTA pays 17.7%)
• Annual payroll grows at 2.7% (10 year historic avg.)
DRAFT FOR DISCUSSION

Fiscal and Management Control Board
16
Draft for Discussion & Policy Purposes Only
Main Fund – Unfunded Liability
0
1
2
$3B
Year-End Main Fund Pension Net Assets and Liability: Actuarial Value
CY05
1.71
0.16$1.87B
CY06
1.83
0.11$1.94B
CY07
1.90
0.19$2.09B
CY08
1.73
0.41
$2.14B
CY09
1.67
0.55
$2.22B
CY10
1.65
0.69
$2.34B
CY11
1.55
0.73
$2.28B
CY12
1.46
0.86
$2.31B
CY13
1.61
0.76
$2.36B
CY14*
1.63
0.87
$2.50B
CY15*^
1.63
0.94
$2.57B
Actuarial Value of Pension AssetsUnfunded Liability
*Assumed rate of return decreased from 8.00% to 7.75% in 2016; CY14, CY15 shown with 7.75% rate^ Actuarial Value of Assets as estimated by MBTA; As of 6/23/16, Buck (Actuaries) has received final 12/31/15 asset valuation of the Main Fund
and is in process of producing the valuation. Market Value of Assets Estimate is $1.498B. Preliminary Actuarial Accrued Liability is $2.572B. This figure was $2.447 in 2014.
Source: MBTARF Annual Reports; Buck Consultants Actuarial Valuations
Total pension liability was $2.6B at 12/31/15Funded actuarial value is 63%
Actuarial value of assets equals market value less a five-year phase-in of the differences between actual
and assumed investment return
DRAFT FOR DISCUSSION
Fiscal and Management Control Board
17
Draft for Discussion & Policy Purposes Only
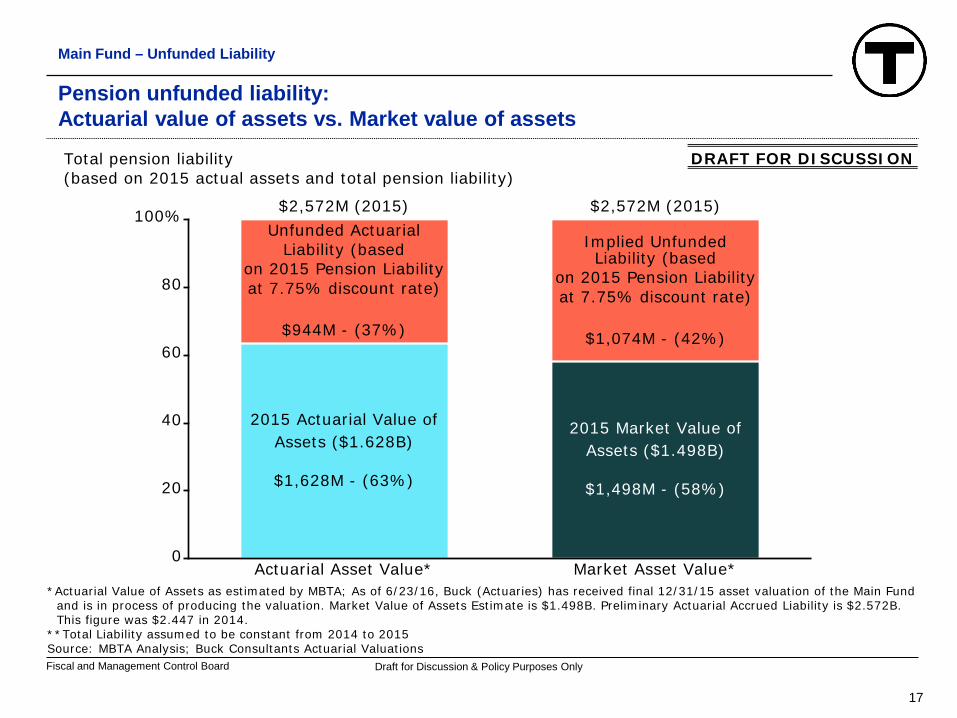
Pension unfunded liability:Actuarial value of assets vs. Market value of assets
Main Fund – Unfunded Liability
0
20
40
60
80
100%
Total pension liability
(based on 2015 actual assets and total pension liability)
Actuarial Asset Value*
2015 Actuarial Value of
Assets ($1.628B)
$1,628M - (63%)
Unfunded Actuarial
Liability (based
on 2015 Pension Liability
at 7.75% discount rate)
$944M - (37%)
$2,572M (2015)
Market Asset Value*
2015 Market Value of
Assets ($1.498B)
$1,498M - (58%)
Implied Unfunded
Liability (based
on 2015 Pension Liability
at 7.75% discount rate)
$1,074M - (42%)
$2,572M (2015)
*Actuarial Value of Assets as estimated by MBTA; As of 6/23/16, Buck (Actuaries) has received final 12/31/15 asset valuation of the Main Fund and is in process of producing the valuation. Market Value of Assets Estimate is $1.498B. Preliminary Actuarial Accrued Liability is $2.572B. This figure was $2.447 in 2014.
**Total Liability assumed to be constant from 2014 to 2015Source: MBTA Analysis; Buck Consultants Actuarial Valuations
DRAFT FOR DISCUSSION

Fiscal and Management Control Board
18
Draft for Discussion & Policy Purposes Only
Where do we go from here?MBTA contributions to Main Fund have more than doubled over past 10 years
MBTA Pension Future Outlook
0
20
40
60
80
$100M
MBTA contribution to Main Fund
FY07
$37M
FY17 Budget
$87M
Note: $7.0M in contributions during FY07 were retroactive ‘catch-up’ payments for previous years in which not enough had been contributed compared with contractual obligations; these have been removedSource: MBTA Financials
MBTA contribution has risen from 9.5% to 17.7%

Fiscal and Management Control Board
19
Draft for Discussion & Policy Purposes Only
0
25
50
75
100
$125M
Estimated annual MBTA contribution to
pension fund at 4% annual investment return
FY17E
$87M
FY18E
$92M
FY19E
$96M
FY20E
$101M
FY21E
FY16 Base
Estimated
Contribution
Growth
$107M
5%
FY17-FY21CAGR
17.7% 18.2% 18.6% 19.1% 19.6%MBTA
Contribution
Rate
In a 4% return environment, MBTA annual required contribution will likely exceed $100M within the next 5 years
PROJECTION: Main Fund Assets in a 4% return environment
Note: Does not include contributions made based on back pay; Contribution rate estimates produced have undergone peer review by actuaries; dollar estimates have not been reviewed
Source: Buck Consultants; MBTA analysis
DRAFT FOR DISCUSSION
Key Assumptions
• Contribution rate as a percentage of payroll recalculated each year to reflect a 4% annual investment return from FY16-FY21
• Payroll grown at 2.7%, the ten year historic avg.
Fiscal and Management Control Board
20
Draft for Discussion & Policy Purposes Only
• Eligibility, benefits, contribution rates (for MBTA and employees) and board governance rules for the MBTA Pension are set forth in a Pension Agreement negotiated between the MBTA and the L589 Boston Carmen’s Union› Current Pension Agreement was signed on July 1, 2014 and is in effect
for 4 years› All existing contractual terms of current Pension Agreement expire on
June 30, 2018 and are open to negotiation in the next contract cycle (or sooner – if the parties so choose)
› The Pension Agreement is posted online at www.mbtarf.com
• In addition to the benefits negotiated under the Pension Agreement, MBTA and its employees pay into, and receive Social Security Benefits. MA does not pay Social Security and MA state workers do not receive Social Security Benefits
The Pension Agreement is a contract between the MBTA and the Boston Carmens Union (L589)
MBTA Pension Future Outlook

Fiscal and Management Control Board
21
Draft for Discussion & Policy Purposes Only
• Age required for retirement• Annual multiplier applied per year of service• Value of sick days in relation to pensionable years of service• Terms on which pensions can be passed onto beneficiaries (other
than spouses) and on which pensions are paid for retirees who pass early
• Overall pension operating expenses (investment and administrative expenses)
• Approach to investment strategy and asset allocation decisions• Level of access to top managers (particularly for private equity) and
ability, given scale, to negotiate best rates for investment mgmt• Contribution split between MBTA and employees• Breadth of eligibility and availability of the current 401K plan, which
is offered to management union and EXE employees
Key terms that impact long term sustainability of the pension, future required MBTA contributions and total pension returns
MBTA Pension Future Outlook

Fiscal and Management Control Board
22
Draft for Discussion & Policy Purposes Only
MBTRF Governance: Retirement Board Structure
MBTA Pension Future Outlook
Retirement Board MembershipA. 3 people appointed by AuthorityB. 1 Member of the Fund elected by vote by Members of the Fund who are not members of the
Carmen’s Union L589C. 2 Members of the Fund to be designated by the Carmen’s Union L589D. 1 honorary member selected by the board, who does not have regular voting powers
Voting on decisions by the Retirement Board• At least 4 votes from elected members are required to make a decision including:
− At least two out of three members from (A)− AND at least two out of three members from (B) and (C)
• If no decision can be made, the rules are as follows:− Vote of the honorary member− AND at least two out of three members from (A)− OR at least two out of three members from (B) and (C)
Key Responsibilities of the Retirement Board• Investing the Fund’s money• Setting the annual contribution rate, with the aid of Actuaries• Annual report on operations, assets, and liabilities of the Fund, available to all members of
the Fund• Decisions on retirement of active members and distribution of benefits• Providing public information on MBTA pension benefits paid to retired members• Choosing the Executive Director of the MBTA Retirement Fund

Fiscal and Management Control Board
23
Draft for Discussion & Policy Purposes Only
Where do we go from here?
1. Pensions are the fastest growing operating expense• MBTA pension expense fastest growing portion of operating budget at ~17% in
FY17
2. Sustainability of the pension fund is dependent on overall market performance and investment returns• If the MBTARF does not produce returns close to target rate of 7.75%, the fund
will face significant shortfalls • Filling the gap will place significant pressure on MBTA operating budget
3. This is the time to pursue reform that addresses the sustainability of the pension and protects all stakeholders: employees, retirees and taxpayers

Fiscal and Management Control Board
24
Draft for Discussion & Policy Purposes Only
Backup
Fiscal and Management Control Board
25
Draft for Discussion & Policy Purposes Only
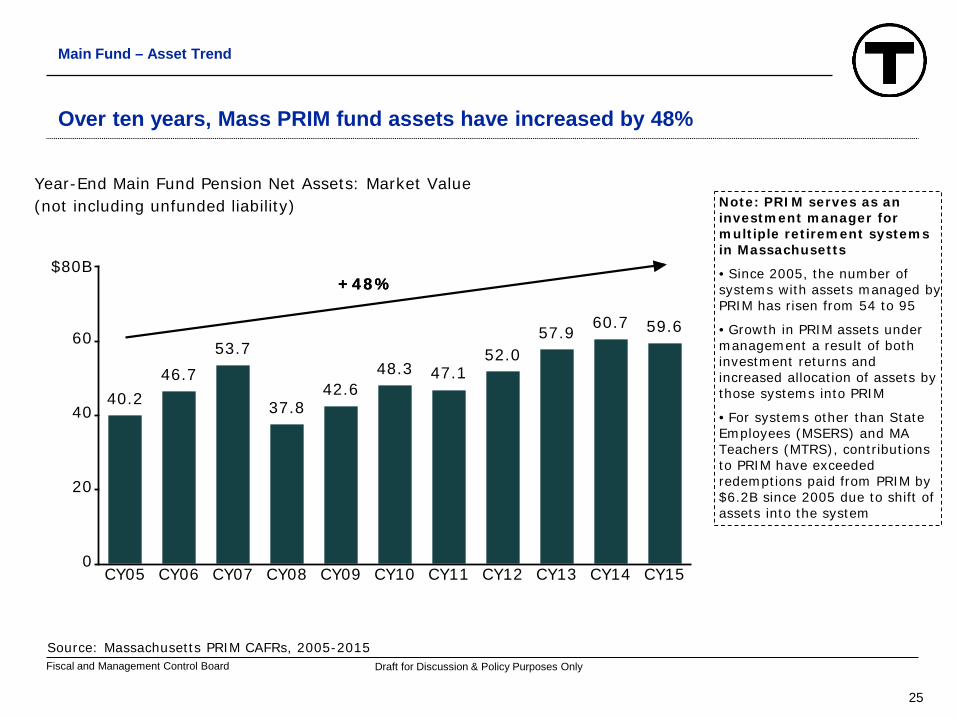
Over ten years, Mass PRIM fund assets have increased by 48%
Main Fund – Asset Trend
0
20
40
60
$80B
Year-End Main Fund Pension Net Assets: Market Value
(not including unfunded liability)
CY05
40.2
CY06
46.7
CY07
53.7
CY08
37.8
CY09
42.6
CY10
48.3
CY11
47.1
CY12
52.0
CY13
57.9
CY14
60.7
CY15
59.6
+48%+48%
Source: Massachusetts PRIM CAFRs, 2005-2015
Note: PRIM serves as an investment manager for multiple retirement systems in Massachusetts
• Since 2005, the number of systems with assets managed by PRIM has risen from 54 to 95
• Growth in PRIM assets under management a result of both investment returns and increased allocation of assets by those systems into PRIM
• For systems other than State Employees (MSERS) and MA Teachers (MTRS), contributions to PRIM have exceeded redemptions paid from PRIM by $6.2B since 2005 due to shift of assets into the system
Fiscal and Management Control Board
26
Draft for Discussion & Policy Purposes Only
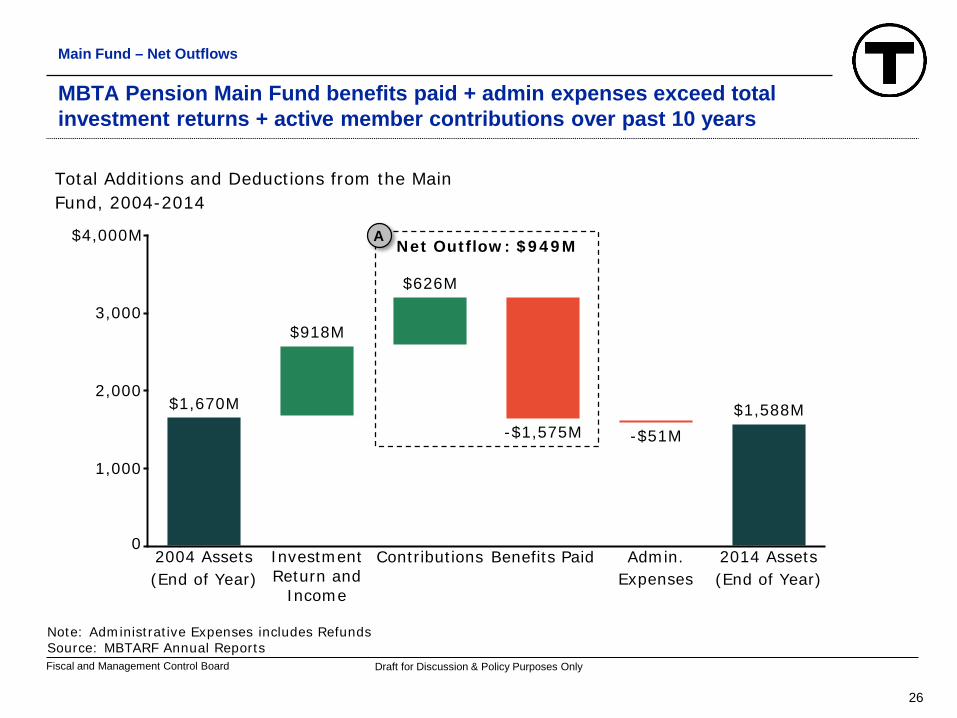
MBTA Pension Main Fund benefits paid + admin expenses exceed total investment returns + active member contributions over past 10 years
Main Fund – Net Outflows
0
1,000
2,000
3,000
$4,000M
Total Additions and Deductions from the Main
Fund, 2004-2014
2004 Assets
(End of Year)
$1,670M
Investment
Return and
Income
$918M
Contributions
$626M
Benefits Paid
-$1,575M
Admin.
Expenses
-$51M
2014 Assets
(End of Year)
$1,588M
Note: Administrative Expenses includes RefundsSource: MBTARF Annual Reports
Net Outflow: $949MA

Fiscal and Management Control Board
27
Draft for Discussion & Policy Purposes Only
Asset smoothing defers recognition of fund underperformance: actuarial value of assets was $44M higher at end-of-year 2014
Main Fund – Unfunded Liability
0
500
1,000
1,500
$2,000M
Market-to-Actuarial Asset Value, 2014
2013 Market
Value of Assets
$1,607M
Net Outflow
-$92M
Net Market
Return*
$74M
2014 Market
Value of Assets
$1,588M
Actuarial
Deferred
Losses (2014)
$44M
2014 Actuarial
Value of Assets
$1,632M
*Net Market Return includes investment expenses, fund administrative expenses and refundsNote: Asset smoothing is a common practice used by pension funds to reduce volatility in contribution levels. MBTARF, State-
Boston Retirement System, Mass Teachers’ Retirement System and Mass State Employees’ Systems all use the same method to defer realization of gains/losses (although use different values for maximum deviation from market value)
Source: Buck Consultants Actuarial Valuations
80% Deferred
In 2013, actuarial value of assets was reset to equal market value of assets

Fiscal and Management Control Board
28
Draft for Discussion & Policy Purposes Only
0
500
1,000
1,500
2,000
Market-to-Actuarial Asset Value, 2015
2014 Market
Value of
Assets
$1,588M
2015 Net
Outflow
-$89M
2015 Net
Market
Return**
-$1M
2015 Market
Value of
Assets
$1,498M
Actuarial
Deferred
Losses (2014
vintage)
$33M
Actuarial
Deferred
Losses
(2015)*
$97M
2015
Actuarial
Value of
Assets*
$1,628M
Asset smoothing defers recognition of fund underperformance: actuarial value of assets estimated to be ~$130M higher than market value in 2015
Main Fund – Unfunded Liability
*Actuarial Value of Assets as estimated by MBTA**Net Market Return includes investment expenses, fund administrative expenses and refundsNote: As of 6/14/16, Buck (Actuaries) had not received final 12/31/15 asset valuation of the Main Fund. Estimate is $1.498BSource: MBTA Analysis; Buck Consultants Actuarial Valuations
80% Deferred60% Deferred
DRAFT FOR DISCUSSION

Fiscal and Management Control Board
29
Draft for Discussion & Policy Purposes Only
Actuarial smoothing defers recognition of losses; currently, actuarial funding ratio 5% higher than market value of assets
Main Fund – Unfunded Liability
0
20
40
60
80
100%
Ratio of Assets to Pension Liability, 2005-2014
CY05 CY06 CY07 CY08 CY09 CY10 CY11 CY12 CY13 CY14 CY15*
68% 63% 58%92% 96% 92% 61% 64% 64% 61% 64%Market Value
Funded Ratio
68% 65% 63%91% 94% 91% 81% 75% 70% 68% 63%Actuarial
Funded Ratio
Market Value
Funded RatioActuarial
Funded Ratio
Actuarial value of assets set equal to
market value of assets in 2013
*Actuarial Value of Assets as estimated by MBTA; As of 6/14/16, Buck (Actuaries) had not received final 12/31/15 asset valuationof the Main Fund. Market Value of Assets Estimate is $1.498B. Preliminary Actuarial Accrued Liability is $2.572B.
Source: MBTA Analysis; Buck Consultants Actuarial Valuations
DRAFT FOR DISCUSSION
Fiscal and Management Control Board
30
Draft for Discussion & Policy Purposes Only
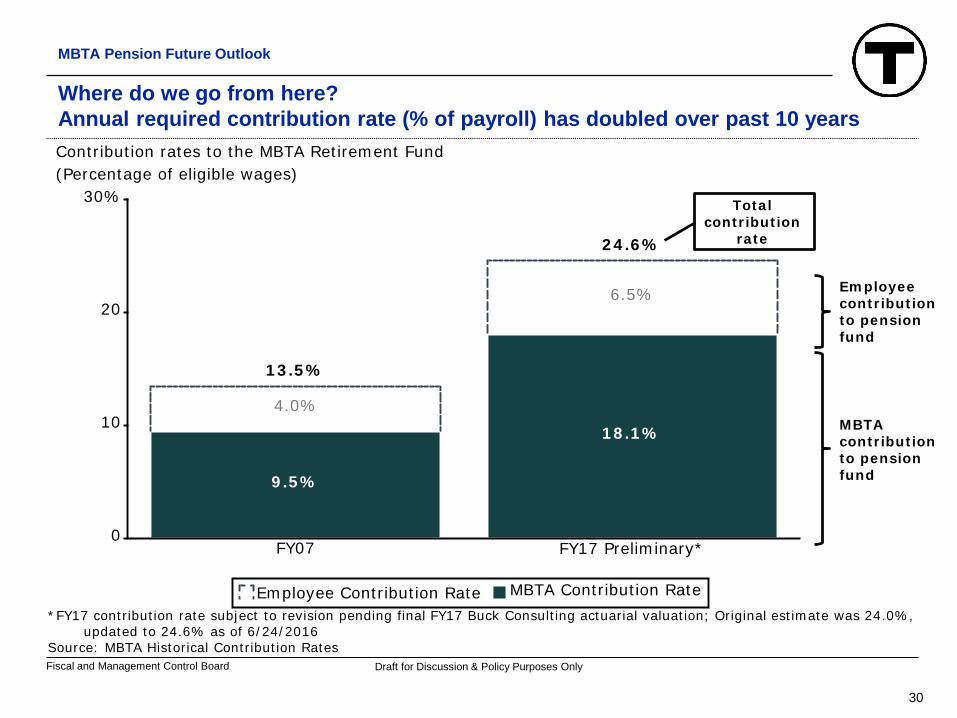
Where do we go from here?Annual required contribution rate (% of payroll) has doubled over past 10 years
MBTA Pension Future Outlook
0
10
20
30%
Contribution rates to the MBTA Retirement Fund
(Percentage of eligible wages)
FY07
4.0%
9.5%
13.5%
FY17 Preliminary*
6.5%
18.1%
24.6%
Employee Contribution Rate MBTA Contribution Rate
MBTA contribution to pension fund
Employee contribution to pension fund
Total contribution
rate
*FY17 contribution rate subject to revision pending final FY17 Buck Consulting actuarial valuation; Original estimate was 24.0%,updated to 24.6% as of 6/24/2016
Source: MBTA Historical Contribution Rates
Fiscal and Management Control Board
31
Draft for Discussion & Policy Purposes Only
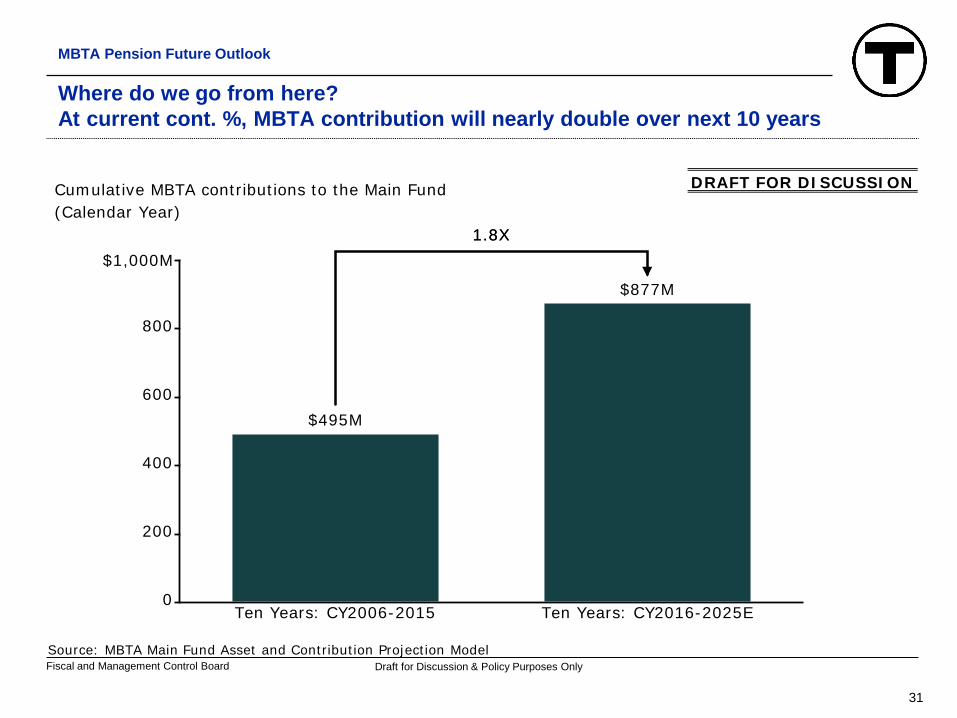
0
200
400
600
800
$1,000M
Cumulative MBTA contributions to the Main Fund
(Calendar Year)
Ten Years: CY2006-2015
$495M
Ten Years: CY2016-2025E
$877M
1.8X1.8X
Where do we go from here?At current cont. %, MBTA contribution will nearly double over next 10 years
MBTA Pension Future Outlook
Source: MBTA Main Fund Asset and Contribution Projection Model
DRAFT FOR DISCUSSION

Fiscal and Management Control Board
32
Draft for Discussion & Policy Purposes Only
$1.76B in benefits paid by MBTARF 2005-2015
Main Fund Benefits and Contributions
0
50
100
150
$200M
CY05
126
CY06
132
CY07
142
CY08
149
CY09
157
CY10
165
CY11
170
CY12
175
CY13
177
CY14
182
CY15
187
4%
'05-'15CAGR
Benefits


![MBTA Commuter Rail System - cdn.mbtace.com€¦ · South Acton W t o r d ^ ] o À , ] o o ... run express to/from Boston weekdays Grove Hall Union Square Powder House Square Hotel](https://img.dokumen.tips/doc/110x75/5aedf5117f8b9ac62b8b5706/mbta-commuter-rail-system-cdn-south-acton-w-t-o-r-d-o-o-o-run-express.jpg)