Embed Size (px)
Citation preview

MBT BANCSHARES, INC. AND SUBSIDIARY
DECEMBER 31, 2018 AND 2017
METAIRIE, LOUISIANA

TABLE OF CONTENTS
Audited Financial Statements:
Independent Auditor’s Report Page 1 - 2
Consolidated Balance Sheets 3
Consolidated Statements of Income 4
Consolidated Statements of Comprehensive Income 5
Consolidated Statements of Changes in Shareholders’ Equity 6
Consolidated Statements of Cash Flows 7 - 8
Notes to Consolidated Financial Statements 9 - 46

1
2322 Tremont Drive ● Baton Rouge, LA 70809 178 Del Orleans Avenue, Suite C ● Denham Springs, LA 70726
650 Poydras Street, Suite 1200 ● New Orleans, LA 70130 Phone: 225.928.4770 ● Fax: 225.926.0945
www.htbcpa.com
Independent Auditor's Report
To the Board of Directors and Stockholders
MBT Bancshares, Inc. and Subsidiary
Metairie, Louisiana
We have audited the accompanying consolidated financial statements of MBT Bancshares, (a
Corporation) and Subsidiary, which comprise the consolidated balance sheets as of December 31, 2018
and 2017, and the related consolidated statements of income, comprehensive income, changes in
shareholders' equity and cash flows for the years then ended, and the related notes to the financial
statements.
Management’s Responsibility for the Financial Statements
Management is responsible for the preparation and fair presentation of these financial statements in
accordance with accounting principles generally accepted in the United States of America; this
includes the design, implementation, and maintenance of internal control relevant to the preparation
and fair presentation of financial statements that are free from material misstatement, whether due to
fraud or error.
Auditor’s Responsibility
Our responsibility is to express an opinion on these financial statements based on our audits. We
conducted our audits in accordance with auditing standards generally accepted in the United States of
America. Those standards require that we plan and perform the audit to obtain reasonable assurance
about whether the financial statements are free from material misstatement.
An audit involves performing procedures to obtain audit evidence about the amounts and disclosures in
the financial statements. The procedures selected depend on the auditor’s judgment, including the
assessment of the risks of material misstatement of the financial statements, whether due to fraud or
error. In making those risk assessments, the auditor considers internal control relevant to the entity’s
preparation and fair presentation of the financial statements in order to design audit procedures that are
appropriate in the circumstances, but not for the purpose of expressing an opinion on the effectiveness
of the entity’s internal control. Accordingly, we express no such opinion. An audit also includes
evaluating the appropriateness of accounting policies used and the reasonableness of significant
accounting estimates made by management, as well as evaluating the overall presentation of the
financial statements.

2
We believe that the audit evidence we have obtained is sufficient and appropriate to provide a basis for
our audit opinion.
Opinion
In our opinion, the financial statements referred to above present fairly, in all material respects, the
financial position of MBT Bancshares, Inc. and Subsidiary as of December 31, 2018 and 2017, and the
results of its operations and its cash flows for the years then ended in accordance with accounting
principles generally accepted in the United States of America.
Respectfully submitted,
New Orleans, Louisiana March 22, 2019

2018 2017
Cash and Due From Banks 7,795,812$ 10,291,568$
Federal Funds Sold 375,000 325,000
Total Cash and Cash Equivalents 8,170,812 10,616,568
Interest Bearing Deposits with other Banks 1,224,783 1,224,528
Securities Available-for-Sale 47,818,742 49,827,202
Mortgage Loans Available-for Sale - 208,745
Loans, Less Allowance for Loan Losses of
$2,588,301 for 2018 and $2,541,809 for 2017 310,516,389 309,007,662
Bank Premises and Equipment, Net 10,456,093 10,919,286
Accrued Interest Receivable 963,763 976,176
Investment in FNBB Stock 250,000 250,000
Investment in FHLB of Dallas Stock 1,012,800 993,600
Other Investments 735,000 660,000
Cash Surrender Value of Life Insurance 2,912,130 2,867,405
Other Assets 1,287,823 1,830,246
Total Assets 385,348,335$ 389,381,418$
LIABILITIES
Deposits:
Non-Interest Bearing 105,443,675$ 107,522,917$
Interest Bearing 240,730,293 227,407,214
Total Deposits 346,173,968 334,930,131
Advances from the FHLB of Dallas - 15,000,000
Accrued Interest Payable 48,311 35,175
Dividends Payable - 1,021,772
Deferred Tax Liability 236,512 354,639
Other Liabilities 1,268,182 1,213,152
Total Liabilities 347,726,973 352,554,869
Common Stock - $1 Par Value, 2,100,000 Shares Authorized
2,043,543 Issued and Outstanding 2,043,543 2,043,543
Capital Surplus 9,956,457 9,956,457
Retained Earnings 27,747,775 26,347,969
Accumulated Other Comprehensive Income (Loss) (2,126,413) (1,521,420)
Total Stockholders' Equity 37,621,362 36,826,549
Total Liabilities and Stockholders' Equity 385,348,335$ 389,381,418$
The accompanying notes are an integral part of these financial statements.
3
ASSETS
STOCKHOLDERS' EQUITY
MBT BANCSHARES, INC. AND SUBSIDIARY
CONSOLIDATED BALANCE SHEETS
AS OF DECEMBER 31, 2018 AND 2017

2018 2017
Interest Income:
Interest and Fees on Loans 15,497,875$ 13,991,760$
Interest and Dividends on Securities-Taxable 786,503 857,077
Interest and Dividends on Securities-Non-taxable 219,741 234,706
Interest on Interest Bearing Deposits and Federal Funds Sold 87,543 63,483
Total Interest Income 16,591,662 15,147,026
Interest Expense:
Interest Expense on Deposits 543,038 450,553
Interest on Borrowings 148,897 33,345
Total Interest Expense 691,935 483,898
Net Interest Income 15,899,727 14,663,128
Provision for Loan Losses 355,000 661,424
Net Interest Income after Provision for Loan Losses 15,544,727 14,001,704
Noninterest Income:
Customer Service Fees 2,652,578 2,524,611
Gain on Sale of Loans 106,389 75,205
Gain (Loss) on Sale of Securities Available-for-Sale (10,803) 53,764
Other 346,493 429,425
Total Noninterest Income 3,094,657 3,083,005
Noninterest Expense:
Salaries and Employee Benefits 8,201,314 7,738,296
Occupancy Expense 2,218,490 2,344,969
Other Operating Expenses 3,819,650 3,942,969
Total Noninterest Expense 14,239,454 14,026,234
Income Before Income Taxes 4,399,930 3,058,475
Provision for Income Taxes 956,580 612,549
Net Income 3,443,350$ 2,445,926$
The accompanying notes are an integral part of these financial statements.
4
MBT BANCSHARES, INC. AND SUBSIDIARY
CONSOLIDATED STATEMENTS OF INCOME
FOR THE YEARS ENDED DECEMBER 31, 2018 AND 2017

FOR THE YEARS ENDED DECEMBER 31, 2018 AND 2017
2018 2017
Net Income 3,443,350$ 2,445,926$
Other Comprehensive Income (Loss):
Unrealized Gains (Losses) on Investment Securities (325,174) (86,210)
Income Tax Effect 68,286 29,311
(256,888) (56,899)
Reclassification Adjustment for (Gains) Losses Realized 10,803 (53,764)
Income Tax Effect (2,269) 18,280
8,534 (35,484)
Unrecognized Pension Plan Gains (Losses) (451,442) (177,733)
Income Tax Effect 94,803 60,429
(356,639) (117,304)
Total Other Comprehensive Loss, Net of Taxes (604,993) (209,687)
Comprehensive Income 2,838,357$ 2,236,239$
The accompanying notes are an integral part of these financial statements.
MBT BANCSHARES, INC. AND SUBSIDIARY
CONSOLIDATED STATEMENTS OF COMPREHENSIVE INCOME
5
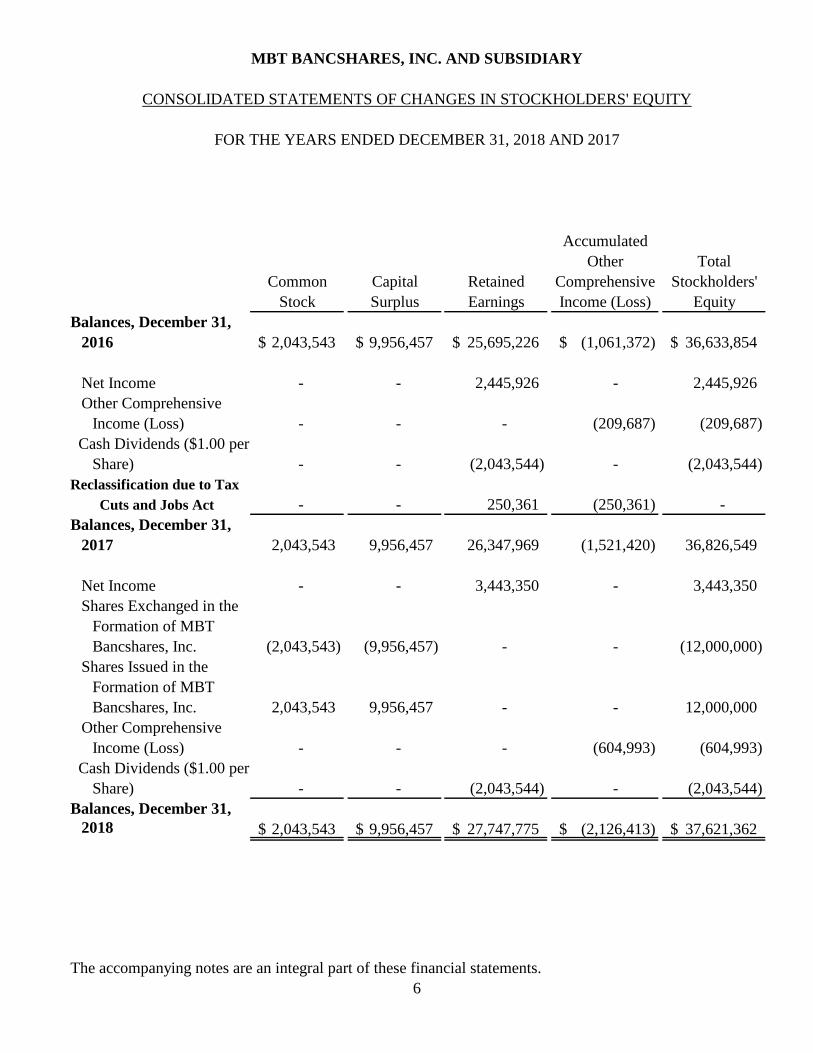
Accumulated
Other Total
Common Capital Retained Comprehensive Stockholders'
Stock Surplus Earnings Income (Loss) Equity
Balances, December 31,
2016 2,043,543$ 9,956,457$ 25,695,226$ (1,061,372)$ 36,633,854$
Net Income - - 2,445,926 - 2,445,926
Other Comprehensive
Income (Loss) - - - (209,687) (209,687)
Cash Dividends ($1.00 per
Share) - - (2,043,544) - (2,043,544)
Reclassification due to Tax
Cuts and Jobs Act - - 250,361 (250,361) -
Balances, December 31,
2017 2,043,543 9,956,457 26,347,969 (1,521,420) 36,826,549
Net Income - - 3,443,350 - 3,443,350
Shares Exchanged in the
Formation of MBT
Bancshares, Inc. (2,043,543) (9,956,457) - - (12,000,000)
Shares Issued in the
Formation of MBT
Bancshares, Inc. 2,043,543 9,956,457 - - 12,000,000
Other Comprehensive
Income (Loss) - - - (604,993) (604,993)
Cash Dividends ($1.00 per
Share) - - (2,043,544) - (2,043,544)
Balances, December 31,
2018 2,043,543$ 9,956,457$ 27,747,775$ (2,126,413)$ 37,621,362$
The accompanying notes are an integral part of these financial statements.
MBT BANCSHARES, INC. AND SUBSIDIARY
CONSOLIDATED STATEMENTS OF CHANGES IN STOCKHOLDERS' EQUITY
FOR THE YEARS ENDED DECEMBER 31, 2018 AND 2017
6

2018 2017
Cash Flows From Operating Activities:
Net Income 3,443,350$ 2,445,926$
Adjustments to Reconcile Net Income to Net Cash
Provided by Operating Activities:
Net Amortization on Securities Available-for-Sale 147,546 185,855
Net (Gain) Loss on Sale of Securities Available-for-Sale 10,803 (53,764)
Net (Gain) Loss on Sale of Foreclosed Assets - (4,950)
Provision for Loan Losses 355,000 661,424
Provision (Benefit) for Deferred Income Taxes 42,693 (369,830)
Depreciation and Amortization 723,595 839,098
Stock Dividend on FHLB of Dallas Stock (19,200) (500)
Changes in Assets and Liabilities:
(Increase) Decrease in Loans Held for Sale 208,745 (8,745)
(Increase) Decrease in Accrued Interest Receivable 12,413 (40,309)
(Increase) Decrease in Cash Surrender Value of Life
Insurance (44,725) (46,528)
(Increase) Decrease in Other Assets 90,981 (298,266)
Increase (Decrease) in Accrued Interest Payable 13,136 2,114
Increase (Decrease) in Dividends Payable (1,021,772) -
Increase (Decrease) in Other Liabilities 55,030 133,194
Net Cash Provided by Operating Activities 4,017,595 3,444,719
Cash Flows From Investing Activities:
Purchases of Securities Available-for-Sale (12,945,615) (7,643,595)
Proceeds from Sales of Securities Available for Sale 4,511,394 16,800,349
Proceeds from Maturities, Calls and Paydowns of Securities
Available-for-Sale 9,969,961 15,095,093
Purchase of Interest Bearing Deposits in Other
Financial Institutions (1,229,399) (1,224,528)
Proceeds from Maturities of Interest Bearing Deposits in
Other Financial Institutions 1,229,144 1,221,196
Purchase of FHLB of Dallas Stock - (836,100)
Proceeds from Sale of Foreclosed Assets - 90,000
Purchase of Other Investments (75,000) -
Net (Increase) Decrease in Loans (1,863,727) (40,563,670)
Purchases of Premises and Equipment (260,402) (422,626)
Net Cash Used in Investing Activities (663,644) (17,483,881)
(CONTINUED)
7
MBT BANCSHARES, INC. AND SUBSIDIARY
CONSOLIDATED STATEMENTS OF CASH FLOWS
FOR THE YEARS ENDED DECEMBER 31, 2018 AND 2017

2018 2017
Cash Flows From Financing Activities:
Net (Decrease) Increase in Advances from FHLB of Dallas (15,000,000) 15,000,000
Net Increase (Decrease) in Deposits 11,243,837 (4,250,215)
Dividends Declared (2,043,544) (2,043,544)
Net Cash Provided by (Used in) Financing Activities (5,799,707) 8,706,241
Net Decrease in Cash and Cash Equivalents (2,445,756) (5,332,921)
Cash and Cash Equivalents - Beginning of Year 10,616,528 15,949,449
Cash and Cash Equivalents - End of Year 8,170,772$ 10,616,528$
Supplemental Disclosures of Cash Flow Information:
Cash Payments for:Interest on Deposits 529,902$ 448,439$
Interest Paid on Advances from FHLB of Dallas 148,897$ 33,345$
Income Taxes 797,500$ 944,000$
Supplemental Schedule of Noncash Investing Activities:
Change in Unrealized (Loss) Gain on Securities
Available-for-Sale (314,371)$ (139,974)$
Change in Deferred Tax Effect on the Unrealized Gain (Loss) on Securities Available-for-Sale (68,104)$ (8,809)$
Foreclosed Real Estate Acquired in Settlement of Loans -$ 85,050$
The accompanying notes are an integral part of these financial statements.
8
METAIRIE BANK AND TRUST COMPANY
STATEMENTS OF CASH FLOWS (CONTINUED)
FOR THE YEARS ENDED DECEMBER 31, 2018 AND 2017

9
MBT BANCSHARES, INC. AND SUBSIDIARY
NOTES TO CONSOLIDATED FINANCIAL STATEMENTS
DECEMBER 31, 2018 AND 2017
Note 1 - Summary of Significant Accounting Policies -
Nature of Operations
On September 29, 2017, MBT Bancshares, Inc. ( the “Company”) was incorporated as a Louisiana
corporation to facilitate the reorganization of Metairie Bank and Trust Company (the “Bank”) into
a holding company structure by means of a statutory share exchange in accordance with Section 1-
1101 et seq. of the Louisiana Business Corporation Act and Section 352.1 of the Louisiana
Banking Law. As a result of the share exchange, the Company acquired all of the issued and
outstanding shares of the Bank as of March 29, 2018 in exchange for all of the issued and
outstanding shares of the Company, thereby becoming a registered bank holding company under
the Bank Holding Company Act of 1956, as amended, with respect to the Bank.
MBT Bancshares, Inc. (OTC – MBKL) operates pursuant to section 3(a) (1) of the Bank Holding
Company Act.
Metairie Bank and Trust Company operates under a state bank charter and provides full banking
services. The Bank is subject to regulation of the Federal Deposit Insurance Corporation and the
Office of Financial Institutions of the State of Louisiana. The Bank serves the immediate and
surrounding geographic areas from its various offices located in Metairie, Mandeville, and
Covington, Louisiana, and generates commercial, mortgage and consumer loans to and receives
deposits from individual and business customers located in these and surrounding areas. In
addition, the Bank operates a full service insurance agency, MB Insurance, and an investment
advisory firm, MB Investments.
The Bank’s loan portfolio consists mainly of permanent and construction mortgage loans
collateralized by residential and commercial real estate. These loans are structured as traditional
closed-end mortgage loans, as well as revolving lines of credit. The loans are expected to be repaid
from cash flows of the borrowers. Some of the activities that the economy of the region of
Louisiana in which the Bank operates is dependent upon include the petrochemical industry, port
activity along that region of the Mississippi River, healthcare and tourism. Significant declines in
these activities and the general economic conditions in the Bank's market areas could affect
borrowers’ abilities to repay loans and cause a decline in value of the assets securing the loan
portfolio.
The Bank’s operations are subject to customary business risks associated with activities of a
financial institution. Some of those risks include competition from other institutions and changes
in economic conditions, interest rates and regulatory requirements.

10
Principles of Consolidation
The consolidated financial statements as of and for the year ended December 31, 2018, include
MBT Bancshares, Inc. and its wholly-owned subsidiary the Bank, together referred to as the
Company. Intercompany transactions and balances have been eliminated in consolidation. The
financial statements as of and for the year ended December 31, 2017 represent the Bank only, as
the reorganization into holding company structure, including the formation of MBT Bancshares,
Inc., was completed on March 29, 2018. References herein to the Company for periods prior to the
completion of the stock exchange should be deemed to refer to the Bank.
Use of Estimates
The preparation of financial statements in conformity with generally accepted accounting
principles requires management to make estimates and assumptions that affect the reported
amounts of assets and liabilities and disclosure of contingent assets and liabilities at the date of the
financial statements and the reported amounts of revenues and expenses during the reporting
period. Actual results could differ from those estimates. Material estimates that are particularly
susceptible to significant change in the near term relate to the determination of the allowance for
losses on loans, the valuation of foreclosed real estate, the valuation of deferred tax assets, other
than temporary impairments of securities and the fair value of financial instruments. While
management uses available information to recognize losses on loans, further reductions in the
carrying amounts of loans may be necessary based on changes in local economic conditions. In
addition, regulatory agencies, as an integral part of their examination process, periodically review
the estimated losses on loans. Such agencies may require the Bank to recognize additional losses
based on their judgments about information available to them at the time of their examination.
Because of these factors, it is reasonably possible that these estimates may change in the near term.
However, the amount of the change that is reasonably possible cannot be estimated.
The accounting and reporting policies of the Bank are in accordance with U.S. generally accepted
accounting principles and conform to general practices within the banking industry. The more
significant of the principles used in preparing the financial statements are briefly described below:
Cash and Cash Equivalents
For purposes of reporting cash flows, cash and cash equivalents include cash on hand and due from
banks, interest bearing deposits with maturities of less than 90 days and federal funds sold.
Securities
Management determines the appropriate classification of debt securities at the time of purchase and
re-evaluates this classification periodically. Trading account securities are held for resale in
anticipation of short-term market movements. Debt securities are classified as held to maturity
when the Bank has the positive intent and ability to hold the securities to maturity. Securities not
classified as held to maturity or trading are classified as available for sale.
Trading account securities are carried at market value. Gains and losses, both realized and
unrealized, are reflected in earnings. Held to maturity securities are stated at amortized cost.
Available for sale securities are stated at fair value, with unrealized gains and losses, net of tax,
reported in a separate component of other comprehensive income.

11
The amortized cost of debt securities classified as held to maturity or available for sale is adjusted
for amortization of premiums and accretion of discounts to maturity or, in the case of mortgage-
backed securities, over the estimated life of the security. Amortization, accretion and accrued
interest are included in interest income on securities.
Realized gains and losses, and declines in value judged to be other than temporary, are included in
net securities gains and losses. The cost of securities sold is determined based on the specific
identification method.
Declines in the fair value of individual held-to-maturity and available-for-sale securities below
their cost that are other-than-temporary result in write-downs of the individual securities to their
fair value. The written down amount then becomes the security’s new cost basis. The related
write-downs are included in earnings as realized losses. In estimating whether to recognize other-
than-temporary impairment losses on a security, management considers (1) the length of time and
the extent to which the fair value has been less than cost, (2) the financial condition and near-term
prospects of the issuer, and (3) the intent and ability of the Bank to retain its investment in the
issuer for a period of time sufficient to allow for any anticipated recovery in fair value. Current
guidance replaced the "intent and ability" indication in prior guidance by specifying that (a) if
management does not have the intent to sell a debt security prior to recovery and (b) it is more
likely than not that it will not have to sell the debt security prior to recovery, the security would not
be considered other-than-temporarily impaired unless there is a credit loss identified within the
security. When management does not intend to sell the security, and it is more likely than not
management will not have to sell the security before recovery of its cost basis, it will recognize the
credit component of any other-than-temporary impairment of a debt security in earnings and the
remaining portion in other comprehensive income. For held-to-maturity debt securities, the
amount of any other-than-temporary impairment recorded in other comprehensive income for the
noncredit portion of a previous other-than-temporary impairment should be amortized
prospectively over the remaining life of the security on the basis of the timing of future estimated
cash flows of the security.
Mortgage Loans Held for Sale
Mortgage loans originated and intended for sale in the secondary market are carried at the lower of
cost or fair value under fair value option accounting guidance for financial instruments. For these
loans, gains and losses on loan sales are recorded in noninterest income, and direct loan origination
costs and fees are deferred at origination of the loan and are recognized in noninterest income upon
sale of the loan.
Loans
The Bank grants mortgage, commercial and consumer loans to customers. Loans that management
has the intent and ability to hold for the foreseeable future or until maturity or pay-off are reported
at their outstanding unpaid principal balances adjusted for unearned income, the allowance for loan
losses and any unamortized deferred fee or costs on originated loans, and premiums or discounts on
purchased loans. Unearned income relates principally to consumer installment loans. Interest
income on these loans is recognized using the interest method over the life of the loan.

12
When the payment of principal or interest on a loan is delinquent for 90 days, or earlier in some
cases, the loan is placed on non-accrual status, unless the loan is in the process of collection and the
underlying collateral fully supports the carrying value of the loan. Past due status is based on
contractual terms of the loan. In all cases, loans are placed on non-accrual status or charged off at
an earlier date if collection of principal or interest is considered doubtful.
If the decision is made to continue accruing interest on the loan, periodic reviews are made to
confirm the accruing status of the loan. When a loan is placed on a non-accrual basis, interest
accrued during the current year prior to the judgment of uncollectabilty is charged to operations.
Interest accrued during prior periods is charged to allowance for loan losses. Generally, any
payments received on non-accrual loans are applied first to outstanding loan amounts and next to
the recovery of charged-off loan amounts. Any excess is treated as recovery of lost interest.
The Bank considers a loan to be impaired when, based upon current information and events, it
believes it is probable that the Bank will be unable to collect all amounts due according to the
contractual terms of the loan agreement. The Bank’s impaired loans include non-performing
troubled debt restructurings and loans in which full payment of principal or interest is not expected.
The Bank calculates a reserve required for impaired loans based on the present value of expected
future cash flows discounted at the loan’s effective interest rate, or at the loan’s observable market
price or the fair value of its collateral.
Allowance for Loan Losses
The allowance for loan losses is maintained at a level which is considered adequate to reflect
estimated probable credit losses inherent in the loan portfolio that have been incurred as of the
balance sheet date as well as estimated credit losses associated with specifically identified loans.
A formal review of the allowance for loan losses is prepared periodically to assess the risk of loss
in the loan portfolio and to determine the adequacy of the allowance for loan losses. For purposes
of the periodic review, loans are aggregated into pools based on various characteristics. Some of
those characteristics include payment status, concentrations, risk rating, loan to collateral value and
the financial status of borrowers.
The allowance allocated to each of these pools is based on historical charge-off rates, adjusted for
changes in the credit risk characteristics within these pools, as determined from current information
and analyses. Management also ensures that the overall allowance appropriately reflects current
macroeconomic conditions, industry exposure and a margin for the imprecision inherent in most
estimates of expected credit losses.
As a result, such amount is reflected in a portion of the allowance that is included to provide for
probable losses incurred but unidentified within the loan portfolio as of the balance sheet date and
not to provide for possible or future losses beyond the balance sheet date. This portion of the
allowance, which is judgmentally determined, generally serves to compensate for the uncertainty in
estimating loan losses, particularly in times of changing economic conditions, and considers the
possibility of improper risk rating and possible over or under allocation of specific allowances.
The allowance considers trends in delinquencies and non-accrual loans, concentrations, the
volatility of risk ratings and the evolving portfolio mix in terms of collateral, relative loan size and
the degree of seasoning within the various loan products. Changes in underwriting standards,
credit administration and collection policies, regulation and other factors which affect the credit

13
quality and collectability of the loan portfolio also impact this portion of the allowance level. The
allowance also consists of amounts provided for each loan that is reviewed for impairment or for
which a probable loss has been identified.
The allowance related to loans that are identified as impaired is based on discounted expected
future cash flows (using the loan’s initial effective interest rate), the observable market value of the
loan or the estimated fair value of the collateral for certain collateral dependent loans. Factors
contributing to the determination of specific allowances include the financial condition of the
borrower, changes in the value of pledged collateral and general economic conditions.
The allowance for loan losses is based on management’s estimate of probable credit losses inherent
in the loan portfolio and represents an estimate in the financial statements. As such, the actual
level of allowance required could vary from the amount estimated by management at the balance
sheet date and actual credit losses could vary from the current estimate. As adjustments to the
allowance for loan losses become necessary, they are reflected as a provision for loan losses in
current-period earnings. Actual loan charge-offs are deducted from and subsequent recoveries of
previously charged-off loans are added to the allowance.
Impaired Loans
A loan is considered impaired, in accordance with the impairment accounting guidance of FASB
ASC 310-10-35-16, Receivables, when based on current information and events, it is probable that
the Bank will be unable to collect the scheduled payments of principal and interest when due
according to the contractual terms of the loan agreement. Factors considered by management in
determining impairment include payment status, collateral value, and the probability of collecting
scheduled principal and interest payments when due. Loans that experience insignificant payment
delays and payment shortfalls generally are not classified as impaired. Management determines the
significance of payment delays and payment shortfalls on a case-by-case basis, taking into
consideration all of the circumstances surrounding the loan and the borrower, including the length
of delay, the reasons for the delay, the borrower's prior payment record, and the amount of shortfall
in relation to the principal and interest owed. Impairment is measured on a loan by loan basis by
either the present value of expected cash flows discounted at the loan's effective interest rate, the
loan's obtainable market price, or the fair value of the collateral if the loan is collateral dependent.
When the measure of the impaired loan is less than the recorded investment in the loan, the
impairment is recorded through a valuation allowance. This valuation allowance is recorded in the
allowance for loan losses on the balance sheet.
Interest payments received on impaired loans are recorded as interest income unless collection of
the remaining recorded investment is doubtful, at which time payments received are recorded as
reductions of principal. Changes in the present value due to the passage of time are recorded as
interest income, while changes in estimated cash flows are recorded in the provision for loan
losses.
Bank Premises and Equipment
Bank premises and equipment are carried at cost less accumulated depreciation and amortization.
Depreciation expense is computed using the straight-line method for bank premises and leaseholds
over estimated useful lives of those assets of 39 years and the straight-line method for equipment,
furniture and fixtures over their estimated useful lives ranging from 3 to 7 years.

14
Foreclosed Assets
Properties acquired through foreclosure or deed taken in lieu of foreclosure are recorded at fair
value at the time of foreclosure, net of disposal costs. Write-downs from cost to fair value at the
time of foreclosure are charged to the allowance for loan losses. Subsequent write-downs and
gains and losses recognized on the sales of such properties are included in the statements of
income. Determinations of fair value are based on periodic appraisals, which are subject to
significant fluctuations as economic conditions change.
Other Investments
Investments in entities such as a partnership or a limited liability company are accounted for under
the cost method in which the original investment is recorded at its historical cost.
Income Taxes
The Bank accounts for income taxes in accordance with income tax guidance of FASB ASC 740,
Income Taxes, and has adopted the recent accounting guidance related to accounting for
uncertainty in income taxes, which sets forth a consistent framework to determine the appropriate
level of tax reserves to maintain for uncertain tax positions.
The income tax guidance results in two components of income tax expense: current and deferred.
Current income tax expense reflects taxes to be paid or refunded for the current period by applying
the provisions of enacted tax law to the taxable income or excess deductions over revenues. The
Bank determines deferred income taxes using the liability (or balance sheet) method. Under this
method, the net deferred tax asset or liability is based on the tax effects of the difference between
the book and tax bases of assets and liabilities. Enacted changes in tax rates and laws are
recognized in the period in which they occur.
Deferred income tax expense results from changes in deferred tax assets and liabilities between
periods. Deferred tax assets are recognized if it is more likely than not, based on the technical
merits, that the tax position will be realized or sustained upon examination. The term more likely
than not means a likelihood of more than 50 percent; the terms examined and upon examination
also include resolution of the related appeals or litigation processes, if any. A tax position that
meets the more likely than not recognition threshold is initially and subsequently measured as the
largest amount of tax benefit that has a greater than 50 percent likelihood of being realized upon
settlement with a taxing authority that has full knowledge of all relevant information. The
determination of whether or not a tax position has met the more likely than not recognition
threshold considers the facts, circumstances, and information available at the reporting date and is
subject to management's judgment. Deferred tax assets are reduced by a valuation allowance if,
based on the weight of evidence available, it is more likely than not that some portion or all of a
deferred tax asset will not be realized.
The Bank evaluates all significant tax positions as required by accounting principles generally
accepted in the United States of America. As of December 31, 2018 and 2017, the Bank does not
believe that it has taken any positions that would require the recording of any additional tax
liability nor does it believe that there are any unrealized tax benefits that would either increase or
decrease within the next year.

15
The Bank files income tax returns in the U.S. federal jurisdiction. With few exceptions, the Bank
is no longer subject to federal tax examinations by the federal tax authorities for years before 2015.
The Bank recognizes interest and penalties on income taxes, if incurred, as a component of income
tax expense.
The Bank is not currently subject to state or local income taxes. The Bank is subject to the
Louisiana Shares Tax which is an ad valorem tax imposed on the assessed value of the Bank’s
stock.
Comprehensive Income
The Bank reports comprehensive income in accordance with the accounting guidance related to
FASB ASC 220, Comprehensive Income. Comprehensive income consists of net income and other
comprehensive income. Other comprehensive income includes net unrealized gains and (losses) on
securities and net unrecognized pension plan gains and (losses) and is presented in the statements
of stockholders’ equity and comprehensive income. FASB ASC 220 requires only additional
disclosures in the financial statements and does not affect the Bank’s financial position or results of
operations.
Statement of Cash Flows
The statement of cash flows was prepared in accordance with the accounting guidance of FASB
ASC 230, Statement of Cash Flows, which permits certain financial institutions to report, in a
statement of cash flows, net receipts and payments for deposits placed, time deposits accepted and
repaid and loans made and collected.
Fair Value of Financial Instruments
Fair values of financial instruments are estimated using relevant market information and other
assumptions. Fair value estimates involve uncertainties and matters of significant judgment.
Changes in assumptions or in market conditions could significantly affect the estimate.
Advertising
The Bank follows the policy of charging the costs of advertising to expense as incurred.
Advertising expense was $325,249 and $369,859 for the years ended December 31, 2018 and 2017,
respectively, and is included in other operating expenses.
Recent Accounting Pronouncements
The FASB issued ASU 2014-09, Revenue from Contracts with Customers (Topic 606). This
ASU implements a common revenue standard and clarifies the principles used for recognizing
revenue . The amendments of the ASU clarify that an entity should recognize revenue to depict the
transfer of promised goods or services to customers in an amount that reflects the consideration to
which the entity expects to be entitled to in exchange for those goods or services. This
guidance does not apply to revenue associated with financial instruments, including loans and
securities that are accounted for under other GAAP, which comprises a significant portion of the
Company's revenue stream. The ASU was effective on January 1, 2018. The Company did not
identify any material changes to the timing of revenue recognition.
16
The FASB issued Accounting Standards Update (“ASU”) 2016-01, Financial Instruments -
Overall (Subtopic 825-10), Recognition and Measurement of Financial Assets and Financial
Liabilities. This ASU require equity investments to be measured at fair value with changes in fair
value recognized in net income. However, an entity may choose to measure equity investments that
do not have readily determinable fair values at cost minus impairment. This ASU also simplifies
the impairment assessment of equity investments without readily determinable fair values by
requiring a qualitative assessment to identify impairment. It also eliminates the requirement to
disclose the fair value of financial instruments measured at amortized cost for entities that are not
public business entities, and eliminates the requirement for public business entities to disclose the
methods and significant assumptions used to estimate the fair value for financial instruments
measured at amortized cost on the balance sheet. ASU No. 2016-16 requires public business
entities to use the exit price notion when measuring the fair value of financial instruments for
disclosure purposes. It also requires an entity to present separately in other comprehensive income
the portion of the total change in the fair value of a liability resulting from a change in the
instrument-specific credit risk when the entity has elected to measure the liability at fair value in
accordance with the fair value option for financial instruments. This ASU requires separate
presentation of financial assets and financial liabilities by category and form on the balance sheet
or the accompanying notes to the financial statements. In addition, this ASU clarifies that an entity
should evaluate the need for a valuation allowance on a deferred tax asset related to available-for-
sale securities in combination with the entity’s other deferred tax assets. For public business
entities, the amendments in the update are effective for fiscal years beginning after December 15,
2017, including interim periods. The adoption of this ASU did not have a material impact on the
Company’s consolidated financial statements at December 31, 2018.
In February 2016, the FASB issued ASU 2016-02, Leases (Topic 842), Conforming Amendments
Related to Leases. This ASU amends the codification regarding leases in order to increase
transparency and comparability. The ASU requires companies to recognize leased assets and
liabilities on the statement of condition and disclose key information about leasing arrangements.
A lessee would recognize a liability to make lease payments and a right-of-use asset representing
its right to use the leased asset for the lease term. The ASU is effective for the Company on
January 1, 2019.
In June 2016, the FASB issued ASU 2016-13, Financial Instruments - Credit Losses (Topic 326).
ASU 2016-13, requires an entity to utilize a new impairment model known as the current
expected credit loss (CECL) model to estimate its lifetime "expected credit loss" and record an
allowance that, when deducted from the amortized cost basis of the financial asset, presents the
net amount expected to be collected on the financial asset. The CECL model is expected to
result in more timely recognition of credit losses. ASU 2016-13 also requires new disclosures for
financial assets measured at amortized cost, loans and available-for-sale debt securities. Entities
will apply the standard's provisions as a cumulative effect adjustment to retained earnings as of
the beginning of the first reporting period in which the guidance is adopted. ASU 2016-13 will
be effective for the Company on January 1, 2020. The Company has begun evaluating the impact
the adoption of ASU 2016-13 will have on its consolidated financial statements and disclosures.

17
Subsequent Events
Management has evaluated subsequent events and transactions for any potential recognition or
disclosure in the financial statements through March 22, 2019 the date which the financial
statements were available to be issued.
Reclassifications
Certain amounts in the 2017 financial statements have been reclassified to conform to the
presentation in the current year financial statements. Such reclassifications had no effect on
previously reported net income.
Note 2 - Investment Securities -
At December 31, 2018 and 2017 the Company had no securities classified as trading or held to
maturity.
A summary of investment securities classified as available for sale is presented below.
December 31, 2018
Gross Gross
Amortized Unrealized Unrealized Fair
Cost Gains (Losses) Value
Available for Sale:
U.S. Treasury Securities
and Obligations of U.S.
Government Agencies $ 16,500,481 -$ $ (122,453) $ 16,378,028
Mortgage Backed Securities 17,635,144 15,202 (171,150) 17,479,196
Securities Issued by States
and Political Subdivisions
in the U. S. 14,295,809 3,291 (337,582) 13,961,518
$ 48,431,434 $ 18,493 $ (631,185) $ 47,818,742
18
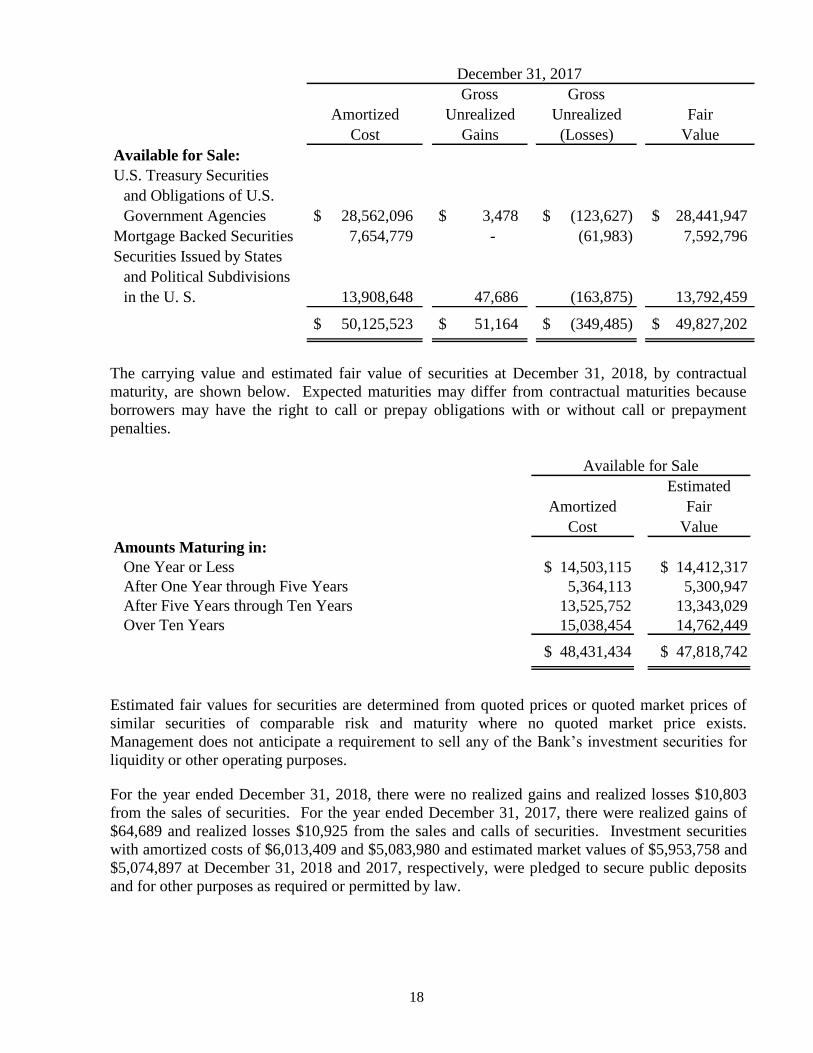
December 31, 2017
Gross Gross
Amortized Unrealized Unrealized Fair
Cost Gains (Losses) Value
Available for Sale:
U.S. Treasury Securities
and Obligations of U.S.
Government Agencies $ 28,562,096 $ 3,478 $ (123,627) $ 28,441,947
Mortgage Backed Securities 7,654,779 - (61,983) 7,592,796
Securities Issued by States
and Political Subdivisions
in the U. S. 13,908,648 47,686 (163,875) 13,792,459
$ 50,125,523 $ 51,164 $ (349,485) $ 49,827,202
The carrying value and estimated fair value of securities at December 31, 2018, by contractual
maturity, are shown below. Expected maturities may differ from contractual maturities because
borrowers may have the right to call or prepay obligations with or without call or prepayment
penalties.
Estimated
Amortized Fair
Cost Value
Amounts Maturing in:
One Year or Less $ 14,503,115 $ 14,412,317
After One Year through Five Years 5,364,113 5,300,947
After Five Years through Ten Years 13,525,752 13,343,029
Over Ten Years 15,038,454 14,762,449
$ 48,431,434 $ 47,818,742
Available for Sale
Estimated fair values for securities are determined from quoted prices or quoted market prices of
similar securities of comparable risk and maturity where no quoted market price exists.
Management does not anticipate a requirement to sell any of the Bank’s investment securities for
liquidity or other operating purposes.
For the year ended December 31, 2018, there were no realized gains and realized losses $10,803
from the sales of securities. For the year ended December 31, 2017, there were realized gains of
$64,689 and realized losses $10,925 from the sales and calls of securities. Investment securities
with amortized costs of $6,013,409 and $5,083,980 and estimated market values of $5,953,758 and
$5,074,897 at December 31, 2018 and 2017, respectively, were pledged to secure public deposits
and for other purposes as required or permitted by law.

19
Fair values of investment securities measured on a recurring basis at December 31, 2018 and 2017
are as follows:
Fair
Quoted Prices
in Active
Markets or
Identical
Assets
Significant
Other
Observable
Inputs
Significant
Unobservable
Inputs
December 31, 2018 Value (Level 1) (Level 2) (Level 3)
Available for Sale:
U.S. Treasury Securities and
Obligations of U.S.
Government Agencies $ 16,378,028 $ - $ 16,378,028 -$
Mortgage Backed Securities 17,479,196 - 17,479,196 -
Securities Issued by States
and Political Subdivisions
in the U. S. 13,961,518 - 13,961,518 -
$ 47,818,742 $ - $ 47,818,742 -$
Fair
Quoted Prices
in Active
Markets or
Identical
Assets
Significant
Other
Observable
Inputs
Significant
Unobservable
Inputs
December 31, 2017 Value (Level 1) (Level 2) (Level 3)
Available for Sale:
U.S. Treasury Securities and
Obligations of U.S.
Government Agencies $ 28,441,947 $ - $ 28,441,947 -$
Mortgage Backed Securities 7,592,796 - 7,592,796 -
Securities Issued by States
and Political Subdivisions
in the U. S. 13,792,459 - 13,792,459 -
$ 49,827,202 $ - $ 49,827,202 -$
Fair Value at Reporting Date Using
Fair Value at Reporting Date Using

20
Gross unrealized losses in investment securities at December 31, 2018 and 2017 existing for
continuous periods of less than 12 months and for continuous periods of 12 months or more are
required financial statement disclosures and are as follows:
Security Description Fair Value
Unrealized
(Losses) Fair Value
Unrealized
(Losses) Fair Value
Unrealized
(Losses)
Available for Sale:
U.S. Treasury
Securities and
Obligations of U.S.
Government Agencies $ 7,819,005 $ (44,610) $ 7,950,022 $ (77,843) $ 15,769,027 $ (122,453)
Mortgage Backed Securities 6,992,139 (38,668) 6,025,311 (132,482) 13,017,450 (171,150)
Securities Issued
by States and Political
Subdivisions in the U. S. 2,454,232 (18,280) 10,462,037 (319,302) 12,916,269 (337,582)
Totals $17,265,376 $ (101,558) $ 24,437,370 $ (529,627) $ 41,702,746 $ (631,185)
Security Description Fair Value
Unrealized
(Losses) Fair Value
Unrealized
(Losses) Fair Value
Unrealized
(Losses)
Available for Sale:
U.S. Treasury
Securities and
Obligations of U.S.
Government Agencies $18,450,837 $ (57,219) $ 5,914,834 $ (66,409) $ 24,365,671 $ (123,627)
Mortgage Backed Securities 7,592,796 (61,983) - - 7,592,796 (61,983)
Securities Issued
by States and Political
Subdivisions in the U. S. 6,726,146 (24,395) 3,470,582 (139,479) 10,196,728 (163,875)
Totals $32,769,779 $ (143,597) $ 9,385,416 $ (205,888) $ 42,155,195 $ (349,485)
December 31, 2018
December 31, 2017
Less Than 12 Months 12 Months or More Totals
Less Than 12 Months 12 Months or More Totals
Management evaluates securities for other-than-temporary impairment on a periodic and regular
basis, as well as when economic or market concerns warrant such evaluation. Consideration is
given to (1) the length of time and the extent to which the fair value has been less than cost, (2) the
financial condition and near-term prospects of the issuer, and (3) the intent and ability of the Bank
to retain its investment in the issuer for a period of time sufficient to allow for any anticipated
recovery in fair value.
At December 31, 2018 and 2017, these unrealized losses related principally to current interest rates
for similar types of securities. In analyzing an issuer’s financial condition, management considers
whether the securities are issued by the federal government or its agencies, whether downgrades by
bond rating agencies have occurred, and the results of reviews of the issuer’s financial condition.
As the Bank has the ability to hold debt securities until maturity, or for the foreseeable future if
classified as available-for-sale, no declines are deemed to be other-than-temporary.

21
Note 3 - Loans -
The loan portfolio consists of loans classified by major types at December 31, 2018 and 2017 as
follows (in thousands):
2018 2017
Real Estate Loans:
Residential 160,858$ 154,198$
Non-Residential 109,617 110,115
Commercial Loans 19,182 15,118
Consumer and Credit Cards 5,677 7,246
Construction and Land Development 17,771 25,082
313,105 311,759
Allowance for Loan Losses (2,588) (2,542)
310,517$ 309,217$
Loans held for sale in the amount of $-0- and $208,745 at December 31, 2018 and 2017, respectively,
are included in the above table.
The Bank has entered into transactions with certain directors, executive officers, significant
stockholders and their affiliates. Such transactions were made in the ordinary course of business
on substantially the same terms and conditions, including interest rates and collateral, as those
prevailing at the same time for comparable transactions with other customers and did not, in the
opinion of management, involve more than normal credit risk or present other unfavorable features.
An analysis of the aggregate of these loans at December 31, 2018 and 2017 is as follows:
2018 2017
Balance, January 1 $ 4,649,465 $ 4,072,175
Advances - 984,821
Payments (385,053) (407,531)
Balance, December 31 $ 4,264,412 $ 4,649,465
Management segregates the loan portfolio into portfolio segments which is defined as the level at
which the Bank develops and documents a systematic method for determining its allowance for
loan losses. The portfolio segments are segregated based on loan types and the underlying risk
factors present in each loan type. Such risk factors are periodically reviewed by management and
revised as deemed appropriate. The following tables set forth, as of December 31, 2018 and 2017,
the balance of the allowance for loan losses by portfolio segment, disaggregated by impairment
methodology, which is then further segregated by amounts evaluated for impairment collectively
and individually. The allowance for loan losses allocated to each portfolio segment is not
necessarily indicative of future losses in any particular portfolio segment and does not restrict the
use of the allowance to absorb losses in other portfolio segments.

22
Allowance for Loan Losses and Recorded Investment in Loans Receivable for the year ended
December 31, 2018 and 2017 (in thousands):
Real Estate- Construction
Real Estate- Non Consumer & & Land
2018 Residential Residential Commercial Credit Card Development Total
Allowance for Loan
Losses:
Beginning Balance 1,259$ 897$ 123$ 59$ 204$ 2,542$
Charge-Offs (7) - (168) (263) - (438)
Recoveries - - - 129 - 129
Provision 78 9 204 122 (58) 355
Ending Balance 1,330$ 906$ 159$ 47$ 146$ 2,588$
Ending Balance of
Allowance for Loan
Losses Allocated to:
Loans Individually
Evaluated for
Impairment -$ -$ -$ -$ -$ -$
Loans Collectively
Evaluated for Impairment 1,330$ 906$ 159$ 47$ 146$ 2,588$
Loans Receivable:
Total Loans Receivable 160,858$ 109,617$ 19,182$ 5,677$ 17,771$ 313,105$
Loans Individually
Evaluated forImpairment 181$ -$ -$ -$ -$ 181$
Loans Collectively
Evaluated forImpairment 160,677$ 109,617$ 19,182$ 5,677$ 17,771$ 312,924$
23
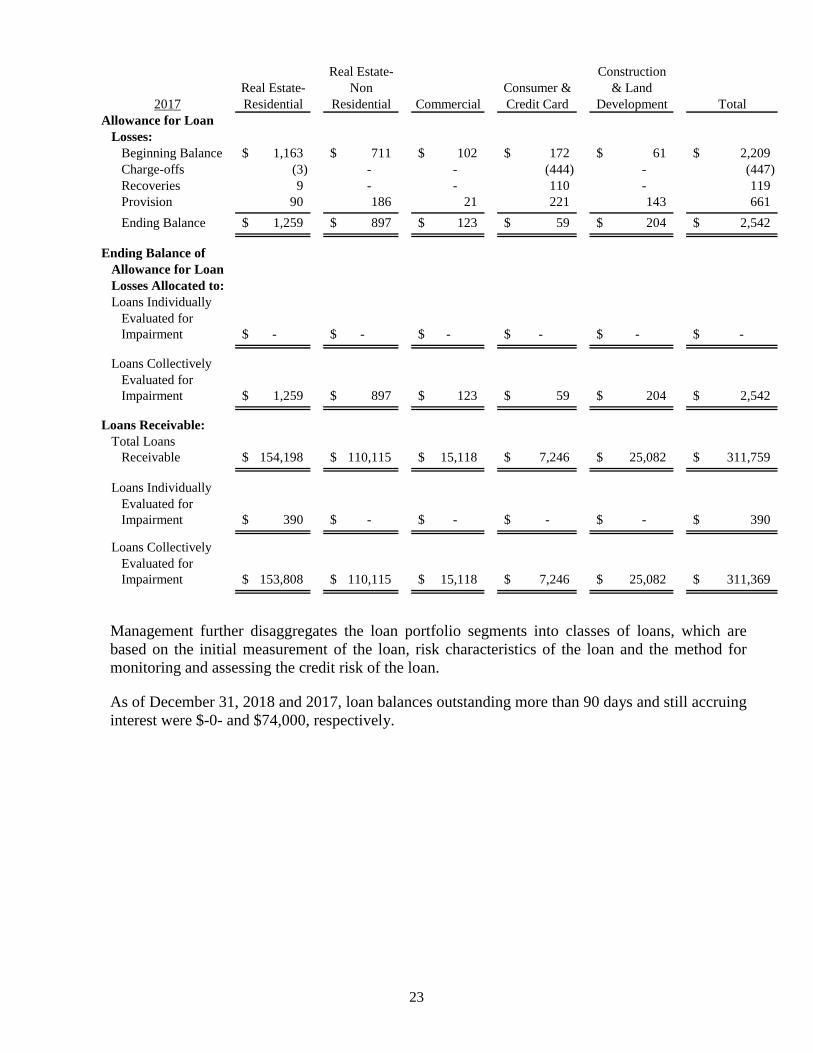
Real Estate- Construction
Real Estate- Non Consumer & & Land
2017 Residential Residential Commercial Credit Card Development Total
Allowance for Loan
Losses:
Beginning Balance 1,163$ 711$ 102$ 172$ 61$ 2,209$
Charge-offs (3) - - (444) - (447)
Recoveries 9 - - 110 - 119
Provision 90 186 21 221 143 661
Ending Balance 1,259$ 897$ 123$ 59$ 204$ 2,542$
Ending Balance of
Allowance for Loan
Losses Allocated to:
Loans Individually
Evaluated for
Impairment -$ -$ -$ -$ -$ -$
Loans Collectively
Evaluated for
Impairment 1,259$ 897$ 123$ 59$ 204$ 2,542$
Loans Receivable:
Total Loans
Receivable 154,198$ 110,115$ 15,118$ 7,246$ 25,082$ 311,759$
Loans Individually
Evaluated for
Impairment 390$ -$ -$ -$ -$ 390$
Loans Collectively
Evaluated for
Impairment 153,808$ 110,115$ 15,118$ 7,246$ 25,082$ 311,369$
Management further disaggregates the loan portfolio segments into classes of loans, which are
based on the initial measurement of the loan, risk characteristics of the loan and the method for
monitoring and assessing the credit risk of the loan.
As of December 31, 2018 and 2017, loan balances outstanding more than 90 days and still accruing
interest were $-0- and $74,000, respectively.
24
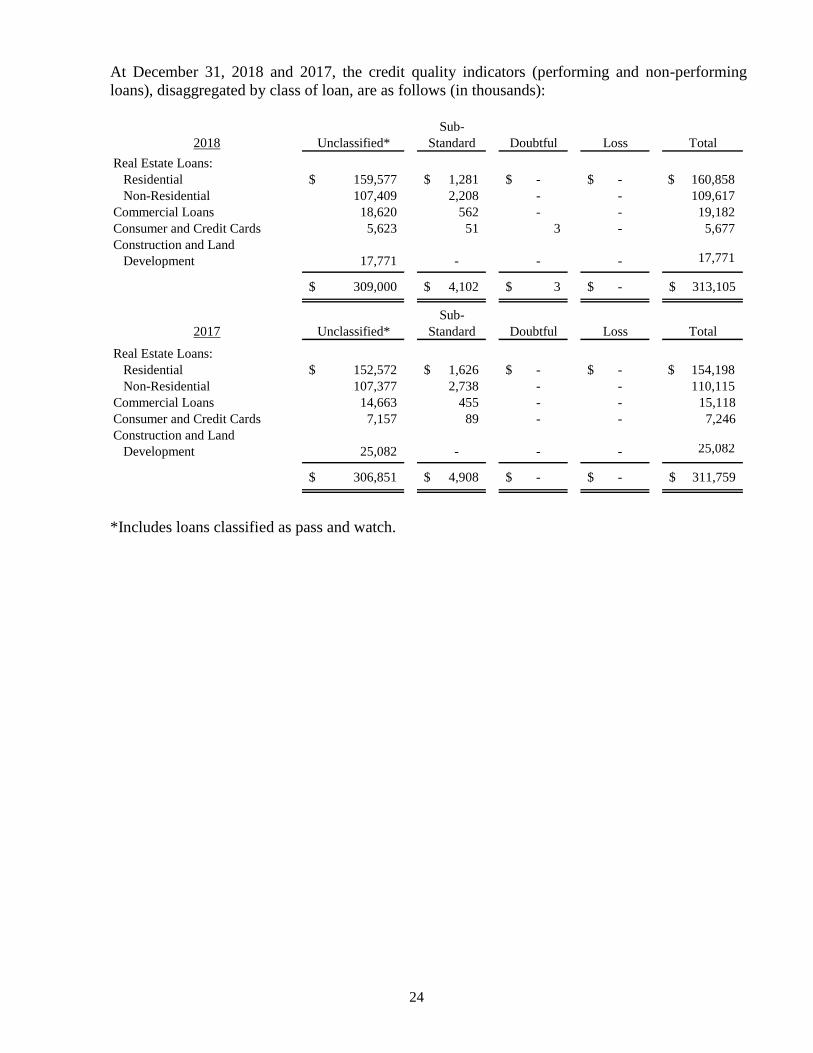
At December 31, 2018 and 2017, the credit quality indicators (performing and non-performing
loans), disaggregated by class of loan, are as follows (in thousands):
Sub-
2018 Unclassified* Standard Doubtful Loss Total
Real Estate Loans:
Residential 159,577$ 1,281$ -$ -$ $ 160,858
Non-Residential 107,409 2,208 - - 109,617
Commercial Loans 18,620 562 - - 19,182
Consumer and Credit Cards 5,623 51 3 - 5,677
Construction and Land
Development 17,771 - - - 17,771
309,000$ 4,102$ 3$ -$ 313,105$
Sub-
2017 Unclassified* Standard Doubtful Loss Total
Real Estate Loans:
Residential 152,572$ 1,626$ -$ -$ $ 154,198
Non-Residential 107,377 2,738 - - 110,115
Commercial Loans 14,663 455 - - 15,118
Consumer and Credit Cards 7,157 89 - - 7,246
Construction and Land
Development 25,082 - - - 25,082
306,851$ 4,908$ -$ -$ 311,759$
*Includes loans classified as pass and watch.
25
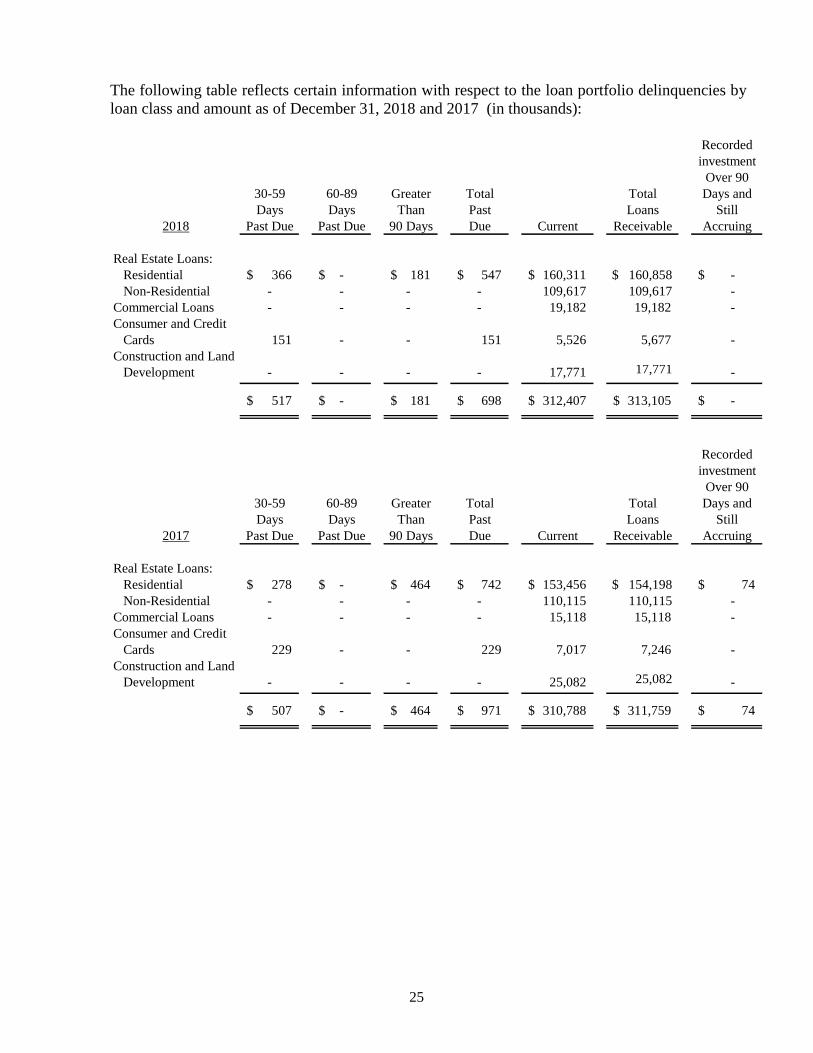
The following table reflects certain information with respect to the loan portfolio delinquencies by
loan class and amount as of December 31, 2018 and 2017 (in thousands):
Recorded
investment
Over 90
30-59 60-89 Greater Total Total Days and
Days Days Than Past Loans Still
2018 Past Due Past Due 90 Days Due Current Receivable Accruing
Real Estate Loans:
Residential 366$ -$ 181$ 547$ 160,311$ $ 160,858 -$
Non-Residential - - - - 109,617 109,617 -
Commercial Loans - - - - 19,182 19,182 -
Consumer and Credit
Cards 151 - - 151 5,526 5,677 -
Construction and Land
Development - - - - 17,771 17,771 -
517$ -$ 181$ 698$ 312,407$ 313,105$ -$
Recorded
investment
Over 90
30-59 60-89 Greater Total Total Days and
Days Days Than Past Loans Still
2017 Past Due Past Due 90 Days Due Current Receivable Accruing
Real Estate Loans:
Residential 278$ -$ 464$ 742$ 153,456$ $ 154,198 74$
Non-Residential - - - - 110,115 110,115 -
Commercial Loans - - - - 15,118 15,118 -
Consumer and Credit
Cards 229 - - 229 7,017 7,246 -
Construction and Land
Development - - - - 25,082 25,082 -
507$ -$ 464$ 971$ 310,788$ 311,759$ 74$

26
All impaired loans by class of loans as of December 31, 2018 and 2017 are as follows (in
thousands):
Unpaid Average Interest
Recorded Principal Recorded Recorded Income
2018 Investment Balance Allowance Investment Recognized
Impaired Loans with no Related
Allowance Recorded:
Real Estate Loans:
Residential 181$ $ 181$ $ -$ $ 286$ $ -$
Non-Residential - - - - -
Commercial Loans - - - - -
Construction and Land Development - - - - -
Consumer and Credit Cards - - - - -
181$ 181$ -$ 286$ -$
With an Allowance Recorded:
Real Estate Loans:
Residential -$ -$ -$ -$ -$
Non-Residential - - - - -
Commercial Loans - - - - -
Construction and Land Development - - - - -
Consumer and Credit Cards - - - - -
-$ -$ -$ -$ -$
Total Impaired Loans:
Real Estate Loans:
Residential 181$ 181$ -$ 286$ -$
Non-Residential - - - - -
Commercial Loans - - - - -
Construction and Land Development - - - - -
Consumer and Credit Cards - - - - -
181$ 181$ -$ 286$ -$

27
Unpaid Average Interest
Recorded Principal Recorded Recorded Income
2017 Investment Balance Allowance Investment Recognized
Impaired Loans with no Related
Allowance Recorded:
Real Estate Loans:
Residential 390$ $ 390$ $ -$ $ 367$ $ -$
Non-Residential - - - - -
Commercial Loans - - - - -
Construction and Land Development - - - - -
Consumer and Credit Cards - - - - -
390$ 390$ -$ 367$ -$
With an Allowance Recorded:
Real Estate Loans:
Residential -$ -$ -$ 9$ -$
Non-Residential - - - - -
Commercial Loans - - - - -
Construction and Land Development - - - - -
Consumer and Credit Cards - - - - -
-$ -$ -$ 9$ -$
Total Impaired Loans:
Real Estate Loans:
Residential 390$ 390$ -$ 376$ -$
Non-Residential - - - - -
Commercial Loans - - - - -
Construction and Land Development - - - - -
Consumer and Credit Cards - - - - -
390$ 390$ -$ 376$ -$
The fair value of impaired loans is measured at the fair value of the collateral for collateral-dependent
loans. Impaired loans are level 2 assets measured on a non-recurring basis using appraisals from
external parties of the collateral less any prior liens. In addition, repossessed assets are initially
recorded at fair value less estimated costs to sell. The fair value of repossessed assets is based on
property appraisals and an analysis of similar properties available. As such, repossessed assets are
also level 2 assets measured on a nonrecurring basis.

28
Loans receivable on non-accrual status (which are those past due greater than 90 days) by loan class
at December 31, 2018 and 2017 are as follows (in thousands):
2018
Real Estate Loans:
Residential 181$
Non-Residential -
Commercial Loans -
Construction and Land Development -
Consumer and Credit Cards -
181$
2017
Real Estate Loans:
Residential 390$
Non-Residential -
Commercial Loans -
Construction and Land Development -
Consumer and Credit Cards -
390$
The following tables summarize information relative to loan modifications determined to be
Troubled Debt Restructurings as of December 31, 2018 and 2017 (dollars in thousands). At
December 31, 2018 and 2017, four of the troubled debt restructurings defaulted subsequent to the
restructuring through the date the financial statements were available to be issued.
Pre-Modification Post-Modification
Number Outstanding Outstanding
of Recorded Recorded
Contracts Investments Investments
2018
Real Estate Loans:
Residential 4 372$ 312$
Non-Residential - - -
Commercial Loans - - -
Construction and Land Development - - -
Consumer and Credit Cards - - -
4 372$ 312$

29
Pre-Modification Post-Modification
Number Outstanding Outstanding
of Recorded Recorded
Contracts Investments Investments
2017
Real Estate Loans:
Residential 4 372$ 318$
Non-Residential - - -
Commercial Loans - - -
Construction and Land Development - - -
Consumer and Credit Cards - - -
Totals 4 372$ 318$
The following provides information about the Bank’s non-performing assets at December 31, 2018
and 2017 (dollars in thousands):
2018 2017
Non-Accrual Loans 181$ 390$
Loans Past Due 90 or More Days and Still Accruing Interest - 74
Total Non-Performing Loans 181 464
Foreclosed Real Estate - -
Total Non-Performing Assets 181$ 464$
Allowance for Loan Losses 2,588$ 2,542$
Non-Performing Loans to Year-End Loans,
Excluding Loans Held for Sale 0.06% 0.15%
Allowance for Loan Losses to Year-End Loans,
Excluding Loans Held for Sale 0.83% 0.82%
Non-Performing Assets as a Percentage of:
Loans and Foreclosed Real Estate 0.06% 0.15%
Total Assets 0.05% 0.12%
Ratio of Allowance for Loan Losses to Non-Performing Loans 1429.83% 547.84%

30
Note 4 - Bank Premises and Equipment –
Bank premises and equipment at December 31, 2018 and 2017 are summarized below:
2018 2017
Land 2,257,203$ 2,272,424$
Buildings 8,285,616 8,270,395
Leasehold Improvements 3,378,691 3,345,633
Furniture, Fixtures and Equipment 6,960,767 6,733,422
20,882,277 20,621,874
Less: Accumulated Depreciation (10,426,184) (9,702,588)
10,456,093$ 10,919,286$
Depreciation and amortization amounted to $723,595 and $839,098 in 2018 and 2017, respectively.
Note 5 - Investments in Membership Stocks -
The Bank maintains investments in membership stocks of First National Bankers' Bank (FNBB)
and the Federal Home Loan Bank (FHLB) of Dallas. The carrying amounts of these investments
are stated at cost.
Note 6 - Other Investment -
The Bank has invested in Community Financial Insurance Center, L.L.C., a limited liability
company organized to engage in the insurance agency business, including the acquisition of
existing insurance agencies and such other related activities, but only to the extent such activities
are permissible for banks, either directly or through their affiliates. The Bank's initial investment
of $400,000 amounted to approximately 2.5% of the limited liability company's contributed capital
at inception. The Bank accounts for its investment in the company by the cost method. The
carrying amount of the investment approximates the Bank's investment in the amount of underlying
equity in the company's net assets.
The Bank has committed to invest $500,000 into Route 2 Capital Partners, a Small Business
Investment Company (“SBIC”). SBIC’s are privately owned and managed investments funds that
are licensed and regulated by the Small Business Administration (“SBA”), to make investment in
qualifying small business, as defined by SBA regulations. At December 31, 2018, the Bank had
invested $75,000 into this SBIC.

31
Note 7 - Deposits -
Deposit account balances at December 31, 2018 and 2017 are summarized as follows:
2018 2017
Non-Interest Bearing Demand 105,443,675$ 107,522,917$
Interest Bearing Demand 82,155,292 75,163,925
Savings 120,361,780 119,421,155
Certificates of Deposit 38,213,221 32,822,134
346,173,968$ 334,930,131$
The aggregate amount of certificates of deposit with denominations in excess of $250,000 was
approximately $5,280,000 and $3,336,000 at December 31, 2018 and 2017, respectively. The Bank
has no brokered deposits and there are no major concentrations of deposits.
Maturity data for all certificates of deposit as of December 31, 2018 is presented as follows (in
thousands):
Three Months or Less 6,523$
Over Three Months Through Twelve Months 8,717
Over One Year Through Three Years 19,391
Over Three Years 3,582
38,213$
Note 8 - Line of Credit -
The Bank has an available line of credit with the FHLB with a borrowing capacity at December 31,
2018 of approximately $139,000,000 which is secured by a blanket lien on the Bank’s mortgage
loans. The outstanding balance of those borrowings from the FHLB at December 31, 2018 and
2017 was $-0- and $15,000,000, respectively.
At December 31, 2018 and 2017, the amount of FHLB stock required to be owned by the bank was
$155,800 and $766,500, respectively. At December 31, 2018 and 2017, the bank owns $857,000
and $993,600, respectively of FHLB stock.
The Bank has an unsecured $14,000,000 federal funds line of credit with First National Banker’s
Bank. This line of credit expires June 30, 2019 and has a variable interest rate based on the
prevailing federal funds rate. This line of credit was unfunded at December 31, 2018. The previous
line of credit was unfunded at December 31, 2017.
The Company has a $5,000,000 line of credit with First National Banker’s Bank. This line of credit
expires September 28, 2019 and has a variable interest rate based on the prevailing prime rate. This
line of credit is secured by a pledge of and a first and prior security interest in the common stock of
the Bank. This line of credit is subject to certain affirmative covenants, which the Company was in
compliance with at December 31, 2018. This line of credit was unfunded at December 31, 2018.

32
Note 9 - Income Taxes -
The Tax Cut and Jobs Act (the "Tax Act") enacted in December 2017 reduced the federal corporate
income tax rate from 34% to 21% effective January 1, 2018. As a result of the Tax Act, the Bank
recorded a reduction of the net deferred tax liability, which lowered income tax expense during 2017.
The provision (credit) for income taxes for the years ended December 31, 2018 and 2017 consists
of the following:
2018 2017
Current $ 913,885 $ 982,379
Deferred 42,695 (369,830)
$ 956,580 $ 612,549
The provision for federal income taxes differs from that computed by applying federal statutory
rates to income before federal income tax expense, as indicated in the following analysis:
2018 2017
Federal Statutory Income Tax -
21% for 2018 and 34% for 2017 923,985$ 1,039,882$
Nontaxable Income (51,967) (95,620)
Nondeductible Expenses 7,405 10,578
Reclassification due to Tax Cuts
and Jobs Act - (338,074)
Other 77,157 (4,217)
956,580$ 612,549$
Deferred income taxes reflect the net tax effects of temporary differences between the carrying
amounts of assets and liabilities for financial reporting purposes and the amounts used for income tax
purposes. Deferred tax assets and liabilities were computed using currently enacted corporate tax
rates of 21% at December 31, 2018 and 2017. Significant components of the Bank’s deferred tax
assets and liabilities as of December 31, 2018 and 2017 are as follows:
33
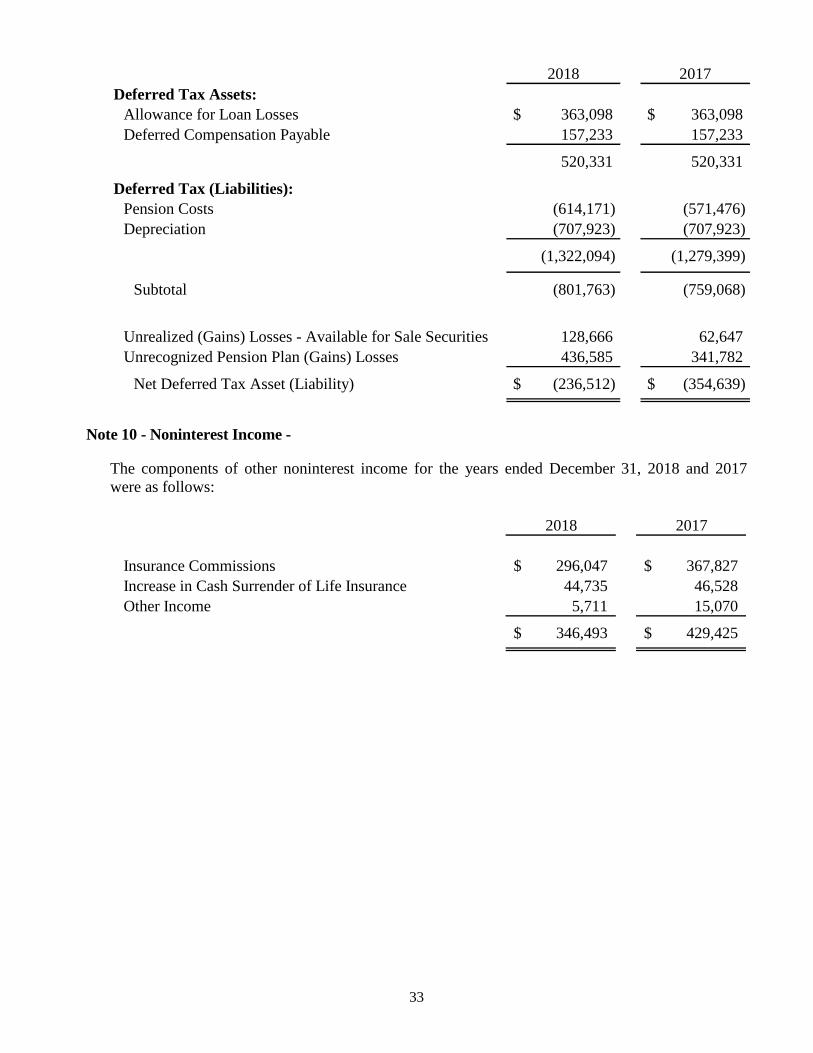
2018 2017
Deferred Tax Assets:
Allowance for Loan Losses $ 363,098 $ 363,098
Deferred Compensation Payable 157,233 157,233
520,331 520,331
Deferred Tax (Liabilities):
Pension Costs (614,171) (571,476)
Depreciation (707,923) (707,923)
(1,322,094) (1,279,399)
Subtotal (801,763) (759,068)
Unrealized (Gains) Losses - Available for Sale Securities 128,666 62,647
Unrecognized Pension Plan (Gains) Losses 436,585 341,782
Net Deferred Tax Asset (Liability) $ (236,512) $ (354,639)
Note 10 - Noninterest Income -
The components of other noninterest income for the years ended December 31, 2018 and 2017
were as follows:
2018 2017
Insurance Commissions 296,047$ 367,827$
Increase in Cash Surrender of Life Insurance 44,735 46,528
Other Income 5,711 15,070
346,493$ 429,425$
34
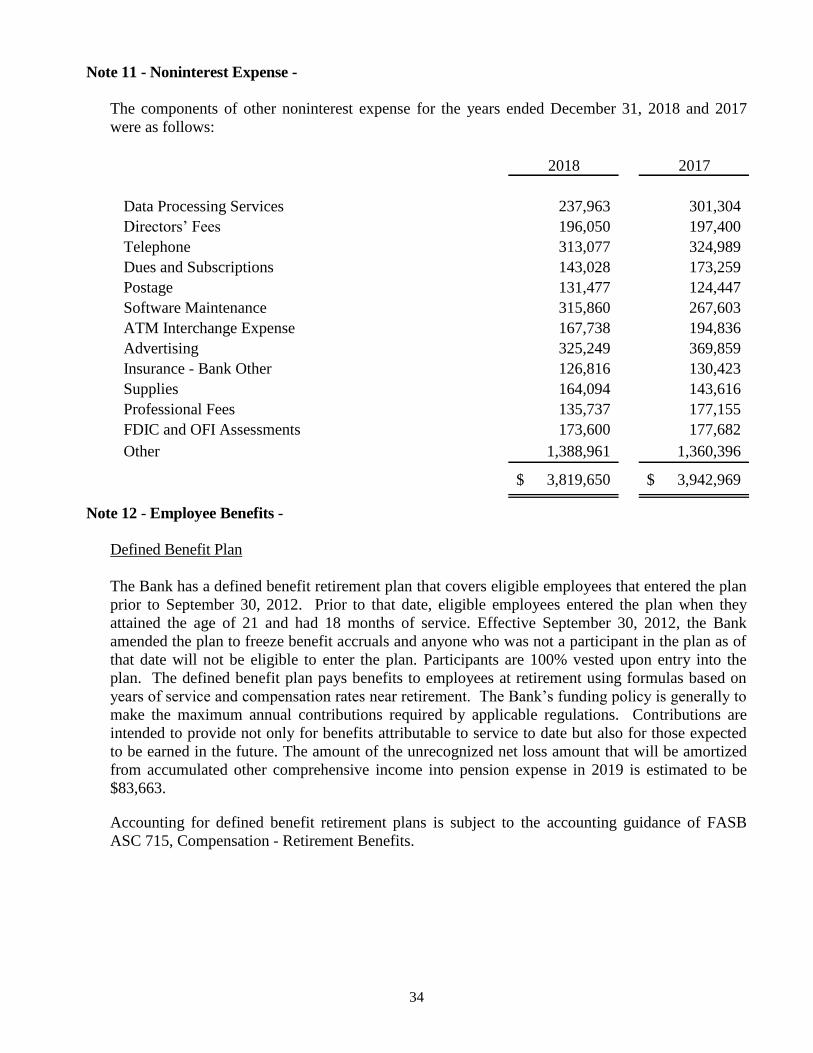
Note 11 - Noninterest Expense -
The components of other noninterest expense for the years ended December 31, 2018 and 2017
were as follows:
2018 2017
Data Processing Services 237,963 301,304
Directors’ Fees 196,050 197,400
Telephone 313,077 324,989
Dues and Subscriptions 143,028 173,259
Postage 131,477 124,447
Software Maintenance 315,860 267,603
ATM Interchange Expense 167,738 194,836
Advertising 325,249 369,859
Insurance - Bank Other 126,816 130,423
Supplies 164,094 143,616
Professional Fees 135,737 177,155
FDIC and OFI Assessments 173,600 177,682
Other 1,388,961 1,360,396
3,819,650$ 3,942,969$
Note 12 - Employee Benefits -
Defined Benefit Plan
The Bank has a defined benefit retirement plan that covers eligible employees that entered the plan
prior to September 30, 2012. Prior to that date, eligible employees entered the plan when they
attained the age of 21 and had 18 months of service. Effective September 30, 2012, the Bank
amended the plan to freeze benefit accruals and anyone who was not a participant in the plan as of
that date will not be eligible to enter the plan. Participants are 100% vested upon entry into the
plan. The defined benefit plan pays benefits to employees at retirement using formulas based on
years of service and compensation rates near retirement. The Bank’s funding policy is generally to
make the maximum annual contributions required by applicable regulations. Contributions are
intended to provide not only for benefits attributable to service to date but also for those expected
to be earned in the future. The amount of the unrecognized net loss amount that will be amortized
from accumulated other comprehensive income into pension expense in 2019 is estimated to be
$83,663.
Accounting for defined benefit retirement plans is subject to the accounting guidance of FASB
ASC 715, Compensation - Retirement Benefits.

35
At December 31, 2018 and 2017, the net periodic pension cost for each fiscal year was as follows:
2018 2017
Service Cost -$ -$
Interest Cost 180,981 186,053
Expected Return on Assets (304,575) (290,200)
Net Amortization Amounts
(Gain) or Loss Recognized 116,319 80,345
Net Periodic Pension Cost (Credit) (7,275)$ (23,802)$
At December 31, 2018 and 2017, the funded status of the plan was as follows:
2018 2017
Fair Value of Plan Assets at
December 31 5,935,764$ 6,198,652$
Benefit Obligation at
December 31 (4,734,342) (5,352,998)
Funded Status 1,201,422 845,654
Unrecognized Net Loss 1,603,813 2,078,971
Prepaid Pension Cost 2,805,235$ 2,924,625$
Weighted Average Assumptions as of December 31:
Discount Rate 4.10% 3.45%
Expected Return on Plan Assets 5.00% 5.00%
Rate of Compensation Increase 0.00% 0.00%
The plan's weighted-average asset allocations at December 31, by asset category, are as follows:
Guaranteed Fixed Income Single Group Annuity Contract 100% 100%
The underlying portfolio backing this group annuity contract is a segment of the General Account of
Metropolitan Life Insurance Company. The portfolio is primarily invested in bonds and mortgages
and seeks to maintain the highest possible quality consistent with attractive long-term investment
returns. Fair value of these type of investments are generally based on level 2 inputs.
There are no Bank securities in the plan assets.
The Bank's is not expected to make a contribution to the plan in 2019.

36
The following estimated future benefit payments are expected to be made over the following
periods:
Amount
2019 $ 214,094
2020 216,230
2021 219,966
2022 225,465
2023 227,676
Thereafter 1,255,048
$ 2,358,479
The reconciliation of the fair value of plan assets for 2018 and 2017 are as follows:
2018 2017
Fair Value of Plan Assets - Beginning $ 6,198,652 $ 5,885,083
Actual Contributions 29,263 179,509
Actual Distributions (454,890) (54,329)
Expected Return on Assets 304,575 290,200
Gain or (Loss) (141,836) (101,811)
Fair Value of Plan Assets - Ending $ 5,935,764 $ 6,198,652
The reconciliation of the projected benefit obligation (PBO) for 2018 and 2017 are as follows:
PBO - Beginning 5,352,998$ 4,791,296$
Interest Cost 180,981 186,053
Actual Distributions (454,890) (54,329)
Liability (Gain) or Loss (344,747) 429,978
PBO - Ending 4,734,342$ 5,352,998$
The plan allows lump sum payments. The above estimated benefit payments represent amounts
payable as participants reach normal retirement age during the specified years. The lump sums were
based on the plan's actuarial assumptions and do not reflect the governmentally prescribed
assumptions, which are subject to change each year, and often provide for a higher amount.
Defined Contribution Plan
The Bank offers a 401(k) Employee Savings Plan that covers employees who are over 21 years of
age. These employees are automatically enrolled in the Plan. Employees are 100% vested in the
funds they have contributed. The matching and discretionary funds contributed by the employer are
partially vested after three years and fully vested after seven years of service. In 2018, participants
may make contributions in the form of salary deferrals up to 15% of their compensation, up to a
maximum of $18,000, and, participants who have reached the age of 50 may make an additional
$6,000 “catch-up” contribution annually without regard to the above limitations. Effective
37
February 1, 2016, the Bank matches 100% of each employee's contributions, up to 5% of each
employee's compensation. There was no change in the percentage of the Bank's matching
contributions for 2018. The Bank's matching contribution for 2018 and 2017 amounted to $223,789
and $222,731, respectively.
Deferred Compensation Agreement
The Bank entered into a deferred compensation agreement covering one of its former officers. The
total deferred compensation payable under the agreement is $1,275,000, payable $85,000 annually
for fifteen years commencing upon the officer's retirement. In accordance with accounting
principles generally accepted in the United States of America, the deferred compensation was
accrued and charged to earnings as the related employee's services were rendered. The annual
charge to earnings for 2018 and 2017 was approximately $48,000, and the amount of accrued
deferred compensation at December 31, 2018 and 2017 was approximately $712,000 and
$749,700, respectively. The agreement is unfunded and is payable from the general assets of the
Bank.
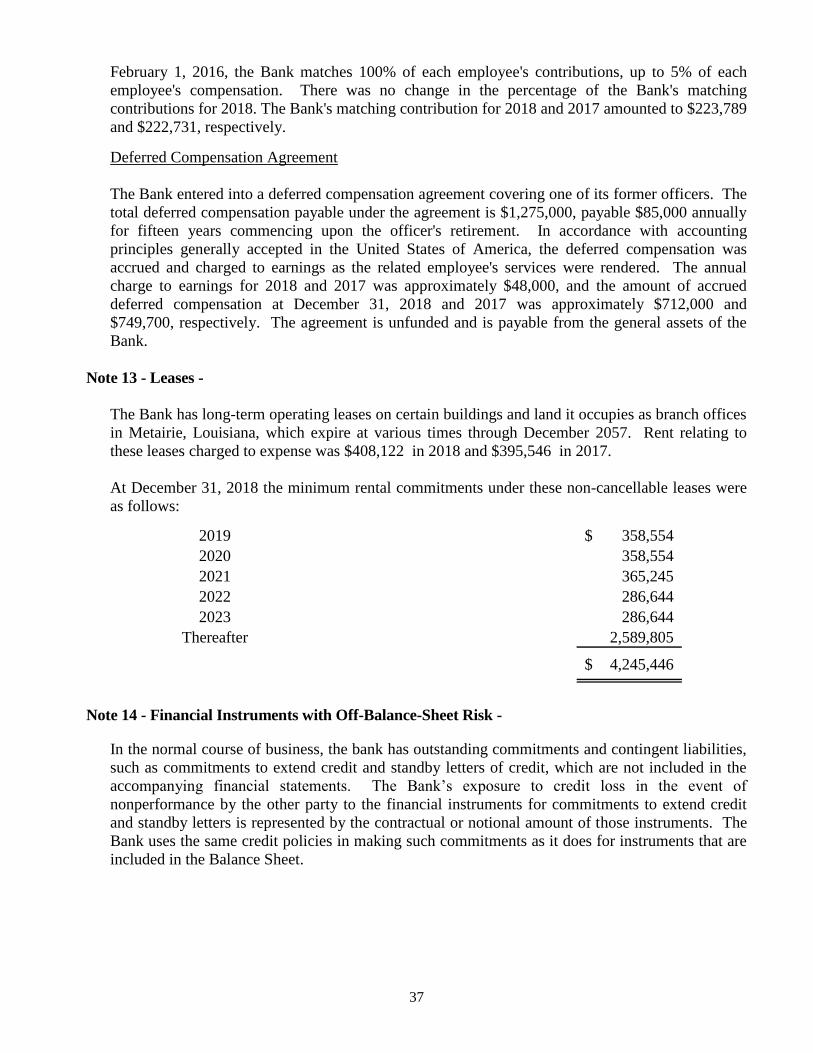
Note 13 - Leases -
The Bank has long-term operating leases on certain buildings and land it occupies as branch offices
in Metairie, Louisiana, which expire at various times through December 2057. Rent relating to
these leases charged to expense was $408,122 in 2018 and $395,546 in 2017.
At December 31, 2018 the minimum rental commitments under these non-cancellable leases were
as follows:
2019 358,554$
2020 358,554
2021 365,245
2022 286,644
2023 286,644
Thereafter 2,589,805
4,245,446$
Note 14 - Financial Instruments with Off-Balance-Sheet Risk -
In the normal course of business, the bank has outstanding commitments and contingent liabilities,
such as commitments to extend credit and standby letters of credit, which are not included in the
accompanying financial statements. The Bank’s exposure to credit loss in the event of
nonperformance by the other party to the financial instruments for commitments to extend credit
and standby letters is represented by the contractual or notional amount of those instruments. The
Bank uses the same credit policies in making such commitments as it does for instruments that are
included in the Balance Sheet.

38
Financial instruments whose contract amount represents credit risk were as follows:
2018 2017
Commitments to Extend Credit 45,173,000$ 44,732,000$
Standby Letters of Credit 513,000$ 461,000$
Commitments to extend credit are agreements to lend to a customer as long as there is no violation
of any condition established in the contract. Commitments generally have fixed expiration dates or
other termination clauses and may require payment of a fee. Since many of the commitments are
expected to expire without being drawn upon, the total commitment amounts do not necessarily
represent future cash requirements. The Bank evaluates each customer’s creditworthiness on a
case-by-case basis. The amount of collateral obtained, if deemed necessary by the Bank upon
extension of credit, is based on management’s credit evaluation.
Standby letters of credit are conditional commitments issued by the Bank to guarantee the
performance of a customer to a third party. The credit risk involved in issuing letters of credit is
essentially the same as that involved in extending loan facilities to customers. The Bank’s policy
for obtaining collateral, and the nature of such collateral, is essentially the same as that involved in
making commitments to extend credit.
Note 15 - Significant Concentrations of Credit Risk -
As discussed previously, the Bank generates loans to individual and business customers within its
immediate and surrounding geographic areas, and the majority of those loans, which are secured,
are collateralized by area real estate and automobiles. Likewise, the Bank receives a majority of its
deposits from substantially the same customers.
The Bank is required to maintain average cash reserve balances. The amount of these reserves at
December 31, 2018 and 2017 was approximately $2,335,000 and $1,646,000, respectively. The
Bank also had funds on deposit with the Federal Reserve Bank at December 31, 2018 and 2017 of
approximately $1,524,000 and $1,914,000, respectively. Also included in cash and due from banks
and federal funds sold are deposit balances in other financial institutions that may periodically
exceed federally insured limits.
Note 16 - Regulatory Matters -
The Bank is subject to various regulatory capital requirements administered by its primary federal
regulator, the Federal Deposit Insurance Corporation (FDIC). Failure to meet minimum regulatory
capital requirements can initiate certain mandatory and possibly additional discretionary actions by
regulators that, if undertaken, could have a direct material effect on the Bank’s financial
statements. Under the regulatory capital adequacy guidelines and the regulatory framework for
prompt corrective action, the Bank must meet specific capital guidelines involving quantitative
measures of the Bank’s assets, liabilities and certain off-balance-sheet items as calculated under
regulatory reporting requirements. The Bank’s capital amounts and classification under the prompt
corrective action guidelines are also subject to qualitative judgments by the regulators about
components, risk weightings and other factors.
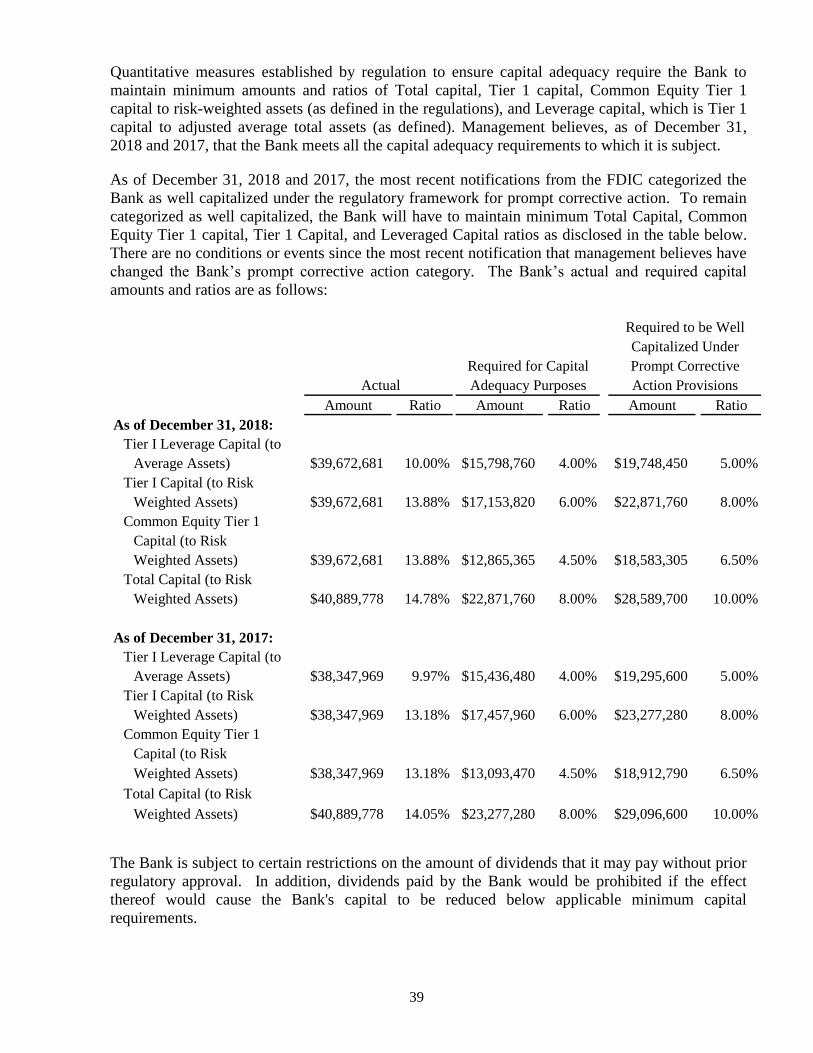
39
Quantitative measures established by regulation to ensure capital adequacy require the Bank to
maintain minimum amounts and ratios of Total capital, Tier 1 capital, Common Equity Tier 1
capital to risk-weighted assets (as defined in the regulations), and Leverage capital, which is Tier 1
capital to adjusted average total assets (as defined). Management believes, as of December 31,
2018 and 2017, that the Bank meets all the capital adequacy requirements to which it is subject.
As of December 31, 2018 and 2017, the most recent notifications from the FDIC categorized the
Bank as well capitalized under the regulatory framework for prompt corrective action. To remain
categorized as well capitalized, the Bank will have to maintain minimum Total Capital, Common
Equity Tier 1 capital, Tier 1 Capital, and Leveraged Capital ratios as disclosed in the table below.
There are no conditions or events since the most recent notification that management believes have
changed the Bank’s prompt corrective action category. The Bank’s actual and required capital
amounts and ratios are as follows:
Amount Ratio Amount Ratio Amount Ratio
As of December 31, 2018:
Tier I Leverage Capital (to
Average Assets) $39,672,681 10.00% $15,798,760 4.00% $19,748,450 5.00%
Tier I Capital (to Risk
Weighted Assets) $39,672,681 13.88% $17,153,820 6.00% $22,871,760 8.00%
Common Equity Tier 1
Capital (to Risk
Weighted Assets) $39,672,681 13.88% $12,865,365 4.50% $18,583,305 6.50%
Total Capital (to Risk
Weighted Assets) $40,889,778 14.78% $22,871,760 8.00% $28,589,700 10.00%
As of December 31, 2017:
Tier I Leverage Capital (to
Average Assets) $38,347,969 9.97% $15,436,480 4.00% $19,295,600 5.00%
Tier I Capital (to Risk
Weighted Assets) $38,347,969 13.18% $17,457,960 6.00% $23,277,280 8.00%
Common Equity Tier 1
Capital (to Risk
Weighted Assets) $38,347,969 13.18% $13,093,470 4.50% $18,912,790 6.50%
Total Capital (to Risk
Weighted Assets) $40,889,778 14.05% $23,277,280 8.00% $29,096,600 10.00%
Actual
Required to be Well
Capitalized Under
Prompt Corrective
Action Provisions
Required for Capital
Adequacy Purposes
The Bank is subject to certain restrictions on the amount of dividends that it may pay without prior
regulatory approval. In addition, dividends paid by the Bank would be prohibited if the effect
thereof would cause the Bank's capital to be reduced below applicable minimum capital
requirements.

40
On November 27, 2018, the Company declared a $0.50 per share dividend to shareholders of
record on December 14, 2018, payable on January 2, 2019. In December of 2018, the amount of
this dividend, $1,021,772 was paid to the Company’s third party transfer agent to facilitate the
timely completion of this dividend payment. As such, this amount is not reflected as a payable on
the Company’s financial statements as of December 31, 2018.
Note 17 - Accumulated Other Comprehensive Income (Loss) -
The Company has adopted ASU 2018-02 Topic 220: Reclassification of Certain Tax Effects from
Accumulated Other Comprehensive Income which was issued by the FASB on February 14, 2018.
Under the provisions of this ASU, the Company has reclassified the stranded income tax effects
associated with the Tax Cut and Jobs Act from accumulated other comprehensive income to
retained earnings. The stranded income tax effects were associated with unrealized losses on
securities available for sale and unrecognized losses on pension plan assets at December 31, 2017.
The following is a summary of the changes in the balances of each component of accumulated
other comprehensive income (loss) for the years ended December 31, 2018 and 2017:
Unrealized Total
Gains Defined Benefit Accumulated
(Losses) Pension Plan Other
Securities Unrecognized Comprehensive
Available for Sale Gains (Losses) Income (Loss)
Balance, January 1, 2017 (104,509)$ (956,863)$ (1,061,372)$
Other Comprehensive Income (Loss) Before
Reclassification Adjustments, Net of Tax (56,899) (117,304) (174,203)
Reclassification Adjustments, Net of Tax (35,484) - (35,484)
Total Other Comprehensive Income (Loss),
Net of Tax (92,383) (117,304) (209,687)
Reclassification due to Tax
Cuts and Jobs Act (38,782) (211,579) (250,361)
Balance, December 31, 2017 (235,674) (1,285,746) (1,521,420)
Other Comprehensive Income (Loss) Before
Reclassification Adjustments, Net of Tax (256,888) (356,639) (613,527)
Reclassification Adjustments, Net of Tax 8,534 - 8,534
Total Other Comprehensive Income (Loss),
Net of Tax (248,354) (356,639) (604,993)
Balance December 31, 2018 (484,028)$ (1,642,385)$ (2,126,413)$

41
Note 18 - Fair Value of Financial Statements -
Fair Value Disclosures
The Company groups its financial assets and liabilities measured at fair value in three levels. Fair
value should be based on the assumptions market participants would use when pricing the asset or
liability and establishes a fair value hierarchy that prioritizes the inputs used to develop those
assumptions and measure fair value. The hierarchy requires companies to maximize the use of
observable inputs and minimize the use of unobservable inputs. The three levels of inputs used to
measure fair value are as follows:
Level 1 - Level 1 inputs are quoted prices (unadjusted) in active markets for identical assets or
liabilities that the reporting entity has the ability to access at the measurement date. An active
market for the asset or liability is a market in which transactions for the asset or liability occur
with sufficient frequency and volume to provide pricing information on an ongoing basis.
Level 2 - Level 2 inputs are inputs other than quoted prices included within Level 1 that are
observable for the asset or liability, either directly or indirectly. If the asset or liability has a
specified (contractual) term, a Level 2 input must be observable for substantially the full term of
the asset or liability. Level 2 inputs include the following:
a. Quoted prices for similar assets or liabilities in active markets;
b. Quoted prices for identical or similar assets or liabilities in markets that are not active, that is,
markets in which there are few transactions for the asset or liability, the prices are not
current, or price quotations vary substantially either over time or among market makers (for
example, some brokered markets), or in which little information is released publicly (for
example, a principal-to-principal market);
c. Inputs other than quoted prices that are observable for the asset or liability (for example,
interest rates and yield curves observable at commonly quoted intervals, volatilities,
prepayment speeds, loss severities, credit risks, and default rates);
d. Inputs that are derived principally from or corroborated by observable market data by
correlation or other means (market-corroborated inputs).
Level 3 - Level 3 inputs are unobservable inputs for the asset or liability. Unobservable inputs
shall be used to measure fair value to the extent that observable inputs are not available, thereby
allowing for situations in which there is little, if any, market activity for the asset or liability at
the measurement date. However, the fair value measurement objective remains the same, that is,
an exit price from the perspective of a market participant that holds the asset or owes the
liability.
Recurring Basis
Fair values of investment securities available for sale were primarily measured using information
from a third-party pricing service. This pricing service provides information by utilizing
evaluated pricing models supported with market data information. Standard inputs include
benchmark yields, reported trades, broker/dealer quotes, issuer spreads, benchmark securities,
bids, offers, and reference data from market research publications.

42
The following tables present the balance of assets measured on a recurring basis as of Decem-
ber 31, 2018 and 2017. The Company did not record any liabilities at fair value for which
measurement of the fair value was made on a recurring basis.
(in thousands)
Description
Fair
Value
Quoted Prices in
Active Markets for
Identical Assets
(Level 1)
Significant Other
Observable Inputs
(Level 2)
Significant
Unobservable
Inputs
(Level 3)
December 31, 2018
U.S. Treasury Securities
and Obligations of U.S.
Government Agencies $ 16,378 -$ $ 16,378 -$
Mortgage Backed Securities 17,479 - 17,479 -
Securities Issued by States
and Political Subdivisions
in the U. S. 13,962 - 13,962 -
$ 47,819 -$ $ 47,819 -$
December 31, 2017
U.S. Treasury Securities
and Obligations of U.S.
Government Agencies $ 28,442 -$ $ 28,442 -$
Mortgage Backed Securities 7,593 - 7,593 -
Securities Issued by States
and Political Subdivisions
in the U. S. 13,792 - 13,792 -
$ 49,827 -$ $ 49,827 -$
Fair Value Measurement Using
Nonrecurring Basis
The Company has segregated all financial assets and liabilities that are measured at fair value on
a nonrecurring basis into the most appropriate level within the fair value hierarchy based on the
inputs used to determine the fair value at the measurement date in the table below. The Company
did not record any liabilities at fair value for which measurement of the fair value was made on a
non-recurring basis.
The fair value of the impaired loans is measured at the fair value of the collateral for collateral-
dependent loans. Impaired loans are Level 2 assets measured using appraisals from external
parties of the collateral less any prior liens. Repossessed assets are initially recorded at fair value
less estimated costs to sell. The fair value of repossessed assets is based on property appraisals
and an analysis of similar properties available. As such, the Company records repossessed assets
as Level 2.

43
(in thousands)
Fair
Value
Quoted Prices in
Active Markets for
Identical Assets
(Level 1)
Significant Other
Observable Inputs
(Level 2)
Significant
Unobservable
Inputs
(Level 3)
December 30, 2018
Assets
Impaired Loans 181$ -$ 181$ -$
Total 181$ -$ 181$ -$
December 31, 2017
Assets
Impaired Loans 390$ -$ 390$ -$
Total 390$ -$ 390$ -$
Fair Value Measurement Using
Fair values of financial instruments
In cases where quoted market prices of financial instruments are not available, fair values are based
on estimates using present value or other valuation techniques. Those techniques are significantly
affected by the assumptions used, including the discount rate and estimates of future cash flows. In
that regard, the derived fair value estimates cannot be substantiated by comparison to independent
markets and, in many cases, could not be realized in immediate settlement of the instruments. The
fair values of certain financial instruments and all non-financial instruments are not required to be
disclosed. Accordingly, the aggregate fair value amounts presented do not represent the underlying
value of the Company. The following methods and assumptions were used by the Company in
estimating fair values of financial instruments:
Cash, due from banks, federal funds sold and interest-earning deposits with banks - The carrying
amount is a reasonable estimate of fair value.
Interest Bearing Deposits in other Banks - The carrying amount is a reasonable estimate of fair
value.
Securities - Fair value is based on quoted market price, if available. If a quoted market price is not
available, fair value is estimated using quoted market prices for similar securities.
Loans Receivable - Fair value is estimated by discounting the future cash flows using the current
rates at which similar loans would be made to borrowers with similar credit ratings and for the
same remaining maturities. Cash Value of Life Insurance - The carrying amount approximates its fair value.
Deposits - The fair value of demand, savings, NOW and money market accounts is the amount
payable on demand at the reporting date. The fair value of fixed-maturity time deposits is
estimated using the rates currently offered for deposits of similar remaining maturities.

44
Borrowings - The carrying amounts of federal funds purchased, borrowings under repurchase
agreements, and other short-term borrowings maturing within ninety days approximate their fair
values. Fair values of other borrowings are estimated using discounted cash flow analyses based
on current incremental borrowing rates for similar types of borrowing arrangements.
Commitments to extend credit and standby letters of credit - The fair values of commitments to
extend credit and standby letters of credit do not differ significantly from the commitment
amount and are therefore omitted from this disclosure.
The carrying amounts and estimated fair values of the Company’s financial instruments at
December 31, are as follows:
(in thousands)
Carrying
Amount Fair Value
Quoted Prices in
Active Markets for
Identical Assets
(Level 1)
Significant Other
Observable Inputs
(Level 2)
Significant
Unobservable
Inputs
(Level 3)
December 31, 2018
Financial Assets:
Cash, Short-Term Investments
and Federal Funds Sold 8,171$ 8,171$ 8,171$ -$ -$
Interest Bearing Deposits 1,225 1,225 1,225 - -
Securities-Available for Sale 47,819 47,819 - 47,819 -
Other Equity Securities 1,998 1,998 - - 1,998
Cash Value of Life Insurance 2,912 2,912 - 2,912 -
Loans-Net 310,516 309,400 - - 309,400
372,641$ 371,525$ 9,396$ 50,731$ 311,398$
Financial Liabilities:
Deposits 346,174$ 345,635$ -$ -$ 345,635$
Fair Value Measurement Using
(in thousands)
Carrying
Amount
Fair
Value
Quoted Prices in
Active Markets for
Identical Assets
(Level 1)
Significant Other
Observable Inputs
(Level 2)
Significant
Unobservable
Inputs
(Level 3)
December 31, 2017
Financial Assets:
Cash, Short-Term Investments
and Federal Funds Sold 10,617$ 10,617$ 10,617$ -$ -$
Interest Bearing Deposits 1,225 1,225 1,225 - -
Securities-Available for Sale 49,827 4,927 - 4,927 -
Other Equity Securities 1,904 1,904 - - 1,904
Cash Value of Life Insurance 2,867 2,867 - 2,867 -
Mortgage Loans
Available for Sale 209 209 - 209 -
Loans-Net 309,008 310,201 - - 310,201
375,657$ 331,950$ 11,842$ 8,003$ 312,105$
Financial Liabilities:
Deposits 334,930$ 334,493$ -$ -$ 334,493$
Borrowed Funds 15,000 14,999 - 14,999 -
349,930$ 349,492$ -$ 14,999$ 334,493$
Fair Value Measurement Using

45
Note 19 - Condensed Financial Information (Parent Company Only) -
Presented below is the condensed balance sheet, condensed statement of income and the condensed
statement of cash flows of the Parent Company:
Assets:
Cash 68,476$
Due from Subsidiary Bank 6,620
Investments in Bank Subsidiary 37,546,266
Total Assets 37,621,362$
Liabilities and Shareholders' Equity:
Liabilities -$
Total Shareholders Equity 37,621,362
Total Liabilities and Shareholders' Equity 37,621,362$
Income:
Undistributed Equity in Net Income of Bank Subsidiary 587,379$
Dividends from Bank Subsidiary 2,143,543
Total Income 2,730,922
Expenses:
Professional fees 30,383
Other Noninterest income 1,141
Total Expenses 31,524
Income before tax expense 2,699,398
Provision for tax (6,620)
Net Income 2,706,018$
*For the period of March 29, 2018 to December 31, 2018.
MBT BANCSHARES, INC.
MBT BANCSHARES, INC.
CONDENSED BALANCE SHEET
December 31, 2018
CONDENSED STATEMENT OF INCOME
For the Period Ended December 31, 2018*

46
Cash Flows From Operating Activities:
Net Income 2,706,018$
Increase in Due to Bank Subsidiary (6,620)
Equity in Net Income of Bank Subsidiary (587,379)
Net Cash Provided by Operating Activities 2,112,019
Cash Flows From Financing Activities:
Dividends Declared (2,043,543)
Net Cash Used in Financing Activities (2,043,543)
Net Increase in Cash 68,476
Cash and Cash Equivalents - Beginning of Period -
Cash and Cash Equivalents - End of Period 68,476$
CONDENSED STATEMENT OF CASH FLOWS
For the Period Ended December 31, 2018
MBT BANCSHARES, INC.