Embed Size (px)
Citation preview
MBS & Prepayment UpdateVolatile 2020 comes to an end, Bloomberg set to release model update
Kevin A. Smith, CFA
SVP, Director Investment Product Strategies
Vining-Sparks IBG, L.P.
Last Updated: 12-30-2020
Travis Nauert, CFA
Analyst, Investment Product Strategies
Vining-Sparks IBG, L.P.
2
DISCUSSION AGENDA
• Market Landscape• Mortgage rates | Historical prepayments
• YTD Model Performance• Yield Book, Bloomberg (BAM) vs Actuals | New BAM v 1.42
• Forward Looking Prepayment Projections• Summary of changes | Comparison of results
1
2
3
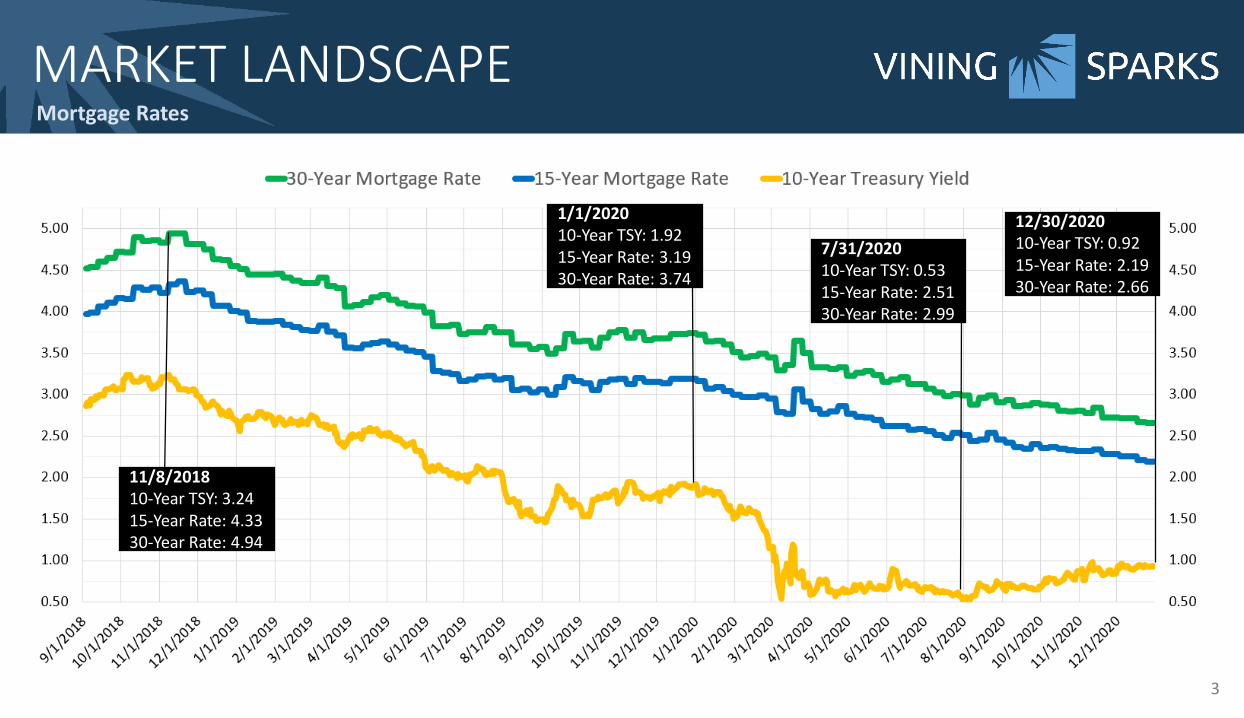
MARKET LANDSCAPEMortgage Rates
11/8/201810-Year TSY: 3.2415-Year Rate: 4.3330-Year Rate: 4.94
1/1/202010-Year TSY: 1.9215-Year Rate: 3.1930-Year Rate: 3.74
12/30/202010-Year TSY: 0.9215-Year Rate: 2.1930-Year Rate: 2.66
3
7/31/202010-Year TSY: 0.5315-Year Rate: 2.5130-Year Rate: 2.99
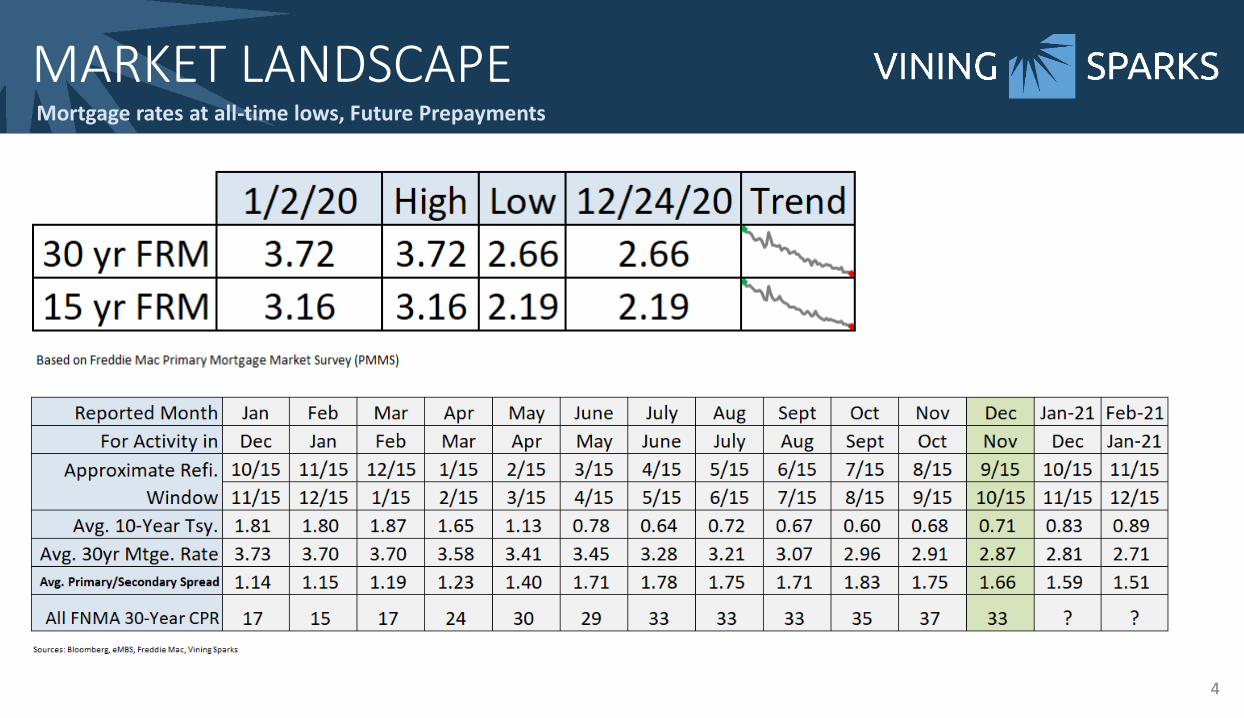
MARKET LANDSCAPEMortgage rates at all-time lows, Future Prepayments
4
5
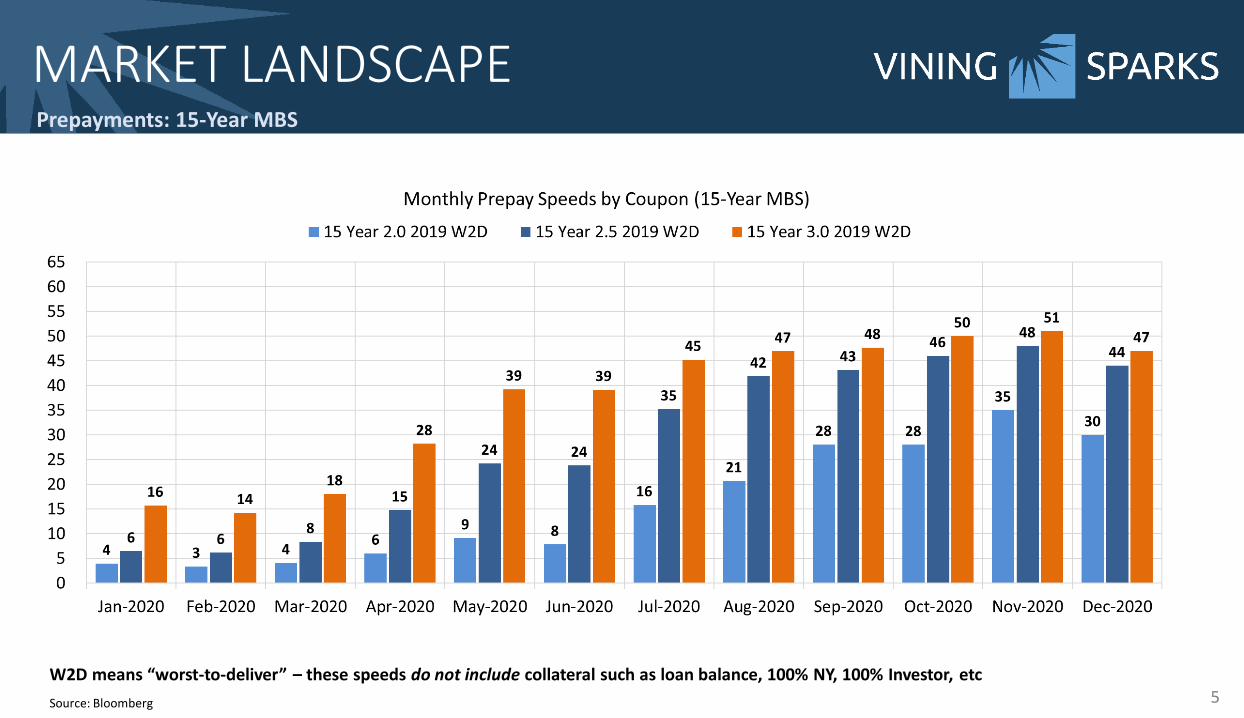
MARKET LANDSCAPEPrepayments: 15-Year MBS
W2D means “worst-to-deliver” – these speeds do not include collateral such as loan balance, 100% NY, 100% Investor, etc
Source: Bloomberg
6
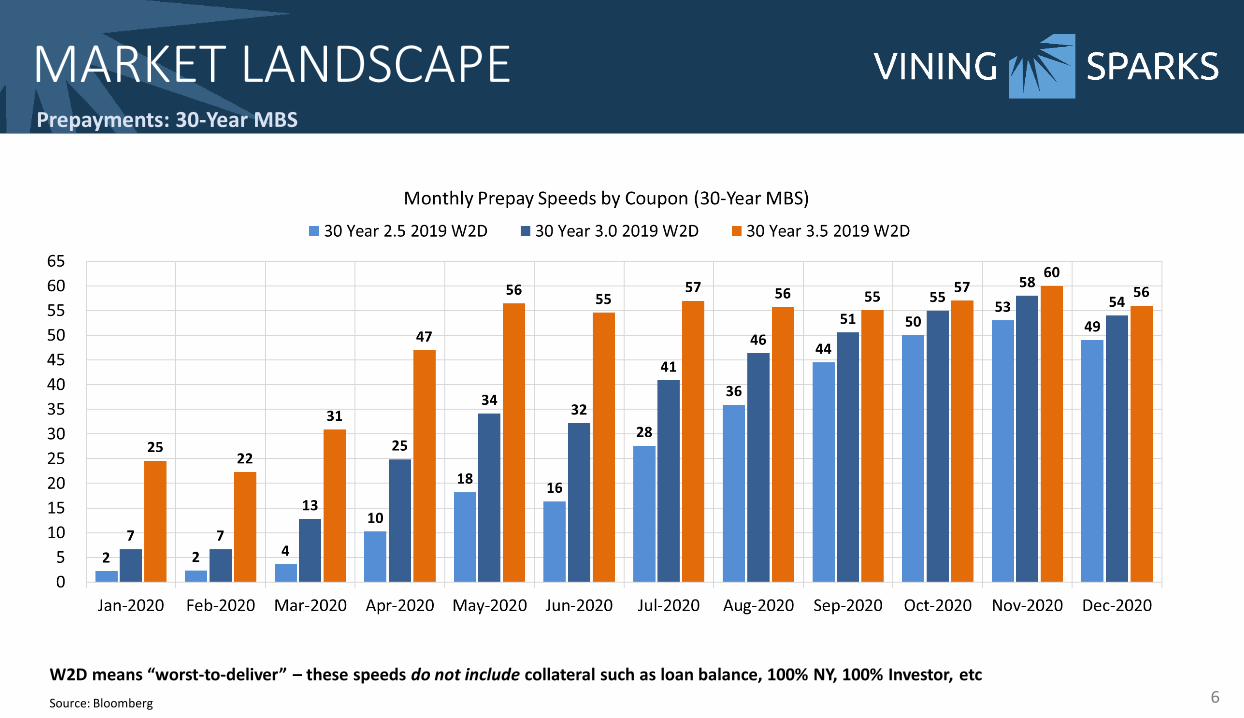
MARKET LANDSCAPEPrepayments: 30-Year MBS
W2D means “worst-to-deliver” – these speeds do not include collateral such as loan balance, 100% NY, 100% Investor, etc
Source: Bloomberg
7
PRIMARY/SECONDARY SPREADWhat is it?
Primary/Secondary Spread•Difference between the actual (Primary) mortgage rate
and the “par” coupon rate for an MBS (Secondary).
• For example, if a lender makes a 30-year mortgage at a rate of 3.50% and the par coupon rate is 2.00%...
• The Primary/Secondary spread is 1.50% (150 bps).
8
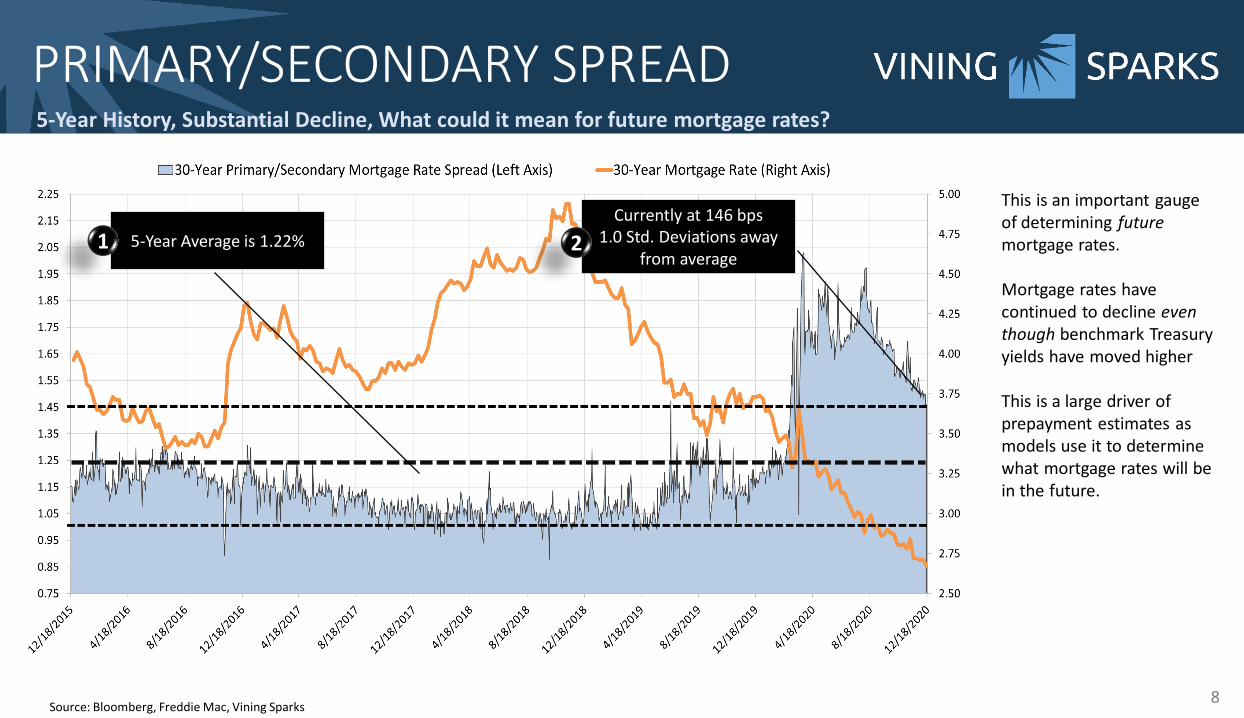
PRIMARY/SECONDARY SPREAD5-Year History, Substantial Decline, What could it mean for future mortgage rates?
5-Year Average is 1.22%1Currently at 146 bps
1.0 Std. Deviations away from average
2
This is an important gauge of determining futuremortgage rates.
Mortgage rates have continued to decline even though benchmark Treasury yields have moved higher
This is a large driver of prepayment estimates as models use it to determine what mortgage rates will be in the future.
Source: Bloomberg, Freddie Mac, Vining Sparks
Model Performance YTDThings you should keep in mind
9
• In order to give the truest sense of model performance, we do not backfill projections with the most current model
• Yield Book updated their production model with a new version implemented in October 2020 – we aligned model projections with the production model in effect for that measurement period (YB Proj. CPR)
• Bloomberg updated their production model with a new version implemented in May 2020 – we aligned model projections with the production model in effect for that measurement period (BAM Proj. CPR)
• Bloomberg is scheduled to update their prepayment model (BAM) on January 8th, we have included how this model would have performed had it been in effect during 2020 (BAM V1.42 Proj)
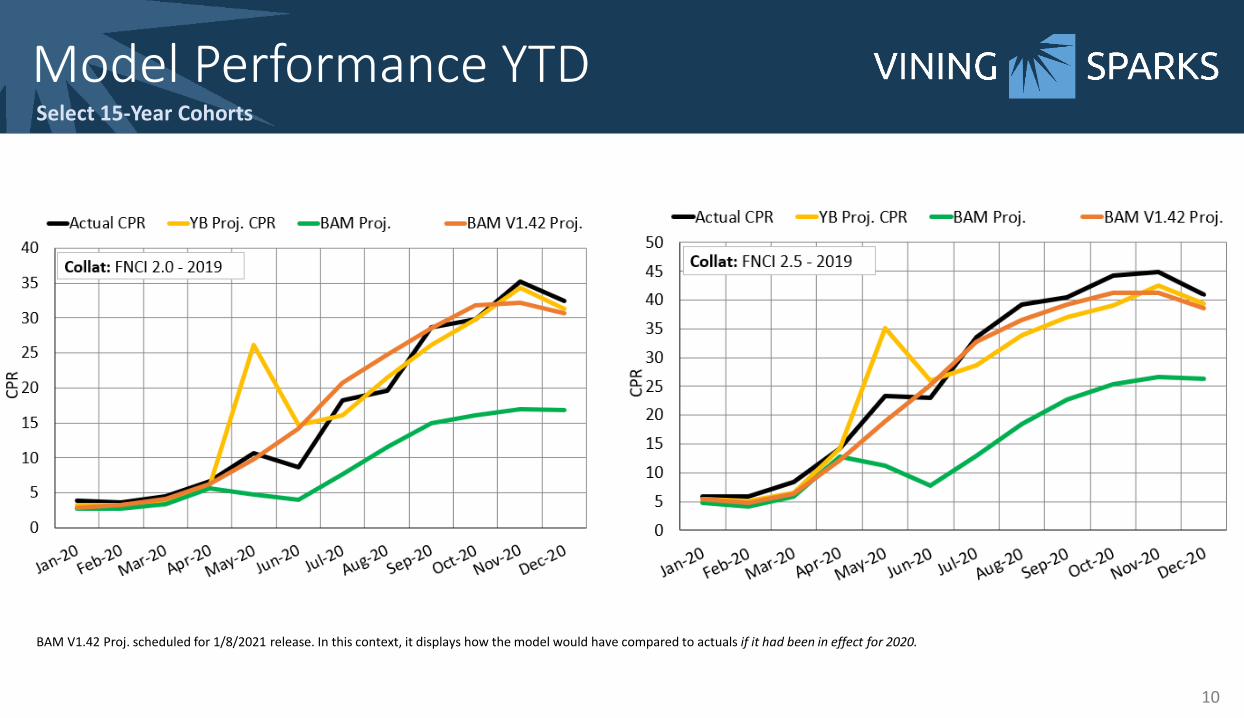
Model Performance YTDSelect 15-Year Cohorts
10
BAM V1.42 Proj. scheduled for 1/8/2021 release. In this context, it displays how the model would have compared to actuals if it had been in effect for 2020.
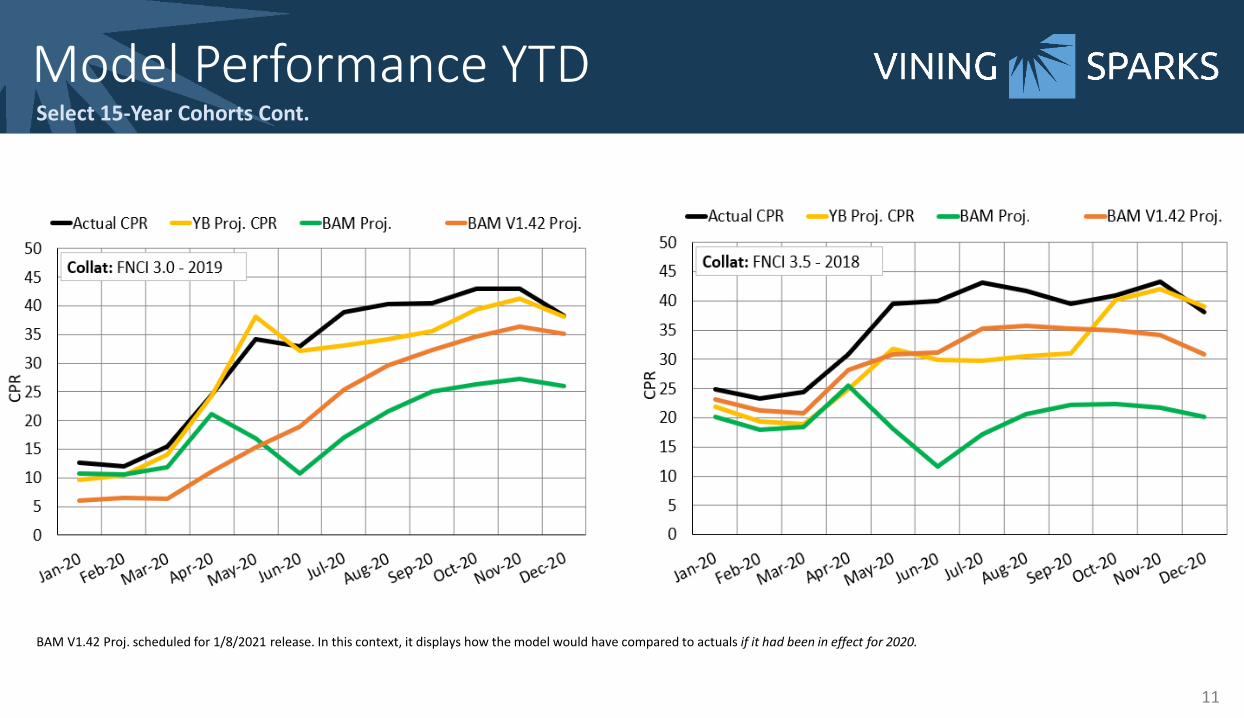
Model Performance YTDSelect 15-Year Cohorts Cont.
11
BAM V1.42 Proj. scheduled for 1/8/2021 release. In this context, it displays how the model would have compared to actuals if it had been in effect for 2020.
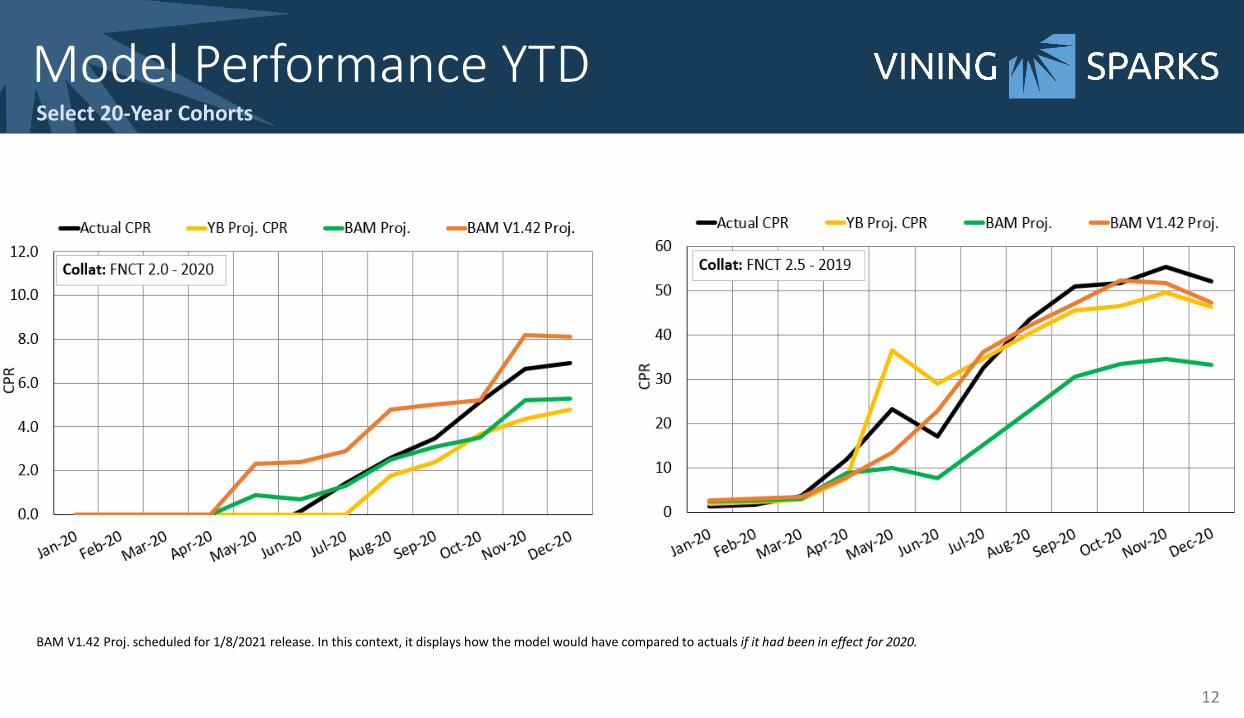
Model Performance YTDSelect 20-Year Cohorts
12
BAM V1.42 Proj. scheduled for 1/8/2021 release. In this context, it displays how the model would have compared to actuals if it had been in effect for 2020.
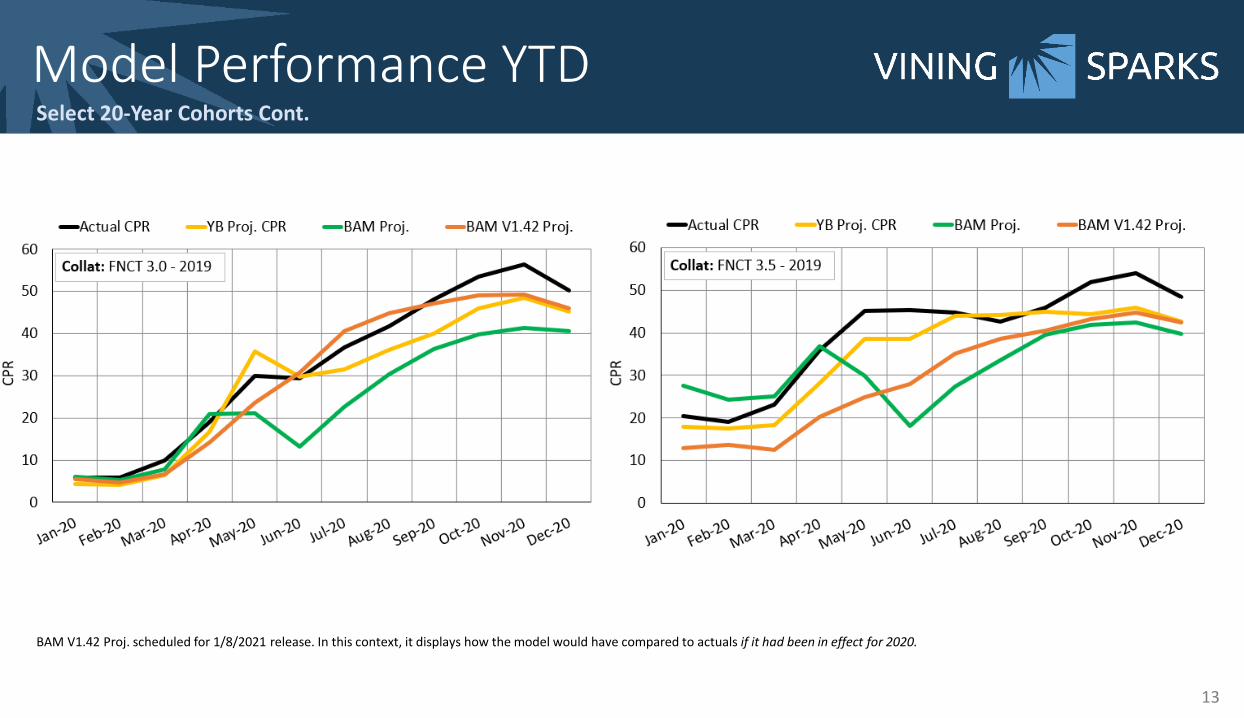
Model Performance YTDSelect 20-Year Cohorts Cont.
13
BAM V1.42 Proj. scheduled for 1/8/2021 release. In this context, it displays how the model would have compared to actuals if it had been in effect for 2020.
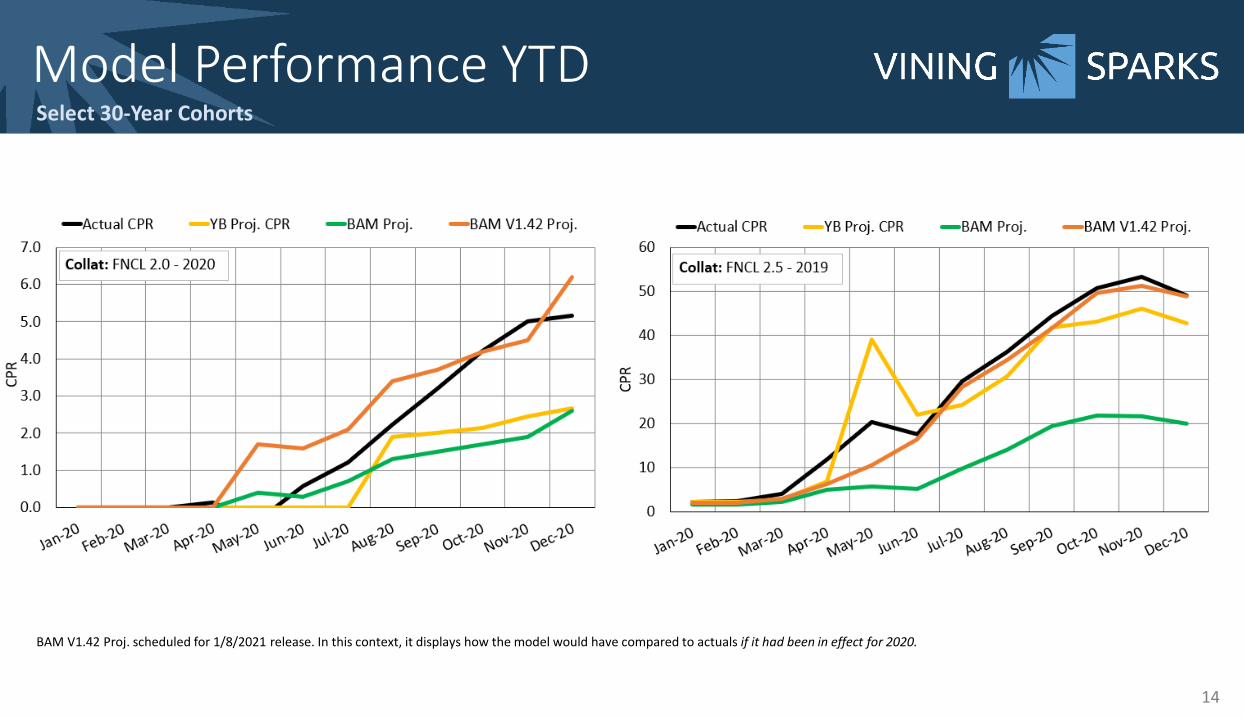
Model Performance YTDSelect 30-Year Cohorts
14
BAM V1.42 Proj. scheduled for 1/8/2021 release. In this context, it displays how the model would have compared to actuals if it had been in effect for 2020.
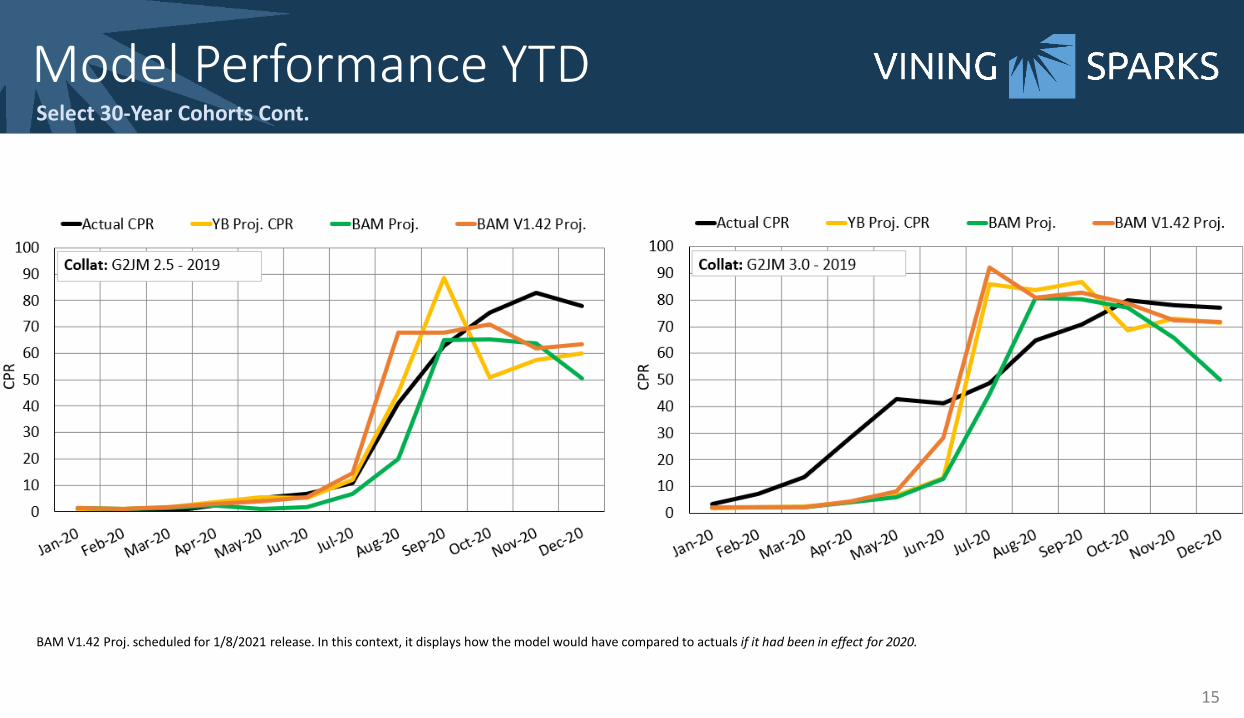
Model Performance YTDSelect 30-Year Cohorts Cont.
15
BAM V1.42 Proj. scheduled for 1/8/2021 release. In this context, it displays how the model would have compared to actuals if it had been in effect for 2020.
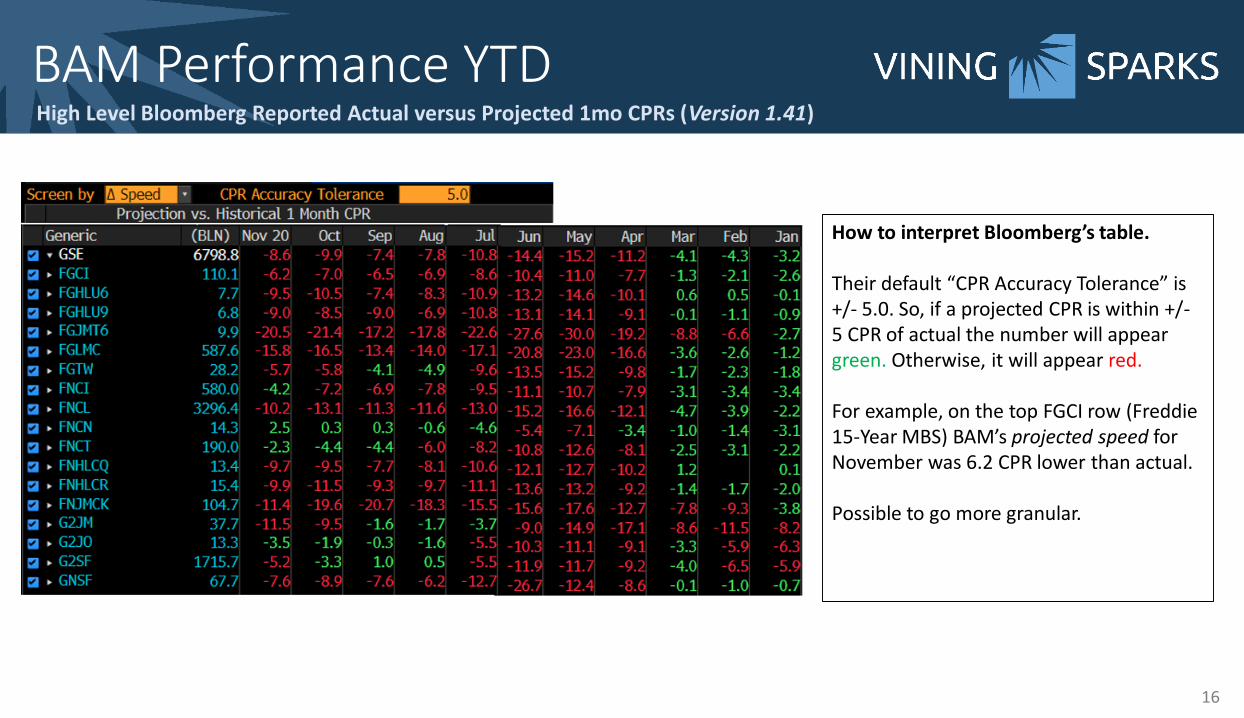
BAM Performance YTDHigh Level Bloomberg Reported Actual versus Projected 1mo CPRs (Version 1.41)
How to interpret Bloomberg’s table.
Their default “CPR Accuracy Tolerance” is +/- 5.0. So, if a projected CPR is within +/-5 CPR of actual the number will appear green. Otherwise, it will appear red.
For example, on the top FGCI row (Freddie 15-Year MBS) BAM’s projected speed for November was 6.2 CPR lower than actual.
Possible to go more granular.
16
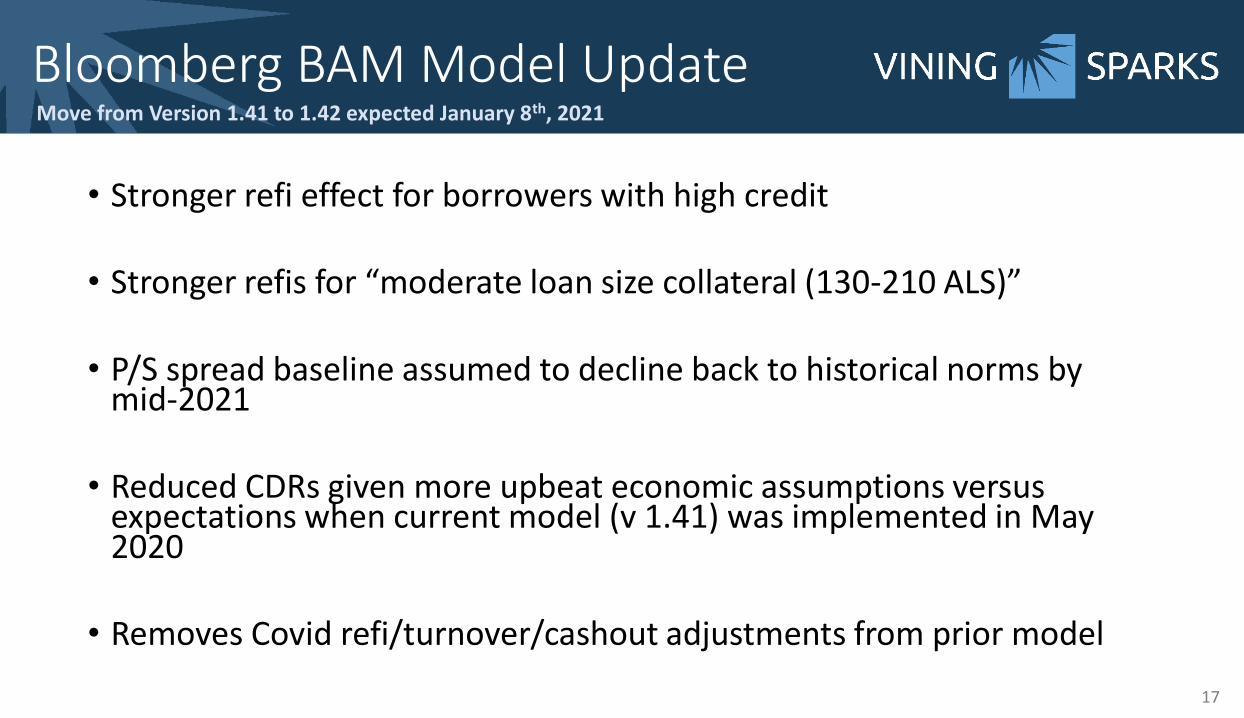
Bloomberg BAM Model UpdateMove from Version 1.41 to 1.42 expected January 8th, 2021
17
• Stronger refi effect for borrowers with high credit
• Stronger refis for “moderate loan size collateral (130-210 ALS)”
• P/S spread baseline assumed to decline back to historical norms by mid-2021
• Reduced CDRs given more upbeat economic assumptions versus expectations when current model (v 1.41) was implemented in May 2020
• Removes Covid refi/turnover/cashout adjustments from prior model
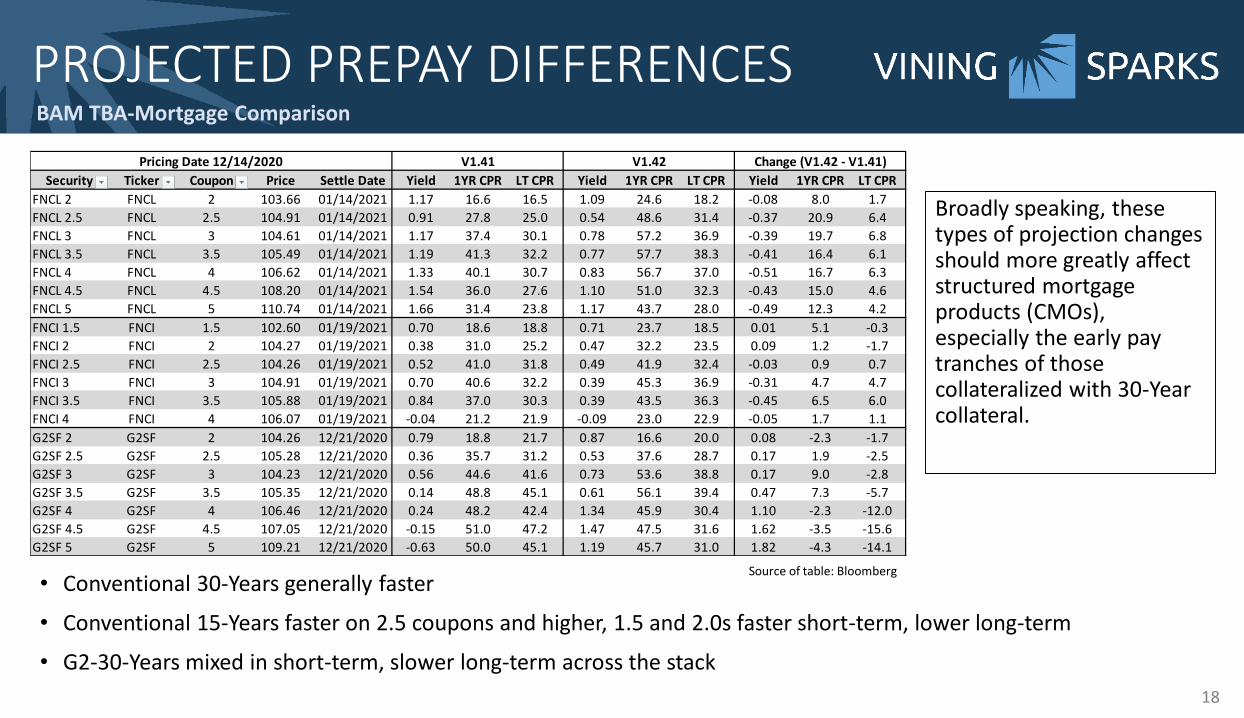
• Conventional 30-Years generally faster
• Conventional 15-Years faster on 2.5 coupons and higher, 1.5 and 2.0s faster short-term, lower long-term
• G2-30-Years mixed in short-term, slower long-term across the stack
18
PROJECTED PREPAY DIFFERENCESBAM TBA-Mortgage Comparison
Source of table: Bloomberg
Pricing Date 12/14/2020 V1.41 V1.42 Change (V1.42 - V1.41)
Security Ticker Coupon Price Settle Date Yield 1YR CPR LT CPR Yield 1YR CPR LT CPR Yield 1YR CPR LT CPR
FNCL 2 FNCL 2 103.66 01/14/2021 1.17 16.6 16.5 1.09 24.6 18.2 -0.08 8.0 1.7
FNCL 2.5 FNCL 2.5 104.91 01/14/2021 0.91 27.8 25.0 0.54 48.6 31.4 -0.37 20.9 6.4
FNCL 3 FNCL 3 104.61 01/14/2021 1.17 37.4 30.1 0.78 57.2 36.9 -0.39 19.7 6.8
FNCL 3.5 FNCL 3.5 105.49 01/14/2021 1.19 41.3 32.2 0.77 57.7 38.3 -0.41 16.4 6.1
FNCL 4 FNCL 4 106.62 01/14/2021 1.33 40.1 30.7 0.83 56.7 37.0 -0.51 16.7 6.3
FNCL 4.5 FNCL 4.5 108.20 01/14/2021 1.54 36.0 27.6 1.10 51.0 32.3 -0.43 15.0 4.6
FNCL 5 FNCL 5 110.74 01/14/2021 1.66 31.4 23.8 1.17 43.7 28.0 -0.49 12.3 4.2
FNCI 1.5 FNCI 1.5 102.60 01/19/2021 0.70 18.6 18.8 0.71 23.7 18.5 0.01 5.1 -0.3
FNCI 2 FNCI 2 104.27 01/19/2021 0.38 31.0 25.2 0.47 32.2 23.5 0.09 1.2 -1.7
FNCI 2.5 FNCI 2.5 104.26 01/19/2021 0.52 41.0 31.8 0.49 41.9 32.4 -0.03 0.9 0.7
FNCI 3 FNCI 3 104.91 01/19/2021 0.70 40.6 32.2 0.39 45.3 36.9 -0.31 4.7 4.7
FNCI 3.5 FNCI 3.5 105.88 01/19/2021 0.84 37.0 30.3 0.39 43.5 36.3 -0.45 6.5 6.0
FNCI 4 FNCI 4 106.07 01/19/2021 -0.04 21.2 21.9 -0.09 23.0 22.9 -0.05 1.7 1.1
G2SF 2 G2SF 2 104.26 12/21/2020 0.79 18.8 21.7 0.87 16.6 20.0 0.08 -2.3 -1.7
G2SF 2.5 G2SF 2.5 105.28 12/21/2020 0.36 35.7 31.2 0.53 37.6 28.7 0.17 1.9 -2.5
G2SF 3 G2SF 3 104.23 12/21/2020 0.56 44.6 41.6 0.73 53.6 38.8 0.17 9.0 -2.8
G2SF 3.5 G2SF 3.5 105.35 12/21/2020 0.14 48.8 45.1 0.61 56.1 39.4 0.47 7.3 -5.7
G2SF 4 G2SF 4 106.46 12/21/2020 0.24 48.2 42.4 1.34 45.9 30.4 1.10 -2.3 -12.0
G2SF 4.5 G2SF 4.5 107.05 12/21/2020 -0.15 51.0 47.2 1.47 47.5 31.6 1.62 -3.5 -15.6
G2SF 5 G2SF 5 109.21 12/21/2020 -0.63 50.0 45.1 1.19 45.7 31.0 1.82 -4.3 -14.1
Broadly speaking, these types of projection changes should more greatly affect structured mortgage products (CMOs), especially the early pay tranches of those collateralized with 30-Year collateral.
19
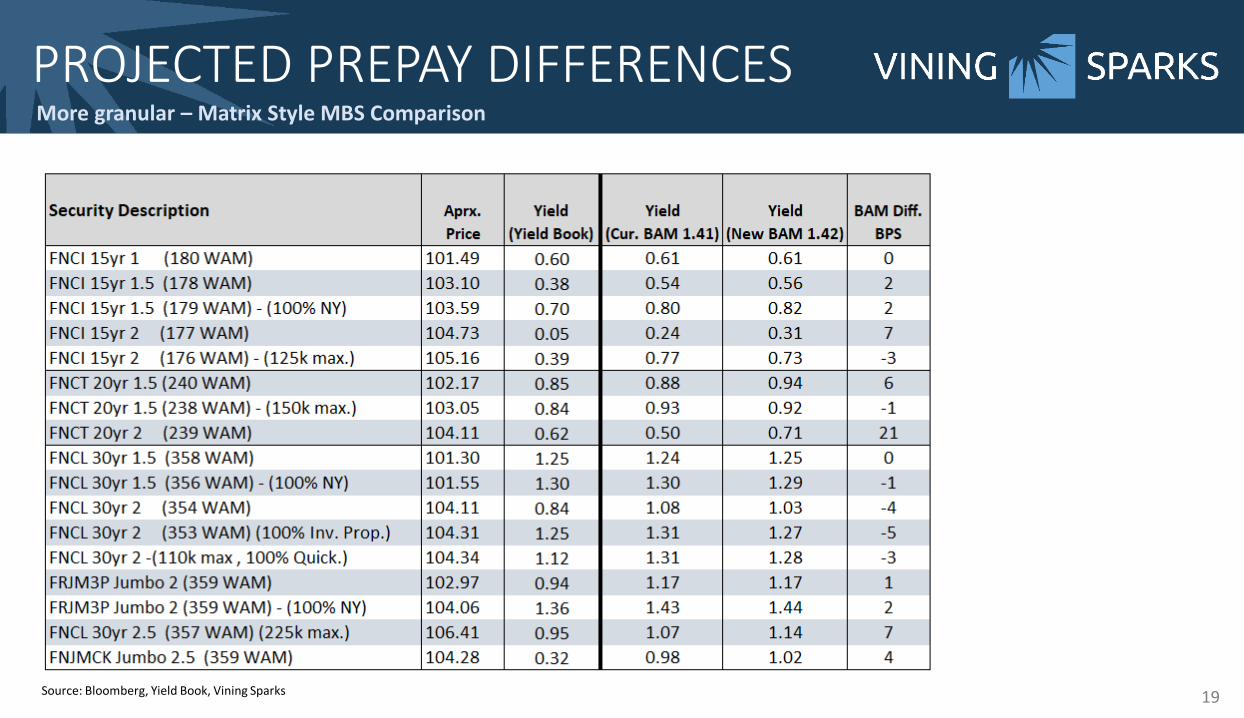
PROJECTED PREPAY DIFFERENCESMore granular – Matrix Style MBS Comparison
Source: Bloomberg, Yield Book, Vining Sparks
20
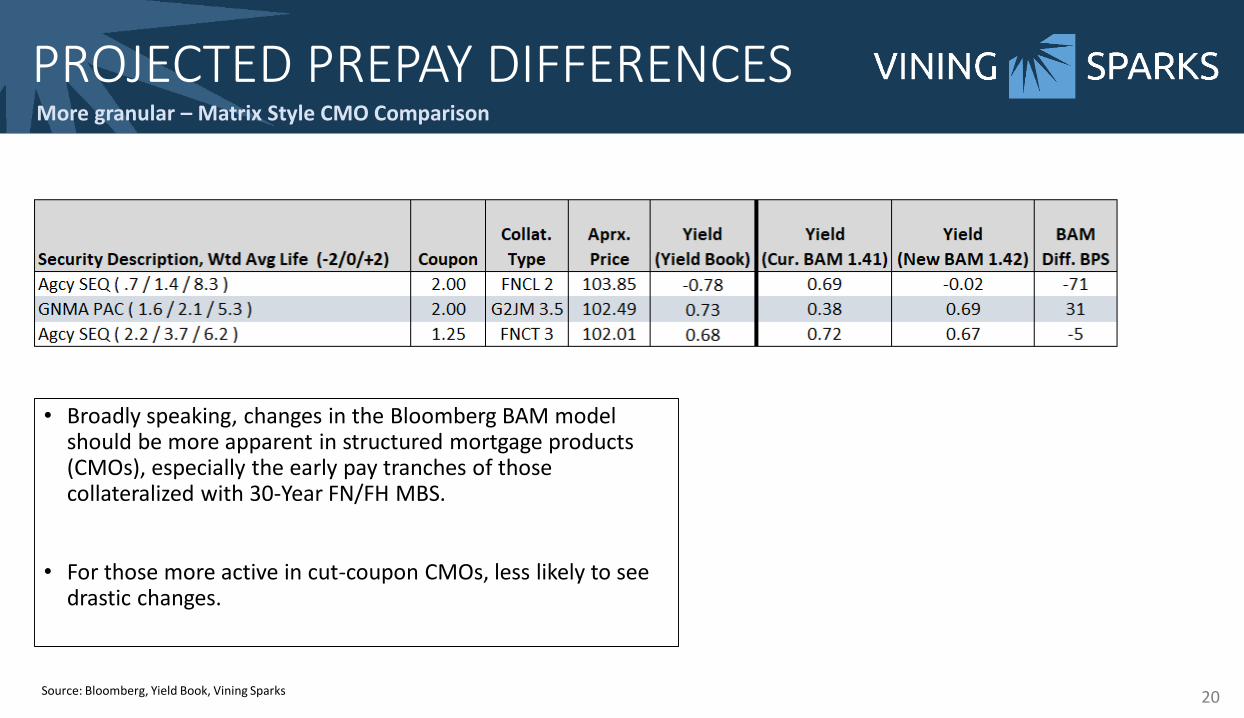
PROJECTED PREPAY DIFFERENCESMore granular – Matrix Style CMO Comparison
Source: Bloomberg, Yield Book, Vining Sparks
• Broadly speaking, changes in the Bloomberg BAM model should be more apparent in structured mortgage products (CMOs), especially the early pay tranches of those collateralized with 30-Year FN/FH MBS.
• For those more active in cut-coupon CMOs, less likely to see drastic changes.
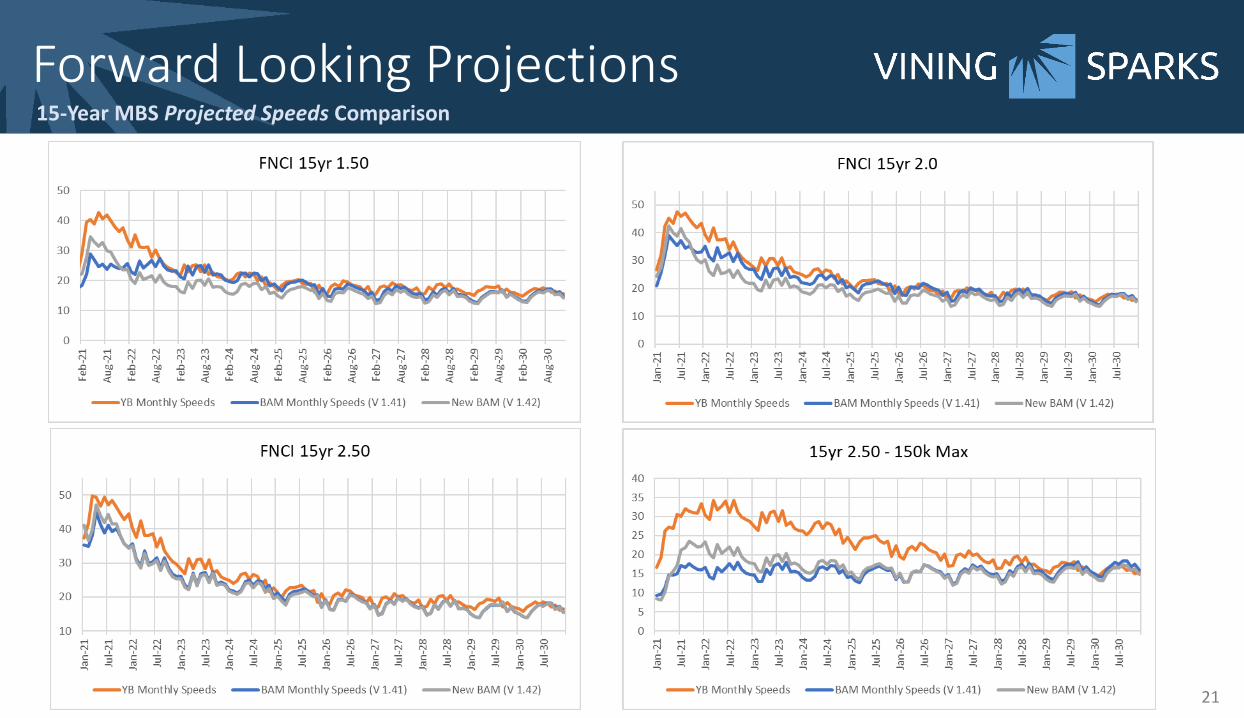
Forward Looking Projections15-Year MBS Projected Speeds Comparison
21
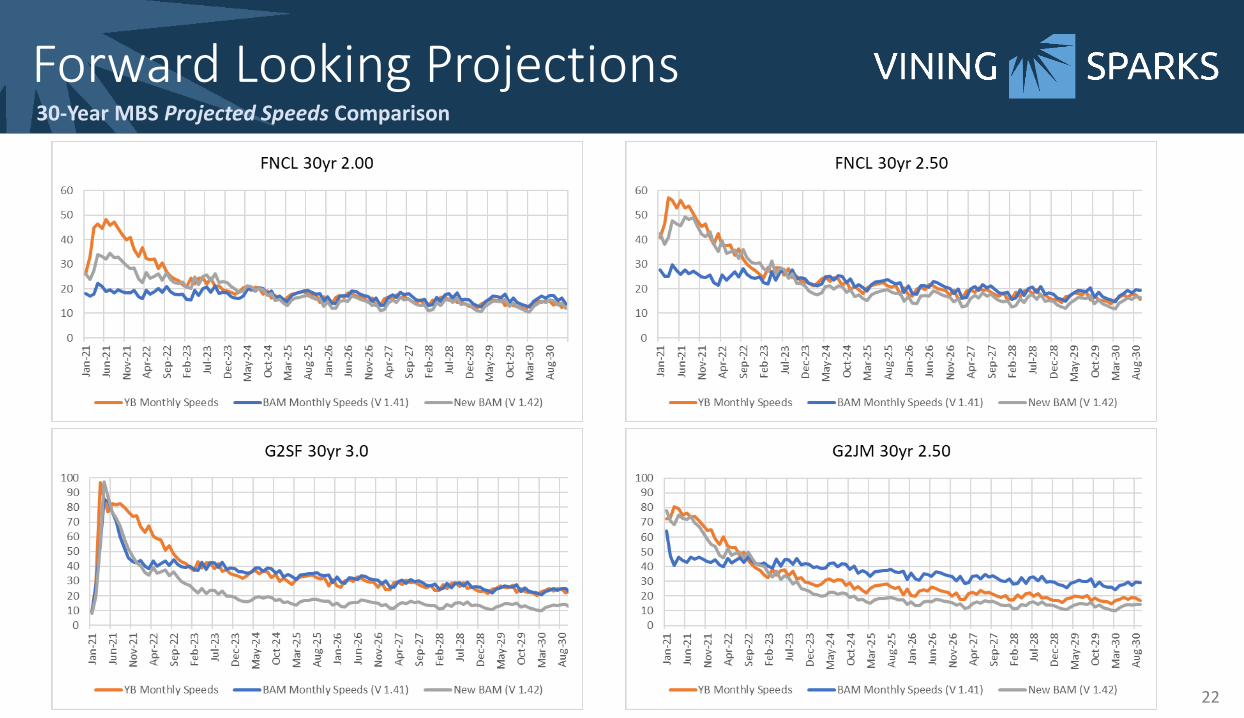
Forward Looking Projections30-Year MBS Projected Speeds Comparison
22
23
Investment ConsiderationsBAM Model update better aligns expectations with reality – does not change strategy of most investors
• Trading extension risk for stable income if rates stay lower for longer, is in favor for most balance sheet structures
• Down in coupon trades• Potential to harvest gains• Use gains to fund penalties on retiring FHLB funding, increase run rate moving forward
• Prepay protection on mortgages include loan balance pools, 100% New York pools, etc
• Cut down coupon CMOs, and lowest production coupons e.g. 15-Year 1.00s and 30-Year 1.50s• Potential for discount prices in some cut coupon CMOs
• Out of sector reinvestment options include Agency callables, same risk-weighting as conventional mortgages, cashflows overall will be more “whippy” but at a price of $100 your income is known for the lockout period, favor longer lockout –still consider bullet structures if spreads on longer lockouts are tight
• Can also consider municipal bonds and corporates, not the same credit profile as Agency MBS, but the addition of credit/liquidity risk adds potential return• Can swap munis to floating and still enjoy a competitive yield today while reducing risk if rates move up

INTENDED FOR INSTITUTIONAL INVESTORS ONLY. The information included herein has been obtained from sources deemed reliable, but it is not in any way guaranteed, and it,together with any opinions expressed, is subject to change at any time. Any and all details offered in this publication are preliminary and are therefore subject to change at any time.This has been prepared for general information purposes only and does not consider the specific investment objectives, financial situation and particular needs of any individual orinstitution. This information is, by its very nature, incomplete and specifically lacks information critical to making final investment decisions. Investors should seek financial advice as tothe appropriateness of investing in any securities or investment strategies mentioned or recommended. The accuracy of the financial projections is dependent on the occurrence offuture events which cannot be assured; therefore, the actual results achieved during the projection period may vary from the projections. The firm may have positions, long or short, inany or all securities mentioned. Member FINRA/SIPC.
I appreciate your time, I know it’s valuable.
Kevin A. Smith, [email protected]
901-766-3075


![[Andrew Davidson & Co] an Implied Prepayment Model for MBS](https://img.dokumen.tips/doc/110x75/546b45e8b4af9f8e2c8b4c09/andrew-davidson-co-an-implied-prepayment-model-for-mbs.jpg)