Embed Size (px)
Citation preview
MBF1223 | Financial ManagementPrepared by Dr Khairul Anuar
L6 - Financial Ratios and Firm Performance
www.notes638.wordpress.com
Reference
• Reference for this topic is
Financial Management
By Raymond Brooks
2

Learning Objectives
1. Create, understand, and interpret common-size financial statements.
2. Calculate and interpret financial ratios.
3. Compare different company performances using financial ratios,
historical financial ratio trends, and industry ratios.
3
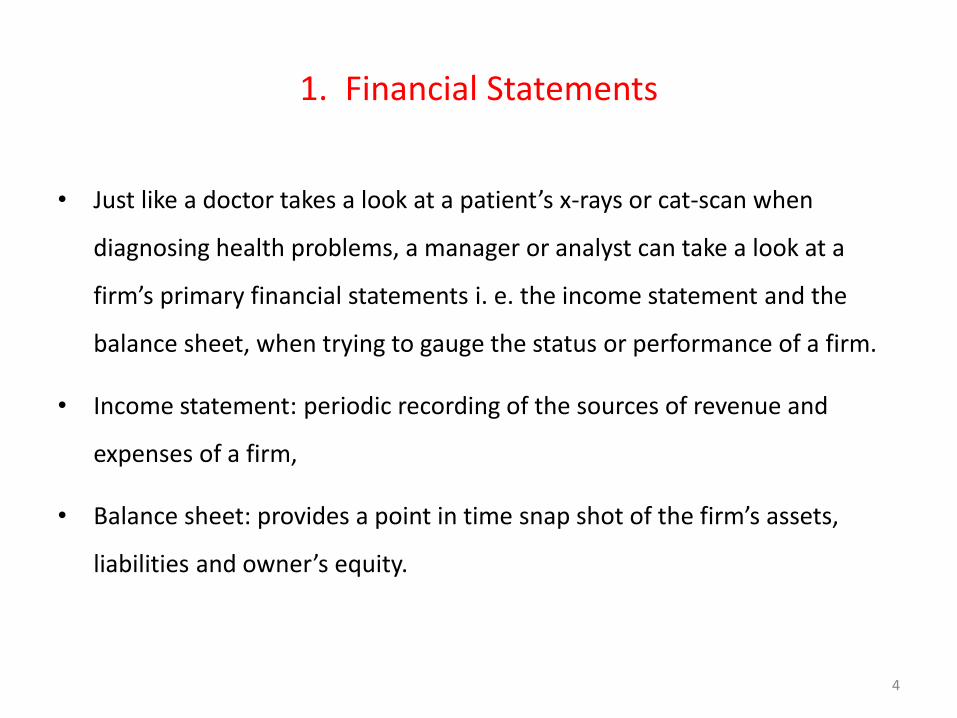
1. Financial Statements
• Just like a doctor takes a look at a patient’s x-rays or cat-scan when
diagnosing health problems, a manager or analyst can take a look at a
firm’s primary financial statements i. e. the income statement and the
balance sheet, when trying to gauge the status or performance of a firm.
• Income statement: periodic recording of the sources of revenue and
expenses of a firm,
• Balance sheet: provides a point in time snap shot of the firm’s assets,
liabilities and owner’s equity.
4

2. Benchmarking
• The financial statements constitute fairly complex documents involving a whole bunch of numbers.
• Absolute values
tell us something about the amount of assets, liabilities, equity, revenues, expenses, and taxes of a firm,
difficult to really gauge what’s going on, primarily because of size and maturity differences among firms.
requires “benchmarking” against some standard.
• One common method of benchmarking a is to compare a firm’s current performance against that of its own performance over a 3-5 year period (trend analysis), by looking at the growth rate in various key items such as sales, costs, and profits.
5

2. Benchmarking
Table: Cogswell Cola’s Abbreviated Income Statements ($ in thousands)
6
2. Benchmarking
• Another useful way to make some sense out of this mess of numbers, is
to re-cast the income statement and the balance sheet into common
size statements, by expressing each income statement item as a percent
of sales and each balance sheet item as a percent of total assets.
7
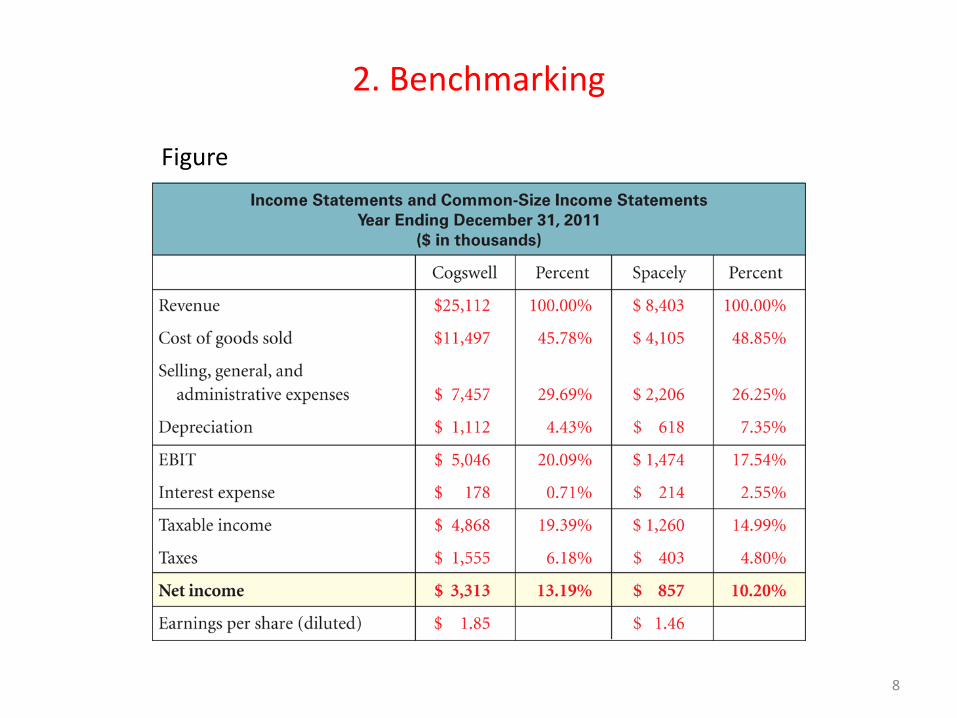
2. Benchmarking
Figure
8

2. Benchmarking
Figure
9
2. Benchmarking
• Benchmarking is a good starting point to detect trends (if any) in a firm’s
performance and to make quick comparisons of key financial statement
values with competitors on a relative basis.
• More in-depth diagnosis requires individual item analyses and
comparisons which are best done by conducting ratio analysis.
10
3. Financial Ratios
• Financial ratios are relationships between different accounts from
financial statements—usually the income statement and the balance
sheet—that serve as performance indicators
• Being relative values, financial ratios allow for meaningful comparisons
across time, between competitors, and with industry averages.
11
3. Financial Ratios
5 key areas of a firm’s performance can be analyzed using financial ratios:
1. Liquidity ratios: Can the company meet its obligations over the short term?
2. Solvency ratios: (also known as financial leverage ratios): Can the company
meet its obligations over the long term?
3. Asset management ratios: How efficiently is the company managing its assets
to generate sales?
4. Profitability ratios: How well has the company performed overall?
5. Market value ratios: How does the market (investors) view the company’s
financial prospects?
# Du Pont analysis involves a breakdown of the return on equity into its three
components, i.e. profit margin, turnover, and leverage.
12
4. Short-Term Solvency: Liquidity Ratios
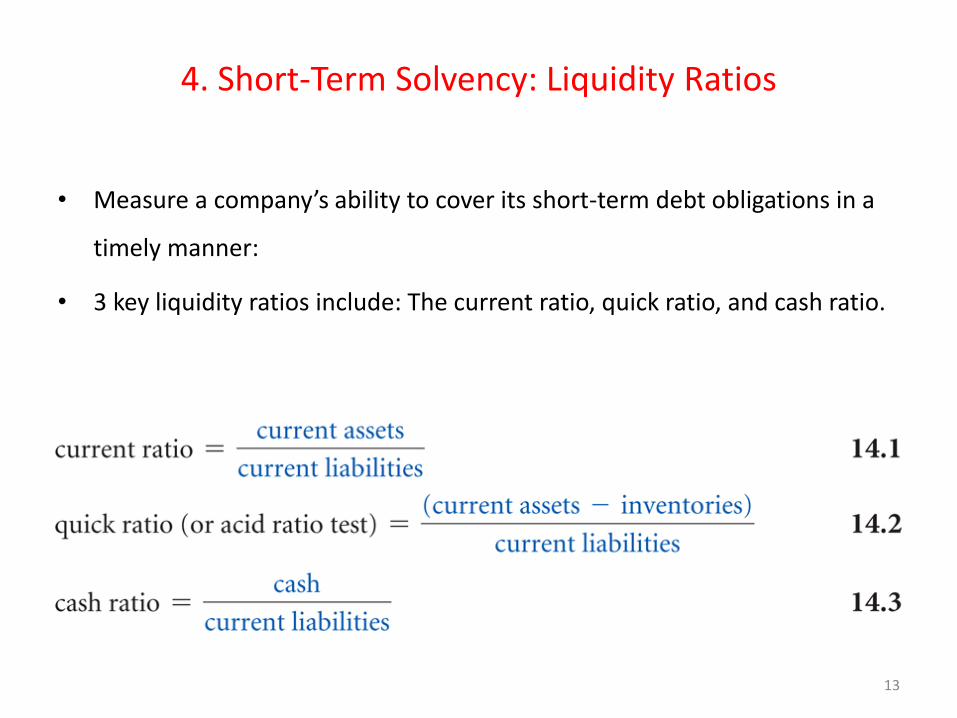
• Measure a company’s ability to cover its short-term debt obligations in a
timely manner:
• 3 key liquidity ratios include: The current ratio, quick ratio, and cash ratio.
13
4. Short-Term Solvency: Liquidity Ratios
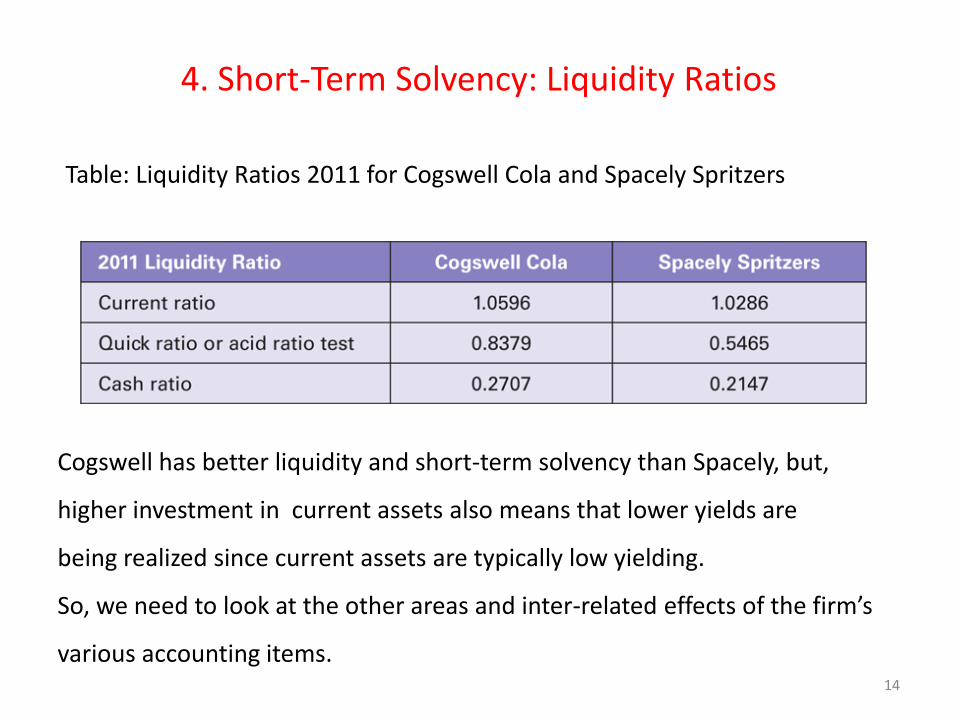
Cogswell has better liquidity and short-term solvency than Spacely, but,
higher investment in current assets also means that lower yields are
being realized since current assets are typically low yielding.
So, we need to look at the other areas and inter-related effects of the firm’s
various accounting items.
Table: Liquidity Ratios 2011 for Cogswell Cola and Spacely Spritzers
14
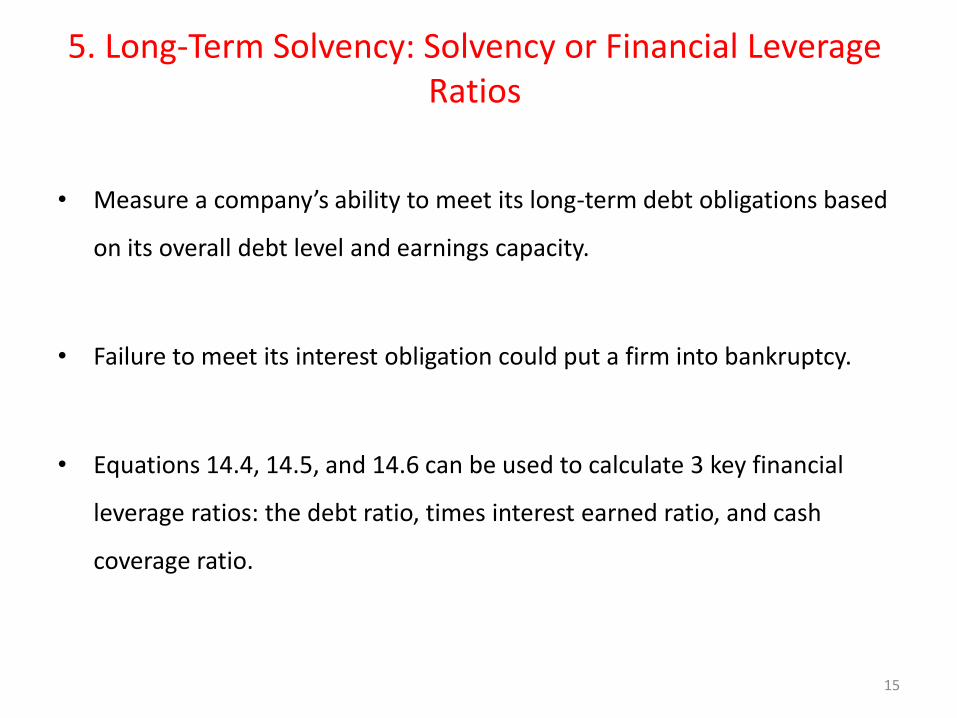
5. Long-Term Solvency: Solvency or Financial Leverage Ratios
• Measure a company’s ability to meet its long-term debt obligations based
on its overall debt level and earnings capacity.
• Failure to meet its interest obligation could put a firm into bankruptcy.
• Equations 14.4, 14.5, and 14.6 can be used to calculate 3 key financial
leverage ratios: the debt ratio, times interest earned ratio, and cash
coverage ratio.
15

5. Long-Term Solvency: Long-Term Solvency: Solvency or Financial Leverage Ratios
16
5. Long-Term Solvency: Long-Term Solvency: Solvency or Financial Leverage Ratios
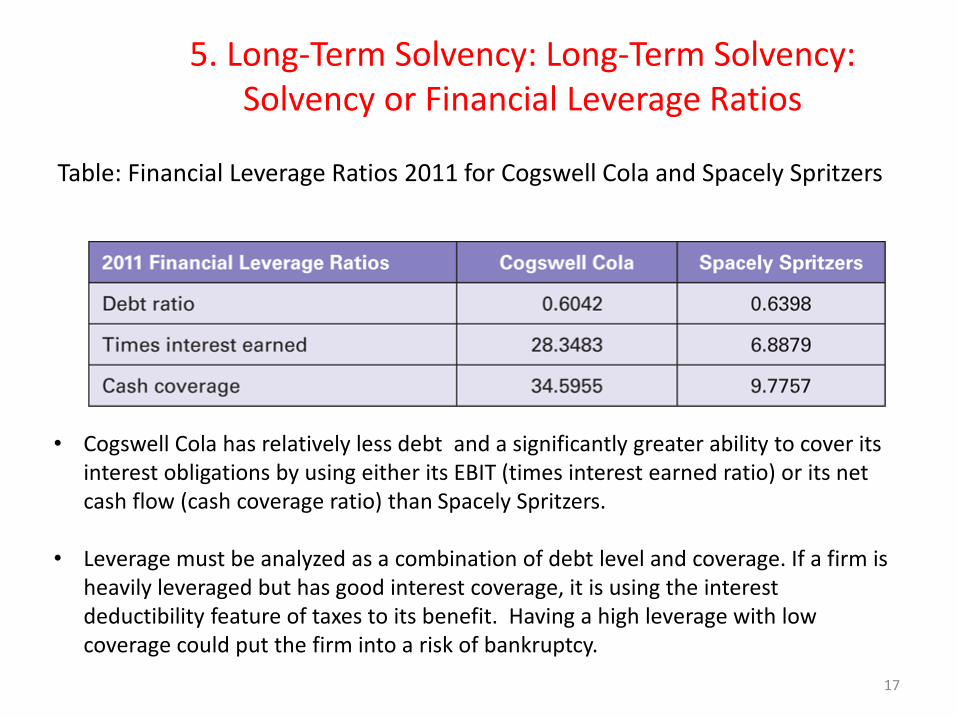
• Cogswell Cola has relatively less debt and a significantly greater ability to cover its interest obligations by using either its EBIT (times interest earned ratio) or its net cash flow (cash coverage ratio) than Spacely Spritzers.
• Leverage must be analyzed as a combination of debt level and coverage. If a firm is heavily leveraged but has good interest coverage, it is using the interest deductibility feature of taxes to its benefit. Having a high leverage with low coverage could put the firm into a risk of bankruptcy.
Table: Financial Leverage Ratios 2011 for Cogswell Cola and Spacely Spritzers
17
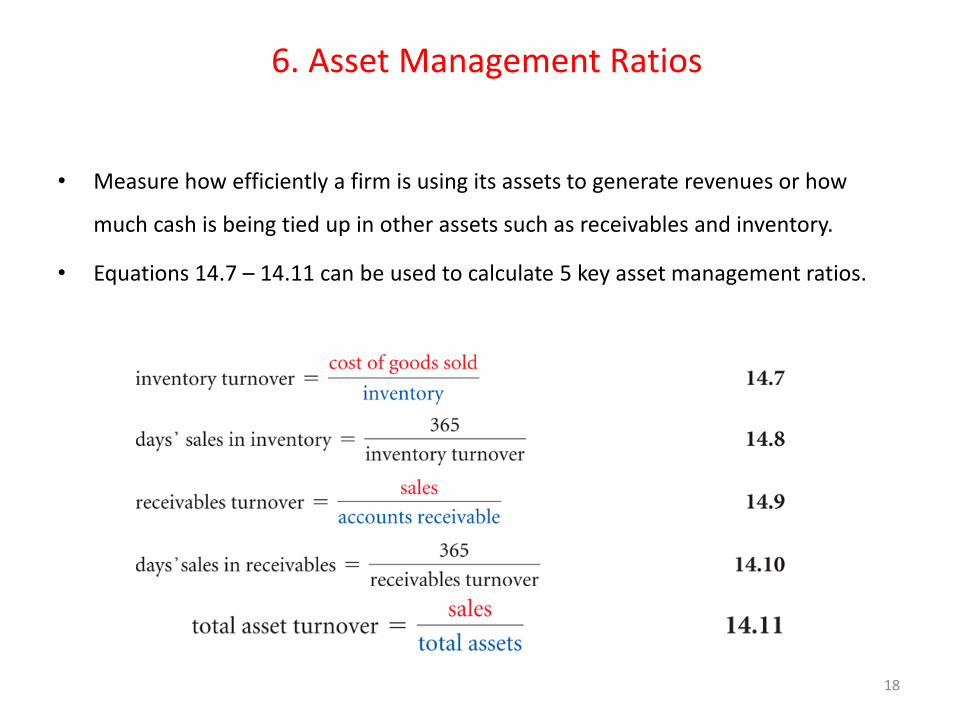
6. Asset Management Ratios
• Measure how efficiently a firm is using its assets to generate revenues or how
much cash is being tied up in other assets such as receivables and inventory.
• Equations 14.7 – 14.11 can be used to calculate 5 key asset management ratios.
18

6. Asset Management Ratios
While Cogswell is more efficient at managing its inventory, Spacely seems to be doing
a better job of collecting its receivables and utilizing its total assets in generating
revenues
Table: Asset Management Ratios 2011 for Cogswell Cola and Spacely Spritzers
19
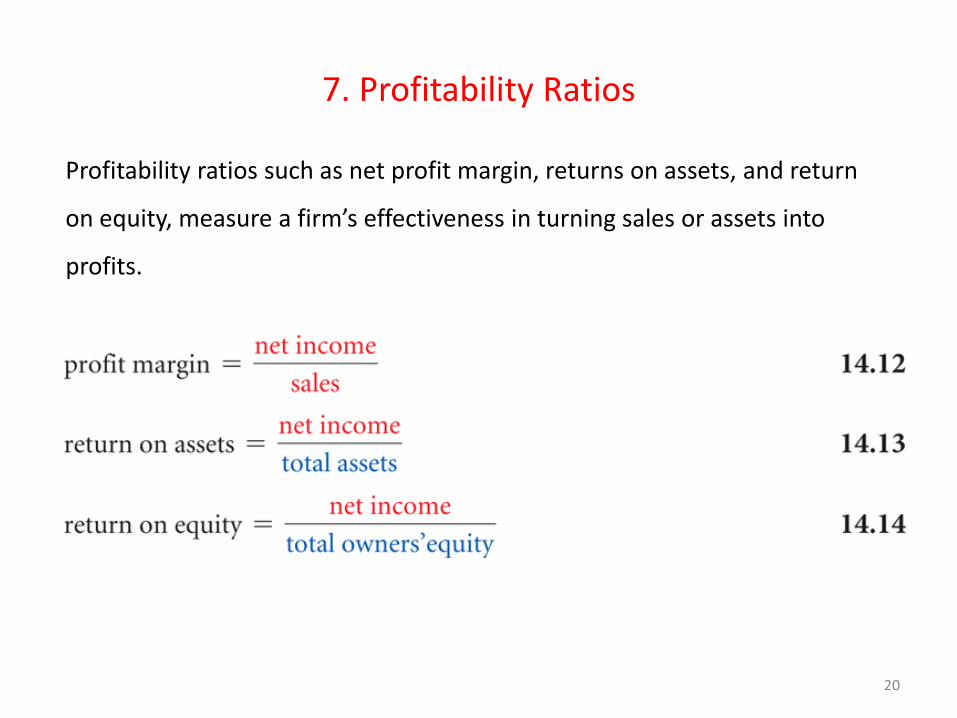
7. Profitability Ratios
Profitability ratios such as net profit margin, returns on assets, and return
on equity, measure a firm’s effectiveness in turning sales or assets into
profits.
20
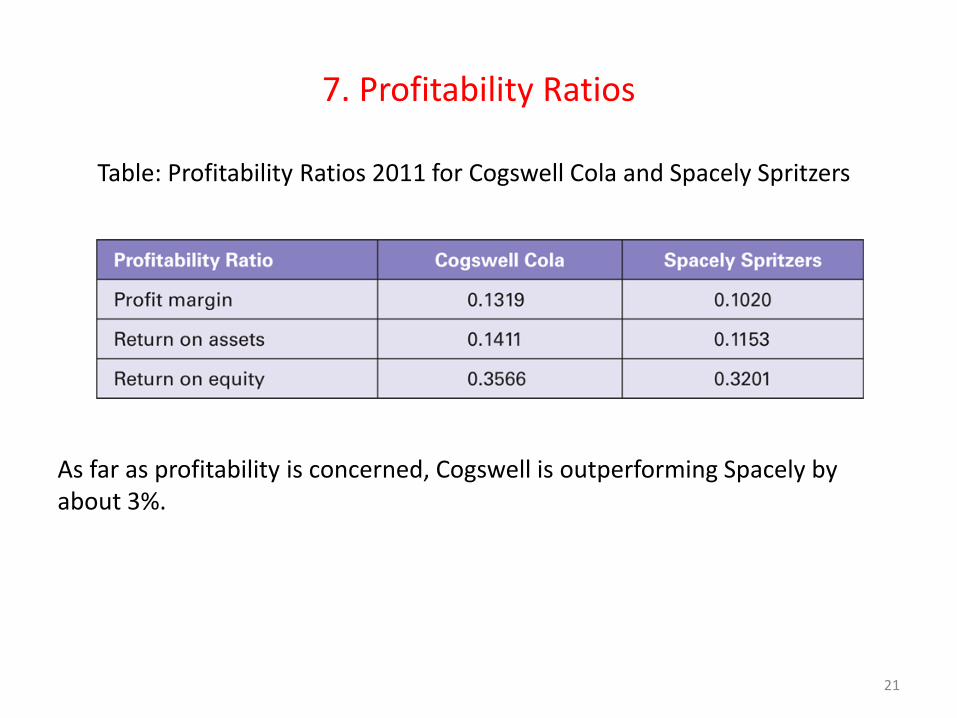
7. Profitability Ratios
As far as profitability is concerned, Cogswell is outperforming Spacely by about 3%.
Table: Profitability Ratios 2011 for Cogswell Cola and Spacely Spritzers
21
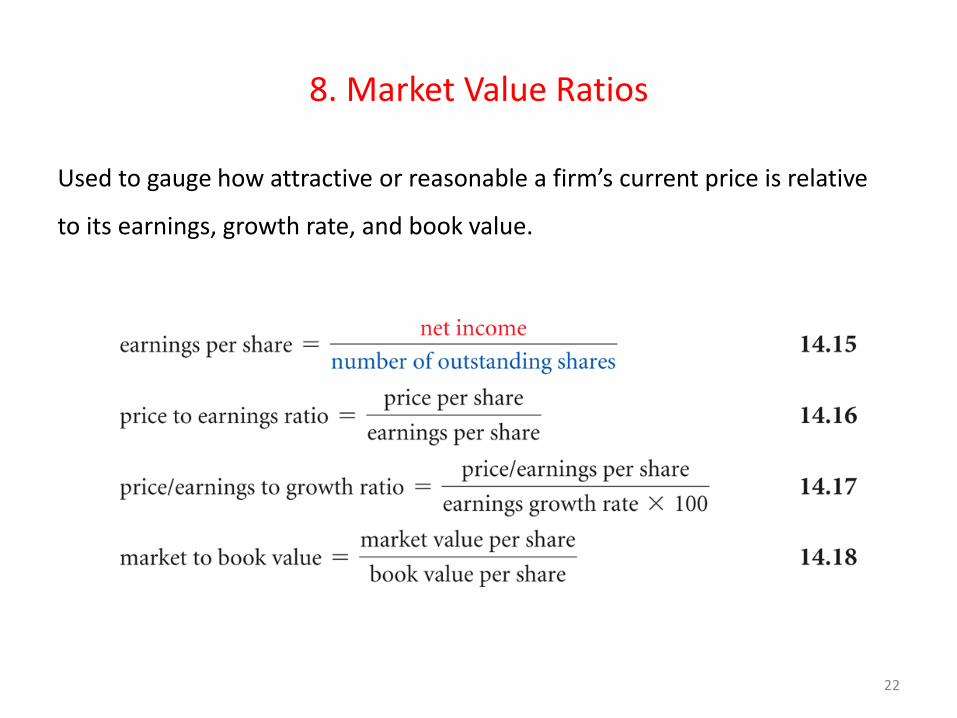
8. Market Value Ratios
Used to gauge how attractive or reasonable a firm’s current price is relative
to its earnings, growth rate, and book value.
22

8. Market Value Ratios
• Potential investors and analysts often use these ratios as part of their valuation
analysis.
• Typically, if a firm has a high price to earnings and a high market to book value ratio, it
is an indication that investors have a good perception about the firm’s performance.
• However, if these ratios are very high it could also mean that a firm is over-valued.
• With the price/earnings to growth ratio (PEG ratio), the lower it is, the more of a
bargain it seems to be trading at, vis-à-vis its growth expectation.
23
8. Market Value Ratios
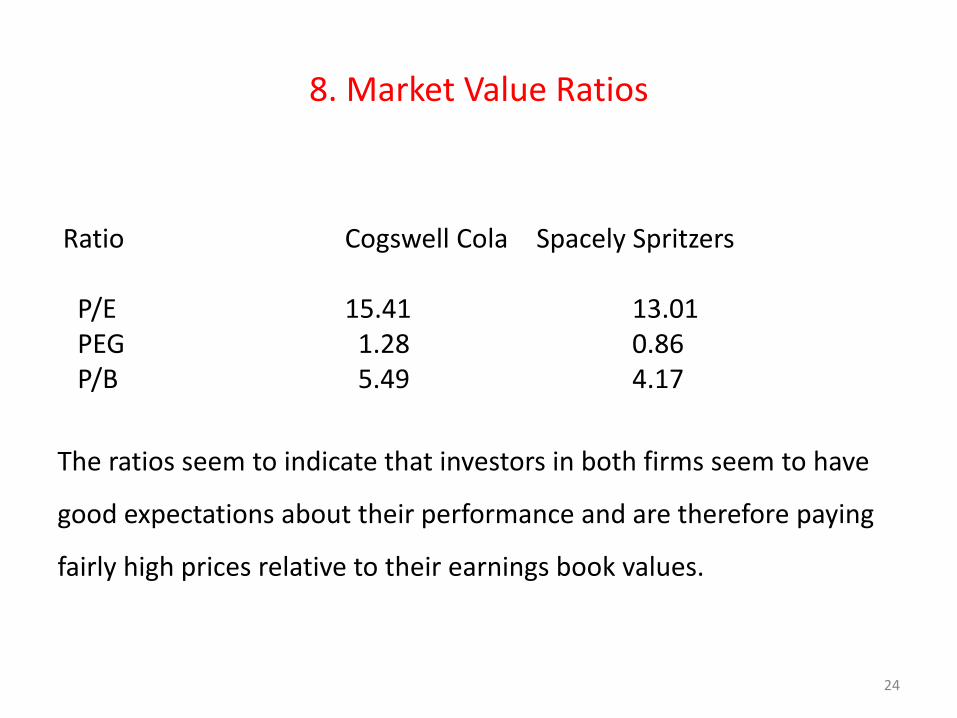
Ratio Cogswell Cola Spacely Spritzers
P/E 15.41 13.01PEG 1.28 0.86P/B 5.49 4.17
The ratios seem to indicate that investors in both firms seem to have
good expectations about their performance and are therefore paying
fairly high prices relative to their earnings book values.
24
9. DuPont analysis
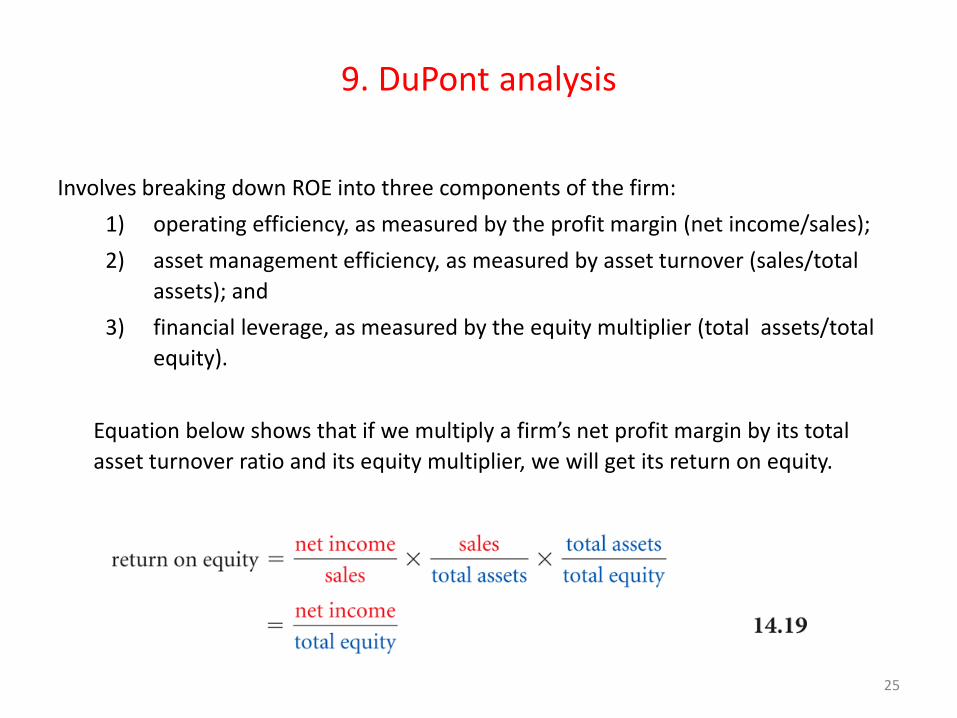
Involves breaking down ROE into three components of the firm:
1) operating efficiency, as measured by the profit margin (net income/sales);
2) asset management efficiency, as measured by asset turnover (sales/total
assets); and
3) financial leverage, as measured by the equity multiplier (total assets/total
equity).
Equation below shows that if we multiply a firm’s net profit margin by its total
asset turnover ratio and its equity multiplier, we will get its return on equity.
25

10. DuPont analysis
• Cogswell has better operational efficiency, i.e. it is better able to move sales dollars into income, but Spritzer is more efficient at utilizing its assets, and since it uses more debt, it is able to get more of its earnings to its shareholders.
• Although these 14 ratios are not the only ones that can be used to assess a firm’s performance, they are the most popular ones.
• It is important to look at the overall picture of the firm in all 5 areas and accordingly reach conclusions or make recommendations for changes.
26
10. External Uses of Financial Statements and Industry Averages
Financial statements of publicly traded companies and industry averages of
key items provide the raw material for analysts and investors to make
investment recommendations and decisions
27
11. Cola Wars
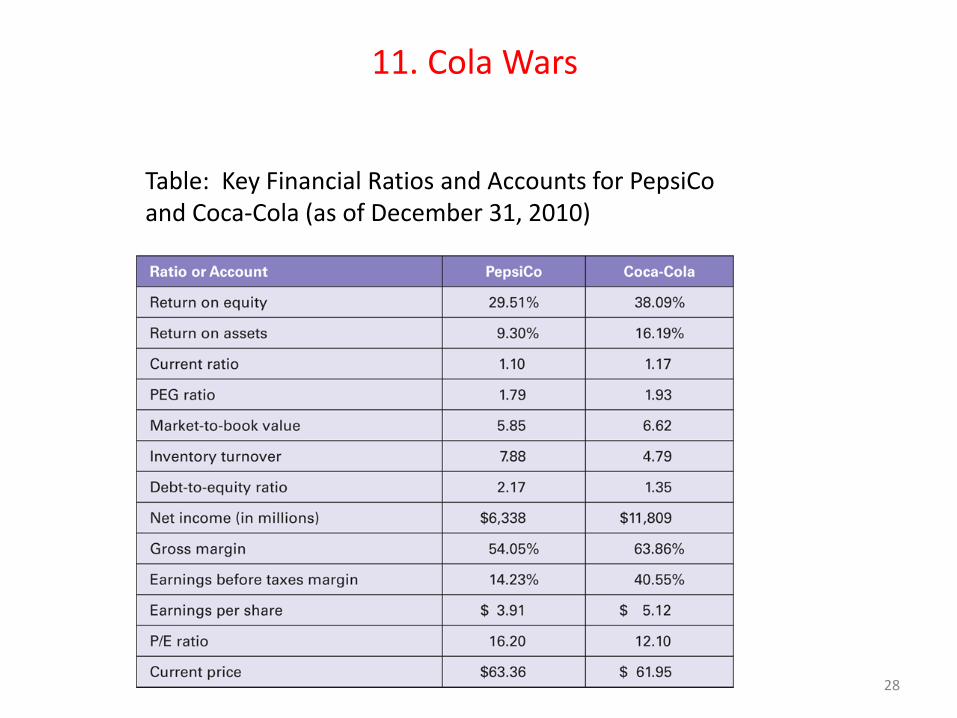
Table: Key Financial Ratios and Accounts for PepsiCo and Coca-Cola (as of December 31, 2010)
28
11. Cola Wars
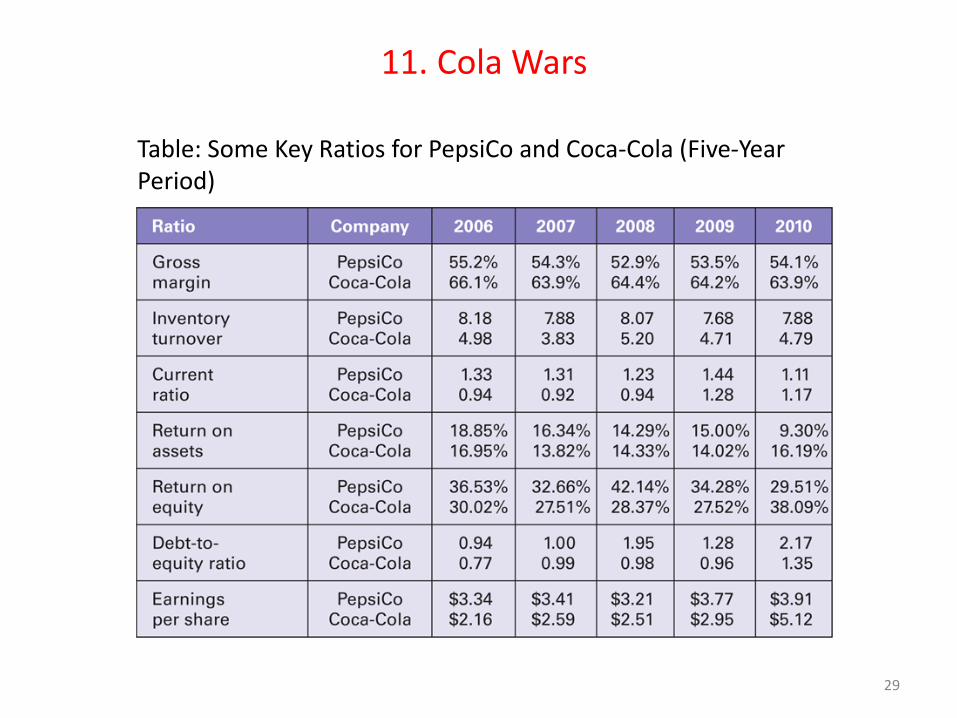
Table: Some Key Ratios for PepsiCo and Coca-Cola (Five-Year Period)
29
11. Cola Wars
• One of the first things we notice in looking over the five years of data is how similar many of the ratios are from year to year, showing remarkable consistency for these two companies.
• We also can see that the gross margin of Coca-Cola is consistently higher than that of PepsiCo.
• The debt to equity ratio of both firms is mostly falling over the five-year period.
• We also can see that ROE has been very good for both companies, although slightly better for PepsiCo.
• Finally, PepsiCo has very strong and growing earnings per share over this period, outperforming Coca-Cola’s EPS, but PepsiCo is also more expensive (higher current price per share).
30

12. Industry ratios:
• Industry ratios are often used as benchmarks for financial ratio analysis of individual firms.
• There can be significant differences in various key areas across industries, which is why comparing company ratios with industry averages can be very useful and more informative.
Table: Financial Ratios: Industry Averages
31

Additional Problems with AnswersProblem 1
Constructing an Income Statement. Using the income and expense account
information for Tri-Mark Products Inc. listed below, construct an income statement for
the year ended 31st December, 2009.
Shares outstanding: 1,575,000
Tax rate: 35%
Interest expense: $3,540,000
Revenue: $950,500,000
Depreciation: $50,000,000
Selling, general, and administrative expense: $85,000,000
Other income: $1,350,000
Research and development: $5,200,000
Cost of goods sold: $730,000,000
32

Additional Problems with AnswersProblem 1 (Answer)
Tri-mark Products Incorporated
Income Statement for the year ended 31st Dec. 2009 ('000s)
Revenue
$ 950,500
Cost of goods sold $ 730,000
Gross Profit $ 220,500
Operating expenses
Selling, general and administrative expenses $ 85,000
R&D $ 5,200
Depreciation $ 50,000
Operating Income $ 80,300
Other Income $ 1,350
EBIT
$ 81,650
Interest Expense $ 3,540
Taxable Income $ 78,110
Taxes $ 27,339
Net Income $ 50,772
Shares Outstanding $ 16,740
EPS
$ 3.03
33

Additional Problems with AnswersProblem 2
Constructing a Balance Sheet. Construct Tri-Mark Incorporated’s 2009 year-end Balance Sheet using the asset, liability, and equity accounts listed below:
Retained Earnings $60,500,000
Accounts Payable $57,000,000
Accounts Receivable $43,000,000
Common Stock $89,676,000
Cash $6,336,000
Short Term Debt $1,500,000
Inventory $42,000,000
Goodwill $30,000,000
Long Term Debt $74,000,000
Other Non-Current Liabilities $15,000,000
PP&E $225,000,000
Other Non-Current Assets $14,000,000
Long-Term Investments $25,340,000
Other Current Assets $12,000,000
34

Additional Problems with AnswersProblem 2 (Answer)
Tri-mark Products Inc.
Balance Sheet as at year ended 31st December 2009 (‘000s)
Liabilities:
Current Assets
Current Liabilities
Cash $6,336
Accounts Payable $57,000
Accts. Rec. $43,000
Short Term Debt $1,500
Inventory $42,000 TOTAL Current Liabilities.
$58,500
Other Current $12,000
Long Term Debt $74,000
Total Current $103,336
Other Liabilities $15,000
L- T Inv. $25,340 Total Liabilities
$147,500 PP&E $225,000
Owner’s Equity
Goodwill $30,000 Common Stock
$189,676 Other Assets $14,000
Retained Earnings
$60,500
Total OE
$250,176 Total Assets $397,676
Total Liab. And OE
$397,676
35

Additional Problems with AnswersProblem 3
• Common size statements: Re-state Tri-Mark Incorporated’s 2009 financial
statements as common-size statements and comment on them
36
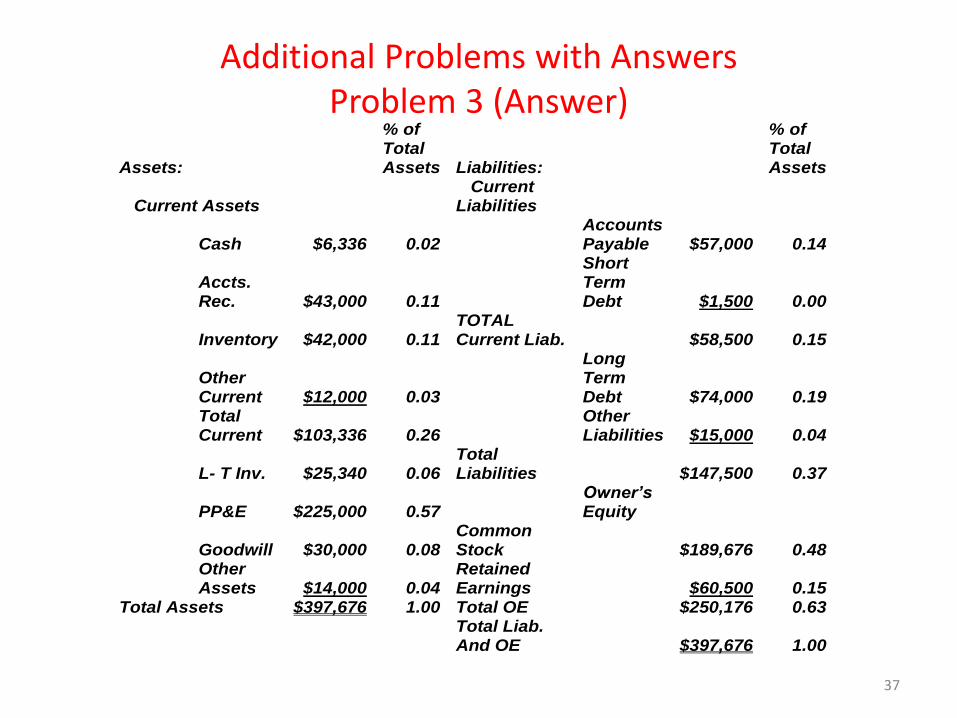
Additional Problems with AnswersProblem 3 (Answer)
Assets:
% of Total Assets Liabilities:
% of Total Assets
Current Assets
Current Liabilities
Cash $6,336 0.02
Accounts Payable $57,000 0.14
Accts. Rec. $43,000 0.11
Short Term Debt $1,500 0.00
Inventory $42,000 0.11
TOTAL Current Liab.
$58,500 0.15
Other Current $12,000 0.03
Long Term Debt $74,000 0.19
Total Current $103,336 0.26
Other Liabilities $15,000 0.04
L- T Inv. $25,340 0.06
Total Liabilities
$147,500 0.37
PP&E $225,000 0.57
Owner’s Equity
Goodwill $30,000 0.08
Common Stock
$189,676 0.48
Other Assets $14,000 0.04
Retained Earnings
$60,500 0.15
Total Assets $397,676 1.00 Total OE
$250,176 0.63 Total Liab. And OE $397,676 1.00
37
Additional Problems with AnswersProblem 4
Compute and analyze financial ratios. Using the 2009 income statement and
balance sheet of Trimark Products Inc., as constructed in problems 1 and 2
above, compute its financial ratios. How is the firm doing relative to its
industry in the areas of liquidity, asset management, leverage, and
profitability?
38
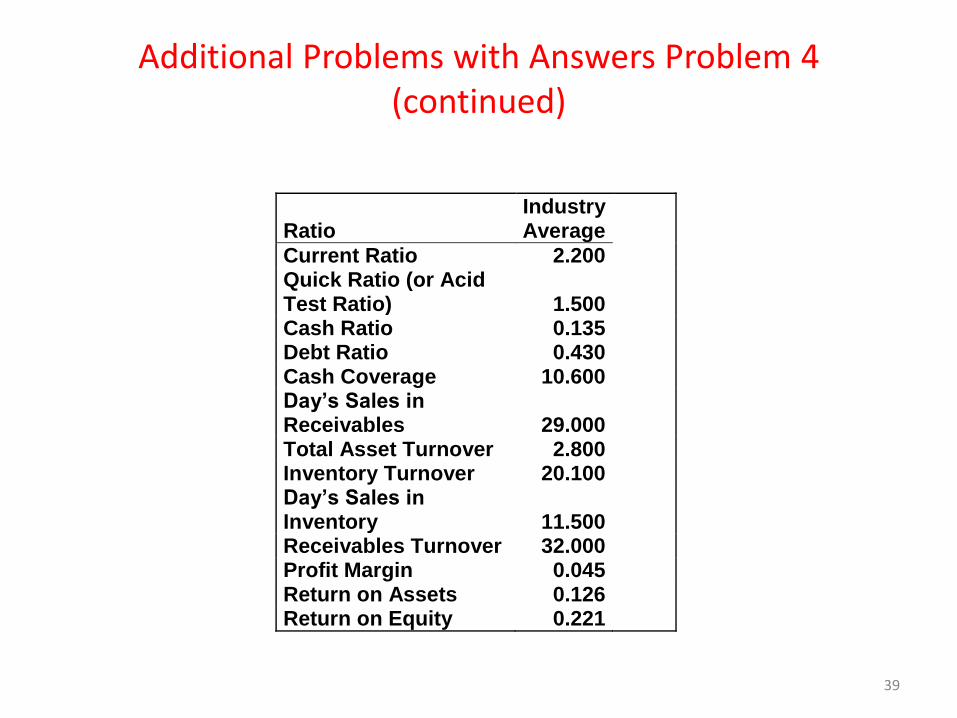
Additional Problems with Answers Problem 4 (continued)
Ratio Industry Average
Current Ratio 2.200 Quick Ratio (or Acid Test Ratio) 1.500 Cash Ratio 0.135 Debt Ratio 0.430 Cash Coverage 10.600 Day’s Sales in Receivables 29.000 Total Asset Turnover 2.800 Inventory Turnover 20.100 Day’s Sales in Inventory 11.500 Receivables Turnover 32.000 Profit Margin 0.045 Return on Assets 0.126 Return on Equity 0.221
39
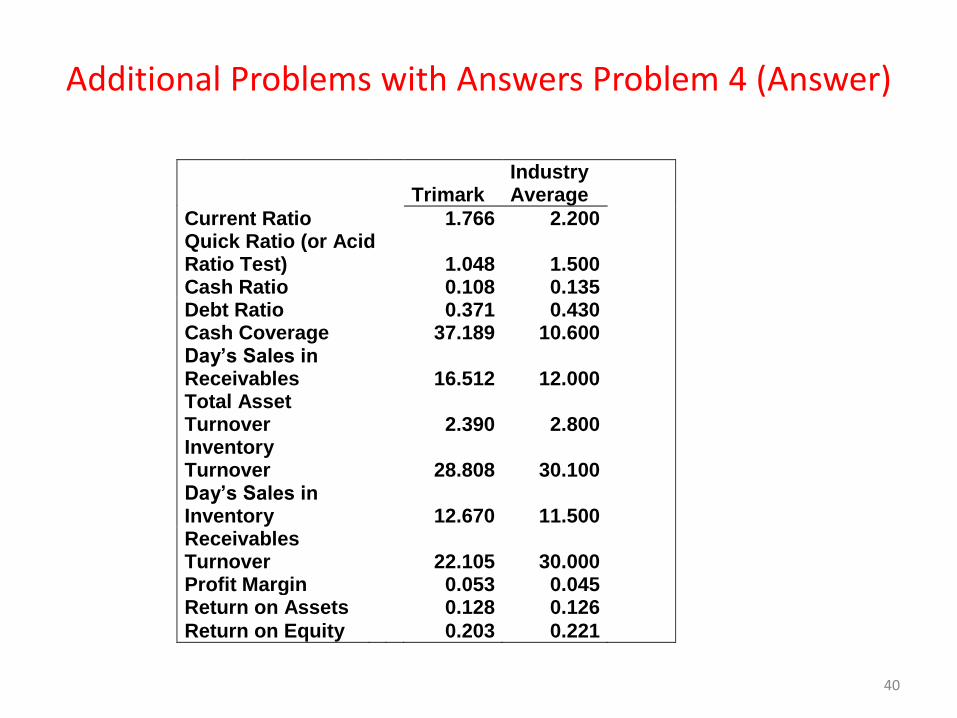
Additional Problems with Answers Problem 4 (Answer)
Trimark Industry Average
Current Ratio
1.766 2.200 Quick Ratio (or Acid Ratio Test) 1.048 1.500 Cash Ratio
0.108 0.135
Debt Ratio
0.371 0.430 Cash Coverage
37.189 10.600
Day’s Sales in Receivables
16.512 12.000
Total Asset Turnover
2.390 2.800
Inventory Turnover
28.808 30.100
Day’s Sales in Inventory
12.670 11.500
Receivables Turnover
22.105 30.000
Profit Margin
0.053 0.045 Return on Assets
0.128 0.126
Return on Equity
0.203 0.221
40
Additional Problems with Answers Problem 4 (Answer) (continued)
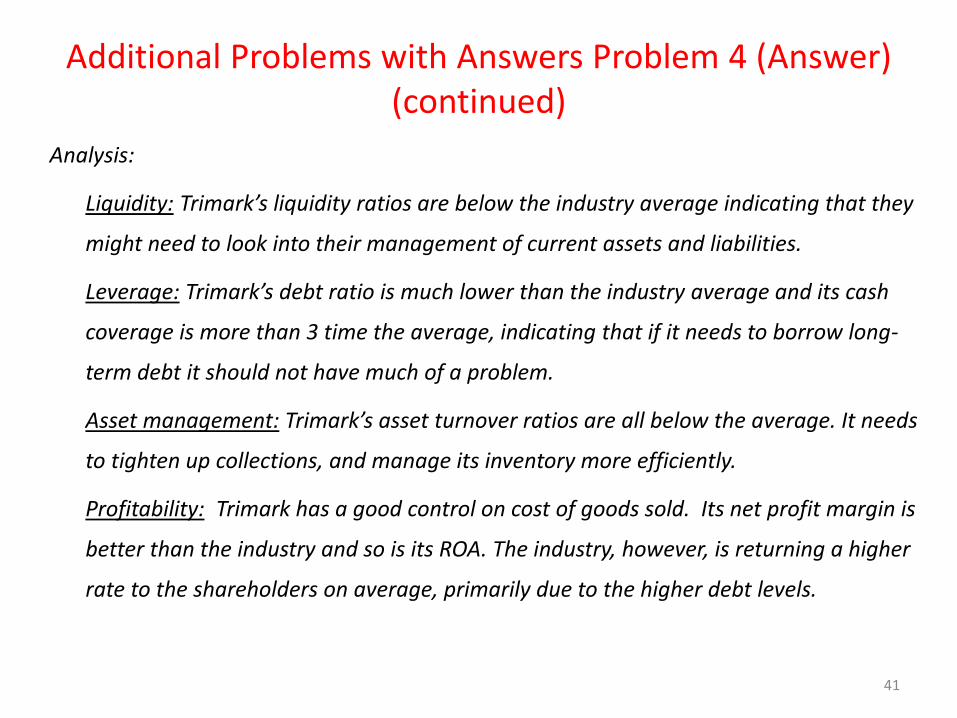
Analysis:
Liquidity: Trimark’s liquidity ratios are below the industry average indicating that they
might need to look into their management of current assets and liabilities.
Leverage: Trimark’s debt ratio is much lower than the industry average and its cash
coverage is more than 3 time the average, indicating that if it needs to borrow long-
term debt it should not have much of a problem.
Asset management: Trimark’s asset turnover ratios are all below the average. It needs
to tighten up collections, and manage its inventory more efficiently.
Profitability: Trimark has a good control on cost of goods sold. Its net profit margin is
better than the industry and so is its ROA. The industry, however, is returning a higher
rate to the shareholders on average, primarily due to the higher debt levels.
41
Additional Problems with AnswersProblem 5
DuPont Analysis. Based on the ratios calculated in problem 4 above, and
in conjunction with the industry averages given, conduct a DuPont analysis
on Trimark’s key profitability ratios.
42
Additional Problems with AnswersProblem 5 (Answer)
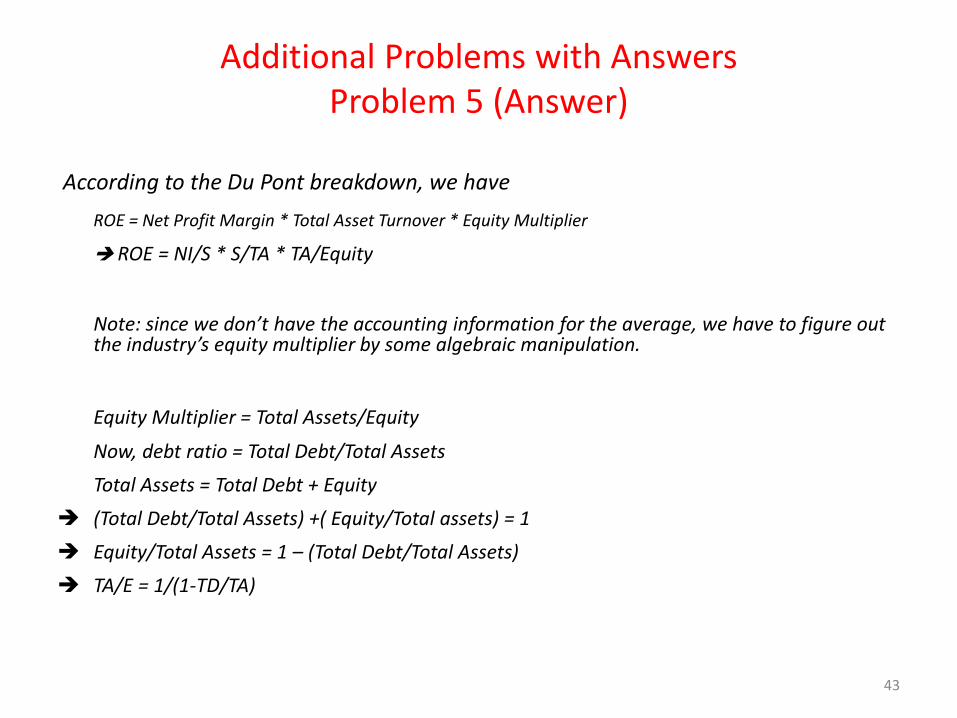
According to the Du Pont breakdown, we have
ROE = Net Profit Margin * Total Asset Turnover * Equity Multiplier
ROE = NI/S * S/TA * TA/Equity
Note: since we don’t have the accounting information for the average, we have to figure out the industry’s equity multiplier by some algebraic manipulation.
Equity Multiplier = Total Assets/Equity
Now, debt ratio = Total Debt/Total Assets
Total Assets = Total Debt + Equity
(Total Debt/Total Assets) +( Equity/Total assets) = 1
Equity/Total Assets = 1 – (Total Debt/Total Assets)
TA/E = 1/(1-TD/TA)
43
Additional Problems with AnswersProblem 5 (Answer) (continued)
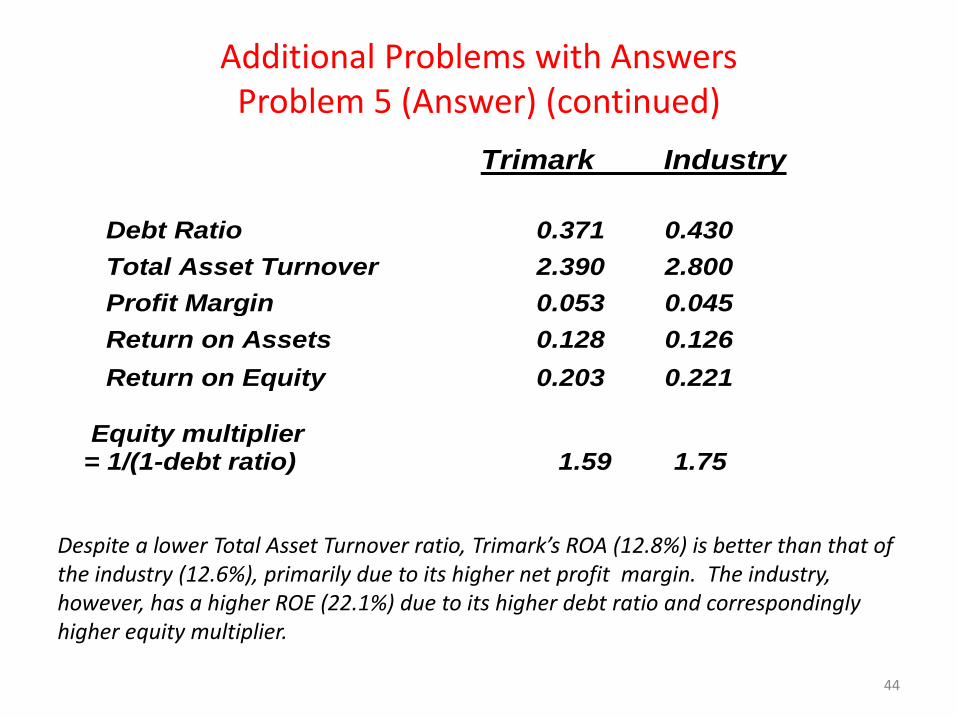
Trimark Industry
Debt Ratio
0.371 0.430
Total Asset Turnover
2.390 2.800
Profit Margin
0.053 0.045
Return on Assets
0.128 0.126
Return on Equity
0.203 0.221 Equity multiplier = 1/(1-debt ratio) 1.59 1.75
Despite a lower Total Asset Turnover ratio, Trimark’s ROA (12.8%) is better than that of the industry (12.6%), primarily due to its higher net profit margin. The industry, however, has a higher ROE (22.1%) due to its higher debt ratio and correspondingly higher equity multiplier.
44
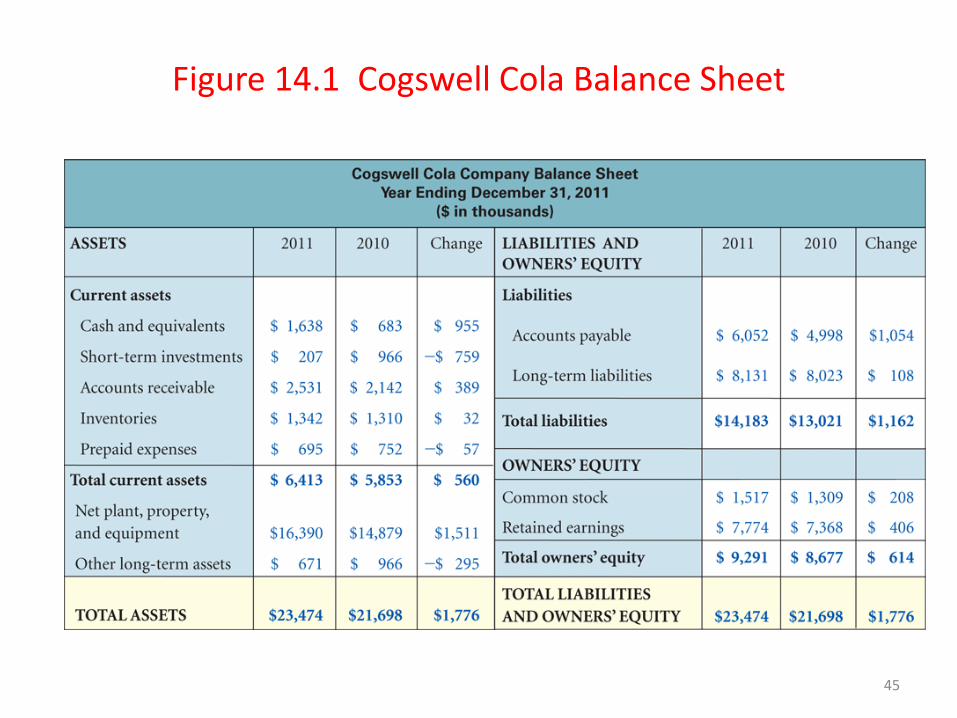
Figure 14.1 Cogswell Cola Balance Sheet
45

Figure 14.2 Cogswell Cola Income Statement
46
Potential problems and limitations of financial ratio analysis
• Comparison with industry averages is difficult for a conglomerate firm that operates in many different divisions.
• “Average” performance is not necessarily good, perhaps the firm should aim higher.
• Seasonal factors can distort ratios.• “Window dressing” techniques can make statements and
ratios look better.

More issues regarding ratios
• Different operating and accounting practices can distort comparisons.
• Sometimes it is hard to tell if a ratio is “good” or “bad”.
• Difficult to tell whether a company is, on balance, in strong or weak position.

Qualitative factors to be considered when evaluating a company’s future financial performance
• Are the firm’s revenues tied to one key customer, product, or supplier?
• What percentage of the firm’s business is generated overseas?
• Competition
• Future prospects
• Legal and regulatory environment