Embed Size (px)
Citation preview
i
MBA VI
Master of Business Administration Program
in
Management and Finance 2009- 2011
IMPROVING CUSTOMER SATISFACTION WITHIN PUBLIC UTILITY COMPANIES
By
ARUN M. BHAGWANDIN
SURINAME
2011
Supervised by
Dr. Mirdita Elstak
This paper was submitted in partial fulfillment of the requirements for the Master of Business
Administration ( MBA) degree at the FHR Lim A Po Institute and the Maastricht School of
Management ( MSM), the Netherlands, December 2011.

ii
ACKNOWLEDGEMENT
First of all I would like to express my sincere gratitude to my supervisor, Dr. Mirdita Elstak, for her
helpful advice during the whole process. Her positive approach kept me motivated during the whole
thesis process. I would like to thank all MBA VI colleague students for the superb time we spent
together during these extraordinary two years. Patricia, Kenneth and Shiefran, you guys are truly
amazing. We spent many hours preparing for exams, motivating each other to carry on, reaching the
finish and having a lot of fun. Thanks for being there for me!
I also would like to thank my colleagues at work, who supported me during this study, especially for
their good suggestions and their help in preparing my thesis.
A word of appreciation goes out to my employer, NV Energiebedrijven Suriname, for providing me the
opportunity to do this study.
I also would like to thank my mother for providing me with the opportunity to study despite all the
difficulties she faced in live. Mama, you are truly the best!
Special thanks, and love goes out to my wife Carol and son Shawn, whose support and understanding
have given me the inspiration to complete this Study.
Arun

iii
ABSTRACT
Customer satisfaction has great value for private as well as public organizations, it is essential for
survival and key for success. Because companies worldwide are facing increasing competition more
attention is being put on customer satisfaction.
This research deals with the impact that service recovery has on satisfaction with service recovery in
Suriname for public utilities operating in a monopolistic market structure. Public utility companies
globally as well as in Suriname are facing changing market conditions. Understanding the customer
and his needs and successfully satisfying those needs are some of the challenges for the public utility
companies. Customer complaints can help to meet this challenge, in order to solve problems and retain
the customer. It is an important source from which companies can learn and improve the product and
service they deliver. Service recovery is identified as a critical instrument in a monopolistic
environment to help improve customer satisfaction.
The aim of this study is to investigate how service recovery affects customer satisfaction in Public
utility companies. With this knowledge public utility companies in Suriname can develop policies and
strategies that can help improve customer satisfaction, which will result in services that are more
aligned with the needs of their customers.
After a research model was developed, data was collected trough a survey that was carried out under
domestic customers of the EBS who live in capital Paramaribo.
The most important outcome of this study is that perceived justice with service recovery does improve
satisfaction with service recovery and that customers value the outcome of the redress seeking the
most. Public utilities in Suriname can design their complaint process in such a way that both the
company and the customer can benefit from it. This result is consistent with other studies carried out in
competitive markets elsewhere. This research has shown that in the present context corporate image
does not moderate the relationship between perceived justice with service recovery and satisfaction
with service recovery.

iv
The outcome of this research contributes to important knowledge, that support the need for public
utilities in Suriname to start incorporating these practices in their organizations, especially those
companies that are facing changing market situations in the near future.

v
Table of content
ACKNOWLEDGEMENT ........................................................................................................................ ii
ABSTRACT ............................................................................................................................................. iii
CHAPTER I: INTRODUCTION .............................................................................................................. 1
1.1 Introduction .................................................................................................................................................... 1
1.2 Importance and relevance of the subject area ................................................................................................. 3
1.3 Problem definition .......................................................................................................................................... 4
1.4 The research objectives .................................................................................................................................. 5
1.5 Research Questions ........................................................................................................................................ 6
1.6 Research Methodology ................................................................................................................................... 6
1.7 Research limitations ....................................................................................................................................... 7
1.8 Generalizability .............................................................................................................................................. 7
CHAPTER II: LITERATURE REVIEW ................................................................................................ 8
2.1. Introduction ................................................................................................................................................... 8
2.2 Customer satisfaction ..................................................................................................................................... 8
2.2.1 The importance of customer satisfaction for organizations ................................................................... 10
2.2 Customer complaint behavior ....................................................................................................................... 10
2.3.1 Types of complaint responses ................................................................................................................ 11
2.3.2 Antecedents to complaint behavior ....................................................................................................... 13
2.3.3 Effects on companies if customers do not complain ............................................................................. 15
2.3.4 Influence of customer complaint behavior on customer satisfaction .................................................... 16
2.4 Customer satisfaction in public utilities in Suriname ................................................................................... 17
2.4.1 Service recovery theories ....................................................................................................................... 18
2.4.2 Results from satisfaction with service recovery .................................................................................... 21
vi
2.4.3 Corporate image .................................................................................................................................... 22
2.5 Conceptual model ......................................................................................................................................... 23
CHAPTER III: RESEARCH METHODOLOGY .................................................................................. 26
3.1 Introduction .................................................................................................................................................. 26
3.1.1. The EBS ................................................................................................................................................ 27
3.2 Research approach ........................................................................................................................................ 28
3.3 Research strategy .......................................................................................................................................... 28
3.3.1 The survey ............................................................................................................................................. 29
3.4 Validity and reliability .................................................................................................................................. 31
3.4.1 Validity .................................................................................................................................................. 31
3.4.2 Reliability .............................................................................................................................................. 31
3.5 Data gathering .............................................................................................................................................. 32
3.6 Data analysis ................................................................................................................................................. 36
CHAPTER IV: RESEARCH FINDINGS............................................................................................... 38
4.1 Introduction .................................................................................................................................................. 38
4.2 Descriptive analyses ..................................................................................................................................... 38
4.3 Hypothesis testing ........................................................................................................................................ 43
4.3 Additional analysis ....................................................................................................................................... 52
CHAPTER V: DISCUSSION ................................................................................................................. 57
5.1 Introduction ................................................................................................................................................. 57
5.2 Main findings ............................................................................................................................................... 58
5.2.1. Customer satisfaction is critical for PU‟s ............................................................................................. 59
5.2.2 Customers value the outcome of the process more than the treatment ............................................... 61
5.2.3 Corporate image does not seem to matter when it comes to the impact of service recovery on
satisfaction ...................................................................................................................................................... 62
5.3 Answers to research question ....................................................................................................................... 63
5.4 Conclusion .................................................................................................................................................... 64
vii
5.5 Recommendations ........................................................................................................................................ 65
5.6 Limitation and implication for further research............................................................................................ 67
GLOSSARY............................................................................................. Error! Bookmark not defined.
LIST OF ABBREVIATIONS ................................................................................................................. 69
LIST OF FIGURES ................................................................................................................................ 72
LIST OF TABLES .................................................................................................................................. 73
BIBLIOGRAPHY ................................................................................................................................... 74
APPENDICES ........................................................................................................................................ 80
Appendix A: Regression analysis exclusive moderating variable ...................................................................... 80
Appendix B: Regression analysis inclusive interaction term distribution justice * corporate image ................. 81
Appendix C: Regression analysis inclusive interaction term informational justice * corporate image ............ 82
Appendix D: Regression analysis inclusive procedural justice * corporate image ........................................... 83
Appendix E: Regression analysis inclusive interaction term interactional justice * corporate image ............... 84
Appendix F: Regression analysis for model summary ....................................................................................... 85
Appendix G: Questionnaire ................................................................................................................................ 86

viii
This page is intentionally left blank

1
CHAPTER I: INTRODUCTION
1.1 Introduction
Nowadays, customers are more demanding towards companies because of the increased
abundance of choices. Customers have become increasingly critical of corporate actions and more
demanding of marketplace reforms. Because industries and firms worldwide are facing more
intense competition, slower growth rates, and pricing pressures, more attention is being placed on
customer satisfaction. Customer satisfaction is an important determinant of customer retention
which has a very strong effect on profitability ( Reichheld and Sasser 1990). It plays a very
prominent role in marketing policy and public policy formulation ( Fornell and
Wernerfelt1987,1988;Simon 1974). This thesis interprets satisfaction as a feeling which results
from a process of evaluating what was received against what was expected, the purchase decision
itself and/or the fulfillment of needs and wants ( FecỈikovaẮ, 2004).
To be able to increase customer satisfaction it is important that organizations conduct sound
research in this field. Customer satisfaction research helps to identify how companies are
performing from the perspective of the customer. It gives the company the opportunity to
understand how their customers are experiencing the level of service they are providing, and it
further provides very valuable information, such as, highlighting an area where the product or
service needs improving.
Increasingly, public service providers have come to realize that they must provide products and
services that are soundly based on their customer needs. As a response to these developments,
many providers are directing their strategies towards increasing customer satisfaction.
The trend in the world regarding public utilities is favoring trade openness, deregulation of
markets and further retreat of states from economic activities. Public utilities in different Latin
American countries, such as Suriname, are facing challenges of deregulation, privatization and
increasing customer demands ( Inter American Bank publication, reference no. IFM- 127,
February 2002). In this thesis public utilities are defined as organizations that provide services to
the general public such as water, energy, telecommunication and transportation
(Investorwords.com, 2011).

2
This research will not focus on the products that public utilities provide but on the services that
are very critical in the value creating process.
In many developing countries such as Suriname, Public Utilities are government owned and they
mostly operate as a monopolistic company. Some of the public utilities in Suriname are indirectly
protected by the government against competition, because competition in the market is not
allowed yet. These state owned monopolies have market power which gives them little incentives
to improve the quality of their services.
Increasingly, utility companies have come to realize that customer satisfaction has great value for
them, even if they are operating in a regulated market (Elliot and Serna, 2005). It is essential for
survival and key for success. Customer satisfaction has become an important indicator of quality
and future revenue of a company. We experience that customer expectations are changing
upwards, with a higher emphasis on the quality of services (Donnelly and Shui 1999). Service
levels that were accepted a generation ago are no longer acceptable for the current generation.
Companies will have to improve their products and services accordingly if they want to keep their
customers satisfied.
“The best thing a company can do is to make it easy for customers to complain. Listening is not
enough, however. The company must respond quickly and constructively to complaints”( Kotler,
2003,p.73). Customer complaints can help solve the problem and retain the customer. Customer
complaints are an important source from which companies can learn, resolve the root cause and
improve the product and service (Brouwn et al, 1996, McCollough et al, 2000; Priluck and Lala,
2009, Vos et al, 2008). In this thesis the following is meant with customer complaints: multiple
sets of behavior and non- behavioral responses, triggered by a unsatisfactory purchase episode
(Singh, 1990a). Traditionally companies are focused on improving customer satisfaction through
a positive point of view, by focusing on elements like service quality, price and innovation.
Different research (Brown et al, 1996; McCollough et al, 2000; Priluck and Lala, 2009; Vos et
al,2008) state that customer complaints are an important source of market intelligence which
companies should use to learn from. There has been little research into the characteristics of

3
complainers in governmental monopolistic services (Bard Tronvoll, august 2006). Especially in
monopolistic utility companies, customers do not have the opportunity to withdraw from the
relationship. Also these companies do not have many other options to improve customer
satisfaction. In these circumstances customer complaints are an effective tool for service recovery,
which can lead to improvement of customer satisfaction and an opportunity for the customers to
express their opinion to the company.
1.2 Importance and relevance of the subject area
We recently have experienced the liberalization of the telecom market in Suriname for example.
Telesur, the former monopolist in the telecom market had no choice than to become a customer
oriented company in order to compete with the two other players that had been allowed in the
market. The former monopolist‟s main goal has become to satisfy or, better yet, delight their
customer in order to survive in this new competitive environment. In recent years the Surinamese
government has allowed the stateoil power company to enter the energy market. They have been
granted permission to generate energy and sell this to the EBS, this is the start of upcoming
changes in the energy market.
Improving customer satisfaction within public utility companies in Suriname is a challenge,
because these companies are 100% government owned and are mostly operating as a monopolist.
In general these companies do not face competition, and create insufficient incentives to guide
resource allocation based on customer preferences. But changes are ahead, the current government has
mentioned a regularity board for the electric utility sector (annual speech of the President of Suriname,
October 2010).
The level to which companies are capable of satisfying their customers is an indication of its
general health and its future prospects (Claes Fornell,1992). It is therefore of great importance
that public utility companies develop policy and strategies to improve customer satisfaction,
which will result in products and services that, are more aligned with the needs of their customers.
Understanding the customer and his needs and successfully satisfying those needs are some of the
challenges for the public utility companies in entering a new future of higher customer demand,
deregulation and competition.

4
This study will be conducted within the public Electricity Company in Suriname. According to
the Maslow theory electricity is a basic good that mostly is experienced as a dissatisfier.
Customer‟s satisfaction does not necessarily increase when the utility companies deliver energy
of better quality. The customers simply expect these companies to deliver the products 24/7, and
nothing less. As mentioned earlier the focus in this thesis will be on services that create great
value in the relationship between the public utility company and the customers rather than the
product they deliver.
Although knowledge about customer satisfaction in general exists, there is need for research
about the impact that customer complaints which leads to a service recovery has on customer
satisfaction in public utility companies. It will provide knowledge about the customers view and
opinion about the company and the services they provide. This is especially relevant in a process
of transformation from a monopolistic environment to an environment of increasing customer
demand and upcoming deregulation and competition. In this process of change it is also important
for the public utilities to research what the customers‟ perception is about their corporate image
and what influence this has on the organization. Corporate image works as a filter through which
an organization‟s whole operation is perceived, it reflects a company‟s overall reputation. It
impacts the customer‟s evaluation of service quality, satisfaction and loyalty. With this
knowledge these companies will be able to use service recovery1 more effectively and use this
information further as a vital source in service development and value creation.
1.3 Problem definition
As competition increases globally and customers become more demanding, the emphasis on
customer satisfaction has increased for business organizations. Different literature studies in the
field of customer satisfaction have shown that customer satisfaction has a substantial impact on
financial health and results of companies.
Because customers of public utility companies also demand the best product and services from
these companies and competition and deregulation have been introduced into this market,
1 Service recovery can be defined as the provider’s action when something goes wrong (Gronroos, 1988).
5
customer satisfaction has also become critical for these companies. Not only the products public
utility companies deliver such as water, electricity and telephone communication are important,
mostly these are not the issues customers are dissatisfied about. Moreover the services that are
provided by the public utility companies are essential for the customer. Poor services provided
have a major impact on customer satisfaction for public utility companies. Some of the important
services provided by these companies are billing, managing outages, opening hours of their
offices, connections and claims. From the literature review it became clear that for monopolistic
public utility companies customer‟s voice is an important instrument that can be used to improve
customer satisfaction. Customer complaints and the service recovery that follows thereafter are
opportunites for both the customer and the company to gain profits by.
Given the information above the following problem statement is formulated:
How can service recovery help improve customer satisfaction within public utility companies?
1.4 The research objectives
The main purpose` of this study is to research how service recovery affects customer satisfaction
in Public utility companies. The following objectives were formulated:
- To determine how customer complaint behavior in public utility companies in Suriname
influences customer satisfaction;
- To determine which variables influence customer satisfaction the most in the case of
public utilities in Suriname;
- To assess how service recovery can improve customer satisfaction for public utility
companies in Suriname.
A model will be presented with which public utility companies can assess which elements of
service recovery affect customer satisfaction the most.
With these results service recovery strategies can be adjusted and customer satisfaction can be
improved. Further the outcome of this study can be used by monopolistic utility companies in the
transformation process from monopolist to a more customer focused utility, facing higher
customer demand, deregulation and competition.
6
1.5 Research Questions
Based on the research objective of this study the following research questions will be studied:
The main research question of this study is: How does service recovery influence customer
satisfaction in public utility companies?
The following sub research questions will be answered:
What are the most important determinants of customer complaint behavior in PU‟s?
How does service recovery impact customer satisfaction in PU‟s?
What moderating roles does organizational image play in the relationship between perceived
justice of service recovery and customer satisfaction?
1.6 Research Methodology
To conduct this research a quantitative research method will be applied and the research approach
will be a deductive study. With this approach hypotheses will be tested in order to answer the
research questions.
This study will focus on the domestic customers of the Energiebedrijven Suriname (from now on
mentioned as the EBS) in Paramaribo, the capital of Suriname.
A questionnaire will be developed to investigate how complaining customers perceive service
recovery. With the information gained this research will try to reveal how service recovery
potentially improves satisfaction for public utility companies in Suriname.
Regression analysis will be used to identify the relationship between the dependent and
independent variables. Regression analysis is applied to understand how the value of the
depended variable (perceived customer satisfaction with service recovery) changes when any of
the independent variables vary.
7
1.7 Research limitations
This research is subject to the following limitations:
- This study will be conducted at the EBS. This can be seen as a limitation because there
can be some specific characteristics within the EBS that cannot be translated to other
PU‟s. But in the author‟s opinion, on the other hand, there are many similarities, such as
type of company and global and regional trends that are applicable for other PU‟s and that
this study has an implication that goes beyond the EBS.
- A questionnaire will be carried out in Paramaribo, were more than 65% of the customers
of the EBS live. This can be seen as a limitation, but at the same time the researcher does
not expect the results of the study to be different if the survey was carried out in more
cities, because more than 65% of the domestic customers live in Paramaribo.
1.8 Generalizability
This study can be relevant for other monopolistic utilities that are facing a transformation process
of increasing customer demands, upcoming deregulation and competition, especially when the
application of traditional customer satisfaction variables is not a suitable option. The research
can be added to broader research of customer complaints in regard to public utilities. It can be
consulted by others that are planning to study customer complaints or are facing similar problems
from a management perspective.

8
CHAPTER II: LITERATURE REVIEW
2.1. Introduction
This chapter will give an overview of literature and models regarding customer satisfaction,
customer complaint behavior and service recovery. Different concepts of customer satisfaction,
customer complaint behavior and service recovery will be discussed in order to give a clear idea
about the research area of this study.
First the importance of customer satisfaction will be explained, followed by the importance of
customer complaints behavior. Further the elements that determine customer complaint behavior
will be discussed. After this the importance of service recovery that is initiated by a complaint
will be discussed. Finally the relationship between service recovery and satisfaction with service
recovery will be reviewed in the context of monopolistic public utility companies.
2.2 Customer satisfaction
In the literature there are two main interpretations of satisfaction. Satisfaction as a process and
satisfaction as an outcome of a customer experience (Parker and Mathews, 2001). Customer
satisfaction as a process is defined as an evaluation between what the customer received and what
the customer expected (Oliver, 1977, 1981;Olson and Dover, 1979;Tse and Wilton, 1988),
emphasizing the perceptual, evaluative and psychological processes that contribute to customer
satisfaction ( Vavra, 1997, p.4). This approach is the most widely adopted description of customer
satisfaction and many research studies have been conducted to understand the process approach of
satisfaction (Parker and Mathews, 2001).The process approach has its origin in the discrepancy
theory, which argues that satisfaction is determined by the perception of a difference between a
standard and the actual performance ( Porter, 1961). If the customer‟s expectation is fulfilled, the
customer is satisfied, if not, dissatisfaction occurs. The confirmation/ disconfirmation paradigm
provides the grounding for the vast majority of customer satisfaction studies (Caruana et al.,
2000).
9
The early concepts of customer satisfaction studies have defined satisfaction as a post choice
evaluation judgment regarding a specific purchase decision ( Oliver, 1980, Churchill and
Suprenant, 1992; Bearden and Teel, 1983; Oliver and De- Sarbo, 1988).
The outcome approach of satisfaction is defined as the end- state satisfaction which is the result of
a consumption experience. It can be the outcome that occurs without comparing expectations
( Oliver, 1996) or a cognitive state of reward, or an emotional response that may have occurred as
the result of the comparison between expected and actual performance or the comparison of
reward and costs to the anticipated consequences (Vavra,1997,p.4).
In other streams of research the focus has been on the nature of customer satisfaction in relation
with emotion, fulfillment and state (Parker and Mathews, 2001). In addition to this, some scholars
argue that although traditional models assume that customer satisfaction is essentially the
outcome of cognitive processes, there are suggestions that affective processes can also contribute
substantially to prediction and explanation of customer satisfaction (Fornell and Wernerfelt, 1987;
Westbrook, 1987; Westbrook and Oliver, 1991). In different study‟s authors also argue that
satisfaction should not be viewed as a transaction- specific phenomenon but as a judgment that is
based on the cumulative experience that is made with a certain product or service (Wilton and
Nicosia, 1986).
In this thesis satisfaction is interpreted as a feeling which results from a process of evaluating
what was received against what was expected, the purchase decision itself and/or the fulfillment
of needs and wants ( FecỈikovaẮ, 2004). The study will be built on the concept of the process
approach of satisfaction.
The relevance of this definition to this study is mainly that it indicates that customers of public
utility companies not only assess the purchased product but also the additional services provided
as an overall experience during the whole process.
10
2.2.1 The importance of customer satisfaction for organizations
Many studies have been conducted about customer satisfaction in the past decades. These studies
emphasize the importance of satisfaction for organizations from different angles. Satisfied
customers tend to maintain their consumption pattern or consume more of the same product or
service. Satisfaction has become an important indicator of quality and future revenue of a
company (Anderson, 1998). It influences purchasing behavior and satisfied customers tend to be
loyal customers, but loyal customers are not necessarily satisfied, especially in PU‟s where they
have no choice but to remain loyal. Research further shows that market share and customer
satisfaction are positively correlated ( Fornell, 1992).) Satisfied customers are more likely to have
a greater repurchase level and recommend the product and service to their acquaintances
(Zeithhamel et al, 1999). Because competition has entered the utility sector and customers
demand also has increased, customer satisfaction has become an important factor for PU‟s. In
order to compete and survive in the changing market, PU‟s must intensively focus on satisfaction.
2.2 Customer complaint behavior
Customer complaint behavior is a “process that emerges if the service experience lies outside the
customer‟s acceptance zone during the service interactions or in the evaluation of the service – in
– use”, (Tronvoll, 2008, p.8). In order to initiate a complaint, the customer must have experienced
a critical incident which triggers a complaint process. The initiated complaint process is being
influenced by different resources such as type of product, time, money, complaint channels,
Tronvoll (2008). Therefore, customer complaint behavior cannot be seen as a simple expression
or negative feelings during and after the consumption or usage of goods and services. Customer
complaint behavior must be seen as a behavioral process that occurs during the service
interaction, Tronvoll (2008).
Customer complaints can be considered as a phenomenon with which organizations have to deal
with in one way or another. From the perspective of the customer it can be stated that customer
complaint should be facilitated and it must motivate organizations to find a solution of some kind
for the customer. The emergence of complaints could be a start for organizations for analysis,
improvement or elimination of some practices that may have caused this complaint.
11
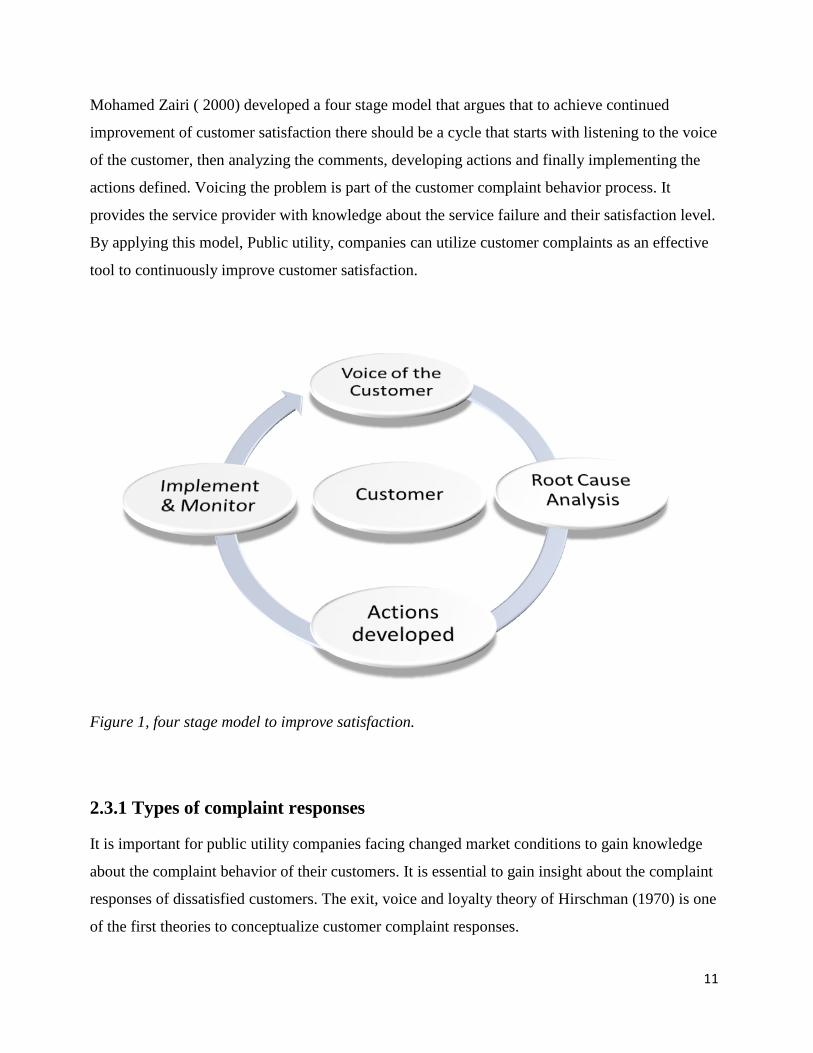
Mohamed Zairi ( 2000) developed a four stage model that argues that to achieve continued
improvement of customer satisfaction there should be a cycle that starts with listening to the voice
of the customer, then analyzing the comments, developing actions and finally implementing the
actions defined. Voicing the problem is part of the customer complaint behavior process. It
provides the service provider with knowledge about the service failure and their satisfaction level.
By applying this model, Public utility, companies can utilize customer complaints as an effective
tool to continuously improve customer satisfaction.
Figure 1, four stage model to improve satisfaction.
2.3.1 Types of complaint responses
It is important for public utility companies facing changed market conditions to gain knowledge
about the complaint behavior of their customers. It is essential to gain insight about the complaint
responses of dissatisfied customers. The exit, voice and loyalty theory of Hirschman (1970) is one
of the first theories to conceptualize customer complaint responses.
12
When critical service failures occur dissatisfied customers‟ responses (coping strategies) can be as
follow;
- Take no action;
- Negative word of mouth ( negative WOM) about the company;
- Directly complain to the company;
- Complain to a third party.
Taking no action
Many customers remain silent when service failures occur. The different antecedents discussed in
paragraph 2.3.2 have an influence on these customers their complaint behavior. Some customers
evaluate the cost of complaining versus the benefits of the outcome. The opportunity to solve the
problem is lost when the customer fails to voice the service failure. The reputation of the provider
can be harmed from negative word of mouth among the different dissatisfied customers.
Negative word of mouth
Customers can decide to spread their dissatisfying experiences with their social network. A
(Worth of mouth) WOM message has the potential to reach many receivers through various
exchanges. Negative WOM provides the dissatisfied customer with an outlet, the customer can
vent its negative emotions (Zeelenberg and Pieters, 2004). The emergence of the social media has
increased the impact of WOM, damaging the image of company‟s and PU‟s.
Third party complaint
A third party complaint indicates that the dissatisfied customer turns to an external agency to file
a complaint. Complaining to a third party is important because it represents a higher order action
than the other three coping strategies ( Feick, 1987). If the customers do not get a satisfactory
response they may choose to complain to consumer protection organizations and other
governmental protection departments. While a small number of dissatisfied customers use this
form, the cases they redress tend to be very serious and are highly damaging for the companies
( TARP, 1985), and leading to potential financial risk.
13
Directly complaining to the company (voice)
Voicing their dissatisfaction is a highly active form of complaining. Compared to the other coping
strategies, voicing is least harmful for providers, because it provides the service provider with
customer feedback with which it can improve product and service quality ( Fornell and
Wernerfelt, 1987). The customers decision to voice indicate that they belief that the company can
and will try to solve the problem (McKee et al, 2006). It is also possible that customers can use
multiple coping strategies.
Customer complaint behavior has been given extensive attention in this chapter because of its
importance for the customer and the service provider. To be able to improve customer satisfaction
within monopolistic public utility companies, understanding customer complaint behavior is
essential and can be seen as the starting point of this process. Customer complaint behavior and
its effect on customer satisfaction is the context in which this study is conducted. This study starts
with the effects of customer complaint behavior on customer satisfaction and focuses further on
the service recovery process. After the customer voices the service failure, the service provider is
able to act in a proper way. This statement emphasizes once again that the service recovery
process starts after the service provider gains knowledge of the failure.
2.3.2 Antecedents to complaint behavior
The confirmation/ disconfirmation paradigm provides the conceptual foundation on which the
study of Customer Complaint Behavior is built (Blodgett and Granbois,1992),. The confirmation/
disconfirmation paradigm is an evaluative process by which the consumer compares the
performance of a product or service with its initial expectation. Many studies have been
conducted to reveal the antecedents of customer complaint behavior Tronvoll ( 2008).
These studies argue that it is possible to categorize the factors that influence customer complaint
behavior into four main constructs:
14
Situational factors
These factors assume that dissatisfied customers objectively evaluate the level of service failure,
what the cost and benefit will be of complaining and the probability of success. Customers
complain because of two reasons (Hirschmann, 1970):
- an assessment by the customer about the probability that the company would take action
to correct the addressed problem and
- an assessment by the customer if it is worth to complain to the company.
Based on these factors the dissatisfied customers decide whether or not to complain.
Different studies show that the majority of dissatisfied customers don‟t voice their complaints
to the company (Best and Andreasen, 1977).
Individual factors
These factors drive or restrain dissatisfied customers for taking action because of the kind of
people they actually are. Younger people are expected to have a higher complaint level than older
people. Customers with a higher educational level are known to complaint easier than customers
with a lower education level ( Gronhaug and Zaltman ,1980). The subcategories of individual
factors are psychological, demographical, personality, emotional, social, cultural and experience.
Provider/ service factors
This factor assumes that the service failure is related to the service provider or the service. The
type of organization, its reputation, responsiveness, friendliness and the promptness of the
employees are important factors. The subcategories are service provider and the service itself.
Market factors
Market factors may encourage complaint behavior and competition increases consumer
satisfaction (Johnson, 1998). The subcategories are market and market structure. There is
evidence that market structure has an influence on complaint behavior (Hirschman, 1970;
Andreasen, 1985; Singh, 1990b, 1991; Kolodinsky, 1993, 1995),. In a competitive market
structure there are a large number of buyers and a large number or sellers, each buyer or seller is
relatively small compared to the total market. If any individual increases or decreases purchase or
output, this does not affect the balance in the market ( Tronvoll, 2007,p.36). The low switching
15
barrier in the market can lead the customer to switch to another provider if the provider attempts
to increase the price or if, in the perception of the customer, the quality of the product or service
decreases. Companies will do their upmost to satisfy the customer in a competitive market,
because dissatisfied customers have the opportunity to switch to another provider if the provider
does not respond sufficiently to the service failure.
A monopolistic market structure has a large number of buyers but only one supplier. The
individual buyer is very small compared to the supplier and is not able to affect the total demand
in the market. Because there is no other alternative, a decrease in quality does not lead to any
decrease in demand (Tronvoll, 2007, p.36).
In a monopolistic market structure, customer complaint behavior appears to follow a “different set
of rules” from those operating in a competitive market, Tronvoll, 2008. Public services are known
to have a higher rate of dissatisfaction than other services and products ( Day and
Bodus,1977;Fornell et al.,1996;Johnson et al.,2002). Given that dissatisfaction is an important
condition for complaints, Singh, 1991 and Kolodisnky, 1995 argue that customer complaints are
low in monopolistic markets which are characterized by no or little competition. This illustrates
that consumers who wish to complain in a monopolistic market have to overcome some barriers
which do not seem to appear in the competitive market. Because there are no alternatives, a
change in the quality does not lead to a change in the demand. The provider does not necessarily
take corrective steps because the possibility to switch to another provider is not available.
The analysis of public utility services has been rather unexplored in publications. The main reason
for this can be that, globally public utility companies have had national or regional monopoly,
circumstances that did not force these companies to apply marketing- based approach. As PU‟s
globally are facing challenges of deregulation, privatization and increasing customer demands
studying services of these PU‟s are gaining more value.
2.3.3 Effects on companies if customers do not complain
A customer that fails to complain about the perceived service or product failure is in fact a
concern for any company because the company misses the opportunity to obtain valuable
feedback with which it can solve the problem and retain the customer.
16
Consider the following facts:
- Customers with problems mostly do not react and only 2% complain about it;
- A customer with a problem tells it to 9 other people;
- Satisfied customers tell this to 5 other people;
- Keeping a current customer costs about 1/7 of the total cost of acquiring a new one (Keki,
1995, p.28).
It is frequently stated that a lack of customer feedback from dissatisfied customers is a potential
loss of current and potential future customers. This makes it important to understand the customer
by gaining more knowledge about the customer complaint process. As argued earlier the market
situation of PU‟s is changing. It is not only about loyalty, repurchase opportunities and customer
retention. The opinion of the public is becoming important also. In the past years we notice that
angry and frustrated customer‟s voice their negative experience through the internet creating huge
damage to the image of the providers.
2.3.4 Influence of customer complaint behavior on customer satisfaction
Perceived service failure experienced by customers is a great concern for companies because of
the impact it has on the outcome of products or services. When a service failure is experienced the
customer can choose to exit, voice (complain), complain to a third party or do nothing. Customer
complaints allow companies to get customer feedback which in return can be used in making
improvements to increase customer satisfaction, loyalty, long-term sales and profits, (Fornell and
Wernefelt, 1987).
Effective handling of customer complaints and associated problems can have a positive impact on
customer trust and commitment towards companies (Tax et al. (1998). Complaint handling is seen
as a vital “moment of truth” in maintaining and developing customer relationships (Berry and
Parasuraman 1991, Dwyer et al.1987). A complaint of a customer and a poor handling of a
service recovery have a major impact on company‟s financial future. Therefore it is important to
get feedback from customers through customer‟s complaints.
17
Public utility companies worldwide are changing their attitude because they are increasingly
operating in deregulated markets. Countries like the UK and the United States of America as a
result of liberalization started to develop their own marketing strategies.
In markets with state regulated prices and monopolies, consumers had cheap access to the
services, but on the other hand they were defenseless against the service providers. Companies
that still have partial monopoly face new challenges. Utility companies have become to realize
that there is competition and that this competition will become sharper.
2.4 Customer satisfaction in public utilities in Suriname
The market place sends out two kinds of signals about unsatisfactory performance to public
policy makers as well as marketers, these are exit2 and voicing
3 ( Hirschman ,1970). Hirschman
states further that exiting behavior is the classic “invisible hand”, when working well, it signals
the need for intervention. Voicing becomes important when exiting is impossible or when the
customers doesn‟t get the restitution he thinks he‟s entitled to.
Service failures are inevitable, they are not avoidable even for the best performing organizations.
The effective management of customer responses to service failures is very important, especially
when customers do not have an opportunity to switch to another provider. In the service failure
context, service recovery can be seen as a second service encounter. In competitive markets,
negative service failures can cause the defection of customers that are becoming more intolerant
of mediocrity. Understanding the service recovery process has become very important. A service
failure can destroy customers‟ loyalty, but successful implementation of service recovery
strategies may prevent customers‟ defection ( Lewis and Spyrakopoulos, 2001). It is important for
organizations to understand which factors make service recovery programs successful. For public
utility companies in Suriname service recovery can become an important instrument in increasing
customer satisfaction. After customers perceive a problem which means that their expectations
were not met, then they obtain another set of expectations – service recovery expectations ( Lewis
and Spyrakopoulos, 2001). A positive service recovery, in other words, when expectation of the
2 Dissatisfied customer decides not to shop again and take their business somewhere else , Hirschman ( 1970).
3 Complain about the dissatisfaction to the seller, Hirschman, (1970).

18
service recovery is exceeded, will increase customer satisfaction. But, if the service recovery
negatively confirms to the expectation of the customer, this will reduce customer satisfaction.
This indicates that in the context of service failures, followed by a service recovery, customer
satisfaction also results from an evaluation process. The customer compares their recovery
expectation with their perception of the recovery received.
In monopolistic markets, service recovery is an effective option to satisfy customers when they
complain about service failure.
Electricity for instance is a commodity and has few specialties‟ when comparing with other
services. Customers belief that electricity is a naturally given supply, they rarely compare the
benefits with its price, it has a continuous supply and the quality has not been changed since its
invention. These factors lay the emphasis for these kind of utilities increasingly on the services
provided rather on the product itself ( Hetesi and Reketteye, 2002).
2.4.1 Service recovery theories
Customers voicing their dissatisfaction with poor services give these service providers the chance
to recover these service failures. What is done (the compensation) and how it is done (the
employee interaction with the customer) influences the customers perception of the service
recovery ( Andreassen,2000). Although managers realize how important service recovery is for
customer retention, how to do this effectively remains a challenge.
Initial dissatisfaction leads to a cognitive appraisal, which in return will determine what the
customer will do (Kim, Wang and Mattila, 2010). Complaining to a third party, doing nothing,
spreading negative information about the company (negative word- of- mouth) are different ways
the customer can choose to deal with the dissatisfaction, yet they are not likely to lead to probable
service recovery. But voicing the dissatisfaction directly to the company will create an
opportunity for service recovery.
The fairness theory can be seen as the dominant theoretical framework applied to service recovery
(Tax and Brown, 2000) This theory relates to the perceived fairness of a transaction ( Boote,
1998). Equity is experienced when the relative inputs and outputs from the two parties involved in
the transaction are perceived to be equal. When customers experience a perceived inequity in the
19
exchange they become disappointed, regretful or upset, which can lead to customer complaints.
Afterwards, customers make their judgment based on the level to which the service recovery
process was fair and these judgments influence their satisfaction ( Chebat and Slusarczyk, 2005).
Customers mostly evaluate the fairness of a service recovery by four factors:
- The fairness of the decision making criteria, the policies and procedures used to generate
the final outcome ( procedural justice);
- The fairness and appropriateness of the generated tangible outcome ( distributive justice) ;
- The information provided about the causes of the service failure (informational justice)
and
- The way in which the service complaint handling process is carried out (interactional
justice), (Tax and Brown ( Chebat and Slusarczyk, 2005n, 199; Tax et al., 1998).
Procedural justice
Procedural justice is the customers‟ perception of fairness about the policies, procedures and
different criteria used by the company, which led to the outcome (Blodgett et al, 1998). There are
five elements on procedural justice: process control, decision control, timing/speed, accessibility
and flexibility ( Laventhal et al ( 1980). Procedural justice is important in service recovery
because customers might be satisfied with the service recovery, but could be still unhappy,
because the process endured to seek redress was dissatisfying (Kelly et al, 1993). The speed with
which the problem is solved is an important element of procedural justice. Therefore, it can be
expected that the longer it takes to solve the problem the more the customer‟s perception that
procedural justice was violated. If the dissatisfied customer experiences the redress seeking
process positively, this influences the satisfaction level of the customer. As one of the important
elements of the service recovery process the following hypothesis is formulated to measure the
influence that procedural justice has on satisfaction with service recovery:
H0: Procedural justice in service recovery does not have a positive impact on customer
satisfaction with service recovery.
H1: Procedural justice in service recovery has a positive impact on customer satisfaction with
service recovery.
20
Distributive justice
Distributive justice is primarily concerned with the outcome of the recovery seeking process. It is
about the effort the service provider made to solve the customer‟s problem and whether the
outcome offsets the cost the dissatisfied customer incurred in the redress seeking process
( Greenbery, 1990; Gilland, 1993). Some of the most quoted outcomes of distributive justice are
compensation, replacement, apologies (Blodget et al, 1997; Goodwin and Ross, 1992; Hoffman
and Kelly, 2000; Tax et al, 1998).Prior experience with the service provider and information how
other customers were treated in more or less same situation and the seriousness of the customers
loss are taken into account in the dissatisfied customers‟ assessment whether the compensation
was fair (tax et al., 1998). If the outcome of redress seeking process was experienced as fair, it
will have a positive influence on satisfaction level of the customer. It is expected that higher
levels of compensation leads to higher perceived justice evaluations. Distributive justice has a
major effect on customer‟s repatronage and negative WOM intentions. The following hypothesis
is formulated to measure the influence distributive justice has on customer satisfaction with
service recovery:
H0: Distributive justice in service recovery does not have a positive impact on customer
satisfaction with service recovery.
H1: Distributive justice in service recovery has a positive impact on customer satisfaction with
service recovery.
Interactional justice
Interactional justice focuses on how fair the interpersonal treatment was which the customer
received during the process (Tax et al., 1998,p 62). They have identified five important elements
of interactional justice: effort, empathy, explanation/ causal account, honesty and politeness. In
the case of service recovery, interactional justice is being referred to the way in which the
recovery process is operationalized and the outcome presented to the customer. The manner in
which managers and employees communicate with customers and the efforts made to resolve
problems affect customer satisfaction (Mohr and Bitner, 1995). Being polite, apologizing and
willingness to listen to the customer are critical in service encounters (Blodgett et al., 1997). To
21
measure how the customers experience how they were treated by the PU and their employees and
the influence interactional justice has on satisfaction with service recovery, the following
hypothesis is formulated:
H0: Interactional justice in service recovery does not have a positive impact on customer
satisfaction with service recovery.
H1: Interactional justice in service recovery has a positive impact on customer satisfaction
with service recovery.
Informational justice
Informational justice is about the adequacy and truthfulness of the information provided by the
company explaining what caused the service failure (Colquit, 2001). The justice dimensions of
informational justice focuses on the equity of the justification and the explanation the company
offers to the customer. It‟s about the decisions and about the reason behind the things that caused
the problem. Providing customers with proper information during the service recovery process is
very important. Because of this importance the influence of informational justice on service
recovery will be studied with the following hypothesis:
H0: Informational justice in service recovery does not have a positive impact on customer
satisfaction with service recovery.
H1. Informational justice in service recovery has a positive impact on customer satisfaction
with service recovery.
2.4.2 Results from satisfaction with service recovery
Perceived justice with a service recovery strategy would affect customer satisfaction level.
Customers are likely to react positively if initial service failures are revolved successfully (Tax et
al., 1998). In this study satisfaction with service recovery will be researched further in the context
of public utility companies.

22
2.4.3 Corporate image
Corporate image has an impact on the organizations competitive standings, it‟s positioning and
also its capacity to increase customers loyalty, which leads to attracting new customers. This
research reviews corporate image from the marketing approach. In the marketing approach
corporate image is described as an overall impression that society has of an organization ( Abratt,
1989; Barich and Kotler, 1991; Bernstein, 1992; Dowling, 2001). Corporate image is viewed as
the response of customers to the total offering of the company and defined as the sum of ideas and
beliefs. It further can be seen as” a function of the accumulation of purchasing/ consumption
experiences over time “( Andreassen and Lindestad, 1998) and it consists of two main
components:
- A functional component, which is related to tangible attributes that can be measured more
easily.
- An emotional component, which is linked with psychological dimensions that are
manifested by attitudes and feelings towards a company.
These particular feelings are derived from experiences of individuals with an organization and
from the processing of information on the different attributes that determines the indicators of
corporate image. Therefore, corporate image is the result of the aggregate processes by which
customers compare the differences of the various attributes of companies ( Dowling, 1993).
Corporate image is essential for companies, it is key to security and maintaining public trust. It is
an important factor in the customers overall evaluation of service quality that is provided by a
company. It can be defined as the perception of a company that customers‟ hold in their
memories. Because it works as a filter through which an organization‟s whole operation is
perceived, it reflects a company‟s overall reputation. It impacts the customer‟s evaluation of
service quality, satisfaction and loyalty (Andreassen and Lindestad, 1998; Zins, 2001). In this
research corporate image is investigated as a moderating variable. This study will try to reveal
what impact corporate image has on perceived justice in service recovery and on satisfaction with
service recovery. It will try to investigate whether the image of the PU influences the customer‟s
perception about the way it handles the service recovery process. The following four hypotheses
are formulated to achieve this:

23
Hypothesis
H0: Image does not positively moderate the relationship between interactional justice in
service recovery and customer satisfaction with service recovery.
Hl: Image positively moderates the relationship between interactional justice in service
recovery and customer satisfaction with service recovery.
Hypothesis
H0: Image does not positively moderate the relationship between distributive justice in service
recovery and customer satisfaction with complaint handling.
Hl: Image positively moderates the relationship between distributive justice in service
recovery and customer satisfaction with service recovery.
Hypothesis
H0: Image does not positively moderate the relationship between procedural justice in service
recovery and customer satisfaction with service recovery.
Hl: Image positively moderates the relationship between procedural justice in service
recovery and customer satisfaction with service recovery.
Hypothesis
H0: Image does not positively moderate the relationship between informational justice in
service recovery and customer satisfaction with service recovery.
Hl: Image positively moderates the relationship between informational justice in service
recovery and customer satisfaction with service recovery.
2.5 Conceptual model
Public utility companies globally are facing changing market conditions. These changes make it
inevitable for these companies to apply marketing concepts to continuously improve their
services. Research has shown that customer complaint is an important tool for organizations to get
feedback from dissatisfied customers.
In this research we will investigate how service recovery is perceived by the complainers. When
customers are not satisfied and choose to complain, companies try to recover the service failure.

24
Perceived justice with service recovery is the independent variables and distributive, procedural,
informational and interactional justice regarding the service recovery will be operationalized. We
will measure how complaining customers of public utility companies in Suriname perceive
service recovery and what effect the service recovery has on satisfaction. In this study satisfaction
with the service recovery is the dependent variable. Corporate image is the moderating variable.
Figure 2, conceptual model.
It must be mentioned that the studies that established these theories were mainly conducted in the
USA and Europe. Most of the studies that have been used in this literature review have been
conducted in a competitive or loose monopoly market structure. Little academic research
information about customer complaint behavior, customer responses, service recovery and
customers characteristics are available in a monopolistic market structure.
The theories and arguments discussed in the literature review confirm the importance of customer
satisfaction for organizations. From the various literature reviewed, enough theoretical arguments
25
have been found that customer satisfaction can be of great importance for public utility
companies. The importance of customer complaint behavior and service recovery and its positive
impact on customer satisfaction are being discussed in this research. With the knowledge gained
from this literature review it is quite interesting to study how the different concepts of customer
service and the positive impact of service recovery on customer satisfaction can be utilized for
public utility companies in Suriname. Because most of the literature reviewed, has been
conducted in competitive environments, valuable insights can be gathered with this research.
As research indicates, service recovery can be a critical instrument for monopolistic public utility
companies to increase satisfaction for their customers.
26
CHAPTER III: RESEARCH METHODOLOGY
3.1 Introduction
As mentioned in chapter one there are very clear signs of upcoming competition in the utilities
industries in Suriname. In the telecom market competition has been introduced, and in the energy
market the government has allowed more parties to generate energy and sell this to the EBS. As
argued in chapter one and two the focus on the customer needs on behalf of the PU‟s will become
of great importance.
From the start the desire was to conduct a study in the field of customer satisfaction regarding the
public utility sector in Suriname. In the early stage of exploration it became quite clear that such a
study was not conducted in recent years in Suriname. This created an excellent opportunity to
contribute to quality improvement of services provided by PU‟s in Suriname. After having
explored the literature about customer satisfaction and discussions conducted with several
professors of the Lim A Po institute for Social studies the decision was made to conduct this study
within the EBS. As this research progressed, it became clear which challenges PU‟s are facing in
Suriname, the topic was narrowed down to the influence customer complaints has on customer
satisfaction in public utilities in Suriname. The effect that service recovery has on customer
satisfaction after a complaint has been dropped will be investigated further.
In this chapter the reader is provided with a clear outline of how this study about improving
customer satisfaction within PU‟s in Suriname is carried out. The theory described in chapter two
is used to determine which variables of perceived justice with service recovery, satisfaction with
service recovery and corporate image are analyzed and operationalized. This chapter further
consists of five paragraphs. Paragraph 3.2. deals with the research approach, the study approach
chosen is explained in more detail and the research questions are formulated . Paragraph 3.3.
gives the reader more insight about the research strategy followed, whereby paragraph 3.4
discusses the reliability and validity of this study.

27
Paragraph 3.5 describes the data collection process and paragraph 3.6 discusses how the data was
analyzed.
3.1.1. The EBS
Although we regard the EBS as a monopolist, there are different providers of energy in Suriname.
One part is done by the government, mostly in the interior of Suriname and the other major part is
covered by the EBS.
Figure 3, shows the number of customers per district.
The EBS owns and operates the EPAR and the ENIC systems, the two largest systems in their
operation. In total, three main power plants are connected to the EPAR transmission &
distribution network, of which one plant is owned by NV EBS and the others by private
companies. The private companies deliver power to NV EBS and can as such be considered as
independent power producers with whom the Government, as the sole shareholder of EBS, has
entered into power purchase agreements. Currently the EBS has 983 employees and is delivering
energy to 132, 452 customers.
Since the beginning of 2011the EBS is undergoing a major restructuring process. The company
has a new management, who has placed a huge emphasis on the customer focus of the company.
28
During the preliminary research of this thesis some interesting movements in the company‟s
structures were noticed in order to increase the customer focus. Referring to the earlier mentioned
changes in the public utility sector and the restructuring within the EBS there was a good fit to
conduct this research at the EBS. As customers also are becoming more demanding in Suriname
and the utility market is subject of increasing competition and deregulation, we see another
interesting development. In this specific situation the EBS transformation is also being initiated
by the company itself. These developments will serve the objective of this study well, because the
company also acknowledges that customers must be served with services that are more in line
with what they really need.
3.2 Research approach
To conduct this study a quantitative research approach is applied. A deductive study approach
was chosen whereby hypotheses were formulated from the theory regarding satisfaction with
service recovery, fairness of the complaint handling process and the corporate image. After the
research model was designed and the main variables were chosen, a questionnaire was developed
to measure these variables. The questionnaire was presented to customers that had filed a
complaint earlier. The questionnaire included questions to measure the different variables of the
research model (see appendix 1).With the data gathered and analyzed from the questionnaire the
hypotheses were tested.
3.3 Research strategy
This part of the study gives the reader an overview of the general plan of how the researcher will
answer the research questions that has been set.
As mentioned in chapter one the following problem statement was formulated in this study:
How can service recovery help improve customer satisfaction within public utility companies?
To conduct this study the following research questions were formulated:
The main research question of this study is: How does service recovery influence customer
satisfaction in public utility companies?
29
The following questions will be answered in this research:
1. What are the most important determinants of customer complaint behavior in PU‟s?
2. How does service recovery impact customer satisfaction in PU‟s?
3. What moderating roles does organizational image play in the relationship between
perceived justice of service recovery and customer satisfaction?
In this study we have a combination of “how” and “what” questions being asked. The “what”
question is being answered by conducting extensive literature study and the goal was to develop
hypothesis for further testing. The “how” question is being answered by conducting a survey
among customers of the EBS that have experienced the complaint handling and service recovery
process of the EBS. Survey is found to be a more suitable approach to gain a better understanding
of the research area and is more appropriate for a quantitative study.
3.3.1 The survey
As mentioned earlier, part of the strategy was to conduct a survey, which allows researchers to
collect large data from a sizable population in an economical way. Since the aim of this study was
to assess whether service recovery could help improve customer satisfaction within public utilities
in Suriname, the main focus is the customer‟s experience. A questionnaire was part of the strategy
to achieve this goal. Information of two existing questionnaires was used to develop the one for
this study. A pilot test was conducted to detect eventual weaknesses in the design of the
questionnaire. In addition to answer the questionnaire, these respondents were asked for
additional evaluations such as whether the statements made sense to them and whether they were
easy to understand. On average, 10 minutes was needed to fill in a questionnaire.
The sample size for this survey is held on a minimum of 350 questionnaires to test the regression
model. In the period of the 28th
of August till the 5th
of September 2011 the survey was carried out
in different areas of capital the Paramaribo. At the end of the study 365 questionnaires were filled
in and analyzed. Customers were selected for the sample by using the following three criteria:
- The survey was conducted under customers that live in capital Paramaribo, because more
than 65% of the customers of the EBS live in Paramaribo.

30
.
Figure 4, displays the different customers segment in Paramaribo.
- The EBS has a customer base of domestic, commercial and industrial customers.
Figure 5, displays different customer segments in Suriname.
This study is conducted among the domestic customers. This choice was made because,
during the research period it became clear that the domestic customers had a wider variety
of complaints that they dropped at utility companies in Suriname, compared with the

31
commercial and industrial customers. Also the domestic customers represent a larger
quantity than the other two customer groups.
- The customers must have experienced a service failure and reported this to the EBS in some
way (by mail, orally or in writing).
3.4 Validity and reliability
To reduce the possibility of getting answers wrong, necessary attention in designing the research
was paid to reliability and validity.
3.4.1 Validity
Validity is essential because it is important that the findings are really about what they appear to
be. The following steps were taken to ensure the validity of this research:
- Data was collected from reliable resources and only from domestic customers that live in
Paramaribo that have filed a complaint earlier;
- The questionnaire was developed based on literature review and major parts of it were
earlier used and tested in other research;
- The questionnaire was pilot tested by 12 persons;
- The data was collected in a period of 10 days, in this period of time no major events
happened regarding the research topic.
3.4.2 Reliability
Reliability is important to assure that the data collection methods used will yield consistent
findings if similar observations and conclusions were made by other researchers. A measure is
reliable to the degree that it supplies consistent results. With the assistance of SPSS the reliability
analysis was made. The following steps were taken to ensure the reliability of this research:
- The questionnaire was divided in four parts to assure proper focus of the responders.
32
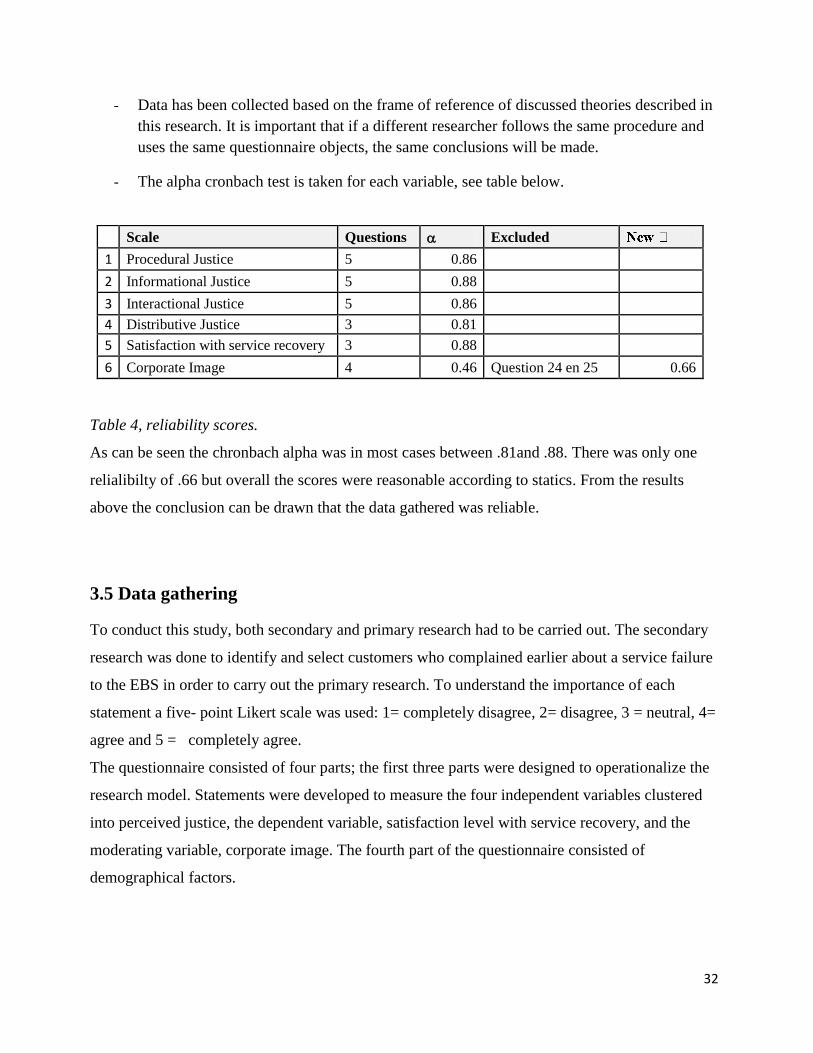
- Data has been collected based on the frame of reference of discussed theories described in
this research. It is important that if a different researcher follows the same procedure and
uses the same questionnaire objects, the same conclusions will be made.
- The alpha cronbach test is taken for each variable, see table below.
Table 4, reliability scores.
As can be seen the chronbach alpha was in most cases between .81and .88. There was only one
relialibilty of .66 but overall the scores were reasonable according to statics. From the results
above the conclusion can be drawn that the data gathered was reliable.
3.5 Data gathering
To conduct this study, both secondary and primary research had to be carried out. The secondary
research was done to identify and select customers who complained earlier about a service failure
to the EBS in order to carry out the primary research. To understand the importance of each
statement a five- point Likert scale was used: 1= completely disagree, 2= disagree, 3 = neutral, 4=
agree and 5 = completely agree.
The questionnaire consisted of four parts; the first three parts were designed to operationalize the
research model. Statements were developed to measure the four independent variables clustered
into perceived justice, the dependent variable, satisfaction level with service recovery, and the
moderating variable, corporate image. The fourth part of the questionnaire consisted of
demographical factors.
Scale Questions Excluded
1 Procedural Justice 5 0.86
2 Informational Justice 5 0.88
3 Interactional Justice 5 0.86
4 Distributive Justice 3 0.81
5 Satisfaction with service recovery 3 0.88
6 Corporate Image 4 0.46 Question 24 en 25 0.66
33
Customer Satisfaction
Satisfaction with service recovery was measured to establish whether the customer was satisfied
with the steps taken by the EBS in the service recovery process. To measure the satisfaction with
service recovery three statements were formulated, with which the researcher tries to reveal the
satisfaction level of service recovery regarding customers of the EBS. Two of the statements
made were: “I had a positive experience when complaining to the EBS” and “In my opinion, EBS
has provided me with a satisfactory answer to the problem, on this specific occasion”. The
reported reliability of the initial scale used was .94. The reliability of the scale used in this
specific study is .88.
Perceived Justice with service recovery
The variable of perceived justice contained 4 sub categories:
Distributive justice;
Distributive justice was measured to investigate to which level the customer was satisfied with the
outcome of the service recovery process. There were three statements regarding this category that
is mainly trying to measure the effort the service provider made to solve the problem. One of the
statements in this part was: The final solution provided by the EBS was fair given the time and
hassle. The reported reliability of the initial scale used was .85. The reliability of the scale used in
this specific study is .81.
Procedural justice;
Procedural justice was measured to establish to which degree the customer found the decision
making process to be fair. This category that is mainly investigating the fairness of the policies,
procedures and different criteria used by the service provider to solve the problem contained five
statements. Some of the statements in this part of the questionnaire were: “I believe the EBS has
fair policies to handle problems”, “I believe that the complaints procedure of the EBS was
sufficient for me to solve the problem” and “The EBS responded quickly to my problem after I
had done my complaint”. The reported reliability of the initial scale used was .88 and the
reliability of the scale used in this specific study is .86

34
Informational justice;
Informational justice was measured to investigate to which degree the EBS customers found the
information they were provided with during the recovery process to be valuable for them. To
investigate how the customers experienced the information about the adequacy and the
truthfulness of the information provided by the company explaining what caused the problem,
there were five statements developed in the questionnaire. “I believe the EBS‟s explanation
regarding the causes behind the problem was reasonable” and “The EBS communicated the details of
the recovery of the services clearly, were two of the statements to measure informational justice. The
reported reliability of the initial scale used was .87 and the reliability of the scale used in this
specific study is .88
Interactional justice;
Interactional justice was measured to establish whether the customers were treated fair during the
service recovery process. With five statements formulated in the questionnaire, I wanted to reveal
how fair the employees treated the customers during the complaint process. Three of the
statements in this part of the questionnaire were: „The EBS employees did everything they could
to solve my problem”, “The employees of the EBS seemed interested in my problem” and “The
employees of the EBS understood my problem”. The reported reliability of the initial scale used
was .85 and the reliability of the scale used in this specific study is .86.
Image;
In the research model corporate image was the moderating variable. With this variable the
researcher wanted to reveal how the corporate image influenced the satisfaction with service
recovery and the perceived justice with the complaint handling. There were four statements in the
questionnaire to measure the impact of corporate image. During the analyses process two
statements were removed because the reliability of corporate image was not acceptable taking the
different statistical norms into consideration. One of the statements to measure the corporate
image was: “The EBS is considered to be one of the best companies in Suriname”. The reported
reliability of the initial scale used was .77 and the reliability of the scale used in this specific study
is .66.
35
Control variables
The fourth part of the questionnaire covered the demographical variables age, gender, income and
education. These demographical factors will not only be used to generate background information
of the respondents but also will be used to assess whether there are specific patterns between the
different groups of customers
Education
Complainers tend to belong to higher socio- economic groups (Bearden et al. ( 1980) and
Gronhaug and Zaltman ( 1980). They suggest that consumers who belong to these groups have
greater resources like self- confidence and information in dealing with problems. They state
further that these consumers tend to perceive less risk of humiliation in complaining. People from
upper socio- economic groups are able to buy more products and for this reason alone they
are more likely to experience more problems ( Gronhaug and Zaltman ,1980). Together with their
greater purchasing experience, this is likely to enhance complaining behavior.
Age
Most studies suggest that younger consumers are more likely to complain ( Andreasen and Best,
1977;Bearden,1983;Bearden et al.,1980;Gronhaug and Zaltman, 1980;Warland et al.,1975). They
grew up in a society that is more demanding and in which customers are encouraged to voice their
dissatisfaction.
Income
Income is suggested to be positively correlated to complaints ( Andreasen, 1988). The majority of
studies indicate a high correlation between high education and complaint frequency. Customers
with a higher income are considered to purchase more and thereby face a higher risk to encounter
a service failure.
Gender
Some studies suggest that females have a greater tendency to complain ( Hustad and Pessemier,
1973;Solnick and Hemenway, 1992), whereas one article has suggested that males have a greater
propensity to complain (Hogarth and English, 2002). These studies argue that females are more
focused on voicing their views during and giving their opinion during the recovery process.
36
3.6 Data analysis
After collecting the data, the process of analysis began. The outcome of the questionnaires was
analyzed in excel and the statistical program, SPSS. Five regression analyses were conducted to
test my model. With the first regression analyses I tested the hypotheses one till four and with the
other four analyses I tested the last four hypotheses. The constructs in this study were measured
using the Likert scales, adapted from previous investigations into specifics of customer
satisfaction research. The standard deviation, mean and mode of the independent, dependent and
the moderating variables are illustrated in the following tables:
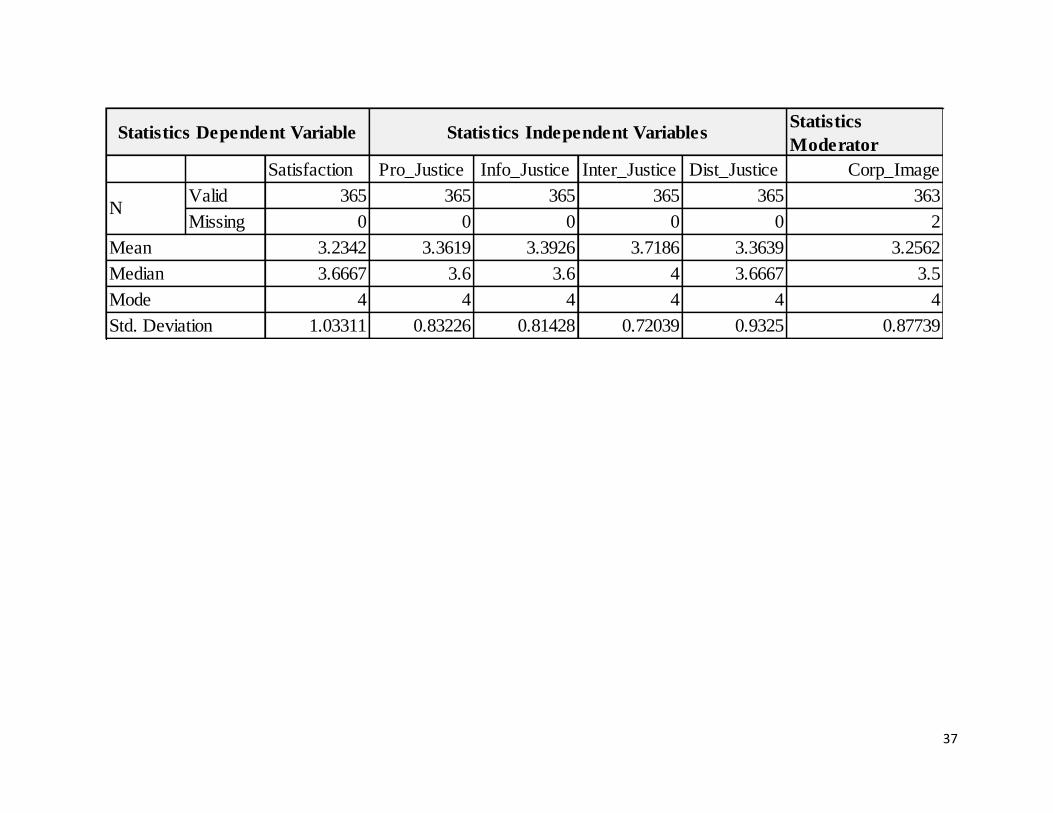
37
Statistics
Moderator
Satisfaction Pro_Justice Info_Justice Inter_Justice Dist_Justice Corp_Image
Valid 365 365 365 365 365 363
Missing 0 0 0 0 0 2
3.2342 3.3619 3.3926 3.7186 3.3639 3.2562
3.6667 3.6 3.6 4 3.6667 3.5
4 4 4 4 4 4
1.03311 0.83226 0.81428 0.72039 0.9325 0.87739Std. Deviation
Statistics Dependent Variable
N
Mean
Median
Mode
Statistics Independent Variables
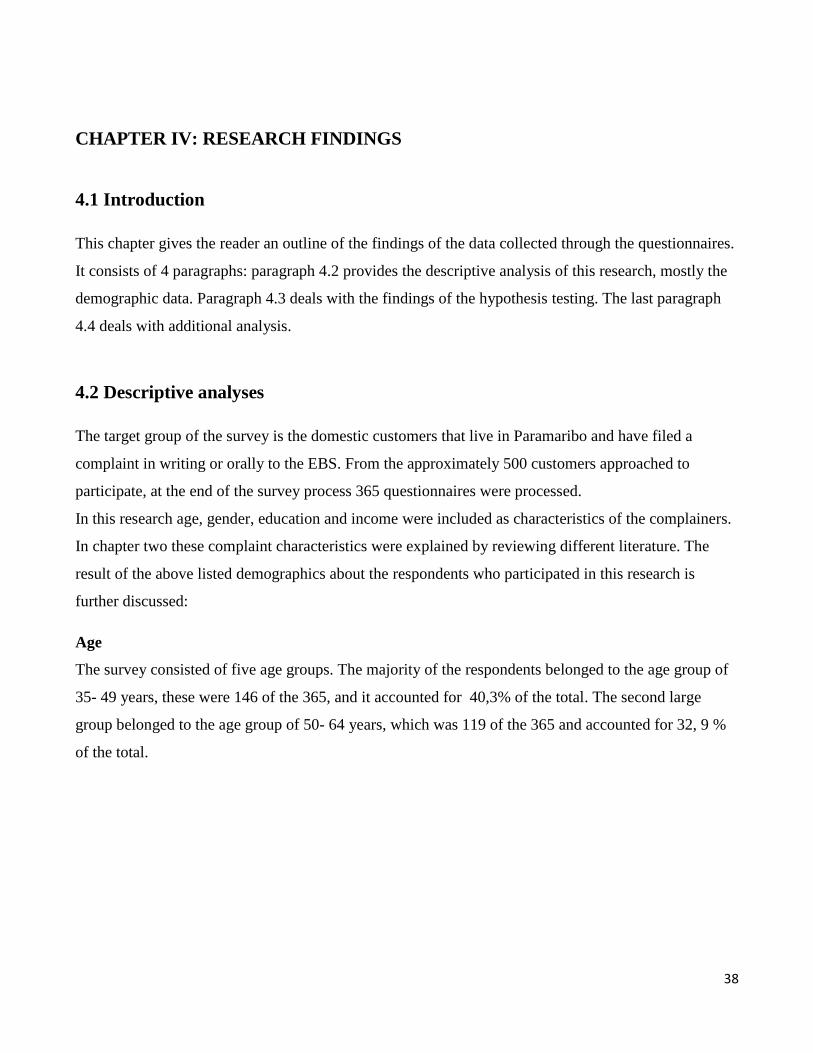
38
CHAPTER IV: RESEARCH FINDINGS
4.1 Introduction
This chapter gives the reader an outline of the findings of the data collected through the questionnaires.
It consists of 4 paragraphs: paragraph 4.2 provides the descriptive analysis of this research, mostly the
demographic data. Paragraph 4.3 deals with the findings of the hypothesis testing. The last paragraph
4.4 deals with additional analysis.
4.2 Descriptive analyses
The target group of the survey is the domestic customers that live in Paramaribo and have filed a
complaint in writing or orally to the EBS. From the approximately 500 customers approached to
participate, at the end of the survey process 365 questionnaires were processed.
In this research age, gender, education and income were included as characteristics of the complainers.
In chapter two these complaint characteristics were explained by reviewing different literature. The
result of the above listed demographics about the respondents who participated in this research is
further discussed:
Age
The survey consisted of five age groups. The majority of the respondents belonged to the age group of
35- 49 years, these were 146 of the 365, and it accounted for 40,3% of the total. The second large
group belonged to the age group of 50- 64 years, which was 119 of the 365 and accounted for 32, 9 %
of the total.
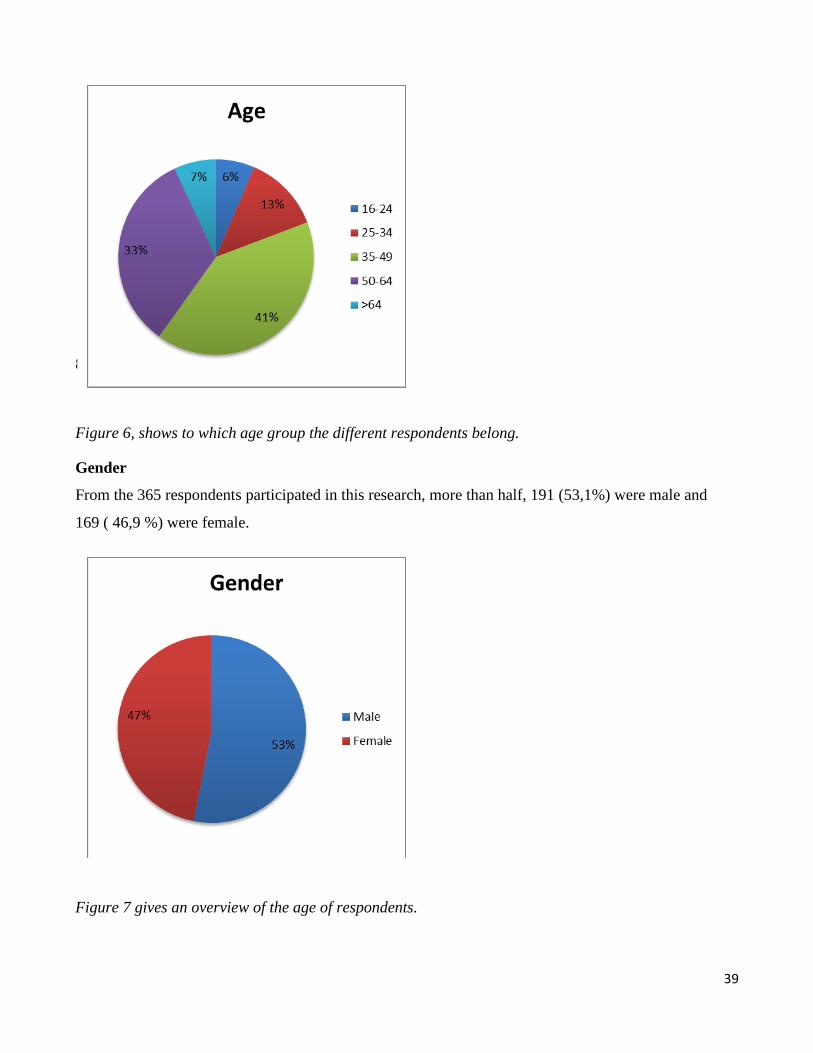
39
865
Figure 6, shows to which age group the different respondents belong.
Gender
From the 365 respondents participated in this research, more than half, 191 (53,1%) were male and
169 ( 46,9 %) were female.
Figure 7 gives an overview of the age of respondents.
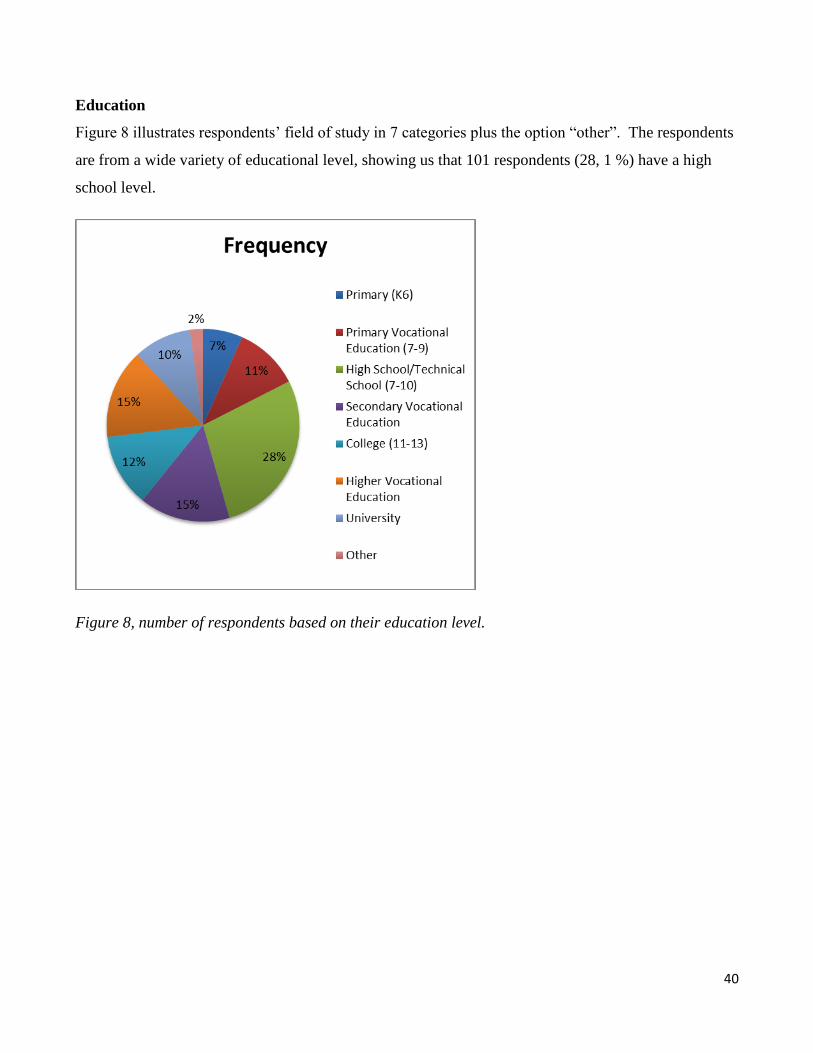
40
Education
Figure 8 illustrates respondents‟ field of study in 7 categories plus the option “other”. The respondents
are from a wide variety of educational level, showing us that 101 respondents (28, 1 %) have a high
school level.
Figure 8, number of respondents based on their education level.
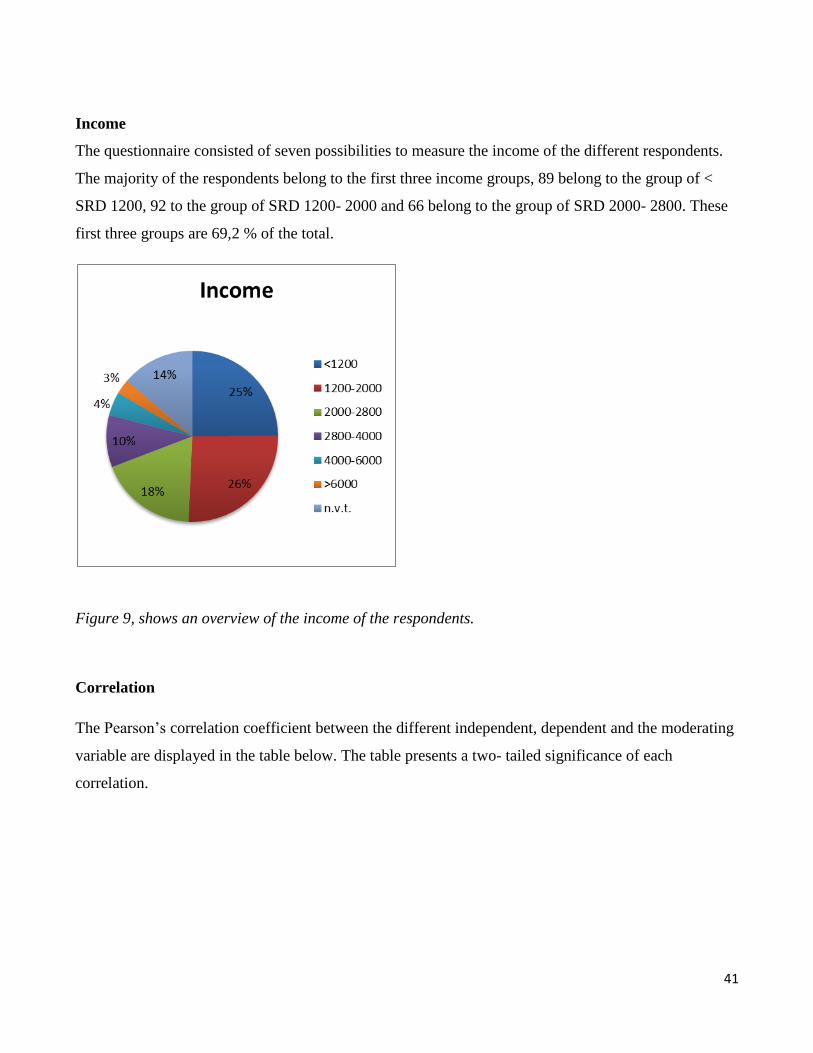
41
Income
The questionnaire consisted of seven possibilities to measure the income of the different respondents.
The majority of the respondents belong to the first three income groups, 89 belong to the group of <
SRD 1200, 92 to the group of SRD 1200- 2000 and 66 belong to the group of SRD 2000- 2800. These
first three groups are 69,2 % of the total.
Figure 9, shows an overview of the income of the respondents.
Correlation
The Pearson‟s correlation coefficient between the different independent, dependent and the moderating
variable are displayed in the table below. The table presents a two- tailed significance of each
correlation.
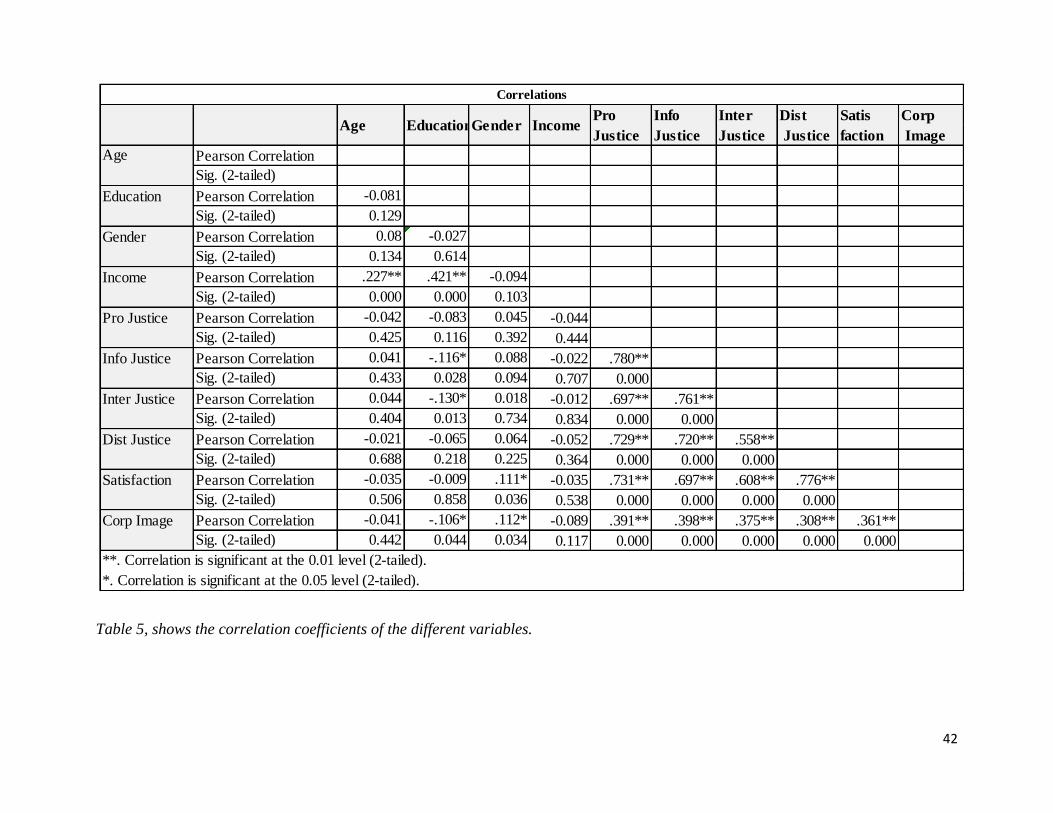
42
Table 5, shows the correlation coefficients of the different variables.
Pro Info Inter Dist Satis
Justice Justice Justice Justice faction
Education
Gender
Income
Pro Justice -0.044
0.444
Info Justice -0.022 .780**
0.707 0.000
Inter Justice -0.012 .697** .761**
0.834 0.000 0.000
Dist Justice -0.052 .729** .720** .558**
0.364 0.000 0.000 0.000
Satisfaction -0.035 .731** .697** .608** .776**
0.538 0.000 0.000 0.000 0.000
Corp Image -0.089 .391** .398** .375** .308** .361**
0.117 0.000 0.000 0.000 0.000 0.000Sig. (2-tailed) 0.442 0.044 0.034
-0.041 -.106* .112*Pearson Correlation
**. Correlation is significant at the 0.01 level (2-tailed).
*. Correlation is significant at the 0.05 level (2-tailed).
0.506 0.858 0.036
Pearson Correlation
Sig. (2-tailed) 0.688 0.218 0.225
-0.035 -0.009 .111*
Sig. (2-tailed)
Pearson Correlation
Sig. (2-tailed) 0.404 0.013 0.734
0.044 -.130* 0.018Pearson Correlation
-0.021 -0.065 0.064
Sig. (2-tailed) 0.433 0.028 0.094
0.041 -.116* 0.088Pearson Correlation
Sig. (2-tailed) 0.425 0.116 0.392
-0.042 -0.083 0.045Pearson Correlation
Sig. (2-tailed) 0.000 0.000 0.103
-0.094.227** .421**Pearson Correlation
Sig. (2-tailed) 0.134 0.614
0.08 -0.027Pearson Correlation
Sig. (2-tailed) 0.129
-0.081Pearson Correlation
Sig. (2-tailed)
Age Pearson Correlation
Age EducationGender IncomeCorp
Image
Correlations
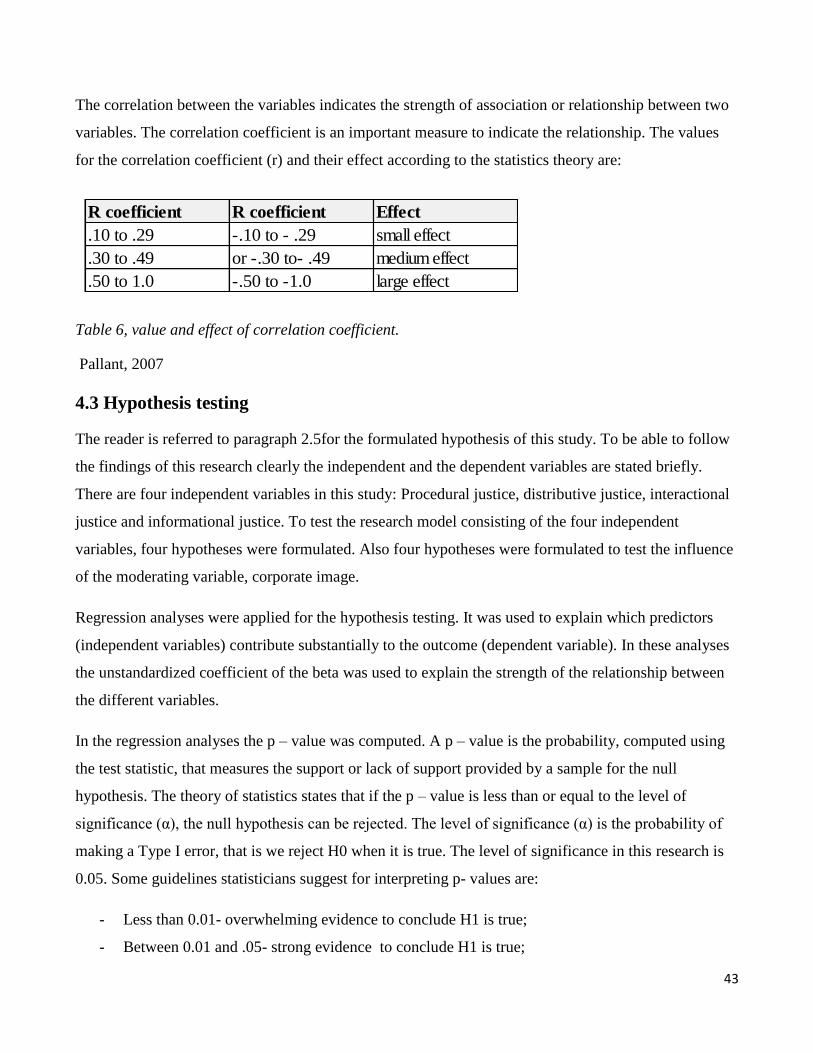
43
The correlation between the variables indicates the strength of association or relationship between two
variables. The correlation coefficient is an important measure to indicate the relationship. The values
for the correlation coefficient (r) and their effect according to the statistics theory are:
Table 6, value and effect of correlation coefficient.
Pallant, 2007
4.3 Hypothesis testing
The reader is referred to paragraph 2.5for the formulated hypothesis of this study. To be able to follow
the findings of this research clearly the independent and the dependent variables are stated briefly.
There are four independent variables in this study: Procedural justice, distributive justice, interactional
justice and informational justice. To test the research model consisting of the four independent
variables, four hypotheses were formulated. Also four hypotheses were formulated to test the influence
of the moderating variable, corporate image.
Regression analyses were applied for the hypothesis testing. It was used to explain which predictors
(independent variables) contribute substantially to the outcome (dependent variable). In these analyses
the unstandardized coefficient of the beta was used to explain the strength of the relationship between
the different variables.
In the regression analyses the p – value was computed. A p – value is the probability, computed using
the test statistic, that measures the support or lack of support provided by a sample for the null
hypothesis. The theory of statistics states that if the p – value is less than or equal to the level of
significance (α), the null hypothesis can be rejected. The level of significance (α) is the probability of
making a Type I error, that is we reject H0 when it is true. The level of significance in this research is
0.05. Some guidelines statisticians suggest for interpreting p- values are:
- Less than 0.01- overwhelming evidence to conclude H1 is true;
- Between 0.01 and .05- strong evidence to conclude H1 is true;
R coefficient R coefficient Effect
.10 to .29 -.10 to - .29 small effect
.30 to .49 or -.30 to- .49 medium effect
.50 to 1.0 -.50 to -1.0 large effect
44
- Between 0.05 and .10- weak evidence to conclude H1 is true;
- Greater than 0.10- insufficient evidence to conclude H1 is true, ( Anderson, Sweeny, Williams,
Freeman and Shoesmith, 2009);
To test the eight hypotheses five regression analyses were carried out. The first regression analysis was
used to test the first four hypotheses. To test whether corporate image moderates the relationship
between the independent and the dependent variables four separate interaction terms ( predictor*
moderating variable) were included in the regression analyses ( Baron and Kenny, 1986).To test
hypothesis five- eight, separate regression analyses were conducted with the four independent
variables, the moderator and the four respective interaction term. The results of these five regression
analyses are displayed in the table below.

45
Table 7, results of regression analyses
Model 1 Model 2 Model 3 Model 4 Model 5
-0.925*** -0.616 -0.909* -0.601 -0.556
Age -0.037 -0.035 -0.037 -0.037 -0.038
Education 0.110** 0.108** 0.11** 0.109** 0.109**
Income -0.032 -0.033 -0.032 -0.035 -0.033
Gender 0.120* 0.114 0.12* 0.118* 0.113
Distributive justice 0.531*** 0.436*** 0.531*** 0.531*** 0.529***
Interactional justice 0.218*** 0.225*** 0.214 0.229*** 0.233***
Procedural justice 0.260*** 0.264*** 0.26*** 0.165 0.255***
Informational justice 0.061 0.052 0.061 0.049 -0.057
Corporate image .078* -0.026 0.072 -0.034 -0.046
Corporate image* Distributive justice 0.03
Corporate image* Interactional justice 0.002
Corporate image * Procedural justice 0.033
Corporate image* Informational justice 0.036
0.688 0.689 0.688 0.688 0.689
0.678 0.678 0.677 0.678 0.678
Interaction terms
Direct effects
Constant
Controls
Satisfaction with service recovery
***P<0.01, **P<0.05,* P<0.10
R²
Adjusted R²
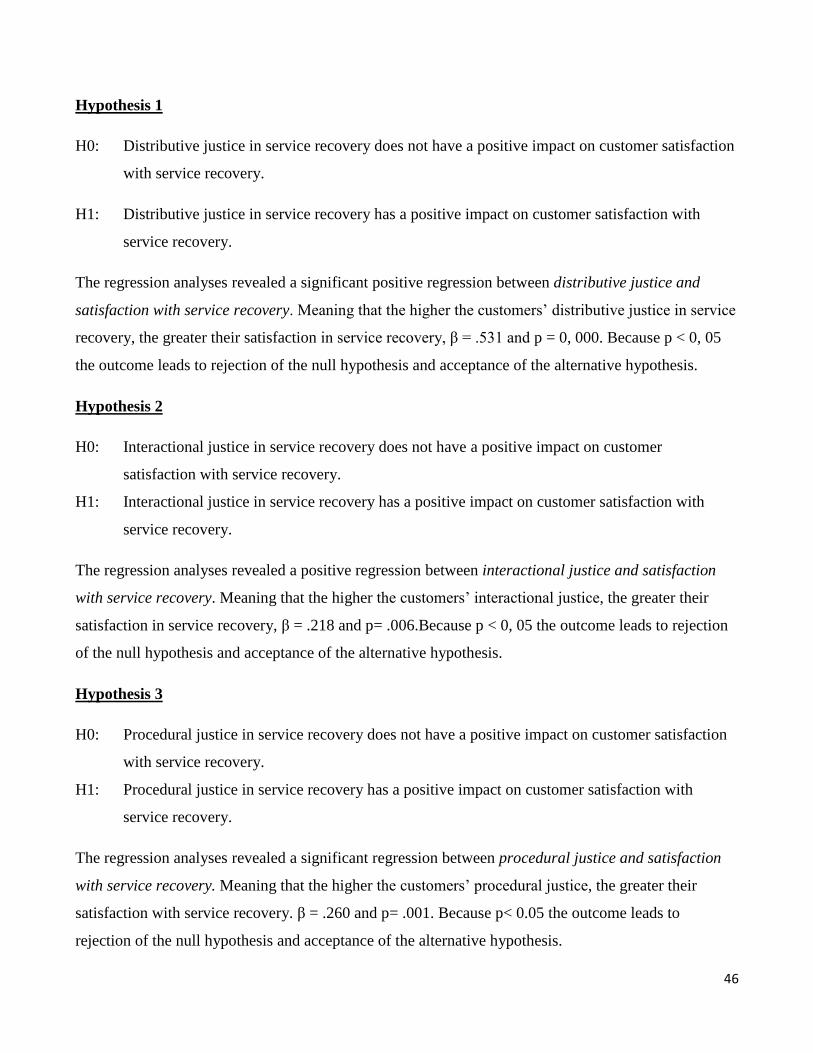
46
Hypothesis 1
H0: Distributive justice in service recovery does not have a positive impact on customer satisfaction
with service recovery.
H1: Distributive justice in service recovery has a positive impact on customer satisfaction with
service recovery.
The regression analyses revealed a significant positive regression between distributive justice and
satisfaction with service recovery. Meaning that the higher the customers‟ distributive justice in service
recovery, the greater their satisfaction in service recovery, β = .531 and p = 0, 000. Because p < 0, 05
the outcome leads to rejection of the null hypothesis and acceptance of the alternative hypothesis.
Hypothesis 2
H0: Interactional justice in service recovery does not have a positive impact on customer
satisfaction with service recovery.
H1: Interactional justice in service recovery has a positive impact on customer satisfaction with
service recovery.
The regression analyses revealed a positive regression between interactional justice and satisfaction
with service recovery. Meaning that the higher the customers‟ interactional justice, the greater their
satisfaction in service recovery, β = .218 and p= .006.Because p < 0, 05 the outcome leads to rejection
of the null hypothesis and acceptance of the alternative hypothesis.
Hypothesis 3
H0: Procedural justice in service recovery does not have a positive impact on customer satisfaction
with service recovery.
H1: Procedural justice in service recovery has a positive impact on customer satisfaction with
service recovery.
The regression analyses revealed a significant regression between procedural justice and satisfaction
with service recovery. Meaning that the higher the customers‟ procedural justice, the greater their
satisfaction with service recovery. β = .260 and p= .001. Because p< 0.05 the outcome leads to
rejection of the null hypothesis and acceptance of the alternative hypothesis.
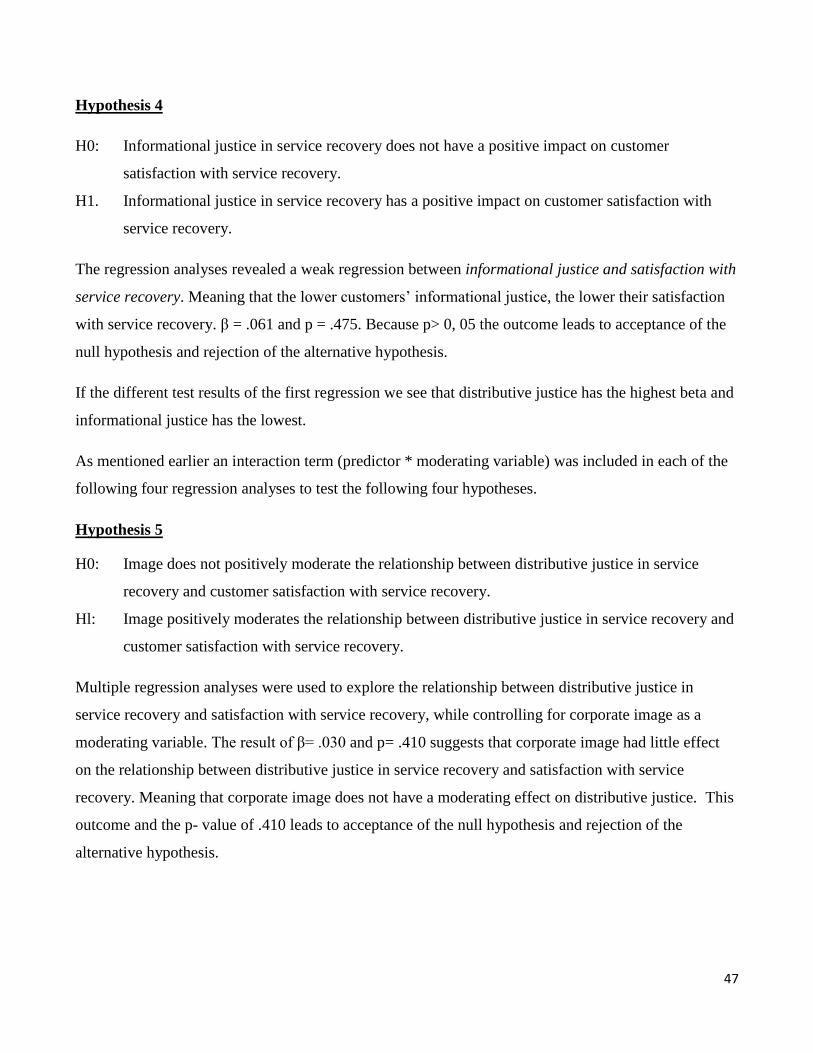
47
Hypothesis 4
H0: Informational justice in service recovery does not have a positive impact on customer
satisfaction with service recovery.
H1. Informational justice in service recovery has a positive impact on customer satisfaction with
service recovery.
The regression analyses revealed a weak regression between informational justice and satisfaction with
service recovery. Meaning that the lower customers‟ informational justice, the lower their satisfaction
with service recovery. β = .061 and p = .475. Because p> 0, 05 the outcome leads to acceptance of the
null hypothesis and rejection of the alternative hypothesis.
If the different test results of the first regression we see that distributive justice has the highest beta and
informational justice has the lowest.
As mentioned earlier an interaction term (predictor * moderating variable) was included in each of the
following four regression analyses to test the following four hypotheses.
Hypothesis 5
H0: Image does not positively moderate the relationship between distributive justice in service
recovery and customer satisfaction with service recovery.
Hl: Image positively moderates the relationship between distributive justice in service recovery and
customer satisfaction with service recovery.
Multiple regression analyses were used to explore the relationship between distributive justice in
service recovery and satisfaction with service recovery, while controlling for corporate image as a
moderating variable. The result of β= .030 and p= .410 suggests that corporate image had little effect
on the relationship between distributive justice in service recovery and satisfaction with service
recovery. Meaning that corporate image does not have a moderating effect on distributive justice. This
outcome and the p- value of .410 leads to acceptance of the null hypothesis and rejection of the
alternative hypothesis.

48
Hypothesis 6
H0: Image does not positively moderate the relationship between interactional justice in service
recovery and customer satisfaction with service recovery.
Hl: Image positively moderates the relationship between interactional justice in service recovery
and customer satisfaction with service recovery.
Multiple regression analyses were used to explore the relationship between interactional justice in
service recovery and satisfaction with service recovery, while controlling for corporate image as a
moderating variable. The result of β = .020 and p = .971.suggests that corporate image had little effect
on the relationship between interactional justice in service recovery and satisfaction with service
recovery. Meaning that corporate image does not have a moderating effect on interactional justice.
This outcome and the p- value of .971 leads to acceptance of the null hypothesis and rejection of the
alternative hypothesis.
Hypothesis 7
H0: Image does not positively moderate the relationship between procedural justice in service
recovery and customer satisfaction with service recovery.
Hl: Image positively moderates the relationship between procedural justice in service recovery
and customer satisfaction with service recovery.
Multiple regression analyses were used to explore the relationship between procedural justice in service
recovery and satisfaction with service recovery, while controlling for corporate image as a moderating
variable. The result of β = .033 and p = .419.suggests that corporate image had little effect on the
relationship between procedural justice in service recovery and satisfaction with service recovery.
Meaning that corporate image does not have a moderating effect on procedural justice. This outcome
and the p- value of .419 leads to acceptance of the null hypothesis and rejection of the alternative
hypothesis.
Hypothesis 8
H0: Image does not positively moderate the relationship between informational justice in service
recovery and customer satisfaction with service recovery.

49
Hl: Image positively moderates the relationship between informational justice in service recovery
and customer satisfaction with service recovery.
Multiple regression analyses were used to explore the relationship between informational justice in
service recovery and satisfaction with service recovery, while controlling for corporate image as a
moderating variable. The result of β = .073 and p = .388 suggests that corporate image had little effect
on the relationship between informational justice in service recovery and satisfaction with service
recovery. Meaning that corporate image does not have a moderating effect on informational justice.
This outcome and the p- value of .388 leads to acceptance of the null hypothesis and rejection of the
alternative hypothesis.
The test result of the last four regression analyses shows very weak β‟s. Moderation occurs when the
β‟s are significant. The test results revealed from the last four regression analyses indicate that
corporate image does not moderate in any of these cases. We also see that adding the moderating terms
to the main effects model increased the R² very slightly.
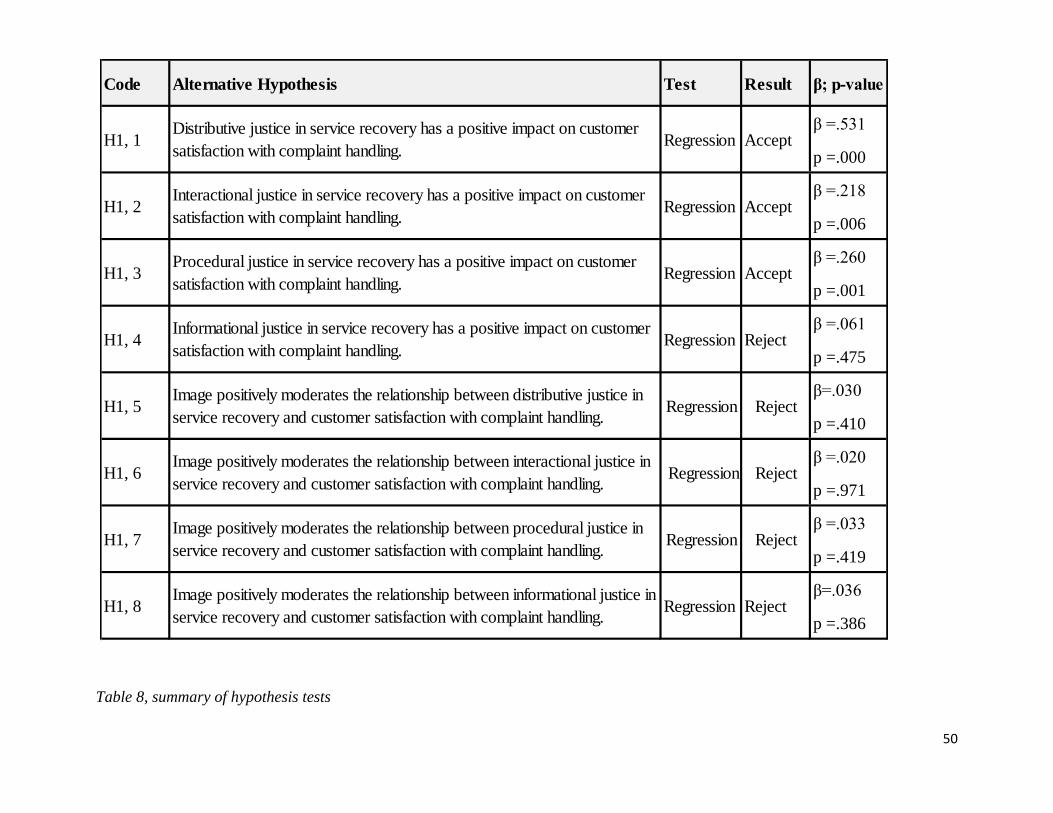
50
Table 8, summary of hypothesis tests
Code Alternative Hypothesis Test Result β; p-value
β =.531
p =.000
β =.218
p =.006
β =.260
p =.001
β =.061
p =.475
β=.030
p =.410
β =.020
p =.971
β =.033
p =.419
β=.036
p =.386
H1, 1Distributive justice in service recovery has a positive impact on customer
satisfaction with complaint handling.Regression Accept
H1, 2Interactional justice in service recovery has a positive impact on customer
satisfaction with complaint handling.Regression Accept
H1, 3Procedural justice in service recovery has a positive impact on customer
satisfaction with complaint handling.Regression Accept
H1, 4Informational justice in service recovery has a positive impact on customer
satisfaction with complaint handling.Regression Reject
H1, 5Image positively moderates the relationship between distributive justice in
service recovery and customer satisfaction with complaint handling.Regression Reject
H1, 6 Image positively moderates the relationship between interactional justice in
service recovery and customer satisfaction with complaint handling. Regression Reject
H1, 7Image positively moderates the relationship between procedural justice in
service recovery and customer satisfaction with complaint handling.Regression Reject
H1, 8Image positively moderates the relationship between informational justice in
service recovery and customer satisfaction with complaint handling.Regression Reject

51
Figure 10, hypothesized model

52
4.3 Additional analysis
Although the demographical variables were not part of the hypotheses, in this paragraph the results are
discussed of some additional analyses that were carried out with these variables. The demographical
variables listed in this research were also used as complainer‟s characteristics. The objective was to
examine whether there were differences in the perception of the different customer groups regarding
satisfaction with service recovery, corporate image and the different independent variables. The
ANOVA test was used to conduct this analysis.
Age
The test result shows no significant outcome between the five age groups. After this the analysis was
done once more by clustering the six groups to three, but still no significant results were measured.
This indicates that the different groups of customers do not perceive satisfaction with complaint
handling differently. Table 9, ANOVA results for age.
Ta
Sum of
Squaresdf
Mean
SquareF Sig.
Between Groups 0.584 2 0.292 0.429 0.651
Within Groups 242.111 356 0.68
Total 242.695 358
Between Groups 0.908 2 0.454 0.698 0.498
Within Groups 231.635 356 0.651
Total 232.544 358
Between Groups 0.707 2 0.353 0.706 0.494
Within Groups 178.148 356 0.5
Total 178.855 358
Between Groups 1.712 2 0.856 0.992 0.372
Within Groups 307.286 356 0.863
Total 308.998 358
Between Groups 2.351 2 1.175 1.113 0.33
Within Groups 376.038 356 1.056
Total 378.388 358
Between Groups 0.452 2 0.226 0.299 0.742
Within Groups 269.471 356 0.757
Total 269.923 358
Satisfaction
Corp_Image
ANOVA
Pro_Justice
Info_Justice
Inter_Justice
Dist_Justice
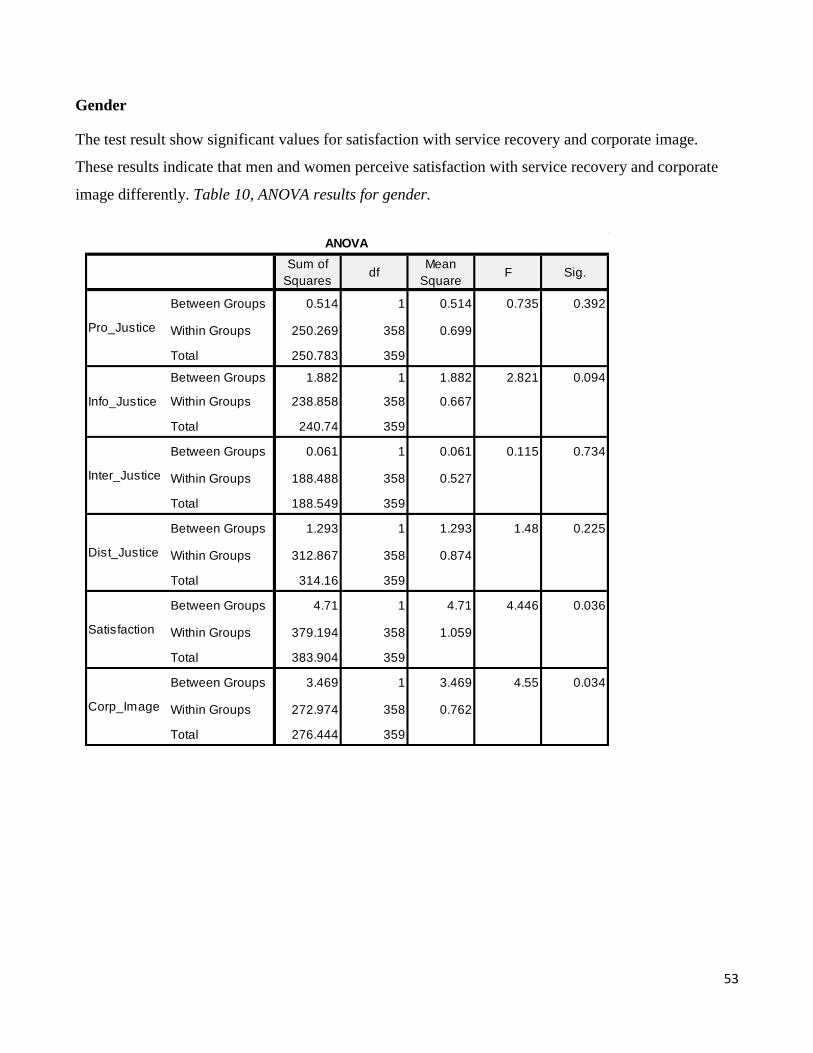
53
Gender
The test result show significant values for satisfaction with service recovery and corporate image.
These results indicate that men and women perceive satisfaction with service recovery and corporate
image differently. Table 10, ANOVA results for gender.
Sum of
Squaresdf
Mean
SquareF Sig.
Between Groups 0.514 1 0.514 0.735 0.392
Within Groups 250.269 358 0.699
Total 250.783 359
Between Groups 1.882 1 1.882 2.821 0.094
Within Groups 238.858 358 0.667
Total 240.74 359
Between Groups 0.061 1 0.061 0.115 0.734
Within Groups 188.488 358 0.527
Total 188.549 359
Between Groups 1.293 1 1.293 1.48 0.225
Within Groups 312.867 358 0.874
Total 314.16 359
Between Groups 4.71 1 4.71 4.446 0.036
Within Groups 379.194 358 1.059
Total 383.904 359
Between Groups 3.469 1 3.469 4.55 0.034
Within Groups 272.974 358 0.762
Total 276.444 359
Satisfaction
Corp_Image
ANOVA
Pro_Justice
Info_Justice
Inter_Justice
Dist_Justice
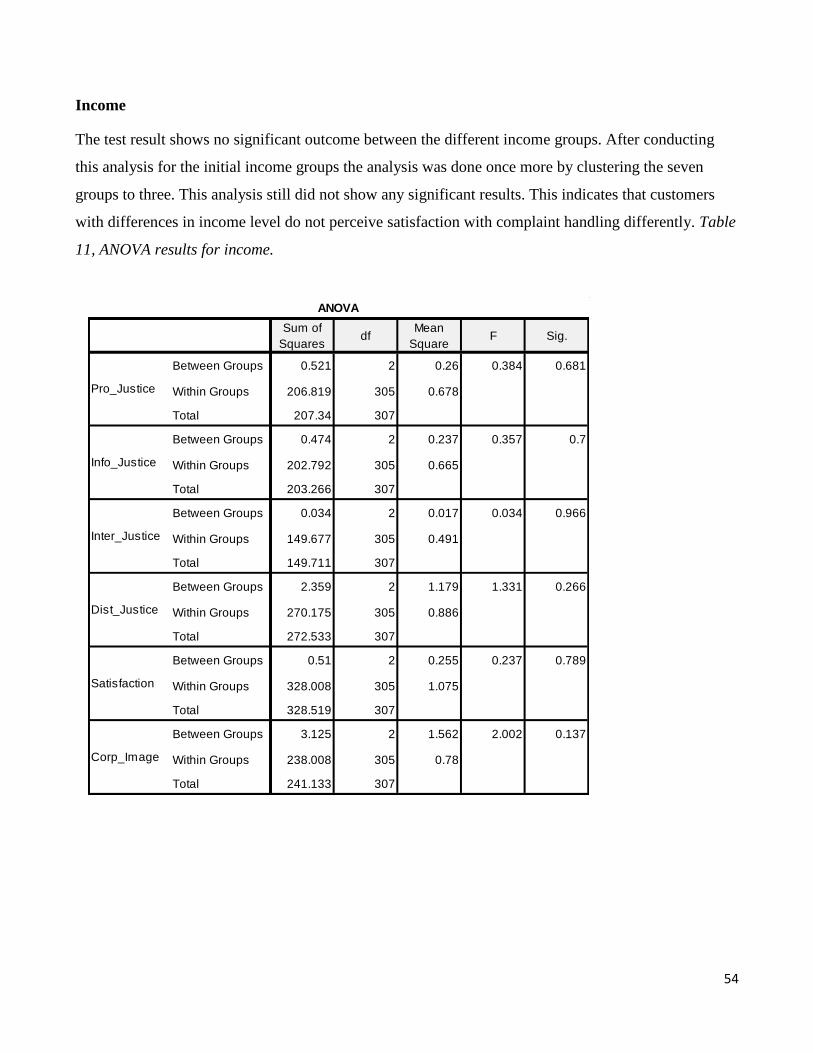
54
Income
The test result shows no significant outcome between the different income groups. After conducting
this analysis for the initial income groups the analysis was done once more by clustering the seven
groups to three. This analysis still did not show any significant results. This indicates that customers
with differences in income level do not perceive satisfaction with complaint handling differently. Table
11, ANOVA results for income.
Sum of
Squaresdf
Mean
SquareF Sig.
Between Groups 0.521 2 0.26 0.384 0.681
Within Groups 206.819 305 0.678
Total 207.34 307
Between Groups 0.474 2 0.237 0.357 0.7
Within Groups 202.792 305 0.665
Total 203.266 307
Between Groups 0.034 2 0.017 0.034 0.966
Within Groups 149.677 305 0.491
Total 149.711 307
Between Groups 2.359 2 1.179 1.331 0.266
Within Groups 270.175 305 0.886
Total 272.533 307
Between Groups 0.51 2 0.255 0.237 0.789
Within Groups 328.008 305 1.075
Total 328.519 307
Between Groups 3.125 2 1.562 2.002 0.137
Within Groups 238.008 305 0.78
Total 241.133 307
Dist_Justice
Satisfaction
Corp_Image
ANOVA
Pro_Justice
Info_Justice
Inter_Justice
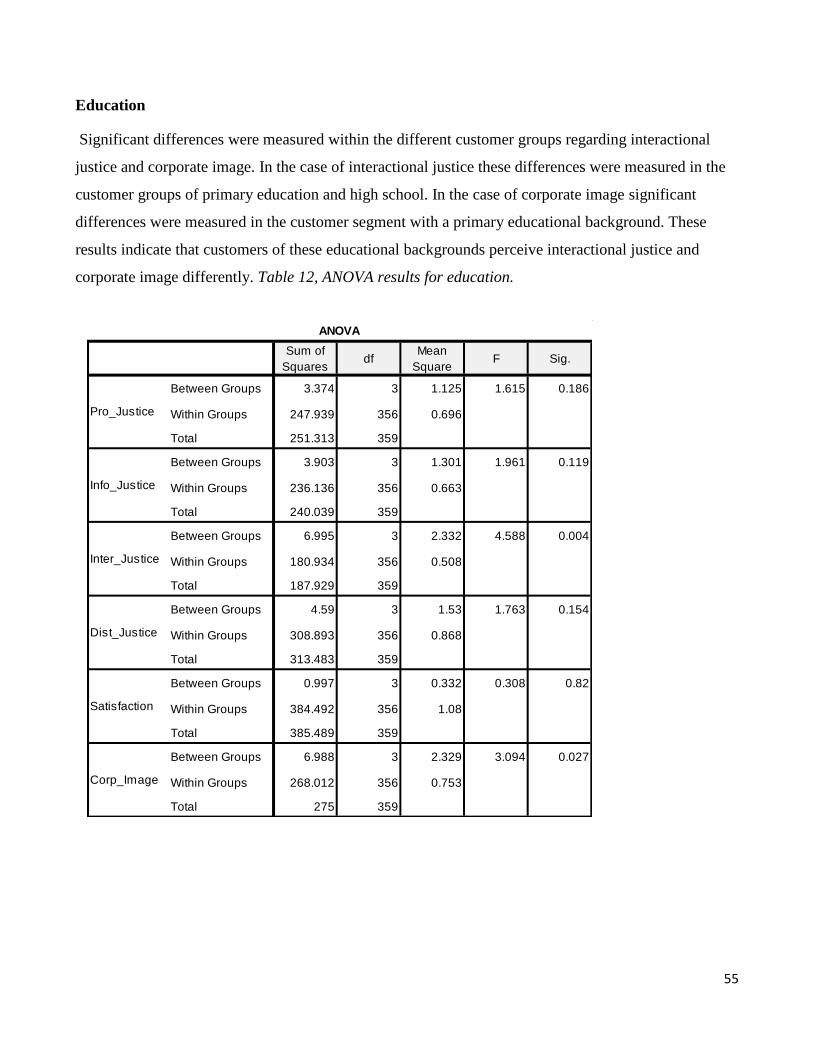
55
Education
Significant differences were measured within the different customer groups regarding interactional
justice and corporate image. In the case of interactional justice these differences were measured in the
customer groups of primary education and high school. In the case of corporate image significant
differences were measured in the customer segment with a primary educational background. These
results indicate that customers of these educational backgrounds perceive interactional justice and
corporate image differently. Table 12, ANOVA results for education.
Sum of
Squaresdf
Mean
SquareF Sig.
Between Groups 3.374 3 1.125 1.615 0.186
Within Groups 247.939 356 0.696
Total 251.313 359
Between Groups 3.903 3 1.301 1.961 0.119
Within Groups 236.136 356 0.663
Total 240.039 359
Between Groups 6.995 3 2.332 4.588 0.004
Within Groups 180.934 356 0.508
Total 187.929 359
Between Groups 4.59 3 1.53 1.763 0.154
Within Groups 308.893 356 0.868
Total 313.483 359
Between Groups 0.997 3 0.332 0.308 0.82
Within Groups 384.492 356 1.08
Total 385.489 359
Between Groups 6.988 3 2.329 3.094 0.027
Within Groups 268.012 356 0.753
Total 275 359
Satisfaction
Corp_Image
ANOVA
Pro_Justice
Info_Justice
Inter_Justice
Dist_Justice
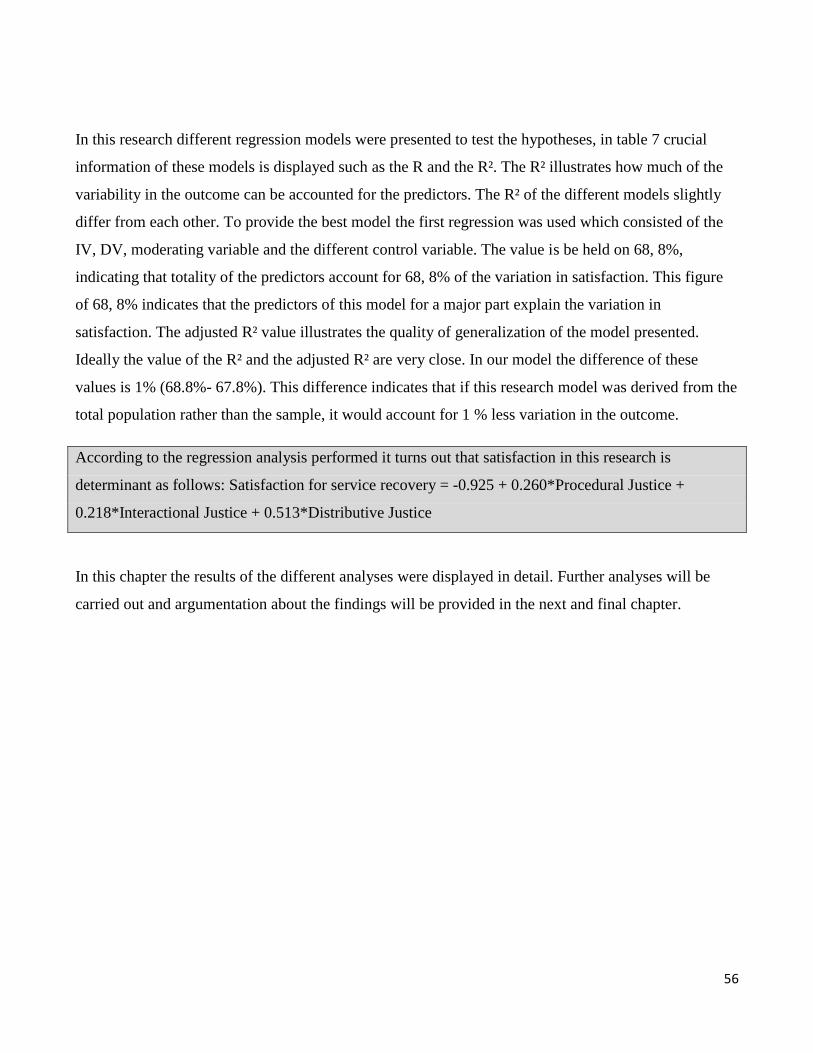
56
In this research different regression models were presented to test the hypotheses, in table 7 crucial
information of these models is displayed such as the R and the R². The R² illustrates how much of the
variability in the outcome can be accounted for the predictors. The R² of the different models slightly
differ from each other. To provide the best model the first regression was used which consisted of the
IV, DV, moderating variable and the different control variable. The value is be held on 68, 8%,
indicating that totality of the predictors account for 68, 8% of the variation in satisfaction. This figure
of 68, 8% indicates that the predictors of this model for a major part explain the variation in
satisfaction. The adjusted R² value illustrates the quality of generalization of the model presented.
Ideally the value of the R² and the adjusted R² are very close. In our model the difference of these
values is 1% (68.8%- 67.8%). This difference indicates that if this research model was derived from the
total population rather than the sample, it would account for 1 % less variation in the outcome.
According to the regression analysis performed it turns out that satisfaction in this research is
determinant as follows: Satisfaction for service recovery = -0.925 + 0.260*Procedural Justice +
0.218*Interactional Justice + 0.513*Distributive Justice
In this chapter the results of the different analyses were displayed in detail. Further analyses will be
carried out and argumentation about the findings will be provided in the next and final chapter.
57
CHAPTER V: DISCUSSION
5.1 Introduction
From the literature review conducted we have learned that this subject is very broad and gains much
attention from public and private organizations globally. In general, there is a lot of literature and
studies regarding customer satisfaction concerning public and private companies. When it comes to
PU‟s in the monopolistic context in Suriname there is not much research information available.
Moreover, in the past 10 years there was little to be found on studies conducted in the field of customer
satisfaction in the monopolistic context facing a transformation process. This study is carried out in the
PU sector in Suriname, a sector that has many challenges ahead. The study started with discussing the
changing environment that PU‟s are facing, and focused further on the importance of customer
satisfaction for these companies. Later on the importance of customer complaint behavior in relation to
the improvement of customer satisfaction was thoroughly emphasized. After this the benefits of service
recovery, which is an important instrument in a monopolistic context to improve customer satisfaction
was researched. Finally the research models with the different variables were operationalized with a
survey conducted among domestic customers of the EBS.
In this final chapter analyses are made of the results obtained from the data. The hypotheses will be
addressed further and argumentation will be provided based on the findings presented in chapter four.
The research questions will be answered based on the analysis and results of the statistical tests
performed in the previous chapter. The theoretical and managerial implications will be discussed and
suggestions for future research will be given. This chapter consists of six paragraphs, in paragraph 5.2
the main findings are discussed. In paragraph 5.3 the research question will be answered. The
conclusions and the recommendations will be discussed in the chapters 5.4 and 5.5. In Paragraph 5.6
the limitation and the implication for further research of this research will be discussed.
58
5.2 Main findings
Perceived justice in service recovery is a cluster of four independent variables distributive, procedural,
interactional and informational justice. The dependent variable is satisfaction with service recovery and
the moderating variable is corporate image. The reader is referred to paragraph 2.5 for the conceptual
model. The problem statement of this study was: How can service recovery help improve customer
satisfaction within public utility companies?
The objective of this research was to determine how customer complaint behavior in public utility
companies in Suriname influences customer satisfaction and to determine which variables influence
customer satisfaction the most in the case of public utilities in Suriname. Further the researcher wanted
to investigate how service recovery can improve customer satisfaction for public utility companies in
Suriname. The main research question of this study was: How does service recovery influence
customer satisfaction in public utility companies? This study shows that perceived justice with service
recovery does contribute to satisfaction with service recovery as described in the literature review.
Previous studies have shown that customers voicing about their dissatisfaction with poor services give
service providers the chance to recover these service failures. What is done and how it is done
influences the customer‟s perception of the service recovery. The fairness theory is seen as the
dominant theoretical framework applied to service recovery. This theory relates to the perceived
fairness of a transaction. Customers make their judgment based on the level to which the service
recovery process was fair and these judgments influence their satisfaction ( Chebat and Slusarczyk,
2005). The main contribution of this thesis, drawn from this empirical research in a monopolistic
market, provides for the most part a similar picture. In this study, complaining customers experience
service recovery to have a significant impact on satisfaction with service recovery. The findings of this
study show three important results:
1. Improving customer satisfaction is critical for every company, especially PU‟s facing changing
market conditions.
2. Of the four elements of justice studied in this research, distributive justice has the largest impact
on satisfaction.
3. Corporate image does not have a strong impact on the relationship between justice with service
recovery and satisfaction with service recovery.
59
5.2.1. Customer satisfaction is critical for PU’s
This study shows that companies globally are facing more intense customer service pressures than
before. The changing market situation makes it critical for PU‟s in general, but also those operating in
Suriname to focus more on improving customer satisfaction. The first H0 of this study, that distributive
justice in service recovery does not have a positive impact on customer was rejected and the H1 was
accepted. Distributive justice is primarily concerned with the outcome of the recovery seeking process.
It is about the effort the service provider made to solve the problem and whether the outcome of
recovery seeking process offsets the cost the offended customer incurred. The result tells us that
complaining customers ascribe distributive justice to have the greatest value on satisfaction with
service recovery. The ANOVA test conducted with the control variables age, gender, income and
education in general did not show significant relationships between the independent, dependent and the
moderating variable. Meaning that the different customer segments does not value perceived justice in
service recovery, satisfaction with service recovery and the impact of the moderating variable
corporate image on these two variables differently. Instead, the results show strong similarities between
the different customer groups. This means that customer satisfaction is strongly determent by the
outcome of the recovery process. Therefore, we can conclude that customers in the monopolistic PU
context form their judgments about satisfaction mainly by the outcome. These results can be explained
by the type of product and service investigated in this study. Electricity is experienced as a dissatisfier,
a product that customers simply expect to be available when they need it. Thus, in a PU monopolistic
context coping with a service failure encounter, the outcome of the process is of great importance for
the customer. Management of these companies should implement a complaint management process that
focuses strongly on the outcome of the service recovery process.
The second H0 of this study, that interactional justice in service recovery does not have a positive
impact on customer satisfaction with service recovery was rejected and the H1 was accepted. In the
literature review we defined interactional justice as the focus on how fair the interpersonal treatment
was which the customer receives during the process of seeking service recovery. The result tells us that
customer‟s give interactional justice great value on satisfaction with service recovery. The ANOVA
test conducted with the different control variables mentioned above indicates that customers with
different educational background perceive interactional justice differently. The Tukey post- hoc
analysis revealed that there was a statistically significant difference between the educational group
“other” and the other six educational groups. The group “other” consisting of eight respondents had the

60
lowest mean, 2.85. The other six educational groups showed means between 3.6 and 3.9. The group of
“other” can be seen as a group that doesn‟t have any formal education and they also can be categorized
as the group with the lowest education. An explanation of this result can be that the customer service
employees don‟t have the proper skills to assist this group of customers and that these customers for
instance feel they are not treated respectfully. PU‟s have to focus more on this group of customers. This
result indicates that treating the customer politely and courteously boosts the customer‟s satisfaction
level. Contact employees must possess sufficient interpersonal skills. PU‟s must make proper effort in
training their employees and they must design practices to respond to dissatisfaction regarding all the
different segments. Service encounter employees have to know what they are doing and why they are
doing it, in order to be able to provide the customer with a higher level of service. This result shows the
importance for PU‟s to select employees with empathy and a high level of service orientation. The
PU‟s must be aware that customers of different educational background expect to be approached
differently.
The third H0, that procedural justice in service recovery does not have a positive impact on customer
satisfaction with complaint handling was, rejected and the H1 was accepted. Procedural justice in the
literature review is defined as the customers‟ perception of how fair the policies, procedures and
different criteria were, which were used by the company in the recovery seeking process. Complaining
customers in the context of this study ascribe procedural justice to have a great value on satisfaction
with service recovery. The ANOVA test conducted with the different control variables indicates that
customers do not perceive procedural justice differently and that all the different customer groups have
the same demand on this issue. This indicates that the customers value employees that are empowered
and have the authority to act quickly in solving the problem. Management of PU‟s should focus on
providing their employees with sufficient responsibility and authority to make decisions that solves the
problem. Because of the critical value electricity and the involved services have for customers they
demand that there problem are solved promptly and properly.

61
5.2.2 Customers value the outcome of the process more than the treatment
This indicates that customers value fairness of outcomes as a result of the recovery process to be the
most important component. This result is consistent with other studies, in which distributive justice also
was found to have the greatest impact on satisfaction ( Clemmer, 1993; Matilla, 2001). The results
show that complaining customers form their overall judgment about the different aspects of the service
recovery process by the fairness of the outcome, the treatment they received and procedures of the
process. Furthermore we see that these judgments have a positive impact on customer satisfaction.
The fourth H0, that informational justice in service recovery does not have a positive impact on
customer satisfaction with service recovery, was accepted and the H1 was rejected. Informational
justice as defined in this study focuses on the equity of the justification and the explanation the
company offers to the customer. The result of this test tells us that complaining customers in the
context of this study ascribe informational justice to have no significant value on satisfaction with
service recovery. Meaning, that complaining customers facing service failure value information
regarding the cause of the service failure less than the other three elements of perceived justice with
service recovery. Electricity seems to be so important in daily live for customers that the cause of the
problem is valued as less important when a problem occurs. It seems that it is more important for the
customer to get the problem solved as quickly as possible. The ANOVA test conducted with the
different control variables mentioned indicates that customers do not perceive informational justice
differently. The characteristics of the product and services and its importance for the customer show
that PU‟s must focus far more on solving the problem promptly and treating the customer politely and
courteously.
The moderating variable corporate image was introduced in the relationship of the IV and the DV.
With the introduction of this variable the researcher wanted to measure whether corporate image
positively moderates the relationship between the four IV‟s and the DV separately. In the literature
review corporate image is stated to be essential for companies and it is key to security and maintaining
public trust. It is further argued that it is an important factor in the customers overall evaluation of
service quality that is provided by the service provider. It can be defined as the perception of a
company that customers‟ hold in their memories and that it reflects a company‟s overall reputation. The
test results of the hypotheses five, six, seven and eight indicate that corporate image does not have a
significant influence on the relationship of IV‟s and DV variable. This is a notable finding. Looking

62
further at the test result we see, that corporate image does not moderate the relationship of the IV and
DV variables. Thus, it does not matter if corporate image is high or low, the effect of perceived justice
in service recovery will be the same on satisfaction with service recovery. The result of this test
demonstrates further that complaining customers differentiated by education, income, gender and age
only perceive corporate image differently in the customer segment education. The Tukey post- hoc
analysis revealed that there was a statistically significant difference between the educational group,
higher vocational education and the other six groups. This group consisting of fifty eight respondents
had the lowest mean, 2.9. The other six educational groups showed means between 3.2 and 3.6. The
groups of higher vocational education together with the group of “university” are the groups of
respondents with the highest education. The results show that the group of “university”, 35 respondents
had a mean of 3.2. This mean is the lowest after higher educational education. This indicates that the
customers with the highest education level perceive the image of the EBS less than the other groups. In
their memories they experience the EBS less favorable regarding their reputation and the service
quality they deliver. It can be that because of their education level they demand more of the EBS than
other customers. They don‟t only demand a speedy and fair outcome of the process, but they also
expect the EBS to deliver better services.
5.2.3 Corporate image does not seem to matter when it comes to the impact of
service recovery on satisfaction
In chapter 2.3.1 it was mentioned that customer complaint behavior in a monopolistic market tends to
follow another set of rules than in competitive markets. This explanation can also be found in the kind
of product and services investigated. This product and its availability seem to be so critical for the
customer that the image the provider has, does not matter that much. Another explanation can be found
in the monopolistic market structure in which the EBS operates. The customer does not have another
option than to buy the product from the EBS, which makes that corporate image does not have the
effect that was suggested in the literature. Thus, it does not matter if corporate image is high or low, the
effect of perceived justice in service recovery will be the same on satisfaction with service recovery.
We see this result also because dissatisfied customers in the context of this study demand the problem
to be solved promptly and properly and they want to be treated politely during this process. Corporate
63
image obviously does not play an important role in for seeing in the need of the customer, the problem
should simply be solved.
5.3 Answers to research question
In this paragraph the research questions will be answered with the knowledge gained from the literature
study and the analysis of the collected data
The main research question of this study was formulated as follows: How does service recovery
influence customer satisfaction in public utility companies? The main research question was divided
into three sub questions.
What are the most important determinants of customer complaint behavior in PU’s? From the
literature study it became clear that the individual, the provider, service and the market factors are the
main factors that determine customer complaint behavior in PU‟s. The kind of people we are, the type
of service involved in the service failure process and the market structure determines customer
complaints behavior importantly in PU‟s.
How does service recovery impact customer satisfaction in PU’s?
In chapter two, paragraph 2.4 is argued that in a monopolistic environment service recovery is an
important tool to satisfy customers when they complain about a service failure. Referring to our
findings in chapter four, the outcome is that the first three sub variables significantly contribute to
satisfaction with service recovery and that the fourth sub variable, informational justice does not
contribute significantly to satisfaction with service recovery. The results show that complaining
customers in the context of this study value the outcome of the service recovery process the most. The
answer to the second research question is that service recovery positively impacts customer satisfaction
in PU‟s.
What moderating roles does organizational image play in the relationship between perceived
justice with service recovery and satisfaction with service recovery?
When it comes to the interaction pattern between perceived justice with service recovery and
satisfaction with service recovery, we see that corporate image does not significantly affect the
relationship between perceived justice with service recovery and satisfaction with service recovery.
64
This finding is important to mention, especially since some studies ( Smidts et al, 2001) have
considered the moderating effect of corporate image. This finding suggests an interesting theoretical
insight since very few studies have been conducted with the moderating affect of the relationship of
perceived justice with service recovery and satisfaction with service recovery in a monopolistic PU
context. This result indicates that it does not matter if corporate image is high or low, the effect of
perceived justice in service recovery will be the same on satisfaction with service recovery. This
contrary to the literature review discussed in this study, which argues that corporate image is an
important factor in the customers overall evaluation of service quality. It can be defined as the
perception of a company that customers‟ hold in their memories and that it reflects a company‟s overall
reputation. Surprisingly this important issue is neglected by customers in the monopolistic PU context,
thus it does not play a significant moderating role.
5.4 Conclusion
This study confirmed that focusing on improvement of customer satisfaction is critical for
organizations. Different researchers argue that nowadays PU‟s increasingly focus on customer
satisfaction because it is critical for financial success. Service recovery was recognized as a valuable
instrument to increase customer satisfaction in the monopolistic context regarding PU‟s. A model was
developed consisting of perceived justice in service recovery as independent variable and satisfaction
with service recovery as dependent variable, to measure customer satisfaction. Corporate image was
included in the model as moderating variable to measure the impact it has on the relationship of the
IV‟s and the DV. The results of this study demonstrate that distributive justice (Q4-6), procedural
justice (Q7-11) and interactional justice (Q17-21) have a high impact on satisfaction with service
recovery. The findings illustrate that distributive justice has the strongest contribution on satisfaction.
These three variables have a contribution of 68,4 % on satisfaction in this model. The study results
demonstrate that informational justice (Q12-16) does not have a significant impact on satisfaction. An
interesting result was that the moderating variable, corporate image, contrary with what was indicated
in the literature review does not have a significant impact on satisfaction. Another interesting result was
contrary to what was described in the literature review regarding complainer characteristics and their
behavior conducted in competitive and loose monopolies. In this present study in general no significant
differences were measured in the way the different customer segment perceive justice in service
65
recovery and satisfaction with service recovery. Only in the case of interactional justice and corporate
image we saw some difference in the customer segment education. The contribution of this study
provides a different picture. This raises the question whether this is a reflection of a PU operating in a
monopolistic market in general or the particular monopolistic PU studied in this research. The results
of this study are significant for four reasons. I, we see that also for PU‟s focusing on satisfaction is
critical. II, we see that these results are consistent with other studies conducted in a competitive
environment, in which distributive justice also was found to have the greatest impact on satisfaction.
This study shows further that customers value the outcome of the process more than the treatment, the
procedures and the information they get during the process. III, we see that corporate image does not
significantly moderate the relationship of the IV‟s and the DV as different research argues. IV, the
different customer segments do not perceive satisfaction differently. These findings can cautiously be
explained by the market structure and the type of product and services this study has covered.
Electricity is a commodity and has few specialties‟ compared to other services. Customer‟s belief that
electricity is a naturally given supply, they rarely compare the benefits with its price, whether it has a
continuous supply or if the quality has been changed since its invention. Customers simply expect to
consume this product to its fullest benefit whenever needed.
5.5 Recommendations
From this research the importance of customer satisfaction for both private and public utility
companies became clear. The study results revealed that service recovery has a positive impact on
satisfaction in PU‟s operating in a monopolistic context. The results brought to light how complaining
customers perceive the different elements of the service recovery process and how satisfied they are
with the service recovery process and outcome. The reader is asked to keep in mind that this study was
carried out for the domestic customers of the EBS. The outcome of the study makes clear how the four
elements of perceived justice with service recovery are experienced by the complaining customers. The
study makes clear that corporate image does not moderate the relationship between perceived justice
with service recovery and satisfaction with service recovery. The study result shows different results
about the customer characteristics.
The outcome of this research reveals important reasons that make it absolutely necessary for PU‟s in
Suriname to start incorporating these practices in their organizations, especially those PU‟s that are

66
facing changing market situations in the near future. PU‟s must learn to treat and solve service failures
in order to reduce the damages they cause to a certain minimum. It is also of great importance in the
service failure context to implement an effective complaint management which is crucial to reach
higher customer satisfaction levels. Perceived justice in service recovery, especially distributive,
procedural and interactional justice are fundamental because they positively impact satisfaction. PU‟s
should pay proper attention to these factors and establish sufficient compensation and apology
strategies and train its employees to act prompt when problems occur. It is important that front office
employees posses sufficient interpersonal and technical skills. PU‟s must make proper training efforts
and design practices to respond to dissatisfaction. Employees must know exactly what they are doing
and why they are doing it, in order to provide the dissatisfied customer with a higher level of customer
satisfaction. Focusing on these issues should allow these companies operating in a monopolistic context
to improve customer satisfaction and prepare them to enter an environment with changing market
conditions and changing customer preferences. The four stage model of Zairi can be applied to achieve
these goals. As confirmed by this study, listening to the voice of the customer has benefits for the
customer as well as for the service provider. With the information gathered the provider can investigate
the root cause and develop sufficient action. This study has clearly shown that the outcome of this
process combined with the treatment the customer gets and the procedures followed are valued the
most by the customer. This makes it very important to focus on solving the problem as quick as
possible. Implementing the actions necessary and monitoring them continuously can help PU‟s to
improve customer satisfaction within PU‟s. This study is conducted within the domestic customers of
the EBS, it is finally recommended to conduct further research within the other customer segments.
This will be helpful in obtaining information regarding the experience the commercial and industrial
customers have with the service recovery process and the impact it has on customer satisfaction.
67
5.6 Limitation and implication for further research
Limitation
This research has some limitations, which constrains the findings of this study. Mainly this study has
three limitations. I, it is conducted in a single organization, which restricts the extent to which the
findings can be generalized to other organizations. But on the other hand, there are many similarities
that are applicable for other PU‟s and this study has an implication that goes beyond the EBS. II, it is
conducted among domestic customers of a PU. This restricts the extent to which the findings of the
study can be used to generalize it to the other two major customer segments, commercial and industrial
customers. The researcher chose to conduct the study within this group because it represents the largest
customer segment and because customer satisfaction nowadays plays a critical role within this group.
This choice was also made because PU‟s in Suriname already have practices that focus more
extensively on the specific issues of corporate customers. III, there is possibility of bias in this research,
since all my variables are measured through one single survey. Also customers that have experienced
the service recovery process some time ago may not have been able to reproduce the information
needed for the questionnaire properly. To minimize potential bias all questionnaires were anonymous
and all the questions were grouped per variable. Also respondents were ensured that there was no right
or wrong answers.
Implication for further research
As the public utility sector in Suriname is expected to undergo changes in the feature, this study can be
used as a starting point and valuable piece for future research. There has been little empirical research
on customer complaint behavior, satisfaction with service recovery and the role that corporate image
has on the relationship between perceived justice on service recovery and satisfaction. If customers are
aware that they cannot switch to another service provider, this will trigger complaint behavior that
probably is different from competitive markets. Future studies can be extended to the difference of
complaint behavior in monopolistic and competitive markets. Much research is done about complainers
in competitive markets, but very little is known about complaining in monopolistic markets. Also
future research should focus on the role that corporate image has on satisfaction in other PU‟s and
whether there are differences in findings with this study. It is important to investigate if this finding
only counts in the case of the EBS or whether it is also applicable for other PU‟s providing different
products and services.

68
It is important that service providers understand the relationship they have with the customer. Service
providers should encourage dissatisfied customers to complain to the provider, which gives the
provider the change to remedy these problems. But if dissatisfied customers are loyal to the provider or
they perceive that complaining is probably fruitless, they might not take action. Customers might not
complain and become silent in a monopolistic market. This is important for this market structure
because there are no external alternative providers to whom the dissatisfied customer can switch to.
The challenge PU‟s are facing in Suriname is how they can anticipate on customer‟s complaints and
how they can facilitate the complaint process to its fullest potential.
With the knowledge and information gathered with my study the Management of the PU‟s will be able
to maximize the service recovery process and thereby improve customer satisfaction. It is
recommended that management of these companies endorse further research on customer satisfaction
issues in PU‟s in the monopolistic context. These studies will help obtain more in depth information,
which can be used to facilitate the change process these companies are facing. Knowing how their
company is doing and what the customer expects from them will be managed more successfully with
proper information in hand.
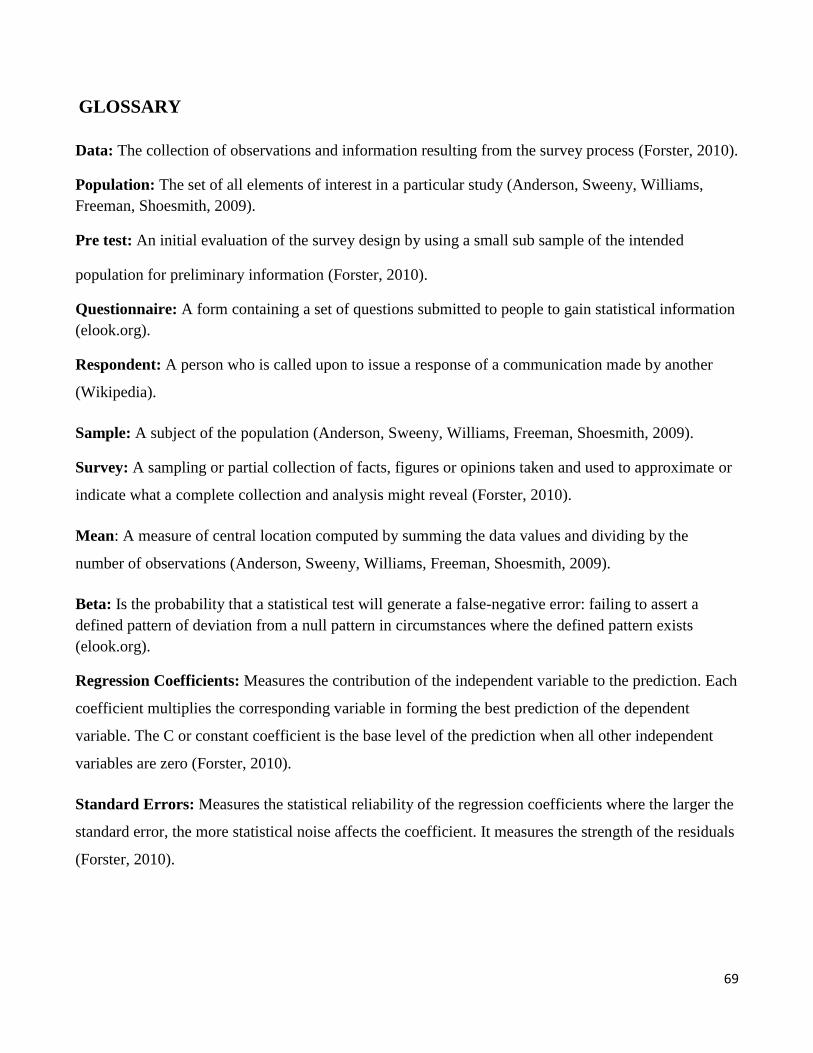
69
GLOSSARY
Data: The collection of observations and information resulting from the survey process (Forster, 2010).
Population: The set of all elements of interest in a particular study (Anderson, Sweeny, Williams,
Freeman, Shoesmith, 2009).
Pre test: An initial evaluation of the survey design by using a small sub sample of the intended
population for preliminary information (Forster, 2010).
Questionnaire: A form containing a set of questions submitted to people to gain statistical information
(elook.org).
Respondent: A person who is called upon to issue a response of a communication made by another
(Wikipedia).
Sample: A subject of the population (Anderson, Sweeny, Williams, Freeman, Shoesmith, 2009).
Survey: A sampling or partial collection of facts, figures or opinions taken and used to approximate or
indicate what a complete collection and analysis might reveal (Forster, 2010).
Mean: A measure of central location computed by summing the data values and dividing by the
number of observations (Anderson, Sweeny, Williams, Freeman, Shoesmith, 2009).
Beta: Is the probability that a statistical test will generate a false-negative error: failing to assert a
defined pattern of deviation from a null pattern in circumstances where the defined pattern exists
(elook.org).
Regression Coefficients: Measures the contribution of the independent variable to the prediction. Each
coefficient multiplies the corresponding variable in forming the best prediction of the dependent
variable. The C or constant coefficient is the base level of the prediction when all other independent
variables are zero (Forster, 2010).
Standard Errors: Measures the statistical reliability of the regression coefficients where the larger the
standard error, the more statistical noise affects the coefficient. It measures the strength of the residuals
(Forster, 2010).

70
Sample Variance: Is a measure of dispersion. In other words, it shows how the sample data varies
around the mean (Forster, 2010).
Standard Deviation: A measure of variability computed by taking the positive square root of the
variance (Anderson, Sweeny, Williams, Freeman, Shoesmith, 2009).
Degrees of Freedom: Is the number of observations minus the number of coefficients estimated. The
lower the degrees of freedom, the less reliable the estimate is likely to be (Forster, 2010).
R: Measures the "goodness of fit." In other words, it measures the success of the regression in
predicting the values of the dependent variable within the sample. It is the fraction of the variance of
the dependent variable explained by the independent variable (Forster, 2010).
Adjusted R²: Is R adjusted for degrees of freedom. A slightly different variance is used with this
measure than with R². Adjusted R²will increase or decrease depending on whether the improvement in
fit caused by the addition of the new variable outweighs the loss of the degree of freedom (Forster,
2010).
Correlation Coefficient: Measures the strength and direction of the linear relationship between two
variables (X and Y). The value lies between -1 and 1.The larger the correlation coefficient the larger
the linear relationship between these two variables (Forster, 2010).
Level of Significance: The probability of making a Type I error when the null hypothesis is true as an
equality. The level of significance is usually between 0.01 and 0.05 (Anderson, Sweeny, Williams,
Freeman, Shoesmith, 2009).
Test statistic: A statistic whose value helps determines whether a null hypothesis can be rejected
(elook.org).

71
LIST OF ABBREVIATIONS
EBS: Energiebedrijven Suriname
IV: Independent Variable
DV: Dependent Variable
PU: Public Utilities
WOM: Word of Mouth
ANOVA: Analysis of Variance
72
LIST OF FIGURES
Figure 1: Four stage model to improve customer satisfaction;
Figure 2: Conceptual model;
Figure 3: Numbers of customers by district;
Figure 4: Different customer segments in Paramaribo;
Figure 5: Different customer segments in Suriname;
Figure 6: Age groups the different customers belong to;
Figure 7: Age of the respondents;
Figure 8: Number of respondents based their education level;
Figure 9: overview of the income of respondents;
Figure 10: Hypothesized model.
73
LIST OF TABLES
Table 1: Information regarding the dependent variable;
Table 2: Information regarding the independent variable;
Table 3: Information regarding the moderating variable;
Table 4: Information regarding the reliability scores;
Table 5: Correlation coefficients of the different variables;
Table 6: Value and effect of correlation coefficients;
Table 7: Results of regression analyses;
Table 8: Summary of hypotheses tests;
Table 9: ANOVA results regarding age;
Table 10: ANOVA results regarding gender;
Table 11: ANOVA results regarding income;
Table 12: ANOVA results regarding education;

74
BIBLIOGRAPHY
Andreasen, A.R. 1988, Consumer complaints and redress: what we know and what we don‟t
know, in Maynes, The Frontier of Research in the Consumer Interest, American
Council on Consumer Interests, Columbia, MO.
Andreasen, A.R. and Best, A. (1977), Consumers complain – does business respond? Harvard
Business Review, Vol. 55, pp. 93-101.
Andreassen T, W, 1998, Antecedents to satisfaction, with service recovery, The Norwegian School of
Management, Sandvika, Norway
Bearden, W.O., Teel, J.E. and Crockett, M. 1980, A path model of consumer complaint
behavior, Marketing in the 80s, American Marketing Association,Chicago, IL.
Berry, L.L. and Parasuraman, A. 1991, Marketing Services: Competing through Quality, The Free
Press, New York, NY.
Best, A. and Andreasen, A.R. 1977, Consumer response to unsatisfactory purchases: a survey
of perceiving defeats, voicing complaints and obtaining redress, Law & Society, Vol. 11,
pp. 490-5.
Boote Jonathan, 1998, Towards a Comprehensive Taxonomy and Model of Consumer Complaining
Behaviour, Journal of Consumer Satisfaction, Dissatisfaction and Complaining Behavior, 11 (1), 141-
151.
Blodgett, J.G., Hill, D.J. and Tax, S.S. (1997), “The effects of distributive justice, procedural and
interactional justice on post complaint behavior”, Journal of Retailing, Vol. 73 No. 2,
pp. 185-210.

75
Blodgett Jeffrey G. and Donald H. Granbois (1992). Toward an Integrated Conceptual
Model of Consumer Complaining Behaviour, Journal of Consumer Satisfaction, Dissatisfaction
and Complaining Behaviour, 5, 93-103.
Chebat, J.C. and Slusarczyk, W. 2005, How emotions mediate the effects of perceived justice on
loyalty in service recovery situations: an empirical study, Journal of Business Research,
Vol. 58 No. 5, pp. 664-73.
Clemmer, E.C. (1993), “An investigation into the relationship of fairness and customer satisfaction
with service”, in Cropanzano, R. (Ed.), Justice in the Workplace – Approaching Fairness in Human
Resources Management Series in Applied Psychology, Lawrence Erlbaum Associates, Hillsdale, NJ,
pp. 193-207.
Donnelly, M., Shui, E. 1999, Assessing service quality and its link with value for money in a
UK local authority‟s housing repairs service using the SERVQUAL approach. Total
Quality Management Business Excellence Vol. 10 No. 4/5 pp. 498-506
Dwyer, R.E., Schurr, P.H. and Oh, S. 1987, Developing buyer-seller relationships, Journal of
Marketing, Vol. 51, pp. 11-27.
Elliot J. and Serna C, 2005, Managing customer satisfaction involves more than improving reliability,
the electrical journal, vol. 18, page 84- 89.
Erzsébet Hetesi and Gábor Rekettye ,University of Szeged – Hungary, University of Pécs – Hungary,
2001
FecỈkovaẮ Ingrid, 2004, An index method for measurement of Customer Satisfaction; the TQM
magazine;vol. 12 pp.389- 394.
76
Fornell, C. 1992, a national customer satisfaction barometer: the Swedish experience, Journal of
Marketing,Vol. 56, January, pp. 6-21.
Fornell, C. and Wernefelt, B. 1987, Defensive marketing strategy by customer complaint
management: a theoretical analysis, Journal of Marketing Research, Vol. 24, pp. 337-46.
Goodwin, C. and Ross, I. 1992, Consumer responses to service failures: influence of procedural and
interactional fairness perception, Journal of Business Research, Vol. 25, no. 2, pp. 149-63.
Greenbery, J. 1990, Organizational justice: yesterday,today and tomorrow, Journal of Management,
Vol. 16 No. 2, pp. 399-432.
Grønhaug, K. and Zaltman, G. (1980), “Complainers and non-complainers revisited: another look at the
data”, in Monroe, K. (Ed.), Advances in Consumer Research, Association for Consumer Research,
Washington, DC.
Hirschman Albert O. 1970. Exit, Voice and Loyalty: Responses to Decline in Firms, Organisations and
States, Association for Consumer Research, Harvard University: Cambridge.
Hogarth, J.M. and English, M.P. 2002, Consumer complaints and redress: an important
mechanism for protection and empowering consumers, International Journal of
Consumer Studies, Vol. 26, pp. 217-26.
Hustad, T.P. and Pessemier, E.A. 1973, Will the real consumer activist please stand up: an
examination of consumers‟ opinions about marketing practices, Journal of Marketing
Research, Vol. 10, pp. 319-24.
Inter-American Developing Bank, 2002, Sustainable Developing Department, Technical Papers Series,
Washington, D.C.
77
Keki, R Bhotel ,1995, Beyond Customer Satisfaction to Customer Loyalty; The Key to Greater
Profitability.
Kelley, S.W., Hoffman, D.K. and Davis, M.A. 1993,A typology of retail failures and recovery, Journal
of Retailing, Vol. 69 No. 4, pp. 429-52.
Kolodinsky, J. 1995, Usefulness of economics and explaining consumer complaints, Journal of
Consumer Affairs, Vol. 29, pp. 29-54.
Kotler Philip, 2003, Marketing Management, Pearson education, inc fifth edition.
Laventhal, J., Karuza, J. and Fry, W.R. 1980, Beyond fairness: a theory of allocation preferences, in
Mikula, G. (Ed.), Justice and Social Interaction, Springer-Verlag, New York, NY.
Lewis, B.R. and Spyrakopoulos, S. 2001, Service failures and recovery in retail banking:
the customers‟ perspective, International Journal of Bank Marketing, Vol. 19 No. 1,
pp. 37-47.
Mattila, A.S. (2001), “The effectiveness of service recovery in a multi-industry setting”, Journal of
Services Marketing,Vol. 15 No. 7, pp. 583-96.
McCollough, M.A., Berry, L.L. and Yadav, M.S. 2000, An empirical investigation of customer
satisfaction after service failure and recovery, Journal of Service Research,Vol. 3, pp. 121-37.
Michael Volkov (2004), Successful Relationship Marketing: Understanding the Importance of Com-
plaints in a Consumer-Oriented Paradigm, Problems & Perspectives in Management, (1),1
Mohr, L.A. and Bitner, M.J.1995, The role of employee effort in satisfaction with service transactions,
Journal of Business Research, Vol. 32 No. 3, pp. 239-52.
Oliver, R.L. 1980, a cognitive model of the antecedents and consequences of satisfaction
78
decision, Journal of Marketing Research, Vol. 17 No. 4, pp. 460-9.
Oliver, R.L. 1997, Satisfaction: A Behavioral Perspective on the Consumer, McGraw-Hill,
New York, NY.
C. Parker and B. Mathews, 2001, Customer Satisfaction: contrasting academic and consumers‟
interpretations, marketing & planning vol. 19 Iss: 1, pp. 38-44.
Paulina Beato, Jean-Jacques Laffont, Inter-American Developing Bank, Washington, D.C.2002,
Sustainable Developing Department, Technical Papers Serie.
Priluck, R, & Lala, V, 2009. The impact of the recovery paradox on retailer customer
relationship, Managing Service Quality, Vol. 19 (1) pp.42-59.
Reichheld, F., and Sasser, W. (1990). Zero Defections: Quality Comes to Service. Harvard Business
Review, 68(5), 105-111.
Singh, J. 1991, Industry characteristics and consumer dissatisfaction, The Journal of
Consumer Affairs, Vol. 25, pp. 19-56.
Singh, J. and Pandya, S. 1991, Exploring the effects of consumers‟ dissatisfaction level on
complaint behaviours, European Journal of Marketing, Vol. 25, pp. 7-21.
TARP, 1979, Consumer Complaint Handling in America: Final Report, US Office of
Consumer Affairs, Technical Assistance Research Programs, Washington, DC.
Tax, S.S. and Brown, S.W. 2000, Service recovery: research insights and practices, in Swartz, T.A. and
Iacobucci, D. (Eds), Handbook of Services Marketing and Management, Sage Publication, Thousand
Oaks, CA, pp. 271-85.

79
Tax, S.S., Brown, S.W. and Chandrashekaran, M. (1998),“Customer evaluation of service complaint
experiences: implications for relationship marketing”, Journal of Marketing, Vol. 62, April, pp. 60-76.
Tronvoll, Bärd, 2007, Complainer characteristics when exit is closed, International Journal of
Service Industry Management, Vol. 18, pp. 25-51.
Tronvoll, Bärd. 2008, a Dynamic Model of Customer Complaint Behavior from the Perspective of
Service-Dominant Logic, European Journal of Marketing: EJM-02-2008-0061.R1
Tronvoll, Bärd. 2008; Customer Complaint Behavior in Service; Dissertation, Karlstad University
Studies 2008:14.
Vargo, S and Lusch, R 2004, Evolving to a New Dominant Logic for Marketing. Journal of Marketing,
Vol. 68, p 1-17.
Zairi Mohamed, 2000, Managing Customer Satisfaction: a best practice perspective; the TQM
magazine;vol. 12 pp.389- 394.
Zemke, R. and Schaaf, D. (1989), The Service Edge, NAL Penguin, New York, NY.

80
APPENDICES
Appendix A: Regression analysis exclusive moderating variable
Coefficientsa
Model
Unstandardized Coefficients
Standardized Coefficients
t Sig.
B Std. Error
Beta
1
(Constant) -0.817 0.267 -3.065 0.002
Pro_Justice 0.276 0.074 0.22 3.754 0
Info_Justice 0.073 0.085 0.058 0.864 0.388
Inter_Justice 0.234 0.078 0.158 2.982 0.003
Dist_Justice 0.527 0.058 0.484 9.156 0
leeftijd_NEW -0.041 0.063 -0.023 -0.655 0.513
Onderwijs_NEW 0.108 0.045 0.09 2.423 0.016
Salaris_NEW -0.038 0.061 -0.024 -0.628 0.53
26 Geef uw geslacht aan 0.133 0.07 0.064 1.909 0.057
a. Dependent Variable: Satisfaction

81
Appendix B: Regression analysis inclusive interaction term distribution justice *
corporate image
Coefficientsa
Model
Unstandardized Coefficients
Standardized Coefficients
t Sig.
B Std. Error
Beta
1
(Constant) -0.616 0.463 -1.33 0.185
Pro_Justice 0.264 0.074 0.21 3.561 0
Info_Justice 0.052 0.085 0.042 0.614 0.54
Inter_Justice 0.225 0.079 0.153 2.849 0.005
Dist_Justice 0.436 0.128 0.401 3.409 0.001
Corp_Image -0.026 0.132 -0.022 -0.194 0.846
26 Geef uw geslacht aan 0.114 0.07 0.055 1.616 0.107
leeftijd_NEW -0.035 0.063 -0.019 -0.552 0.581
Onderwijs_NEW 0.108 0.044 0.09 2.435 0.015
Salaris_NEW -0.033 0.06 -0.021 -0.545 0.586
Moddiscorp 0.03 0.037 0.144 0.825 0.41
a. Dependent Variable: Satisfaction
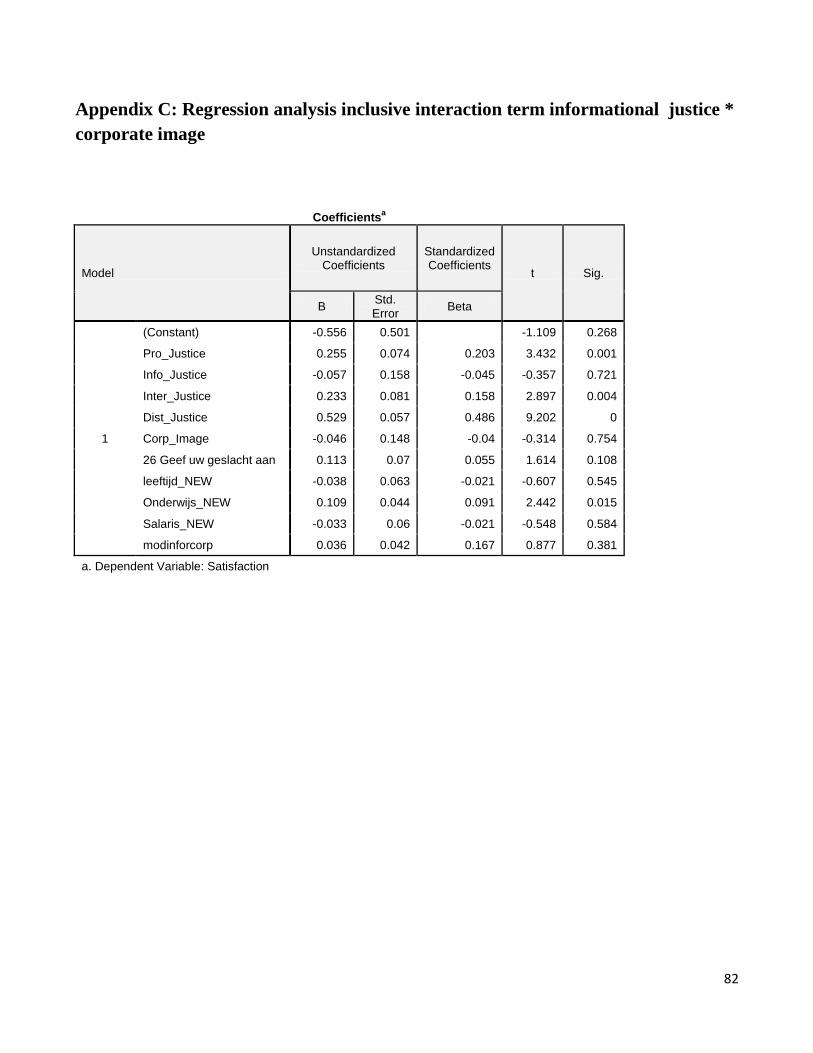
82
Appendix C: Regression analysis inclusive interaction term informational justice *
corporate image
Coefficients
a
Model
Unstandardized Coefficients
Standardized Coefficients
t Sig.
B Std. Error
Beta
1
(Constant) -0.556 0.501 -1.109 0.268
Pro_Justice 0.255 0.074 0.203 3.432 0.001
Info_Justice -0.057 0.158 -0.045 -0.357 0.721
Inter_Justice 0.233 0.081 0.158 2.897 0.004
Dist_Justice 0.529 0.057 0.486 9.202 0
Corp_Image -0.046 0.148 -0.04 -0.314 0.754
26 Geef uw geslacht aan 0.113 0.07 0.055 1.614 0.108
leeftijd_NEW -0.038 0.063 -0.021 -0.607 0.545
Onderwijs_NEW 0.109 0.044 0.091 2.442 0.015
Salaris_NEW -0.033 0.06 -0.021 -0.548 0.584
modinforcorp 0.036 0.042 0.167 0.877 0.381
a. Dependent Variable: Satisfaction

83
Appendix D: Regression analysis inclusive procedural justice * corporate image
Coefficientsa
Model
Unstandardized Coefficients
Standardized Coefficients
T Sig.
B Std. Error
Beta
1
(Constant) -0.601 0.485 -1.239 0.216
Pro_Justice 0.165 0.139 0.131 1.183 0.238
Info_Justice 0.049 0.086 0.038 0.564 0.573
Inter_Justice 0.229 0.08 0.155 2.868 0.004
Dist_Justice 0.531 0.057 0.488 9.247 0
Corp_Image -0.034 0.144 -0.029 -0.236 0.814
26 Geef uw geslacht aan 0.118 0.07 0.057 1.685 0.093
leeftijd_NEW -0.037 0.063 -0.02 -0.58 0.562
Onderwijs_NEW 0.109 0.044 0.091 2.458 0.015
Salaris_NEW -0.035 0.061 -0.022 -0.585 0.559
Modprocorp 0.033 0.04 0.148 0.809 0.419
a. Dependent Variable: Satisfaction

84
Appendix E: Regression analysis inclusive interaction term interactional justice *
corporate image
Coefficientsa
Model
Unstandardized Coefficients
Standardized Coefficients
t Sig.
B Std. Error
Beta
1
(Constant) -0.909 0.521 -1.746 0.082
Pro_Justice 0.26 0.074 0.207 3.503 0.001
Info_Justice 0.061 0.085 0.048 0.713 0.477
Inter_Justice 0.214 0.133 0.145 1.601 0.11
Dist_Justice 0.531 0.058 0.488 9.222 0
Corp_Image 0.072 0.165 0.062 0.436 0.663
26 Geef uw geslacht aan 0.12 0.07 0.058 1.709 0.089
leeftijd_NEW -0.037 0.063 -0.021 -0.593 0.554
Onderwijs_NEW 0.11 0.045 0.092 2.467 0.014
Salaris_NEW -0.032 0.061 -0.02 -0.523 0.602
modintercorp 0.002 0.042 0.007 0.036 0.971
a. Dependent Variable: Satisfaction
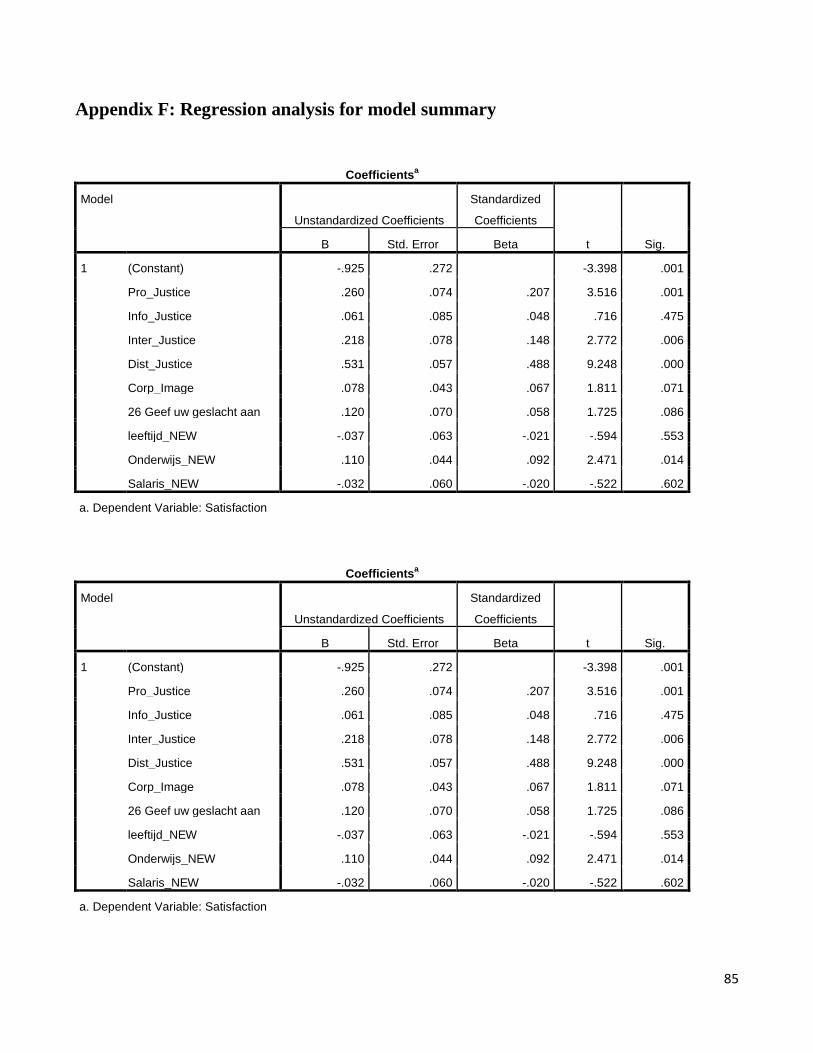
85
Appendix F: Regression analysis for model summary
Coefficientsa
Model
Unstandardized Coefficients
Standardized
Coefficients
t Sig. B Std. Error Beta
1 (Constant) -.925 .272 -3.398 .001
Pro_Justice .260 .074 .207 3.516 .001
Info_Justice .061 .085 .048 .716 .475
Inter_Justice .218 .078 .148 2.772 .006
Dist_Justice .531 .057 .488 9.248 .000
Corp_Image .078 .043 .067 1.811 .071
26 Geef uw geslacht aan .120 .070 .058 1.725 .086
leeftijd_NEW -.037 .063 -.021 -.594 .553
Onderwijs_NEW .110 .044 .092 2.471 .014
Salaris_NEW -.032 .060 -.020 -.522 .602
a. Dependent Variable: Satisfaction

86
Appendix G: Questionnaire
Customer questionnaire form
Every sentence contains a question or assumption. This you measure on a scale from 1-5. There are no right or wrong answers. We are just interested in your personal opinion.
Compl.
disagree
Dis-
agree
Neither
agree
nor
disagree
Agree
Compl.
agree
1 2 3 4 5
I feel safe in traffic X
Compl.
disagree
Dis-
agree
Neither
agree
nor
disagree
Agree
Comp
l.
agree
1 2 3 4 5
1 I am satisfied with the way the EBS handled my complaints
2 I had a positive experience when complaining to EBS
3 In my opinion, EBS has provided me with a satisfactory
answer to the problem, on this specific occasion.
4 The final compensation I received from EBS was fair, given
the time and hassle
5 It was worth the effort to report my complaint with the
EBS
6 Given the inconvenience caused by the problem, the
compensation I received was adequate

87
7 The EBS responded quickly to my problem after I had done
my complaint
8 I believe the EBS has fair policies in order to address
complaints
9 I believe that the complaints procedure of the EBS was
sufficient for me to solve the problem
10 The EBS staff showed sufficient authority to solve the
problem
11 The EBS staff showed enough skills to solve the problem
12 I think the explanation of the EBS about the causes of the
problem was reasonable
13 The EBS communicated the details of the recovery of the
services clearly
14 The EBS communicated the details of the recovery of the
services on time
15 The EBS adjusted its communication regarding the
recovery of the services to my specific needs
16 The EBS was frank in its communication of the information
how to solve the problem
17 The employees of the EBS seemed interested in my
problem
18 The employees of the EBS understood my problem
19 The employees of the EBS treated me in a friendly manner
20 I felt that the employees of the EBS did everything in their
power to solve the problem
21 In general, the behavior of the employees during the
recovery of the service can be labeled as good
22 People in society have a high opinion of the EBS
23 The EBS is considered one of the best companies in
Suriname
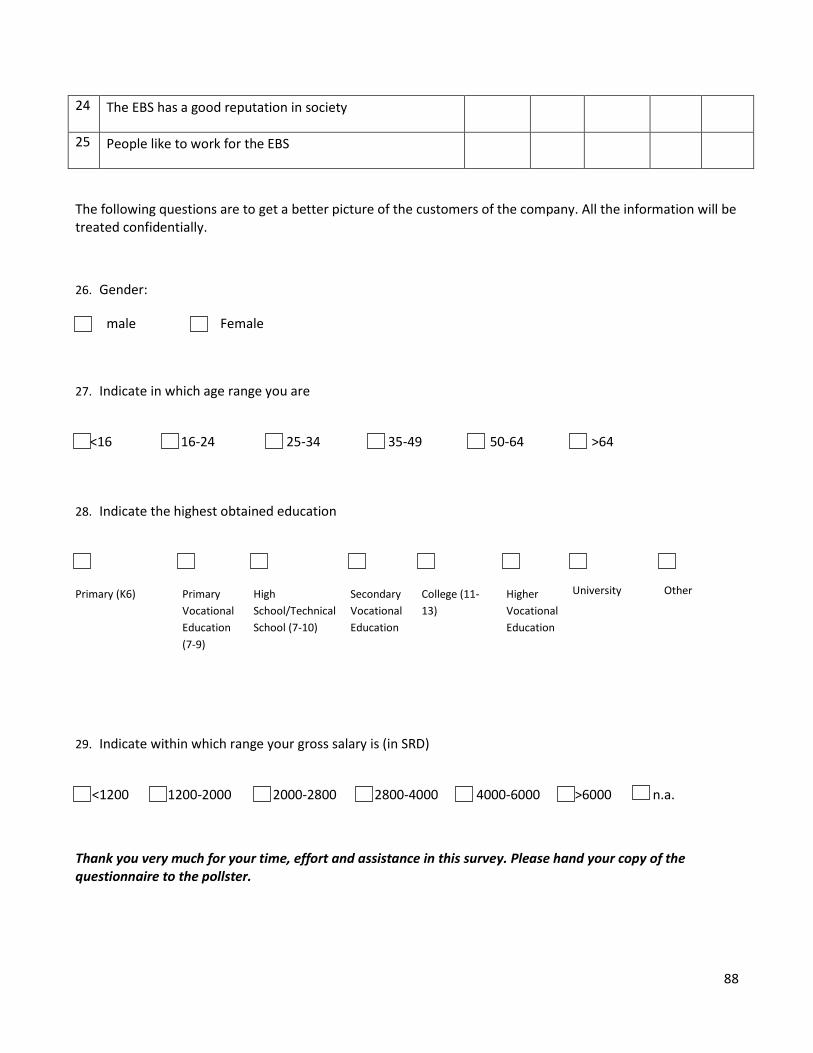
88
24 The EBS has a good reputation in society
25 People like to work for the EBS
The following questions are to get a better picture of the customers of the company. All the information will be treated confidentially.
26. Gender:
male Female
27. Indicate in which age range you are
<16 16-24 25-34 35-49 50-64 >64
28. Indicate the highest obtained education
Primary (K6)
Primary
Vocational
Education
(7-9)
High
School/Technical
School (7-10)
Secondary
Vocational
Education
College (11-
13)
Higher
Vocational
Education
University
Other
29. Indicate within which range your gross salary is (in SRD)
<1200 1200-2000 2000-2800 2800-4000 4000-6000 >6000 n.a.
Thank you very much for your time, effort and assistance in this survey. Please hand your copy of the questionnaire to the pollster.


![MBA & MBA+MSDT HANDBOOKquestromworld.bu.edu/.../FT-MBA-_-MBAMSDT-Handbook... · [ 3 ] FT MBA & MBA+MSDT INTRODUCTION The MBA and MBA+MSDT Full-Time Handbook is a reference document](https://img.dokumen.tips/doc/110x75/60bda8e811233a4a927a3ca9/mba-mbamsdt-h-3-ft-mba-mbamsdt-introduction-the-mba-and-mbamsdt.jpg)