Embed Size (px)
Citation preview

Maybe it will bedifferent abroad.”Student and Staff Perspectives on Diversity and Inclusion in student exchanges
“

This project has been funded with the support of the European Commission. The publication reflects the views only of the authors, and the Commission cannot be held responsible for any use which may be made of the information contained therein.
Copyright © 2021 by the Erasmus Student Network AISBL. All rights reserved.
Title: "Maybe it will be different abroad."
Subtitle: Student and Staff Perspectives on Diversity and Inclusion in student exchanges
Published by: Erasmus Student Network AISBL
Authors: Katherine Allinson, Wim Gabriels
Editors: Celia Partridge
Contributor: members of the Steering Committee and Advisory Board who provided feedback.
Design: Nikolina Đurić
Illustrations: StorySet
Photo: © santypan, karrastock, faishalabdula, Mego-studio, Wayhome Studio,
Syda Productions, Asier | Adobe Shutterstock; © diana.grytsku | Freepik
This information can be freely used and copied for non-commercial purposes, provided
appropriate credit is given and any changes made are indicated.
This work is licensed under a Creative Commons Attribution-NonCommercial 4.0
International License.
Please refer to the research report as:
Allinson K., Gabriels W.,(2021). Maybe it will be different abroad; student and staff perspectives
on diversity and inclusion in student exchanges. SIEM Research Report, siem-project.eu

ContentIntroductionExecutive Summary
Key FindingsRecommendations
Setting the scene Covid-19 pandemic Literature Review FindingsDefining 'fewer opportunities'
Methodology Limitations to research
Student PerspectiveStudent SurveyFocus Groups
Staff Perspective Staff Survey
Conclusion
3911
16242528334143
464790
108109
128

Introduction
5Introduction
Fostering the development of competences
‘to harness the full potential of education
and culture as drivers for jobs, social
fairness, active citizenship as well as means
to experience European identity in all its
diversity’ is one of the aims in the vision
towards a European Education Area that
would be able. The first principle of the
European Pillar of Social Rights states
that everyone has the right to quality and
inclusive education, training and lifelong
learning in order to maintain and acquire
skills that allow full participation in
society and successful transitions in the
labour market. Learning mobility is one
of the key tools in the coordinated by the
European Commission to support upward
social mobility across Europe for young
people with fewer opportunities. In order
to achieve this, inclusion is a key priority
for the upcoming Erasmus+ programme
for the period of 2021 – 2027, however
there is still little research done on the
accessibility of the programme for students
from less-advantaged backgrounds to
understand which groups in society are
underrepresented in mobility opportunities
and which barriers they perceive.
According to the EUROGRADUATE pilot
survey1, the social background of students
is an important factor that impacts mobility,
with students more likely to participate
in mobility if their parents are Higher
Education graduates themselves.
1 EUROGRADUATE pilot survey, 2020, European Commission
The Erasmus Impact Study (2019) states
that for more than 50% of non-mobile
students, issues related to finances,
personal relationships and lack of financial
resources were a barrier to participate.
Furthermore it is reported that for 40% of
reported students this conflicts with work
commitments. Students taking part in an
Erasmus mobility are 23% less likely to
be unemployed 5 years after graduation,
as 93% of all employers value the soft
skills gained by participants of mobility
programmes.
Universities UK international published
the Gone International: Expanding
Opportunities in 2018 in which they
analysed the impact of student mobility
in the UK context. The results show that
students from disadvantaged groups are
less likely to participate, while the impact
of a mobility programme on these groups is
often more pronounced.

6 Student and Staff Perspectives on Diversity and Inclusion
Social Inclusion and Engagement in Mobility
In response to this need for a better
understanding of the barriers students
experience to participate in mobility, a
collaborative cross-European partnership
established the Social Inclusion and
Engagement in Mobility (SIEM) project.
This project is an important step
toward making international mobility
opportunities more inclusive, enabling
students from all backgrounds to study,
work, or volunteer abroad. The project
has two objectives
• Widening participation of
underrepresented groups of the
Erasmus+ programme in order to
make the programme more inclusive;
• Increase the interaction between
international students and local
communities with fewer opportunities
in order to increase integration and
intercultural exchange.
The project is a collaborative cross-
European partnership between the
Erasmus Student Network (ESN),
Universities UK International (UUKi),
the European University Foundation,
YES Forum, Vrije Universiteit Brussel
(BE), University of Vigo (ES), Masaryk
University (CZ), University of Latvia (LV),
ESN Spain (ES) and ESN France (FR).

7Introduction

Executive Summary

9Executive Summary
they consider to have fewer opportunities.
This will enable universities to introduce
more targeted support and to measure
progress made in increasing participation
of these underrepresented groups. It is
important to also embed mobility metrics
across institutional strategies, and to work
in collaboration with teams across the
organisation to provide expert support for
students.
Finance continues to be a major barrier to
students accessing mobility programmes,
and this barrier is compounded for students
from less advantaged backgrounds. It
is vital that grant levels are in line with
real living costs and that students are
able to access any additional funding
they are eligible for while abroad. In
addition, universities should provide clear
information on the scholarships, grants
and bursaries available to students and
any eligibility requirements, as well as
indications of cost of living while abroad.
It is essential that institutions are student-
led and seek feedback from students, both
when it comes to the support being offered
to access programmes, but also when
designing mobility activities. The report
found that students were interested in
taking part in a wide range of programme
types and durations, and universities would
benefit from offering a diverse range of
options for students to go abroad. Working
The cross-cutting objective of the SIEM
project is to ensure that more young people
with fewer opportunities participate in the
Erasmus programme. The goal of this report
is to provide analysis of patterns and trends
in mobility by less advantaged student
groups, and to gather intelligence which
will support the increased participation of
underrepresented groups in the Erasmus
programme.
The research for this project focuses on
outgoing mobility, that is the opportunity for
learning abroad that students access during
their degree programme including study,
work, and volunteer abroad programmes.
The research undertaken to support this
project included a literature review, as well
as the circulation of a staff survey (785
responses) and a student survey (12820
responses) which were used to map some
trends in mobility participation, and to
better understand the barriers experienced
by students. The project consortia also ran
10 focus groups and undertook 6 study
visits to institutions in five nations to gather
additional intelligence to inform the reports
recommendations2.
This report makes a number of
recommendations for ways in which
universities can better support students
to access mobility opportunities. The
project calls for universities to take a first
step by defining which student groups
2 Full methodology can be found on pages X – Y of this report

10 Student and Staff Perspectives on Diversity and Inclusion
with mobility alumni as ambassadors for
programmes and promoting the benefits
of study, work and volunteer abroad from
student role models can also help support a
wider group of students to go abroad.

11Executive Summary
Key Findings
93%of staff survey respondents said
their institutions’ strategic plans
include outgoing mobility.
1/3 included reference to
disadvantaged groups
in their strategy.
Mobility strategy
Types of programmes
71%of mobile respondants
participated in Erasmus+ studies.
3% took part in a short
mobility programme.

12 Student and Staff Perspectives on Diversity and Inclusion
63%
Erasmus+
studies
53%
Erasmus+
traineeships or
internships
48%
short-term
mobility
programmes
Non-mobile students most interested in participating in:
49%of respondents to the staff survey
offered short-term mobility
opportunities to students.
Support
94%information about
available funding
88%support with the
application process
86%help choosing
a host university
What did mobile students find useful when preparing for their mobility?
Just over half of mobile respondents found meetings with international officers (55%), group information sessions (53%), and briefing events (53%) useful.

13Executive Summary
Funding
Once abroad,
of mobile respondents found welcome
meetings useful, in addition to
student organised events (75%) and
social events (78%).
89%of non-mobile respondents wanted
to participate in a buddy or
ambassador scheme.
82%
CREDIT CARD
0000000000000000
€€
€€
€of mobile respondents reported a monthly cost of living while on mobility of over €501 a month. 73% of staff respondents reported cost of living in their location as over €501 a month.
67%
19% of mobile respondents had at least 75% of their mobility costs covered by a grant or scholarship.
53% of non-mobile respondents reported needing at least 75% of the mobility programme costs to be covered by funding if they were to go abroad.
70% of non-mobile respondents from low-income backgrounds reported needing at least 75% of the mobility costs covered by a grant or scholarship, compared to 37% for respondents from high-income backgrounds. Similarly, for non-mobile respondents from ethnic minority groups, 69% reported needing at least 75% of mobility costs covered by grants or scholarships compared with 44% of white respondents.

14 Student and Staff Perspectives on Diversity and Inclusion
Barriers to mobility
82%
Other barriers for respondents included loss of
income or student job while abroad (41%) and
additional debt incurred while abroad (31%).
A higher number of respondents from
low-income backgrounds reported strong
concerns relating to upfront costs and loss of
job (43%, compared to 34% for high income
respondents).
of mobile respondents reported
needing to advance the initial
costs for a mobility period.
In addition to this, across the four target
groups higher proportions of respondents
agreed that information about opportunities
to go abroad not being available was a
barrier.
The barriers to mobility experienced by students were compounded for respondents from across the project’s target groups which reported these at a higher rate. In addition, 17% of non-mobile ethnic minority respondents agreed that fear of discrimination while going abroad was a barrier, compared to 11% of white respondents.
Other barriers included: • insufficient funding
• lack of practical support or information
• finding accommodation abroad and on
return to home country
• being isolated while abroad
• impact on academic attainment.

15Executive Summary
Experiences of discrimination while abroad
Impact
of mobile respondents indicated that
their academic performance was
impacted positively by their mobility,
and that their academic grade increased
following their mobility period.
45%of respondents indicated that their interest
to do further study or work abroad was
significantly impacted by their mobility
programme.
67%
These patterns held for the project's target groups.
76%
had positive experiences
while abroad.
However,
10% of respondents felt that they were
treated differently or unfairly at their host
university, and
15% felt that they did not have equal
access to resources and opportunities
compared to home students.
24%reported experiencing
some form of
discrimination while
abroad on a mobility
programme.
16% experienced discrimination based
on nationality, while
6% reported experiencing discrimination
on the basis of race or ethnicity, and
5% on the basis of gender.
For the report’s target groups, respondents
from low-income households reported a
slightly higher rate (30%) of experiencing
discrimination while abroad. These
respondents reported being discriminated
against based on social status (4% vs
2% for high income households). Almost
a third (32%) of respondents from
ethnic minority backgrounds reported
experiencing discrimination, with 14%
reporting this on the basis of race or
ethnicity (compared to 3% for white
respondents), and 1 in 5 reported this on
grounds of nationality (20%, compared to
15% for white respondents).

16 Student and Staff Perspectives on Diversity and Inclusion
• Coordination of a common data
standard for the Erasmus+
programme.
• Ensure national plans are in line with
the Erasmus+ Inclusion strategy.
Higher Education Institutions:• Define underrepresented groups based
on local context in order to adjust and
tailor mobility strategies to students’
needs.
International Student Organisations:• Be aware of the barriers students face
in their local context.
2. Develop a strategy
Ensuring plans for mobility programmes
are captured within institutional strategies
means that goals and targets are
sustainable and change can be achieved
over the strategy timeline. It also ensures
that mobility teams are appropriately
resourced, and that there are mechanisms
for monitoring incremental progress.
This work can be supported by including
mobility indicators in other institutional
documents such as international strategies,
Recommendations
Based on the results of the research, the
following recommendations were made in
order to improve the participation of young
people with fewer opportunitie in mobility
programmes. Each of the recommendations
brings a general recommendation and
suggests a course of action for the key
stakeholders involved in operationalising
student mobility.
1. Define ‘fewer opportunities’
Structural barriers persist in higher
education and it is important to know
which students may require additional
support to overcome these to achieve
success. Institutions should define their
underrepresented student groups to ensure
that the right types of support are put in
place, and to facilitate measuring equity
in access to mobility programmes. Having
target student groups ensures a systemic
approach can be taken to remove barriers
that stop students from engaging with
mobility experiences.
European Commission:• Facilitate a common understanding of
underrepresented groups for inclusion
action plans.

17Executive Summary
funding with students so that they can take
advantage of the multiple funding pots
available. Provide clear and transparent
information relating to costs abroad
both in terms of living costs (travel, food,
accommodation) and about opportunities
to work abroad which will enable students
to better plan budgets for their mobility
period. Where upfront costs are involved,
consider allowing students to pay on an
instalment plan. Ensure that grants are paid
on time.
European Commission:• Ensure transparent information is
offered to students on the financial
support they can receive.
• Ensure grants cover a substantial
amount of costs obtained by students.
National Authorities:• Ensure transparent procedures are in
place for the allocation of grant and
scholarship funds that are equal for all
students.
• Apply top-up procedures to support
students from less-advantaged
backgrounds.
• Foresee national support to
complement European funding to allow
students to study abroad.
Higher Education Institutions:• Ensure top-up systems are in place for
those who need it.
• Ensure the scholarships are paid on
time for students.
student experience strategies, access and
participation strategies, etc. It is important
to include explicit reference to work that
will be done to support less advantaged
students to access mobility, and mobility
targets are adopted that include
underrepresented groups.
European Commission / National Agencies• Ensure that organisational support is
available for international relations
offices to develop inclusion strategies.
National Agencies:• Ensure policy actions are in place to
support all underrepresented groups.
Higher Education Institutions:• Develop inclusion strategies to widen
participation of underrepresented
groups.
• Align inclusion strategies with
Erasmus+ national inclusion
action plans and other relevant
internationalisation documents at the
national level.
3. Provide financial support
Where possible provide structured funding
in the form of grants and scholarships
to support study, work or volunteering
abroad opportunities. Make information
on eligibility easy to understand and
share information on other sources of

18 Student and Staff Perspectives on Diversity and Inclusion
5. Streamline process
Ensure that the application process is easy
to navigate, and where possible simplify
the process by removing unnecessary
paperwork or steps in the procedure.
Consider offering drop-in sessions or
group sessions where students can seek
advice and be supported to complete any
required paperwork. Develop guidance on
completing the necessary documentation,
which includes a timeline of the process
that highlights key milestones and
deadlines which students need to meet.
National Agencies:• Foster exchange of best practices
in terms of streamlining procedures,
including success stories and
innovative practices, in HEI meetings.
Higher Education institutions:• Provide direct guidance using both
online and offline methods,
• Align transparent procedures at the
institutional level.
• Present a timeline of the whole mobility
process, highlighting key milestones
and deadlines.
• Set clear contact persons for
procedural matters from the beginning
of the application process.
• Provide instalment plans for students
who need upfront financing.
• Support students throughout the full
duration of their exchange.
4. Diversify programme offer
Offer different types of mobility
programmes across study, work and
volunteer opportunities that will appeal
to different student groups. Providing a
variety of programme durations will also
ensure that all students can engage with a
programme that suits their circumstance.
Consider offering group mobility
programmes for students who are nervous
to travel alone, and summer programmes
for students who are unable or hesitant to
go abroad during term time. Use short term
mobility programmes to introduce students
to mobility and open up ambition for more
long-term mobility at a later stage in their
degree.
European Commission / National Authorities:• Ensure short term mobilities are
embedded in the internationalisation
strategy
Higher Education Institutions:• Offer different types of mobility
programmes across study, work and
volunteer with a variety of durations.
• Embed short term mobilities in the
strategy to increase long-term student
mobility.

19Executive Summary
6. Enhance collaboration between departments
Take a whole institution approach to
sending students abroad to study, work,
and volunteer. Work in partnership with
colleagues across departments who can
provide expertise in different areas of the
mobility cycle, for example disability teams,
academic schools, international offices,
and student finance departments. Working
collectively ensures that students are
supported across all steps of the mobility
process and minimises the risk of both
misinformation and missed information.
Having a collaborative structure also allows
expert colleagues to take ownership of
specific parts of the process, which will help
students navigate who best to seek advice
from at each stage of the mobility journey.
National Agencies:• Increase collaboration at the national
level with both Governmental agencies
and civil society organisations working
in the fields of inclusion and the social
dimension of higher education.
Higher Education Institutions:• Work with the collaboration tools
developed in the Guidelines for
Inclusive Mobility Promotion and
Recruitment
• Appoint inclusive mobility officers or
joint task forces which can coordinate
the work among departments and
facilitate collaboration.
7. Outline academicattainment
Make it clear how learning will be assessed
while the student is abroad. Provide
information on how the mobility programme
will contribute to the students’ academic
progress, for example if modules are
credit bearing or if grades are transferred.
If a specific academic threshold is a
requirement of a mobility programme,
ensure that this is balanced with other
criteria that take into account student
motivation and personal background.
Higher Education Institutions:• Balance academic requirements
with other criteria such as personal
motivation and background.
8. Encourage student todiscuss their concerns
Be comfortable having difficult discussions
with students. If they raise concerns
around fear of discrimination while abroad
be ready to discuss these and outline to
students what their options are. Create a
safe space where the student can discuss
their fears without judgement, and if
needed seek specialist advice to respond to
the students’ queries. When using student
ambassadors, if they are comfortable to do
so, invite them to share any challenges they
faced and how they overcame these with
support from the institution

20 Student and Staff Perspectives on Diversity and Inclusion
so the student feels confident to vocalise
concerns.
National Authorities/ National Agencies:• Ensure that nation-wide student
services aimed to the local student
population are also applicable to
international students
Higher Education Institutions:• Ensure that services are accessible
to international students and equal
treatment is guaranteed.
International Student Organisations:• Organise social and cultural integration
activities for international students.
10. Ensuring peer to peer engagement
Connect mobile students with local
students, via a buddy or ambassador
scheme to help students navigate the new
institution or organisation, as well as the
local area. This is particularly important in
the early days of the mobility programme
to help students to settle into their new
environment.
Higher Education Institutions:• Support peer to peer initiatives
to encourage interaction between
international and local students.
National Agencies:• Collaborate with student
representatives in order to better
understand the challenges which
students face during their mobility
experiences.
Higher Education Institutions: • Create clear communication channels
and reference persons for students to
voice their concerns at the beginning
of their mobilities.
• Be proactive, proposing feedback
sessions with incoming students to
improve the mobility experience.
International Student organisations:• Reach out directly to incoming
exchange students in order to offer
peer to peer support and gather their
experiences and challenges.
• Communicate with HEIs to agree on
common support measures and ideas
to improve the mobility experience and
offer support.
9. Provide in-country supportfor student services
Assign students a key contact, both at the
home institution and the host institution.
If possible, introduce the students to
their contact in advance of departure.
Any support given to students should be
provided in English or a shared language,

21Executive Summary
accessible to incoming international
students.
12. Develop a crisis plan
It is of vital importance that universities are
ready to support students in an emergency,
and that all students know who to contact
in the first instance should they encounter
a crisis. This extends to providing support
for students who experience discrimination
while they are abroad. Ensure that students
understand their rights while travelling
abroad, and what to do should they
encounter discrimination at the university
or in the local community. Have a process
in place to ensure that students receive the
right support in the immediate aftermath,
and also following any incident. Publish
this information so students are informed
about the procedures that are put in place,
and address a contact person. Review
university partnerships in cases where the
local support fell short of expectations.
Higher Education Institutions:• Ensure crisis plans in the institutions
take into account international
students.
• Signpost who students can contact if
they experience discrimination.
• International Student Organisations
• Create a safe space for students
to address positive and negative
experiences.
International Student Organisations: • Organise buddy and ambassador
systems supported with events to
connect the two groups.
• Organise community engagement
initiatives to support interaction
between international students and
locals.
11. Support studenthealth abroad
Universities have systems and services
in place to support both the physical and
mental health of students on the home
campus. Where possible, provide these
services to students abroad via virtual
methods. In addition, ensure these services
are accessible to incoming students when
they are on exchange on your university
campus.
It is also important that students have
the right information about insurance
options and know what to do in a medical
emergency. These support measures are
particularly crucial for vulnerable groups,
but it is important for all students to know
how their health will be supported abroad.
Higher Education Institutions: • Support students with information
about insurance and health issues
abroad.
• Ensure health services can be made
available to support students off site.
• Ensure on-campus support is

22 Student and Staff Perspectives on Diversity and Inclusion
organisations in the creation of
internationalisation strategies
• Create mechanisms and procedures
to gather feedback from students and
student organisations.
International Student Organisations• Actively contribute to the dialogue and
provide feedback
14. Engage localand regional authorities
The international student experience does
not end the moment students leave the
university campus. International students
spend a large part of their time outside
of the university campus. They interact
with the local community and they make
use of public services. Work together
with local municipalities and other local
authorities to make them attentive to the
role they play to ensure that the broader
cultural environment is hospitable towards
international students.
National Authorities/National Agencies:• Ensure that local and regional
authorities are aware about existing
student mobility frameworks
and encourage them to create.
internationalisation strategies for their
local and regional environments.
13. Work with students
Collaborate with student groups at your
institution, as well as mobility alumni. Ask
students for feedback on programmes
to improve these for future students via
mechanisms such as surveys and focus
groups. Establish buddy schemes and
ambassador programmes with mobile
students who can support others about
to embark on mobility programmes by
providing a student perspective. Invite
students to get involved in events and
enable student takeovers on social media.
In addition, work with student associations
or representatives who can provide support
in communications and in preparing
students to go abroad. It is important
to give students agency to organise
themselves in order to ensure they feel
included in the process.
National Authorities/National Agencies:• Support the establishment or the
further development of students
networks working in the field of student
mobility
• Foster the creation of alumni
ambassador schemes
• Encourage HEIs to support and work
with student organisations
Higher Education Institutions:• Provide structural support to student
organisations and alumni networks
• Include students and student

23Executive Summary
Higher Education Institutions:• Work together with local municipalities
in order to ensure better integration of
international students in the hosting
city.
• Organise reception days to welcome
the international students in the city.
International Student Organisations:• Organise activities together with
local stakeholders to integrate the
international students in the city life.

Settingthe scene

25Setting the scene
Our research process coincided with
the COVID-19 pandemic that took place
in 2020. This survey that targeted past
mobile students, was launched before the
pandemic and its subsequent lockdown
measures took effect across the global,
the majority (75%) of mobilities taking
place in spring 2020 were affected by the
pandemic, with a 75% of students returning
home, continuing their activities through
distance learning (42%), suspended their
mobility (22%) or cancelled (36)3.
• 37.5% of the students experienced
at least one major problem related
to their exchange. The most
common one was related to the
loss of transportation to return
home, followed by problems with
accommodation and problems with
access to basic needs such as food
and sanitary products. Three-quarters
of the students whose mobilities were
cancelled got support from their home
3 Survey on the impact of COVID-19 on learning mobility activi-ties, European Commission, 2020
As the goal of the project remains
to increasing access to mobility
opportunities for students from
underrepresented groups, in order to
boost their employability opportunities
and increase their chances to social
mobility, it is important to note that
crisis tends to hit those who already
face difficulties, such as students with
fewer opportunities backgrounds, harder
than those who do not.
Internationalisation should play a
key role in empowering students for
the upcoming societal challenges. If
we want to ensure students are able
to overcome the barriers that will
be intensified by the ensuing crisis
we can expect due to the COVID-19
outbreak, sufficient research and impact
assessment on the access and effects of
mobility needs to be put in place.
COVID-19Pandemic 2020

26 Student and Staff Perspectives on Diversity and Inclusion
- Diversifying mobility programmes to
ease the way back to mobility through
short-term or group mobilities.
- Ensuring crisis communication,
including information about health
care, is available in accessible
languages to the international student
population.
- Increase attention for student
guidance and support to address
mental health challenges and
discrimination.
- Introducing digital tools to offer
support to students, by for example
having virtual briefing sessions or
office hours to support students.
Student life has taken place in confinement
for the bigger part of 2020, making it
difficult for international students to
interact with their peers and the local
communities, creating a larger disconnect
universities4.
• 7% of the students reported that they
will not get any grant at all for their
studies. 24% reported that they will
keep the grant, partially or fully. The
majority of students do not know what
will happen to their grants.
• Half of the students whose mobility
continued have moved to online
classes. 34% of them have moved to
partial online or partially postponed
classes.
• While the reported experience of
discrimination based on nationality
(6%) or ethnicity (4,3%) , there was
a large in-group variation depending
on nationality, with 21% of Asian
students indicating they were affected
by racism.
• A significant number of students
report feelings of isolation (21%) or
anxiety and stress (41%) because of
COVID-19.
Further impact of the COVID-19 crisis on
students in both spring and fall 2020 is
analysed by the ESNsurvey 2021, which
is not published at the time of writing.
The focus groups took place in the fall of
2020, capturing the concerns and barriers
to participate in mobility of currently
enrolled students – amplifying some of
the recommendations found earlier in the
report:
4 Student Exchanges in Times of Crisis, Wim Gabriels, Rasmus Benke-Åberg, Erasmus Student Network, 2020
Women, children, people with disabilities, the marginalized and the displaced, all pay the highest price in conflicts and are also most at risk of suffering devastating losses from COVID-19.
- António Guterres UN Secretary-General

27Setting the scene
between different groups in society,
causing tension that can lead to further
discrimination of disadvantaged groups and
impact participation of underrepresented
groups.
One of the key elements of the Erasmus+
programme is to increase interaction
between different communities to
increase intercultural awareness and
tolerance to diversity across Europe and
the world, the second pillar of the SIEM
project that focuses on engagement
between international students and local
communities can play an essential role
to maintain positive attitudes towards
international student mobility.

28 Student and Staff Perspectives on Diversity and Inclusion
Key Findings from Literature Review
More people than ever before are enrolling
in universities across the world: the share
of tertiary-educated young adults in OECD
countries increased from 35% in 2008 to
44% in 20185. The European Commission
set a target that 40 % of young people
should have a tertiary education
qualification or equivalent by 2020, and
that adult participation in learning should
reach 15% by 20206.
However, students from disadvantaged
backgrounds and identities are
underrepresented in higher education
across Europe. There is a difference in
which student groups are considered to
be disadvantaged in each nation, and
the participation in higher education by
students of these disadvantaged group
varies across countries. The EHEA Social
Dimension Principles and Guidelines calls
on countries to identify disadvantaged,
underrepresented, and vulnerable groups.
It goes on to note that in order to develop
5 Education at a Glance, OECD, 2019
6 Higher Education Equity Policy: European Commission, World Access HE, 2019
effective policies, continuous national
data collection on the student body,
access and participation, drop-out and
completion of higher education, including
the transition to the labour market after
completion of studies is necessary7. It
is particularly important that this data is
identified for vulnerable, disadvantaged,
and underrepresented groups in order to
track progress made on moving towards
true equity.
Access to higher education is not limited
to enrollment within an institution, and
extends to participation in university
activities, and eventual progression to
further education or employment following
degree completion. There are differences
in the completion and success rates of
students on the basis of socio-economic
status, ethnicity, gender, and disability
status, among other identities. The barriers
students encounter when trying to gain
7 Rome Ministerial Communiqué: Principles and Guidelines to Strengthen the Social Dimension of Higher Education in the EHEA, EHEA, 2020

29Setting the scene
access to higher education are reinforced
once enrolled within institutions, both in
the academic space and in extracurricular
activities:
“Disadvantaged students are less likely
to engage in extracurricular activities
not only because their relative lack of
economic capital means they often have
to work to fund their studies, but also
because they are unaware just how much
the relationships and knowledge such
extracurricular activities develop can be
worth”8.
In addition to barriers to access and
participation in institutions, research
from the European Commission finds that
students from less advantaged groups
withdraw from university at a higher rate
than their more advantaged peers noting
that there is “a lack of attention to the
needs of a more diverse student population
and a lack of a student-centered approach
in designing and delivering higher
education programmes”9.
These wider access issues and lessons
are important to consider in the context of
study, work, and volunteer abroad. Outgoing
mobility is in many ways a microcosm of
the university experience, and many of the
barriers students experience accessing
higher education are replicated when
8 “Who you know: the importance of social capital in widening participation” in Where next for widening participation and fair access? New insights from leading thinkers, Paul Clarke, HEPI Report 98, Higher Education Policy Institute, 2017
9 Drop-out and completion in higher education in Europe, European Commission, 2013
accessing study, work, or volunteer abroad
programmes. Trying to understand the
barriers to mobility across Europe is
further challenged by the fact that the
majority of countries do not collect data
on the participation in outgoing mobility
programmes by disadvantaged student
groups, and are therefore unable to
measure whether groups are participating
at a rate proportionate to the wider
student population.10 Countries that have
undertaken this analysis, for example in the
United Kingdom, find that students from
disadvantaged demographics participate in
mobility programmes at a lower rate than
their more advantaged peers11.
Barriers to mobility programmesThere are many types of barriers to mobility
including practical barriers, environmental
barriers, and attitudinal barriers. Research
from the British Council noted that
obstacles to study abroad included the
financial costs, distance from family and
friends, concerns about foreign language
capacity and concerns about quality of
education abroad12.
Financial concerns are broad and include
a lack of grant of scholarship funding
available and the risk of losing a student
job. The Erasmus+ Impact Study (2019)
noted that around two thirds of non-
10 Mobility Scoreboard: Higher Education Background Report 2018/19, Eurydice, 2020
11 Gone International: Rising Aspirations, Universities UK International, 2019
12 Broadening Horizons: Addressing the needs of a new generation, British Council, 2017

30 Student and Staff Perspectives on Diversity and Inclusion
mobile students reported some type of
financial concern13. Students are concerned
about not only the cost of the programme
but missed costs at home. Eurostudent
research into students in paid work noted
that on average 69% of students who
work do so to cover their living costs
and half of these students indicated not
being able to afford studying without
their job14. EUROSTUDENT research also
found that graduates who financed their
studies themselves reported much less
participation in mobility programmes,
while both parental and grant support
increased the chance of studying abroad15.
It is perhaps unsurprising that students are
concerned about financial barriers to going
abroad when only fourteen higher education
systems in Europe offer unrestricted
portability of domestic support for students
taking part in mobility programmes16.
Research in the Nordic countries reported
that a lack of information and knowledge,
a lack of encouragement, a lack of role
models as well as a lack of overall policy
focus and supportive initiatives all
presented barriers to students accessing
mobility opportunities17. Lack of knowledge
as a barrier to mobility extends to lack of
13 Erasmus+ Impact Study
14 Combining Studies and Paid Jobs, Eurostudent, European Union, 2018
15 EUROGRADUATE Pilot Study, European Union, 2020
16 Mobility Scoreboard: Higher Education Background Report 2018/19, Eurydice, 2020
17 Equity in Student Mobility in Nordic Higher education, Kjetil A. Knarlag, Universell 2017
ambition or appetite for travel, particularly
in the case of students from households
with limited international experience.
A Universities Australia reported that
“awareness of mobility programmes is
perpetuated by generational characteristics.
These characteristics include an inherent
interest in different cultures and societies,
the desire to work in other countries
following graduation and a deeply held wish
to experience different places”18.
Essentially, students without a previous
international experience may not seek out
these types of programmes at university,
yet these are the students who arguably
stand to benefit the most from such an
experience.
It is also important to recognize that the
barriers to mobility differ depending on the
phase of the mobility process: barriers at
the decision-making stage will be different
to the obstacles encountered once students
have decided to go abroad and face the
more practical barriers of international
travel19. Research from Eurostudent noted
that financial and familial obstacles are
highly relevant when making the initial
decision to go abroad. However once
students have decided to go abroad they
are “more concerned about practical
matters: integrating a stay abroad into
18 Universities Australia, Report into student mobility, Rob Law-rence, UniversitiesAustralia, 2016
19 What Are The Obstacles To Student Mobility During The Deci-sion And Planning Phase?, Eurostudent, European Union, 2016

31Setting the scene
Impact of mobility programmesThe world of work is constantly changing,
and in the current climate students
need to learn the advanced skills and
qualifications required to fully participate
in more knowledge-intensive and faster
changing labour markets, including social
and emotional competence23. Through the
Erasmus+ Impact Study students who go
abroad reported developing a broad range
of cognitive, and interpersonal skills to a
significant degree including: intercultural
skills, curiosity, flexibility and adaptability,
confidence, self-awareness, interpersonal
skills, communication, problem solving,
language, tolerance for ambiguity, and
course or major-related knowledge24.
This is particularly the case for students
from disadvantaged demographics.
Research from Ireland found that the
benefits of going abroad for disadvantaged
students include improved career and
employment opportunities, higher
academic attainment, students' personal
development in addition to improving
language skills25.
Research in the UK looked at measures
across a range of academic and
employment outcomes including degree
attainment, starting salary, job level and
unemployment rate six months after
23 Trends Shaping Education 2019, OECD Publishing, 2019
24 Erasmus+ Impact Study
25 Enhancing Mobility of Access Students Ireland, Sinead Lucey, Irish Universities Association, 2018
their study programme, getting relevant
information, securing a place in a mobility
programme, and ensuring their results
achieved abroad will be recognised”20.
It is also the case that institutional
barriers to mobility stop students from
going abroad. Indeed, research from
the European Commission noted that
“Inequalities of student mobility are very
likely to be also generated within countries’
education systems and higher education
institutes… the decision and chance to
study abroad will be determined by the
opportunities available for students within
their field of subject and higher education
institute”.21
Institutions not providing mobility
programmes across all disciplines, or a lack
of flexibility in degree structure or credit
transfer act as barriers to going abroad.
In addition, where there are institutional
requirements for outgoing programmes –
such as a requirement to reach a specific
grade point average - these can present
further barriers for students who are less
likely to do well academically due to the
attainment gap that persists for some
student demographics22.
20 What Are The Obstacles To Student Mobility During The Deci-sion And Planning Phase?, Eurostudent, European Union, 2016
21 Unequal uptake of higher education mobility in the UK: The im-portance of social segregation in universities and subject areas European Commission: JRC Technical Reports, 2018
22 Degree attainment gaps, AdvanceHE, 2020

32 Student and Staff Perspectives on Diversity and Inclusion
participation in mobility, student
groups that are underrepresented in
universities more broadly tend to also be
underrepresented in mobility programmes.
The barriers to mobility programmes are
manifold and differ depending on both the
student group looking to go abroad and
the phase of the mobility journey. They
include institutional barriers such as lack of
information, environmental barriers such as
mobility financing, and attitudinal barriers
such as a lack of role models to open up
ambition. However, the positive impacts
of these programmes are broad, and can
be particularly important for students from
disadvantaged groups in supporting them
to develop the right skillsets to succeed
postgraduation in employment and further
education.
graduation, and found that students who go
abroad during their undergraduate degree
programmes get better degrees and better
jobs. In addition, when looking at students
from less advantaged or underrepresented
groups these positive outcomes hold, and
in some cases are more pronounced for
disadvantaged demographics26.
Research from the European Commission
found that outgoing mobility has a
positive impact on career progression for
participants, and increases the uptake
and completion of postgraduate studies,
especially for students from lower socio-
economic backgrounds27. The institute of
International Education (IIE) also found
that “studying abroad had unintended
benefits in terms of not only developing
skills and shifting attitudes, but also
opening career pathways and opportunities
that had been either previously unknown or
simply unconsidered.”. The period abroad
increased students’ ambition for their future
career plans, in addition to signposting
unanticipated career pathways28.
In summary, the literature review found
that on a systemic level challenges
around definition in which student
groups are disadvantaged create issues
when reviewing access to programmes.
However, where countries are measuring
26 Gone International: Raising Aspirations, Katherine Allinson, Universities UK International, 2019
27 Studying abroad: benefits and unequal uptake* - European Commission: Science for Policy Briefs, 2019
28 Gaining an Employment Edge: The Impact of Study Abroad on 21st Century Skills & Career Prospects in the United States, Institute of International Education (IIE), 2017

33Setting the scene
education participation, and on outgoing
mobility participation. National differences
in definition of ‘disadvantage’, and data
on these groups, posed a challenge in this
project. At a European level, we lack shared
definitions of fewer opportunities, and when
seeking views from these populations we
also lack shared terminology to categorise
demographic data. This further supports
the call for countries to identify students
with fewer opportunities, underrepresented,
and vulnerable groups as outlined in the
The European Convention on Human Rights
(ECHR) prohibits discrimination on any
ground such as sex, race, colour, language,
religion, political or other opinion, national
or social origin, association with a national
minority, property, birth, or other status29.
Countries sit on a broad spectrum of
data collection, both in terms of higher
29 European Court of Human Rights website, accessed 16 November 2020
Defining ‘feweropportunities’
A note on terminologyThe goal of this project is to ensure that all students, regardless of background, are
able to access mobility opportunities abroad. Collective terminology is often needed to
describe different student groups. However, there are some challenges in this space,
for example, some communities rejecting the label ‘disadvantaged’. There is also a
linguistic divide as countries do not have a shared language: certain terminology can
be viewed as offensive in some countries and not in others. In addition, language
is constantly updating and the terms in use today may change in the future. It is
important that this is considered when developing policies in this space.
In this report, we follow the newly released Erasmus+ Programme Guide for
2021-2027 and will use the term ‘students with fewer opportunities’ to describe
all students that face structural, institutional and social barriers to participation
in education.

34 Student and Staff Perspectives on Diversity and Inclusion
people with poor school performance.
• economic barriers: people with a
low standard of living, low income,
dependence on social welfare system
or homeless; young people in long-
term unemployment or poverty; people
in debt or with financial problems.
• cultural differences: immigrants
or refugees or descendants from
immigrant or refugee families;
people belonging to a national or
ethnic minority; people with linguistic
adaptation and cultural inclusion
difficulties.
• barriers linked to discrimination:
people facing discrimination because
of gender, age, ethnicity, religion,
sexual orientation, disability, etc.
• social barriers: people with limited
social skills or anti-social or risky
behaviours; people in a precarious
situation; (ex-) offenders, (ex-) drug or
alcohol abusers; young and/or single
parents; orphans.
• geographical barriers: people from
remote or rural areas; people living
in small islands or in peripheral
regions; people from urban problem
zones; people from less serviced
areas (limited public transport, poor
facilities).
• health problems: people with chronic
health problems, severe illnesses, or
psychiatric conditions32.
32 Erasmus+ Programme Guide, European Commission, 2019
EHEA Social Dimension Principles and
Guidelines.
Therefore, a key challenge when working in
the space of access to outgoing mobility
is the lack of an agreed upon definition on
what is considered to be a disadvantaged
background for mobile students. Research
looking into access to the Erasmus+
programme found that for partner countries
the lack of a programme-wide definition
of disadvantage causes a fragmented
approach to access which in fact promotes
inequity30.
The European Commission has
defined the following equity target
groups: students from parents with low
educational attainment, students from
disadvantaged groups, students with a
migrant background, refugee students,
along with a focus on gender31. The
Erasmus+ Programme Guide lists eight
indicative barriers that can lead to fewer
opportunities:
• disabilities (i.e. participants with
special needs): people with mental
(intellectual, cognitive, learning),
physical, sensory, or other disabilities.
• barriers linked to education and
training systems: young people with
learning difficulties; early school-
leavers; low qualified adults; young
30 Erasmus+ International Credit Mobility - a study of the mobility of disadvantaged students from Partner countries, Luisa Bunescu, Howard Davies, Michael Gaebel, SPHERE, 2020
31 National Higher Education Equity Policy – European Commission, WAHED, 2019

35Setting the scene
to 10.% for those whose parents or
guardians were graduates34.
Target Groups
This report builds on the work of the
Widening Participation in Outward Mobility
project and will therefore focus on the
following four target groups:
• students from low-income households.
• students from rural backgrounds.
• ethnic minority students; and
• students who are first generation to
enter higher education;
Low-income studentsEntry into higher education can incur costs
for prospective students, both in tuition
fees and living expenses, which can act as
an important obstacle to entry if there is
insufficient financial support available to
students35. Across Europe, countries have
different approaches to setting tuition fees
and providing financial support to students
to access programmes, including grants,
scholarships, and loans, both at national
level and institutional level.
The definition of low-income will vary
across countries, and even within countries,
depending on the living costs associated
with a particular region. The European
Commission categorises Erasmus+
34 Gone International: Rising Aspirations, Universities UK Interna-tional, 2019
35 How does socio-economic status influence entry into tertiary education? OECD, 2019
Between 2016 and 2018 Universities UK
International (UUKi) ran the Widening
Participation in Outward Mobility project,
which analysed the participation in mobility
programmes by disadvantaged students.
It also researched barriers for students
accessing programmes, and collated best
practice across the UK in supporting
students with fewer opportunities to go
abroad33. The SIEM project aims to adapt
and upscale the research by UUKi, by
expanding the focus to a cross-European
level. Research from UUKi found that
students from demographics considered
to be disadvantaged or underrepresented
in UK higher education were
underrepresented in mobility programmes.
Of the 2016-17 graduating cohort:
• 9.5% of students from more
advantaged socio-economic
backgrounds were mobile, compared to
5.6% of students from less advantaged
backgrounds.
• The mobility rate for white students
was 8.3%, which was higher than that
of Asian students (5.5%) and black
students (5.1%).
• 4.4% of students from low-
participation neighbourhoods
went abroad, compared to 8.3% of
graduates from higher participation
neighbourhoods.
• First-in-family students participated in
mobility at a rate of 5.4% compared
33 Widening Participation in Outward Mobility, Universities UK International, 2018

36 Student and Staff Perspectives on Diversity and Inclusion
complex identity:
“Rurality in the 21st century is a diverse
picture: rural regions that are closer to
cities or have good access to transport
can facilitate mobility of people, goods and
services and create strong "economies of
proximity”38.
When looking at data for rural student
access and engagement in university
activities, it would benefit universities
to consider the wider context of their
regions to account for these economies of
proximity.
Ethnic Minority students
European Commission research on
Data collection in the field of ethnicity
and dispersed communities, IntoUniversity supported by Cabinet Office Social Action Fund, 2015
38 Trends Shaping Education 2019, OECD Publishing, Paris – OECD, 2019
programmes countries on the basis of living
costs36. The variation in income equality
at a European level makes it difficult to
compare countries across Europe, and
therefore the definition of ‘low income’ is
localised.
Rural students
Rising inequality within countries creates
challenges in terms of life opportunities
and access to services for those living in
rural areas. Since most universities are
located in or near cities geographical
distance can a barrier for rural populations.
In addition, those living in rural areas who
face challenges when accessing higher
education can also miss out on many of
the support mechanisms in place to help
overcome those barriers which may only be
available in cities37. However, rurality is a
36 Accessed December 2020
37 Rural aspiration: access to Higher Education in rural, coastal
Project definition: for the student survey, the project asked participants to self-identify if they were from a rural area, a town or suburban area, or an urban area. The rural students were those that selected they were from a rural area. For the staff survey, definitions for rural students were defined by institutions.
Project definition: the student survey asked participants the income level of their family household. The low-income student group were students who identified as being from a below average or slightly below average income household. For the staff survey, definitions for low low-income students were defined by institutions.

37Setting the scene
recognised that racial and ethnic data
collection is a complex issue, particularly
because of the great variety of stakeholders
whose consensus it presupposes:
minority communities, statisticians, data
protection agencies, equality bodies and
policymakers39. The research broadly
defined ethnicity as “being based on
a shared understanding of history and
territorial origins (regional and national) of
an ethnic group or community, as well as
on particular cultural characteristics such
as language and/or religion”, noting that
“ethnicity is multidimensional and is more
a process than a static concept, and so
ethnic classification should be treated with
movable boundaries”40.
Students face discrimination on the basis
of skin colour, ethnic origin, and immigrant
background41. Ethnically diverse students
encounter barriers in access, retention,
success, and progression through the
higher education system. There is
increased recognition that direct and
indirect racism is a significant cause of
problems facing ethnic minority students.
Research from the Netherlands found
several reasons for this:
“less contact with other students and
lecturers, so less socially and academically
integrated; greater work and family
commitments; negative cultural atmosphere
39 Data collection in the field of ethnicity, Lilla Farkas, European Commission Directorate-General for Justice and Consumers, 2017
40 Ibid
41 Second European Union Minorities and Discrimination Survey - European Union Agency for Fundamental Rights, 2017
Project definition: the student survey asked participants to confirm their ethnicity or cultural background. The survey offered a range of regional based categories, - for example North Africa, South Asia – in addition to some named groups – for example First Nations – for participants to select. Students were able to select all backgrounds that applied to them. In addition, there was an ‘other’ option for participants with an open text box in which the participant could define their ethnicity. In excess of 150 cultural backgrounds were reported by participants, a clear example of the complexity of definition in this space. Any participant who did not report their ethnicity to be fully White/Caucasian/Europid was classified as belonging to the broad ethnic minority group. For the staff survey, definitions for ethnic minority students were defined by institutions.
and a sense that they do not belong, and
financial problems because ethnic minority
students are often associated with being
from low socio-economic backgrounds”42.
42 Drop-out and completion in Higher Education in Europe among students from under-represented groups, J. Quinn, NESET, European Commission, 2013

38 Student and Staff Perspectives on Diversity and Inclusion
students also tend to have less access
to information, support and guidance to
navigate admission and wider university
processes45.
Research from EUROSTUDENT found that
first generation students tend to enter
higher education later, study in short or
first programmes at non-universities, and
rely on paid employment to a greater
extent than students with higher education
background46.
Intersectionality
It is important when working on access
to also consider groups through an
intersectional lens, accepting the
interconnected nature of different identities
- such as race, class, and gender – which
may be subject to overlapping and
interdependent systems of discrimination
or disadvantage.
45 Rules Of The Game: Disadvantaged students and the university admissions process, Gill Wyness, The Sutton Trust, 2017
46 Social and Economic Conditions of Student Life in Europe, EUROSTUDENT, European Union, 2018
The project team recognises the challenges
when treating ethnically diverse students
as a single homogenous group. The goal
of this research is to understand the
experience of mobility, and the barriers
and support required for students who are
ethnically and culturally diverse, and who
experience structural and individual racism
in our society. The project has adopted
the term “ethnic minority” to describe
this group, as this term is understood by
a broad range of stakeholders across the
world. Institutions would benefit from
looking to their national or regional context
to take a more targeted approach to better
support access and participation for their
students who experience racism.
First generation students
Individuals whose parents or guardians
have not attended university tend to be
considerably underrepresented among
entrants to tertiary education: across
the OECD countries, a child’s chances
of participating in tertiary education
are twice as high if at least one of their
parents has completed upper-secondary
or post-secondary non-tertiary education43.
Young people in the UK who are the 'first
in family' to go to university are less likely
to attend prestigious universities and are
more likely to withdraw from programmes
than those with graduate parents44. These
43 Charting Equity in Higher Education: Drawing the Global Access Map, Pearson, 2016
44 Moving on up: ‘first in family’ univ ersity graduates in En-gland, Morag Henderson, UCL Centre for Longitudinal Studies, 2020
Project definition: for the student survey, we asked participants if their parents or guardians had attended a university or obtained higher education qualifications. For the staff survey, definitions for first generation students were defined by institutions.

39Setting the scene
Project definition: This project
took an intersectional view by
analysing the responses for
students that reported belonging
to multiple target groups: ethnic
minority and low-income, ethnic
minority and rural, ethnic minority
and first in family, low-income
and rural, low-income and first in
family, rural and first in family.
It is the case that for some students
a series of overlapping dimensions of
privilege interacting with and reinforcing
each other act as a barrier to mobility for
students from less advantaged groups. This
was noted in research undertaken at the
University of Sussex:
In sum, the socially and economically more
powerful groups – the business-owners,
professional and managerial classes, those
with inherited wealth – see international
mobility as a way of strategizing to
enhance the educational capital of their
offspring beyond the national to the
global… (which)… clearly works against any
socially inclusive HE agenda of widening
participation in international mobility for
students47.
47 Motivations of UK Students to Study Abroad: A Survey of School-Leavers, Jill Ahrens, Russell King, Ronald Skeldon, Máiréad Dunne, Sussex Centre for Migration Research, 2010
A note on students livingwith a disability.
The UN Convention on Human Rights states
that people with disabilities must be able
to access general tertiary education without
discrimination and on an equal basis with
others. The UN Convention on the Rights
of Persons with Disabilities (UNCRPD)
recognises that “disability results
from the interaction between persons
with impairments and attitudinal and
environmental barriers that hinders their
full and effective participation in society on
an equal basis with others.”
The EPFIME project is another two-
year project co-funded by the Erasmus+
programme. This project will examine
in-depth the needs and expectations
on inclusive mobility for students living
with a disability. It will focus on how
national authorities and higher education
institutions can collaborate more strongly
to ensure the quality and the transferability
of support services for both incoming
and outgoing students with disabilities in
exchange programmes48.
Some of the partners in the SIEM project
are involved in the EPFIME project. For
more information, please visit the project
website.
48 Establishing a thought-out Policy Framework on Inclusive
Mobility across Europe, 2019-2021

Methodology

41Methodology
The research for this project has included:
• A literature review.
• A staff survey which received 786
responses.
• A student survey which received
12820 responses.
• 6 focus groups were held with 36
participants in 4 countries.
• Study visits with six institutions
located in Belgium, the Czech
Republic, France, Latvia, and Spain.
This project data sourced through surveys
and focus groups relied on participants’
self-identification. Self-identification
has several methodological limitations49.
Identities and group affiliations are
complex: in the student survey the project
group followed where possible good
practice recommendations to allow for
multiple answers when responding to
requests for information on identity and
background.
Survey MethodologyA student and a staff survey were hosted
via JISC Online Surveys. The surveys were
open between February and June 2020.
Invitations were sent from ESN via direct
email messages and shared on its social
media channels to more than 438.000
students. Partners in the project consortia
circulated the survey via their networks and
49 Collecting ethnic statistics in Europe, Patrick Simon, Septem-
ber 2011.
invited partners and student organisations
to circulate the survey to their networks.
Reminder messages were issued across the
period the survey was open. Participation
in the survey was voluntary, however the
project provided incentives by entering
student participants into a prize draw.
The survey questions were developed
by UUKi staff with contributions from
the partner consortium. Expertise on the
student perspective was provided by ESN.
The survey was shared in English only,
with efforts made to ensure this was Plain
English.
The survey aimed to follow the following
principles50:
• Using simple not complex questions
• Making questions specific, and where
needed including a reference period
• Using a number scale rather than
vague quantifiers
• Using rating rather than ranking
• Avoiding satisfaction statements
where possible
• Avoiding agree/disagree questions
where possible
• Avoiding hypothetical questions where
possible
• Where possible removing a middle
50 Dillman, D.A. Smyth, J.D and Christian L. M (2014) The Tailored Design Method; Wiley Fowler, F and Mangione T (1990) Standardized Survey Interviewing: Minimizing Interviewer-Related Error; Fowler (1995), Improving Survey Questions: Design and Evaluation; Krosnick (2000) The threat of satisficing in Surveys: The shortcuts respondents take in Answering Questions; Krosnick and Presser, (2010) Handbook of Survey Research Elsevier

42 Student and Staff Perspectives on Diversity and Inclusion
option to avoid “satisficing” where
respondents will choose the middle
category when not holding a true
middle position
The surveys were tested by both staff
and students before publication. The
tests focussed on both the content of the
survey and the mechanism used to collect
responses. Each survey took approximately
20 minutes to complete. The responses
were confidential with reasonable efforts
made to protect respondents’ anonymity
and confidentiality.
Data presentation• The data from the surveys is
presented as percentages rather
than numerical data to draw
more meaningful comparisons in
proportional changes and trends.
• All counts of respondents where
present have been rounded to
the nearest five to protect the
confidentiality of individuals. As
totals have also been rounded based
on unrounded values, some may be
greater or less than the individual
count numbers presented in the
report.
Focus Group MethodologyStudent focus groups were held to help
the project gain an understanding of the
perceived benefits of mobility amongst
target groups, to identify existing barriers
to participation and to generate ideas
around increasing participation of mobility
activities.
6 focus groups with a total of 36 students
were held in October and November
2020. Focus groups were delivered at the
following institutions: Vrije Universiteit
Brussel (BE), Masaryk University (CZ),
University of Vigo (ES), University of Latvia
(LV)
Focus groups were delivered to groups of
either mobile or non-mobile students.
The groups who were mobile engaged in a
range of types and durations of mobility.
Focus groups were hosted both virtually
and in-person depending on localised rules
relating to Covid-19 lockdown and social
distancing measures. The sessions were
interactive and designed to encourage
students to engage with the topic.
Methodologies used included:
• Group discussions
• Private reflections
• Ranking exercises
• Polling exercises
Data was collected via digital recording,
scribed harvesting of discussions (flipchart
notes and post-its) and through note taking.
Focus groups were delivered in the local
language, and a transcript was drafted in
English to allow collective analysis of all
sessions.

43Methodology
Example questions groups were asked
included:
• What attracts you to going abroad?
• Where would you like to go abroad?
• What type of mobility experience
would you like to participate in?
• What duration do you think an
outgoing mobility programme should
be?
• Do you think going abroad will help
your academic achievement?
• Do you think going abroad will help
your employment prospects?
• Do you think going abroad will help
your personal development?
• In what other way do you think going
abroad will impact you?
• What are some of the challenges to
participating in a mobility experience?
• What support needs to be put in place
to enable you to go abroad?
Students who had been abroad were more
able to engage with certain questions, as
they had concrete experiences on which to
base perspectives. However, when these
students related motivations and decision
making, some post-mobility rationalisation
was likely to have been involved.
Limitations to the ResearchThe reader should be aware of the following
limitations when drawing conclusions from
the data and information included in this
report:
• While the individuals are from a
specified population (the student
population) the survey relied on a
convenience sample rather than a
census. This sample was also self-
selecting.
• The sampling may reflect the primary
membership base of the Erasmus
Student Network and may therefore
not be reflective of the diversity of
student populations worldwide.
• The information captured from this
survey relies solely on self-reported
information and assumes the
participants are providing accurate
information about their experiences.
• The questions included in the survey
were primarily drafted in a European
context.
• Participants may have come to the
survey with different interpretations
of the questions, although every effort
was made to provide instruction,
direction, and classification for each
question.
• The survey used closed questions
rather than open questions due to
the volume of expected responses. It
is likely that there are other factors
which could influence a student’s
decision to go abroad, or a student’s
experience while they are abroad, that
are not captured in this report.

44 Student and Staff Perspectives on Diversity and Inclusion
• Responses to the survey that
relate to institutional support and
provision are based on participants’
experience.
• The report does not seek to
establish causation but instead is
aiming to highlight correlations
between specific target groups and
their responses.
• The survey was only available
in English and may therefore
exclude students who did not feel
comfortable filling it in in another
language than their own.

45Methodology

Student Perspective

47Student Perspective
Student Survey:Main Findings
Top 10 Countries All %
1 Spain 2340 18%
2 Italy 1275 10%
3 Portugal 1215 10%
4 Germany 845 7%
5 Greece 730 6%
6 Latvia 405 3%
7 UK 395 3%
8 Czech Republic 390 3%
9 Indonesia 385 3%
10 France 380 3%
Q. In which country did you study for your bachelors degree?
The goal of the student survey was to
map participation in mobility programmes
by different students, and to understand
barriers and enablers of mobility. The
survey received a total of 12,820 responses.
The survey findings are split into the
following six areas:
• Mobility Experience
• Motivation for mobility
• Mobility Support
• Mobility Funding
• Barriers to mobility
• Impacts of mobility
Who were the student survey participants?Respondents studied their bachelor’s
degree across 134 different countries.
The most represented nation was Spain,
with 18% of respondents studying their
bachelor’s degree in Spain, followed by Italy
(10%), and Portugal (10%). The countries
that provided the largest numbers of
responses – Spain, Italy, Portugal, Germany,
and Greece – together accounted for 51%
of the total responses, but more than 50
responses were received per country from
an additional 32 countries.
The student survey received responses
from 93% of the EU 28 countries51 (26
out of 28), from 91% of the Erasmus+
programme countries (30 out of 33) and
90% of countries in the European Higher
Education Area (43 out of 48).
51 At the time of survey circulation, the United Kingdom was a member of the European Union

48 Student and Staff Perspectives on Diversity and Inclusion
Figure 1: highest degree obtained Q. What is the higest level of degree education you have studied? (total respondents, n = 12.820)
4%
7%
10%
18%
19%
20%
22%
OtherSubject
MedicalSciences
NaturalSciences
Engineering
Economics& Business
Humanities
SocialSciences
Figure 2: Study subject Q. In which academic subject was/is your bachelor’s degree? (total respondents, n = 12.820)
Bachelor
Master
Post graduate
PhD
27%
70%
1%
2%
Figure 1: highest degree obtained Q. What is the higest level of degree education you have studied? (total respondents, n = 12.820)
70% of respondents had a bachelor’s degree. Just over quarter of students (27%) had
studied for a master’s degree. This pattern held across the project groups.
Respondents studied across
a range of subject areas, with
Social Sciences the most
highly represented (22%). A
fifth of respondents (20%)
studied Humanities subjects,
19% studied Economics
and Business Sciences, and
18.3% studied Engineering
subjects.

49Student Perspective
Demographics of survey respondents
The survey received responses from respondents across a range of different demographics
and backgrounds. 42% of respondents were the first in their family to attend university.
Almost a third (30%%) of respondents identified as being from an ethnic minority group,
with in excess of 150 different ethnic or cultural backgrounds reported by participants in
the project. In total, 149 nationalities were represented. A fifth of respondents (21%) were
from low-income households and 19% were from rural backgrounds.
First GenerationStudents
Ethnic MinorityStudents
LowIncomeStudents
Rural Students
42%
30%
21% 19%
5440 3835 2715 2370
Respondents with disadvantaged backgrounds
Response All
Yes, between the ages of 5 and 10 years old
3%
Yes, between the ages of 11 and 16 years old 35%
Yes, between the ages of 17 and 18 years old 28%
No 51%
Total 12820Q. Prior to starting your bachelor’s degree, did you travel abroad
as part of an educational programme?
The survey asked respondents if they had
travelled abroad through an educational
programme prior to starting their
bachelor’s degree programme. Half of
respondents (51%) had not travelled
abroad via an education programme prior
to starting their degree. A third (35%) of
respondents travelled during the ages
of 11 and 16 years old, with just over a
quarter (28%) travelling during the ages
of 17 and 18 years old.

50 Student and Staff Perspectives on Diversity and Inclusion
Figure 9: Participation in Pre-departure activitiesQ. Did you participate in any of the below pre-departure activities? (mobile students, n = 8.342)
65%mobile students
35%non-mobile
students
Target groupsFor respondents from the report’s target groups there was a higher percentage who had not
been abroad as part of an education programme prior to starting their university degree:
Two thirds (66%) of respondents from ethnic minority backgrounds had not participated in a
programme compared to 42% of white respondents. 60% of low-income respondents had not
taken part compared to 41% of higher income respondents.
In total, 8350 of the respondents (65%)
participated in a mobility programme while
studying for their bachelor’s degree. 4470
respondents (35%) did not go abroad during
their bachelor’s degree, around a third of
survey respondents.
Target groupsA higher percentage of respondents from some of the target groups reported not having
been abroad during their university degree: 59% of respondents from ethnic minority
backgrounds had been abroad compared to 69% of white respondents. 60% of low-income
participations had been mobile compared to 70% of higher income respondents.
Mobility experienceThe student survey asked respondents
about the mobility programmes they had
participated in during their bachelor’s
degree programme or would like to
participate in.
The majority of mobile respondents (81%) to
the survey had been abroad in the past three
academic years. Respondents to the survey
had been on mobility programmes to a total
of 98 different countries. The most reported
destination for mobility was Spain (16%),
followed by Germany (7%) and Italy (7%).

51Student Perspective
Country All %
1 Spain 1305 16%
2 Italy 600 7%
3 Germany 515 7%
4 France 480 6%
5 Poland 405 6%
6 UK 380 5%
7 Portugal 310 5%
8 Belgium 390 4%
9 USA 265 3%
10 Czech Republic 260 3%
Total 8350
72%
3% 5% 3%
13%
1% 1% 1% 1%
63%
13%
53%48%
26% 26% 28%
19%
41%
Eras
mus
st
udie
s
Oth
er m
obili
ty
prog
ram
me
Eras
mus
tr
aine
eshi
p
Shor
tm
obili
ty
Oth
er
stud
y ex
chan
ge
Inte
rnat
iona
l fu
ll de
gree
Eras
mus
full
deg
ree
Oth
er
trai
nees
hip
Volu
ntee
ring
pr
ogra
mm
e
mobility programme ofmobile participants
Non-mobile interest in mobility programmes
Figure 5: mobility programmesQ. What type of mobility programme did you participate in? (n = 8.350) Q. If you were to go abroad during a degree programme, what type of mobility experience would interest you? (n = 4.470)
For most respondents (87%), the mobility
period was not a mandatory part of their degree
programme. For two-thirds of respondents
(67%) the mobility programme was credit-
bearing and therefore counted towards their
degree classification.
Target GroupsFor mobile respondents in the project’s
target groups, the top five countries
across all groups reflected the total
cohort pattern (Spain, Italy, Germany,
France, and Poland) including rates of
participation.
Mobility Programme

52 Student and Staff Perspectives on Diversity and Inclusion
Most respondents (72%) participated in Erasmus studies, 13% took part in other study
exchanges. 5% of respondents took part in an Erasmus traineeship or internship, and 3%
took part in short mobility programme.
The survey asked respondents who had not been abroad during their bachelor’s degree
about the types of programmes they would be interested in participating in. There was broad
interest across all different types of mobility programmes from the survey respondents. The
most popular options reported were Erasmus+ Studies (63%), Erasmus+ traineeships or
internships (53%), and short-term mobility programmes (48%).
8%
3%
15%
7%
43%
58%
33%
32%
Non-mobile
Mobile
Less than 4 weeks
More than 4 weeks, less than one semester
One semester More than one semester
Figure 6: Mobility duration Q. What was the duration of your mobility (mobile students, n = 8.350)? Q. If you were to go abroad, what duration would you like the mobility programme to be? (non-mobile students, n = 4470)
DurationFor the respondents with a mobility
experience, over half of respondents
(58%) participated in a programme that
was one semester in duration. Almost a
third of respondents (32%) went abroad
more than a semester, and 10% of
respondents went abroad for durations of less
than a semester.
Target groupsMobile: A higher percentage of respondents
who were from ethnic minority backgrounds
participated in short-term mobility programmes
(16%, compared with 8% of white respondents).
For respondents from low-income backgrounds,
13% participated in short-term mobility
programmes compared with 9% for higher
income respondents. For rural respondents

53Student Perspective
Figure 7: Motivation to study Abroad by mobile students
19%
30%
49%
49%
51%
66%
67%
68%
82%
19%
25%
30%
31%
33%
27%
25%
22%
16%
26%
25%
16%
16%
13%
6%
7%
7%
2%
36%
20%
5%
4%
2%
1%
1%
3%
Other students planning to go abroad
Improving degree grade
Developing new contacts
Improving employment prospects
Having fun
Learning about a new country or culture
Developing interpersonal skills
Improving language skills
Having a new experience
Very important Important
Somewhat important
Not important
Q. How important were the below motivations when making the decision to go abroad? (n = 8.350)
and first-generation respondents, the pattern
mirrored the total cohort pattern.
For non-mobile respondents, the durations
that were attractive to respondents mapped
the mobile cohort participation. The most
popular option was one semester mobility
(43%), with a third of respondents (33%)
interested in going abroad for more than a
semester. However, there was a higher level of
interest in short-term programmes, with 23%
of respondents interested in mobilities of
less than a semester in duration.
Target groups
Non-mobile: The findings mirrored the
mobile student pattern, although for
both rural respondents and low-income
respondents a slightly higher percentage
were interested in short-term programmes
(rural 24% vs 21% urban, low income 24% vs 20% high income).

54 Student and Staff Perspectives on Diversity and Inclusion
Figure 8: Encouragement for non-mobile students
41%
42%
43%
46%
47%
47%
53%
44%
39%
42%
39%
38%
37%
38%
13%
16%
12%
12%
12%
14%
8%
3%
3%
3%
3%
3%
3%
1%
More information on the impact of outward mobility on academic achievement
Hearing from alumni who used mobility experience to obtain employment
More information on the impact of outward mobility on employment
More information on the host countries
Hearing from employerswho value international experience
Hearing from studentswho have been abroad
More information on thetypes of programmes available
Very useful Useful
Somewhatuseful
Not at all useful
Figure 8: Encouragement for non-mobile students Q. Would the below scenarios have encouraged you to go abroad during your degree programme? Please rate the below based on how useful they are. (n = 4.470)
Motivations to go abroadThe survey asked mobile respondents
about what motivated them to go abroad.
Having a new experience was the main
motivation for those who went abroad
during their degree programme, with 98%
of respondents reporting that this was
important. In addition, the majority of
respondents were motivated by improving
their language skills (90%), developing
their interpersonal skills (92%), and
learning about a new country or culture
(93%).
Target GroupsAcross all the project’s target groups,
the respondents selected very important
at a higher rate than the total cohort.
For respondents from ethnic minority
backgrounds 73% reported that learning
about a new country or culture was
a very important motivator for going
abroad (compared to 63% for white
respondents). They also reported that
developing interpersonal skills was very
important (72% compared to 65% for
white respondents). Additionally, other
students planning to go abroad was felt
very important by a quarter of ethnic
minority respondents (26% compared to
15% of white respondents).

55Student Perspective
Target groupsThe projects target groups generally
followed the same pattern as the total
cohort. However, for respondents who
were first generation students, who were
from low-income backgrounds, and ethnic
minority respondents, more information on
the host countries was the second most
popular measure reported.
Barrier Very useful Useful Somewhat
usefulNot at all
useful
Information about funding available 65% 29% 5% 1%
Support with the application process 53% 35% 10% 2%
Parental support for going abroad 53% 31% 13% 3%
Help in choosing a host university 51% 36% 11% 3%
Help finding an internship or work placement 43% 34% 16% 6%
Encouragement from academic programme 42% 41% 15% 3%
Encouragement from international office 39% 40% 17% 4%
Meeting other students considering mobility 37% 37% 22% 5%
Encouragement from mobility programme alumni
32% 37% 24% 7%
Q. What support or information is useful when preparing for a mobility programme?
Non-mobile respondentsOver half of respondents (53%) felt
that more information on the types of
programmes available would be very
useful in encouraging mobility during
degree programmes. In addition, 47% felt
that hearing from employers who value
international experiences or from students
who had been abroad would be very useful.
Across the board, respondents felt the
proposed activities would have encouraged
them to be mobile, with only 3% of
respondents feeling the activities would not
be useful.
Mobility Support
The survey asked questions about support measures for students, both pre-mobility and
while abroad.

56 Student and Staff Perspectives on Diversity and Inclusion
Target groupsAcross all the project’s target groups, the
respondents followed the same pattern as
the total cohort but reported finding the
support activities provided useful or very
useful at a higher rate.
Barrier Very useful Useful Somewhat
usefulNot at all
useful
Information about funding available 73% 24% 3% 1%
Help in choosing a host university 63% 31% 5% 1%
Help finding an internship or work placement 62% 30% 7% 1%
Support with the application process 58% 35% 6% 1%
Meeting other students considering mobility 40% 39% 19% 2%
Encouragement from academic programme 49% 39% 11% 1%
Encouragement from international office 45% 40% 13% 2%
Encouragement from mobility programme alumni 39% 39% 19% 3%
Parental support for going abroad 49% 32% 15% 5%
Total 4470
Q. What support or information would be useful to prepare for a mobility programme?
Pre-programme supportMobile respondentsThe majority of mobile respondents
(94%) agreed that information about
available funding was very useful (65%)
or useful (29%) when preparing for a
mobility programme. In addition, support
with the application process (88%) and
help choosing a host university (86%)
was considered useful and very useful by
respondents. Parental support for going
abroad was also reported as supportive
by 84% of respondents. It is worth noting
that all of the support measures were
considered useful or very useful by at least
70% of respondents to the survey.

57Student Perspective
Target groupsWhen looking at the projects target
groups, there was in general a slightly
higher percentage of respondents who
would find the activities helpful. This was
most notable for respondents from low-
income households, where 81% would
find information on available funding very
useful, and 68% would find help sourcing
an internship very useful.
Very useful Useful
Somewhatuseful
Not at all useful
Did not participate
Figure 9: Participation in pre-departure activitiesQ. Did you participate in any of the below pre-departure activities? (mobile students, n = 8.342)
3%
17%
19%
21%
22%
24%
27%
6%
17%
19%
16%
31%
29%
28%
5%
7%
8%
6%
14%
12%
12%
6%
3%
3%
3%
3%
3%
3%
79%
56%
52%
55%
30%
33%
30%
Skype session withinternational officer
Event withmobility alumni
Social event
Event organisedby student organisation
Briefing event
Groupinformation session
Meeting with international officer
Non-mobile respondents
73% of non-mobile respondents reported
that information about funding available for
mobility programmes would be very useful.
In addition, 62% of respondents felt that
support finding a host university or work
placement would be very useful. There was
a general positive response to all listed
support and information options, with the
majority of respondents (80% or over)
reporting finding these options useful.
Pre-programme activities Mobile respondents

58 Student and Staff Perspectives on Diversity and Inclusion
Target groupsThe respondents from the student
demographics graphics in the reports
target groups followed the total cohort
pattern, although with a slightly higher rate
finding the activities very useful.
Highly likely Likely Neutral Unlikely
Highly unlikely
Figure 10: Interest in pre-departure eventsQ. If you were to go abroad, and the following activities were available to you prior to departure, how likely is it that you would participate in them? (non-mobile students, n = 4.470)
26%
38%
46%
45%
45%
43%
44%
32%
38%
37%
36%
36%
41%
38%
27%
18%
12%
14%
15%
13%
14%
12%
5%
3%
4%
2%
3%
3%
4%
2%
2%
2%
2%
1%
2%
Skype session with international officer
Event withmobility alumni
Social event
Event organisedby student organisation
Briefing event
Groupinformation session
Meeting with international officer
Respondents reported participating in
several different support measures and
activities. Just over half of respondents
found meeting with international officers
(55%), group information sessions (53%),
and briefing events (53%) either useful or
very useful. It is notable that the majority
of respondents (79%) reported not having
a virtual briefing session available to them.
There were a number of other activities
that were available to respondents,
including social events, alumni events,
and student organised events. For those
that participated in these activities, most
reported that they were either useful or
very useful.

59Student Perspective
Of the non-mobile student cohort, the
majority of respondents reported being
highly likely or likely to attend a social event
if it was offered as a pre-mobility activity
(83%). The majority also reported being
likely to attend a group information session
(83%), a briefing event (81%) a meeting
with an international officer (81%), or a
student event (81%).
Target groupsLooking at the project’s target groups,
44% of respondents from ethnic minority
groups reported that they would be highly
likely to participate in an event with
mobility alumni compared to 34% for
white respondents. In addition, over 50%
of respondents reported that they would
be highly likely to attend a social event,
a meeting with an international officer
or a student organisation event. 49% of
respondents from low-income backgrounds
reported being highly likely to meeting with
an international officer (compared to 42%
for higher income respondents), and for this
group the action tied for top place along
with the briefing event.
E

60 Student and Staff Perspectives on Diversity and Inclusion
By contrast to the pre-activities which are
more information focused, once abroad,
over half of the participants (54%) found
the welcome meeting very useful, in
addition to student organised events
(51%) and social events (51%). Again, the
majority of respondents (79%) did not have
a virtual session available. One quarter of
respondents (26%) did not have access
to a buddy scheme, but the majority of
respondents who participated in these
found them useful (28.1%) or very useful
(50.8%).
4%
38%
39%
51%
51%
54%
6%
21%
29%
24%
27%
28%
5%
11%
11%
7%
8%
8%
6%
5%
3%
2%
1%
2%
79%
26%
18%
16%
13%
9%
Skype session withInternational Officer
at home university
Connected with local studentsby the host university
Meeting with InternationalOfficer at host university
Event organised by student organisation
Social event at hostuniversity or workplace
Welcome meeting at hostuniversity or workplace
Very useful Useful
Somewhatuseful
Not at all useful
Did not participate
Figure 11: Support offer while abroad Q. Did you participate in any of the below activities while you were abroad? (mobile students, n = 8.342)
Target groupsThe respondents from the student
demographics graphics in the reports
target groups followed the total cohort
pattern, although with a slightly higher rate
finding the activities very useful.

61Student Perspective
Non mobile respondents
The pattern here reflects the patterns of
the activities the mobile cohort found
most useful when going abroad: a welcome
meeting, a social event, and an event
organised by student organisations were
all ranked highly by respondents. It is worth
also noting that 89% of respondents would
like to participate in a scheme linking
outgoing students with local students.
26%
59%
48%
57%
61%
69%
32%
30%
37%
31%
29%
24%
27%
7%
12%
9%
6%
4%
11%
2%
2%
2%
2%
1%
6%
2%
2%
2%
2%
2%
Highly likely Likely Neutral Unlikely
Highly unlikely
Skype session withInternational Officer
at home university
Connected with local studentsby the host university
Meeting with InternationalOfficer at host university
Event organised by student organisation
Social event at hostuniversity or workplace
Welcome meeting at hostuniversity or workplace
Figure 12: likelihood to access support while abroad Q. If you were to go abroad, and the following activities were available to you while you were abroad, how likely is it that you would participate in them? (non-mobile, n = 4470)
Target groupsWhen looking at the project's target groups,
the pattern for the total cohort mapped
across the four demographics, including the
89% wishing to participate in a buddy or
ambassador scheme.
Mobility FundingThe survey asked questions about mobility funding, including monthly budget and
availability of scholarships and grants.

62 Student and Staff Perspectives on Diversity and Inclusion
8,3%
24,6%
30,8%
20,8%
10,6%
4,9%
€100 -€300 per month
€301 -€500 per month
€501 - €700 per month
€701 -€ 900 per month
€901 -€1100 per month
Over € 1101 per month
Figure 13: cost of living per month while abroadQ. What was your average cost of living per month while you were abroad? Please consider the cost of accommodation, travel, food and pocket money.? (mobile respondents; n = 8.350)
8%
20%
31%
22%19%
2% 3%
13%
27%
53%
Entirely self-funded
Less than 25% Between 25% and 50%
Between 50% and 75%
Between 75% and 100%
Actual grant coverage by mobile respondents
Needed grant coverage by non-mobile respondents
20%
59%
80%
41%
59%received less than 50% financial support
80%indicated they would need more than 50%financial support
Figure 14: Financial support offered versus neededQ. How was the total cost of your mobility period funded? (mobile respondents; n = 8.350) Q. What level of funding would be needed if you were to go abroad? (non-mobile respondents; n = 4.470)
Mobile respondents
A third of respondents
(31%) reported a monthly
cost of living between €501
and €700 a month. 5%
of respondents reported
a monthly cost of over
€1101 a month. Two-thirds
of respondents (67%)
reported a monthly budget
of at least €501.

63Student Perspective
Respondents received varied levels of funding to support their mobility programmes.
A third of respondents (31%) received a scholarship which covered at least 25% of
costs. 41% of respondents received a scholarship which covered at least 50% of their
mobility costs. Just under a fifth of respondents (19%) had the majority of their costs
covered by a grant or scholarship.
Non-mobile respondents
Over half of respondents reported needing the majority of the mobility programme
costs to be covered by funding (53%). Only 2% of respondents reported not requiring
any grant or scholarship funding.
Target groupsA higher percentage of respondents from low-income backgrounds had at least 75%
of their mobility programme funded (29%) compared to 11% of their high-income
peers. For ethnic minority respondents, 28% received grants or scholarships to cover
at least 75% of their costs, compared to 15% of white respondents. When looking at
student demographics, across the reports target groups there was a lower level of
respondents self-funding their mobility period in full: For respondents who were first
generation 4% self-funded compared to 8% for their peers, for rural, 4.6% self-funded
compared to 10% for their peers), for low income 5% self-funded compared to 8% for
their peers.
Target groupsWhen looking at the project’s target groups, 70% of non-mobile respondents from low-
income backgrounds reported needing at least 75% of the mobility costs covered by
a grant, compared to 37% for respondents from high-income backgrounds. Similarly,
for respondents from ethnic minority groups, 69% reported needing the majority
of mobility costs covered by grants or scholarships compared with 44% of white
respondents. First in family respondents and rural respondents followed the total cohort
pattern.

64 Student and Staff Perspectives on Diversity and Inclusion
1%
2%
2%
5%
5%
5%
6%
8%
11%
36%
3%
11%
10%
27%
21%
24%
20%
23%
30%
46%
13%
30%
36%
31%
26%
25%
44%
39%
33%
12%
32%
43%
40%
25%
29%
30%
22%
20%
17%
5%
51%
15%
12%
12%
20%
16%
8%
10%
9%
2%
Duration of the mobilityis too long
Language requirementis too high
Academic entry requirement is too high
Family orother community ties
Absence of familysupport or permission
Interruption tosocial ties and friendships
Extending degreeprogramme
Additional debt incurred from alonger degree programme
Loss of income/loss ofstudent job while abroad
Students need toadvance initial costs
Stronglyagree Agree Neutral Disagree
StronglyDisagree
Figure 15: Practical barriers to mobilityQ. What are the most significant practical barriers to overcome, when considering going abroad? (mobile students, n = 8.350)
Barriers to Mobility
The survey asked participants questions about what the main barriers are to taking part in mobility
programmes.
Practical barriers
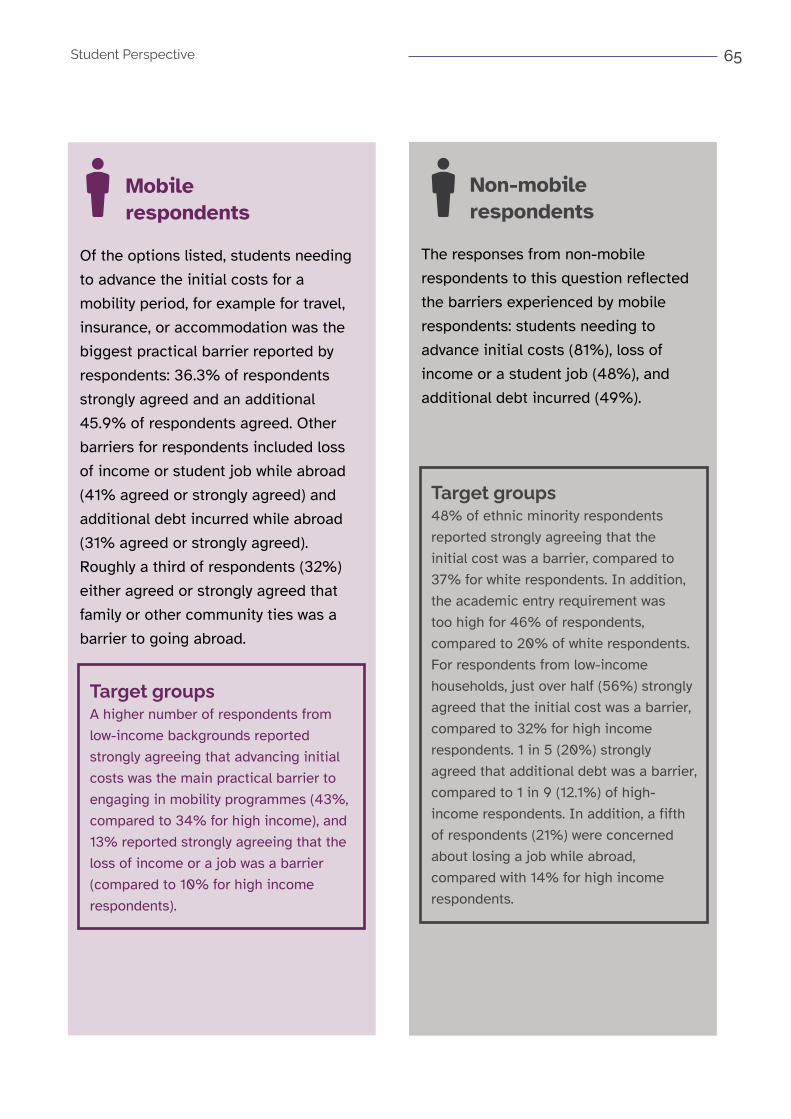
65Student Perspective
Target groupsA higher number of respondents from
low-income backgrounds reported
strongly agreeing that advancing initial
costs was the main practical barrier to
engaging in mobility programmes (43%,
compared to 34% for high income), and
13% reported strongly agreeing that the
loss of income or a job was a barrier
(compared to 10% for high income
respondents).
Target groups48% of ethnic minority respondents
reported strongly agreeing that the
initial cost was a barrier, compared to
37% for white respondents. In addition,
the academic entry requirement was
too high for 46% of respondents,
compared to 20% of white respondents.
For respondents from low-income
households, just over half (56%) strongly
agreed that the initial cost was a barrier,
compared to 32% for high income
respondents. 1 in 5 (20%) strongly
agreed that additional debt was a barrier,
compared to 1 in 9 (12.1%) of high-
income respondents. In addition, a fifth
of respondents (21%) were concerned
about losing a job while abroad,
compared with 14% for high income
respondents.
Mobile respondents
Non-mobile respondents
Of the options listed, students needing
to advance the initial costs for a
mobility period, for example for travel,
insurance, or accommodation was the
biggest practical barrier reported by
respondents: 36.3% of respondents
strongly agreed and an additional
45.9% of respondents agreed. Other
barriers for respondents included loss
of income or student job while abroad
(41% agreed or strongly agreed) and
additional debt incurred while abroad
(31% agreed or strongly agreed).
Roughly a third of respondents (32%)
either agreed or strongly agreed that
family or other community ties was a
barrier to going abroad.
The responses from non-mobile
respondents to this question reflected
the barriers experienced by mobile
respondents: students needing to
advance initial costs (81%), loss of
income or a student job (48%), and
additional debt incurred (49%).

66 Student and Staff Perspectives on Diversity and Inclusion
Barrier Strongly agree Agree Neutral Disagree Strongly
disagree
There is not enough funding available for study, work or volunteer abroad opportunities at my institution
16% 29% 22% 24% 9%
There is lack of practical support from my institution to help me to go abroad 11%
22% 22% 30% 15%
There is lack of support from academic tutors to go abroad
10% 23% 25% 27% 15%
There is not enough information about opportunities to go abroad at my institution
9% 22% 16% 33% 19%
Degree structure is too rigid to allow participation in a mobility programme
7% 18% 22% 33% 20%
Mobility programme credits do not count towards degree
6% 11% 19% 28% 37%
Q. We are interested in institutional barriers. Please rate the following statements depending on how much you agree or disagree (Mobile)
Institutional barriers

67Student Perspective
Target groupsRespondents from an ethnic minority
background reported availability of
funding being the main barrier at a
higher rate (51% reported agree or
strongly agree, compared to 43%
for white respondents). In addition,
across the four target groups higher
proportions of respondents agreed that
information about opportunities to go
abroad not being available was a barrier.
Target groupsFor ethnic minority respondents, 36%
strongly agreed there was not enough
funding, compared to 18% of white
respondents, 20% strongly agreed there
was not enough information compared
to 12% of white respondents and 24%
strongly agreed there was a lack of
practical support compared to 14% of
white respondents. For respondents from
low-income backgrounds, 35% strongly
agreed there was not enough funding
compared to 18% for respondents from
high income backgrounds. 23% reported
a lack of practical support being a
barrier, compared to 14% for high
income respondents. In addition, 20% of
respondents cited a lack of information
about available opportunities, compared
to 12% for high income respondents.
For respondents from rural areas and
first-generation respondents, the pattern
followed the total cohort response but
on average reported a high rate of
agreement.
Mobile respondents
44% of respondents agreed that not
enough funding being available was
the biggest institutional barrier to
mobility. A lack of practical support or
information (33%), as well as support
from academic tutors (34%) was
also flagged as a barrier by a third of
respondents.
Non-mobile respondents
The responses from non-mobile
respondents to this question reflected
the barriers experienced by mobile
respondents: a lack of funding
being available (57%), a lack of
practical support (45%), and a lack of
information about opportunities to go
abroad (43%).

68 Student and Staff Perspectives on Diversity and Inclusion
Barrier Strongly agree Agree Neutral Disagree Strongly
disagree
The total cost of a mobility periodis too high
16% 40% 26% 15% 4%
I was worried about finding accommodation while abroad or when I returned
15% 34% 16% 21% 14%
The visa application process is too complicated or too strict
7% 10% 33% 21% 29%
I had concerns about my personal safety abroad
2% 11% 15% 34% 39%
The language requirements for going abroad are too strict
1% 6% 18% 45% 30%
The mobility programmes available to me are too long
1% 3% 12% 44% 42%
Q. We are interested in environmental barriers. Please rate the following statements depending on how much you agree or disagree (Mobile)
Environmental barriers

69Student Perspective
Target groupsFor low-income respondents, a slightly
higher rate reported that the cost of
mobility being too high was a barrier
(58% compared to 56% for high-income
respondents). For ethnic minority
respondents, 31% reported that the visa
application is too strict (compared to
12% for white respondents).
Target groupsFor ethnic minority respondents 35%
strongly agreed that the cost of mobility
being too high was a barrier, compared
to 26% for white respondents. For
low-income respondents, 42% strongly
agreed the cost of mobility being too
high was a barrier to mobility compared
with 21% of high-income respondents
A fifth of low-income respondents
(20%) strongly agreed that concerns
relating to accommodation were a
barrier, compared to 12% for high
income respondents. For first generation
respondents, 35% strongly agreed that
the cost being too high was a barrier,
compared to 26% of their peers.
Mobile respondents
Just over half of respondents (56%)
reported that the total cost of a mobility
period being too high is a barrier to
going abroad. In addition, concerns
relating to finding accommodation
either abroad or on students return to
the home country was reported by 49%
of respondents.
Non-mobile respondents
The responses from non-mobile
respondents to this reflected the
barriers experienced by mobile
respondents: the total cost is too high
(71%) and concerns relating to finding
accommodation (49%).

70 Student and Staff Perspectives on Diversity and Inclusion
Attitudinal barriers for mobile respondents
Barrier Strongly agree Agree Neutral Disagree Strongly
disagree
I was worried about being lonely or isolated while abroad
7% 27% 16% 25% 25%
I was concerned that a mobility period will negatively affect my academic achievement
3% 13% 11% 24% 49%
I did not want to leave family and friends to go on a mobility programme
1% 9% 15% 35% 39%
I had family/community commitments that makes itdifficult to participate ina mobility programme
1% 7% 12% 36% 44%
I was concerned that a mobility period would negatively affectmy job prospects
1% 4% 6% 22% 67%
I am not interested in participating in a mobility period
1% 1% 2% 12% 83%
I did not wish to visit the countries where the mobility programmes are hosted
0% 3% 7% 28% 62%
Q. We are interested in attitudinal barriers. Please rate the following statements depending on how much you agree or disagree.

71Student Perspective
Target groupsOne fifth of respondents from low-income
backgrounds reported being worried
about impact on degree (19%, compared
to 15% for high-income respondents).
For respondents from rural areas a
slightly higher percentage did not want
to leave family and friends to go on a
mobility programme (13%, compared to
9% for respondents from urban areas).
For respondents from an ethnic minority
background, the responses followed the
same pattern as the total cohort although
with a slightly higher rate agreeing to the
barriers.
A third of respondents (34%) reported
being concerned about being lonely or
isolated while abroad, with 7% strongly
agreeing and 27% agreeing. Respondents
also reported being concerned that a
mobility period might negatively impact
their academic achievement (16%) and
expressed concerns about leaving friends
or family (10%).

72 Student and Staff Perspectives on Diversity and Inclusion
2%
4%
8%
8%
8%
9%
13%
14%
17%
40%
4%
10%
18%
22%
19%
19%
27%
28%
28%
32%
10%
16%
24%
27%
28%
28%
20%
23%
23%
15%
14%
28%
23%
27%
27%
17%
24%
22%
21%
8%
71%
42%
26%
17%
18%
26%
16%
13%
12%
5%
No interest in going abroad
Fear of discriminationwhile abroad
Unsuccessful applicationto go abroad
Lack of recognitionfor time spent abroad
Unable or unwillingto extend your degree
Personal reasons
Lack of knowledge of the opportunities to go abroad
Concerns about impact on your academic achievement
Lack of flexibility inyour degree programme
Insufficient fundingto support period abroad
Stronglyagree Agree Neutral Disagree
StronglyDisagree
Figure 16: Support offer while abroad Q. What are your main reason(s) for not going abroad? (non-mobile students, n = 4.470)
Target groupsFor low-income respondents, 59% strongly agreed compared to 29% of their higher income
peers. For first generation respondents 46% strongly agreed that insufficient funding was
a barrier compared to 36% for their peers. For ethnic minority respondents, 54% strongly
agreed, compared to 33% for white respondents. In addition, 17% of ethnic minority
respondents agreed that fear of discrimination while going abroad was a barrier, compared
to 11% of white respondents.
Other barriers for non-mobile respondents
Almost three quarters (72%) of non-mobile respondents reported insufficient funding as
their main reason for not going abroad, with almost half (40%) strongly agreeing and 32%
agreeing). Respondents also agreed that a lack of flexibility in degree programme (45%) and
concerns on the impact going abroad might have on their academic attainment (42%) as
barriers to mobility, in addition to a lack of knowledge of opportunities (40%).

73Student Perspective
Response Strongly agree Agree Neutral Disagree Strongly
disagree N/A
I felt I was treated differently or unfairly at my host university
2% 8% 12% 29% 47% 2%
I felt I was treated as less intelligent at my host university
2% 6% 9% 25% 56% 2%
I heard people at my host university make insensitive, degrading or insulting remarks about international students
2% 6% 8% 23% 58% 3%
Compared to local students, I felt I didn't have equal access to resources and opportunities at my host university
4% 12% 12% 26% 45% 2%
I felt comfortable discussing academic issues with professors there when needed
33% 34% 13% 8% 7% 4%
I felt that professors made an effort to understand difficulties international students could have had with their academic work
34% 32% 16% 9% 6% 4%
Q. Please read the following statements and rate how much you agree or disagree that they reflect your experience of being an international student at your host university.
Discrimination while abroad
The majority of respondents had positive experiences while abroad. However, 1 in 10
respondents (10%) felt that they were treated differently or unfairly at their host university.
15% (1 in 7) felt that they did not have equal access to resources and opportunities
compared to home students. 16% of respondents did not feel comfortable to discuss
academic issues with their professors.

74 Student and Staff Perspectives on Diversity and Inclusion
were treated unfairly by staff at the host
university. It is worth noting that for most of
the participants this was a rare occurrence,
however 3% of respondents reported
experiencing unfair or negative treatment
from students and staff often or very often.
7% of respondents reported being treated
unfairly or negatively by professors while
abroad.
The majority of students did not feel treated
unfairly or negatively by students from the
host institutions (62%), professors (67%)
or staff from the host university (71%). A
third of respondents (34%) reported that
they were treated unfairly or negatively
by students or professors while they were
abroad. A quarter (25%) felt that they
Very often Often Sometimes Rarely Never
Notapplicable
1%
1%
1%
4%
1%
1%
1%
2%
3%
2%
3%
4%
7%
9%
10%
7%
8%
15%
18%
21%
50%
51%
71%
67%
62%
38%
36%
4%
3%
Managersin workplace
Colleaguesin workplace
Staff fromhost university
Professors fromhost university
Students fromhost university
34%felt treated unfairly or negatively at some point during their exchange 66%
never felt treated unfairly or negativelyduring their exchange
4%
Figure 17: Treatment by members of the host societyQ. How often did the following people treat you unfairly or negatively while you were an international student? (mobile students, n = 8.340)
Target groupsThe respondents from the student demographics graphics in the reports target groups
followed the total cohort pattern.

75Student Perspective
Target groupsLooking at the reports target groups, respondents from low-income households reported
being treated unfairly by students at a slightly higher rate (39% compared to 34% for
respondents from a high-income household), as did respondents from an ethnic minority
background (39% compared to 33% for white respondents).
76%did not experience
any form ofdiscrimination
during their exchange
24%did experiencediscriminationduring their exchange 1%
1%
2%
2%
2%
2%
2%
5%
6%
16%
Disability
Gender Identity
Age
Other
Religion
Sexual orientation
Social status
Gender
Race/Ethnicity
Nationality
Figure 18: Discrimination on exchange Q. While you were abroad for your mobility programme, did you experience any discriminatory behaviours based on any of the following protected characteristics?(mobile students, n = 8.340)
Respondents were asked about any
discrimination they experienced
abroad, and if so, were able to select
all characteristics that applied. Three
quarters (76%) of respondents had not
experienced any discriminatory behaviours
while abroad. However, a quarter of
respondents (24%) had experienced some
form of discrimination while abroad on a
mobility programme: 16% of respondents
experienced discrimination based on
nationality, while 6% reported experiencing
discrimination on the basis of race or
ethnicity, and 5% on the basis of gender.

76 Student and Staff Perspectives on Diversity and Inclusion
Target groupsFor the report’s target groups, respondents from low-income households reported a slightly
higher rate (30%) of experiencing discrimination while abroad. These respondents reported
being discriminated against based on social status at a higher rate (4% vs 2% for high
income households). Almost a third (32%) of respondents from ethnic minority backgrounds
reported experiencing discrimination, with 14% reporting this on the basis of race or
ethnicity (compared to 3% for white respondents, and 1 in 5 reported this on grounds of
nationality (20%, compared to 15% for white respondents). Responses from participants
who were first generation respondents or from a rural background followed the total cohort
pattern.
Response Count
Family and friends 21%
Home university 8%
Host university 9%
Local services (including but not limited to police, local community groups, hospital)
3%
Student organisations (including but not limited to Erasmus Student Network, Student Unions, Student Societies)
9%
Workplace 2%
Other 4%
I did not experience any discriminatory behaviours 71%
Total 8340
Q. Did you receive any support following the incident(s) from the following organisations or groups?

77Student Perspective
Target groupsRespondents in the report’s target groups
followed the total cohort pattern.
increasedfollowing mobility
45% 33% 12% 10%unchangedfollowingmobility
don’t know
decreasedfollowingmobility
Figure 19: Impact on academic achievement Q. In terms of your academic achievement, my academic grade ... (mobile students, n = 8.349)
For those respondents that did experience
discriminatory behaviours, the majority
(71%) received support from their
Family and Friends, followed by the host
university (31%) and student organisations
(31%), and the home university (28%).
Impact of mobilityThe survey asked respondents about the
impact of a mobile experience, including
academic achievements as well as skills
acquisition and personal development.
Academic Achievement
Overall, 33% of respondents indicated that
their academic grades were not impacted
by their exchange, their grades stayed the
same following their mobility period.
45% of respondents indicated that their
academic performance was impacted
positively by their mobility, and their
academic grade increased following their
mobility. 10% experienced a decrease
in their academic grade following their
mobility period, while 12% did not know
how mobility impacted their academic
achievement.

78 Student and Staff Perspectives on Diversity and Inclusion
Target groups49% of ethnic minority respondents reported that their academic grade increased following
mobility, compared to 43% for white respondents. 31% of the respondents indicated that
their academic grade stayed the same following their mobility compared to 35% of white
respondents.
47% of first-generation respondents indicated that their grades increased following their
mobility, compared to 43% of students whose families had undergone higher education.
The pattern holds for respondents from low-income backgrounds (44%) and respondents
from rural backgrounds (44%).
Significantimpact
Moderateimpact Neutral
Low impact
Noimpact
Figure 20: Impact of mobilityQ. What impact did your mobility programme have on the following areas (mobile students, n = 8.349)
19%
17%
50%
67%
23%
34%
28%
54%
35%
36%
34%
23%
27%
32%
35%
30%
32%
32%
10%
7%
26%
19%
21%
11%
7%
8%
4%
2%
12%
10%
9%
3%
7%
8%
3%
1%
11%
5%
6%
2%
Commitmentto degree programme
Grade or class of degree
Foreignlanguage proficiency
Interest in further studyor work abroad
Change incareer planning
New overseas academicor professional contacts
Change in valuesor ethical position
Increased interest ininternational or global affairs
Academic Impact

79Student Perspective
Target groupsThe pattern holds for first generation
respondents, as well as for respondents
from rural areas. For respondents from
a low-income background the patterns
hold as well, with very similar results when
compared to the respondents from high-
income backgrounds, although respondents
from low-income reported a 55% impact
(significant and moderate) on their career
planning, while this is only the case for
49% of respondents from high-income
backgrounds.
The pattern holds as well for ethnic minority
respondents, although in some cases a
higher percentage of students agreed that
there were specific impacts experiences:
ethnic minority respondents reported a
higher significant impact on their interest
in international or global affairs at 62%
compared to 51% of white respondents.
They also reported a higher impact on
their change in career planning, with 57%
of respondents from an ethnic minority
reporting their mobility had an impact on
their career planning, compared to 48% of
white respondents. 68% of ethnic minority
respondents reported an impact on their
values or ethical position, compared to the
62% of white respondents.
Respondents were asked to assess
the academic impact of their mobility
programme. 52% of respondents indicated
that the mobility had a significant or
moderate impact on their grade or class
of degree at graduation, whereas 32% of
respondents reported a neutral impact,
reflecting the previously indicated 33%
who did not report a change in their
academic performance following a mobility
experience.
67% of respondents indicated that
their interest to do further study or work
abroad was significantly impacted by their
mobility, and 23,4% of students reporting
a moderate impact. 54% of respondents
reported that their mobility period had
a significant impact on their interest in
international or global affairs, while 30%
of students reported a moderate impact.
For 50% of respondents, there was a
significant impact on their foreign language
proficiency, while 34% of respondents
reported a moderate level of impact on
their proficiency in foreign languages after
their mobility. 63% of respondents reported
a significant (28,5%) or moderate (34,8%)
impact on their values or ethical positions,
while 66% of respondents an impact on
their overseas academic or professional
contacts.

80 Student and Staff Perspectives on Diversity and Inclusion
The majority of respondents are currently
studying full time as their main occupation
at the moment of the survey. 71,2% of
mobile respondents are currently still
enrolled in education, whereas 72,5%
of respondents that did not take part in
mobility are currently enrolled in education.
A greater percentage at 12,1% of mobile
respondents are currently in full time or
part time employment, whereas 7,0% of
respondents without mobility experience
are currently engaged in full time or
part-time employment. A larger group of
respondents without mobility experience
are combining employment and studying,
14,7% of non-mobile students reported
to currently be in employment as well as
studying at the moment, while this is only
the case of 10,4% of past mobile students.
When asking non-mobile respondents
what they would consider to be the
impact of a mobility opportunity, they
indicated that they consider the impact
on personal development would have the
most impact, with 81% of respondents
stating that they consider the impact
significant, and 15% considering the
impact moderate. 54% of non-mobile
respondents consider the impact of a
mobility opportunity abroad significant
on employment prospects, with 34% of
non-mobile participants considering this
moderately impactful for career prospects.
According to non-mobile respondents,
there is also an impact on academic
achievement, as 44% of respondents state
they believe there is a significant impact
on academic achievement, while 36% of
non-mobile respondents consider this
to have a moderate impact on academic
achievement.
44%
54%
81%
36%
34%
15%
14%
9%
3%
6%
2%
1%
1%
Academicachievement
Employmentprospects
Personaldevelopment
Significantimpact
Moderateimpact Neutral
Low impact
Noimpact
Figure 21: Non-mobile students’ impression on the impact of mobilityQ. Going abroad will help your ... (non-mobile students, n = 4.471)

81Student Perspective
Out of all those graduated, and currently in employment (n = 3.691), respondents were
more likely to have a job in the first three months after graduation, with 54,4% of mobile
respondents to report obtaining a full-time job between 0-3 months after graduation,
compared to 46,8% of respondents with a non-mobile experience upon graduation. When
looking at full-time employment within the first 6 months of 71,2% of respondents with a
mobility experience will find full-time employment within the first six months of graduation,
compared to 67,5% of students without a mobility experience. Within the first year after
graduation, respondents without mobility have caught up, as 85,6% of graduates without
mobile experience have found full-time employment, compared to 86,2% of graduates with
mobility experience.
54,4%
86,2%
95,1%
46,8%
67,5%
85,6%
94,8%
100,0%
40%
60%
80%
100%
0 to 3 months
3 to 6 months
6 monthsto 1 year
1 year to18 months
Over 18 months
71,2%
Figure 22: Duration till full time job after graduation Q. How soon after completing your studies did you get a full-time job? (graduated respondents, n = 3.691)
mobilegraduates
non-mobilegraduates

82 Student and Staff Perspectives on Diversity and Inclusion
Highly likely Likely Neutral Unlikely
Highly unlikely
9%
51%
11%
52%
74%
28%
37%
33%
35%
19%
38%
9%
36%
10%
6%
17%
2%
14%
2%
1%
Studying inmy home country
Studyingabroad
Doing an internship inmy home country
Doing aninternship abroad
Travel more
6%
7%
Figure 23: Duration till full time job after graduation Q. Has your mobility experience made you more or less likely to participate in the following opportunities? (mobile respondents, n = 8.349)
Respondents with a mobility experience tend to be more interested in general travel, as
74% of respondents indicate that their mobility has made it highly likely they will participate
in general travel, whereas 18,5% of respondents indicate that they are likely to take
part in general travel following their mobility experience. Respondents further state that
their mobility experience has made it more likely for them to take part in a study abroad
experience (more likely for 88% of respondents) or do an internship abroad (87%). With
38% of respondents indicated that they are more likely to continue studying in their home
country, and 44% of respondents saying they are more likely to do an internship in their
home country, there is a stark contrast between the interests in opportunities abroad
compared to opportunities in the home country.

83Student Perspective
better. Understanding of the differences
between their home country and host
country was reported with a high degree
of agreement at 93%, with 57% strongly
agreeing and 36% agreeing. 88% of
respondents reported an improvement in
their knowledge of foreign languages.
Competencies – KnowledgeRespondents reported high impacts
based on the knowledge gained from their
mobility experience. The highest majority
(95%) of respondents strongly agreed
(65%) or agreed (31%) that they knew
more about the cultural characteristics of
the host country following their mobility
experience, while 71% of respondents
indicated to understand their home country Target groupsThe pattern holds across all target groups.
34%
46%
57%
57%
65%
36%
37%
36%
31%
31%
20%
13%
6%
8%
4%
7%
3%
1%
2%
1%
2%
1%
2%
I know more aboutthe cultural characteristics
of my home country
I know more aboutthe history of
the host country
I understandthe difference between
my home and host country
I improvedmy knowledge
of a foreign language
I know more aboutcultural characteristics
of the host country
Stronglyagree Agree Neutral Disagree
StronglyDisagree
Figure 24: Gained knowledge on mobility Q. Please rate the following statements with regards to how much you agree with the statement following your mobility experience. (mobile students, n = 8.349)

84 Student and Staff Perspectives on Diversity and Inclusion
that they are able to adjust their language
to the needs of the audience following their
experience abroad. Confidence to speak
in public was impacted positively for 77%
of respondents, with 77% of respondents
indicating that they became better at
Competencies – Skills92,4% of respondents indicated that
they could work in intercultural teams
after taking part in a mobility with 58%
strongly agreeing and 35% agreeing with
the statement. The skill to adjust working
practice to an international setting also
emerged as a strong skill that was improved
following a mobility experience, with 89%
of respondents either strongly agreeing
(47%) or agreeing (42%). Being able to
work independently is a skill respondents
felt more confident in: 86% indicated they
were more able to do so after their mobility
experience. 84% of respondents reported
Target groupsThe pattern holds across all target groups.
24%
38%
39%
44%
47%
49%
57%
37%
39%
37%
40%
43%
37%
35%
26%
20%
18%
13%
9%
12%
7%
10%
3%
4%
2%
1%
1%
1%
2%
1%
1%
I improved my time management skills
I can better manageactivities and projects
I feel more confidentto speak in public
I can adjust my languageto the needs of the audience
I can adapt my workto an international setting
I can work independently
I can work inintercultural teams
Stronglyagree Agree Neutral Disagree
StronglyDisagree
Figure 25: Gained Skills on mobilityQ. Please rate the following statements with regards to how much you agree with the statement following your mobility experience. (mobile students, n = 8.349)

85Student Perspective
of respondents reported having a better
understanding of the diverse needs in
society, as 51% strongly agreed and
36%% agreed to the statement that they
understand better what is going on in
society upon return from their mobility.
84% of respondents expressed that
they have a better understanding of
other people’s point of view, and 80%
of respondents reported feeling more
responsible for the society they live in.
Competencies – AttitudesThe majority of respondents (92%)
indicated that their curiosity increased
following their mobility experience with
61% strongly agreeing and 31% agreeing
with the statement that they were eager
to learn more about cultures different
from their own. Confidence to operate
in an intercultural setting was also
impacted: 91% of respondents agreed
this had improved following their mobility
experience. 90% of mobile respondents
reported to strongly agree (57%) or agreed
(33%) to the statement that they felt more
aware and accepting of cultural differences
following their mobility experience. 87%
Target groupsThe pattern holds across all target groups.
31%
44%
45%
51%
54%
57%
61%
30%
36%
39%
36%
37%
33%
31%
27%
17%
14%
11%
8%
8%
7%
10%
2%
1%
2%
1%
1%
1%
3%
1%
I feel more engaged to participate in my university community
I feel more responsible for the society I live in
I understand betterother people's point of view
I have a better understandingof the diverse needs in society
I feel more confidentin an intercultural setting
I am more aware & accepting of cultural differences
I am eager to learn more about cultures different from my own
Stronglyagree Agree Neutral Disagree
StronglyDisagree
Figure 26: Changes in values and attitudesQ. Please rate the following statements with regards to how much you agree with the statement following your mobility experience. (mobile students, n = 8.349)

86 Student and Staff Perspectives on Diversity and Inclusion
• Ethnic minority respondents who
were first generation to attend
university (1675 total respondents)
• First generation respondents from
a low-income background (1707
total respondents)
• First generation respondents from
rural backgrounds (1407 total
respondents)
• Respondents from rural
backgrounds and low-income
backgrounds (664 total
respondents)
The project team was cautious of the risk of
overinterpreting the results for some of the
smaller populations in these groups. Below
are the top line patterns and findings for
these intersectional groupings.
IntersectionalityThe analysis within this report reviews the
data for each of our target demographics in
isolation. However, identities are complex,
and while analysing the findings for these
groups is useful in plotting trends and
patterns it does not tell a full story. For
students with overlapping disadvantaged
identities, the barriers can compound and
reinforce each other creating further and
more challenging barriers to mobility for
students.
The project analysed the findings for:
• Ethnic minority respondents from a
low-income background (994 total
respondents)
• Ethnic minority respondents from
rural backgrounds (524 total
respondents)
51%
53%
58%
63%
69%
71%
72%
Total Cohort
First generation respondents from rural backgrounds
Students from rural backgroundsand low-income backgrounds
First generation students froma low-income background
Ethnic minority studentsfrom rural backgrounds
Ethnic minority studentswho were first generation
Ethnic minority studentsfrom a low-income background
Figure 27: Students who had not traveled abroad on an educational programme before their bachelor Q. Prior to starting your bachelor’s degree, did you travel abroad as part of an educational programme? (mobile students, n = 8.349)
non-mobilebefore graduation
Key Findings

87Student Perspective
Again, a higher percentage of respondents
did not go abroad during their bachelor’s
degree when compared to the total cohort.
Across all groups, a higher rate of the
mobile respondents participated in short-
term duration mobilities when compared
to the total cohort. This was particularly the
case for ethnic minority respondents from
Across all groups, a higher percentage of respondents reported not having travelled abroad
as part of an educational programme when compared to the total survey cohort.
53% 55% 57% 59% 60% 63% 65%
47% 45% 43% 41% 40% 37% 35%
Ethn
ic m
inor
ity
resp
onde
nts
from
a lo
w-i
ncom
e ba
ckbg
roun
d
Ethn
ic m
inor
ity
resp
onde
nts
from
rur
al b
ackg
roun
d
Ethn
ic m
inor
ity
resp
onde
nts
who
wer
e fi
rst
gene
rati
on
Firs
t ge
nera
tion
res
pond
ents
from
a lo
w-i
ncom
e ba
ckgr
ound
Res
pond
ents
fro
m r
ural
bac
kgro
unds
and
low
-inc
ome
back
grou
nds
Firs
t ge
nera
tion
res
pond
ents
from
rur
al b
ackg
roun
ds
Tota
l coh
ort
mobilestudents
non-mobilestudents
Figure 28: Mobility participation across intersectional demographic groups
low-income backgrounds (22%) and rural
backgrounds (18%). For the non-mobile
participants, there was a broad interest
in participating in short-term mobility
programmes.

88 Student and Staff Perspectives on Diversity and Inclusion
Again a higher percentage of
respondents in the intersectional
groupings reported needing
at least 75% of the mobility
programme costs to be covered
by funding if they were to go
abroad, compared to the total
cohort. For five out of the six
groupings, in excess of 70% of
respondents reported needing
the majority of mobility costs
funded.
Group Short-term mobility
Ethnic minority respondents from a low-income background 22%
Ethnic minority respondents from rural backgrounds 18%
Ethnic minority respondents who were first generation 16%
Respondents from rural backgrounds and low-income backgrounds
16%
First generation respondents from a low-income background 12%
First generation respondents from rural backgrounds 11%
Q. What type of mobility programme did you participate in?
77%74% 72% 72% 71%
57%53%
Ethn
ic m
inor
ity
resp
onde
nts
from
a lo
w-i
ncom
e ba
ckgr
ound
Ethn
ic m
inor
ity
resp
onde
nts
from
rur
al b
ackg
roun
ds
Ethn
ic m
inor
ity
resp
onde
nts
who
wer
e fi
rst
gene
rati
on
Res
pond
ents
fro
m r
ural
bac
kgro
unds
and
low
-inc
ome
back
grou
nds
Firs
t ge
nera
tion
res
pond
ents
fro
m a
low
-inc
ome
back
grou
nd
Firs
t ge
nera
tion
res
pond
ents
fro
m r
ural
bac
kgro
unds
Tota
l non
-mob
ile r
espo
nden
ts
Figure 29: Percentage of respondents needing at least 75% of mobilitycosts covered
Figure 29: Percentage of respondents needing at least 75% of mobility costs covered

89Student Perspective
of information about available
mobility programmes, and concerns
relating to academic attainment
were reported. These barriers tended
to be reported at a higher rate, with
a larger proportion of respondents
reporting that they strongly agree
these were barriers to mobility.
Other trends for the intersectional
groupings:
• A higher percentage reported
that they were treated unfairly or
negatively by students or professors
while they were abroad. 43% of
ethnic minority students from a rural
background reported being treated
unfairly by students, as did 40% of
ethnic minority respondents from
low-income backgrounds and 40%
of respondents from rural and low-
income backgrounds. As with the
total cohort, most of the respondents
reported that this was a rare
occurrence.
• Across all intersectional groups,
respondents reported experiencing
discrimination while abroad at a
higher rate than the survey cohort,
with the exception of first-generation
respondents from rural backgrounds
who were in line with the total cohort.
36% of ethnic minority respondents
from a low-income background
reported experiencing discrimination
while abroad (compared to 24% for
the total cohort).
• Across all groups, the pattern for
barriers encountered mapped that
of the total cohort, with barriers
relating to finance, including lack
of funding, the risk of losing a part-
time job and the additional debt
incurred while abroad all reported
by respondents. In addition, a lack

90 Student and Staff Perspectives on Diversity and Inclusion
in four of the project partner countries:
Belgium, the Czech Republic, France, and
Latvia.
The students studied across a wide range
of disciplines. A third of students (32%)
studied humanities subjects, with a fifth
(21%) studying Economic and Business
Sciences.
Students in the focus groups were from less
advantaged or underrepresented groups as
defined in the outset of this report.
Who participated in the focus groups? Placing student voices at the centre of
efforts to increasing participation in
outgoing mobility is key. The SIEM project
conducted a series of focus groups with
project partners institutions during October
and November 2020. The workshops
covered motivators, barriers and challenges
to mobility and discussed what support
should be put in place to encourage more
students to go abroad.
The aims of the focus groups were:
• to gain an understanding of what
attracts students to study, work or
volunteer abroad.
• to identify existing barriers
to participation in mobility
programmes; and
• to discuss solutions to barriers, and
ways to increase participation in
mobility programmes
A total of 36 students participated in the
sessions, with a mix of mobile and non-
mobile students. Focus groups took place
Student Focus Group Findings

91Student Perspective
Meeting new people and expanding
networks was something students
discussed. Including the opportunity to
make new friends, and to meet likeminded
people. Students were also interested
in meeting students with different
perspectives to their own, who have had a
different life experience.
Students were excited by the prospect of
expanding their learning related to their
degree subject. They felt a different study
environment would offer new perspectives.
Some students flagged particular countries
as these were the locations for specific
institutions that they were interested
in studying at, or because they were
interested in learning about a national
approach within their field.
What attracts students to going abroad?Overwhelmingly, students reported being
keen to learn about other societies and
cultures. Students were interested in
learning about the history of different
countries and immersing themselves in
a different lifestyle. In some cases, the
students already have knowledge of the
location, for example having studied the
history of a country, which inspired their
choice of destination. In other cases,
students reported seeing the country
captured in videos, photographs and in
literature, which spiked their interest in
visiting.
Students were keen to have new
experiences and adventure, and to visit
places that look different to home, both in
terms of urban architecture but also the
local nature.
They were excited by the idea of visiting
a new place, and the different activities
available, including opportunities to try out
new hobbies and leisure activities.
It’s a completely different lifestyle and there’s a lot of
strangers that have a lot to talk about because they
came from very different environment than I do.
I really wanted to see how life is somewhere else and
to meet new people.The chance to meet new people, to get to know new cultures and see how I get along in a different country
as I was never abroad before, and I cannot imagine
what I will face

Currently life consists of studying, which is now our priority. But to do that in combination with something really cool… that's a change, that's great.
“

93Student Perspective
A few students flagged that the opportunity
to travel abroad with the university was in
itself a motivator. In one case a student
had been motivated to attend university for
the chance to travel abroad. Students felt
that the programmes offered by a university
were different to the type of travel options
available to you as a tourist, that they would
allow you to immerse yourself more fully in
the culture and society of a place.
What mobility programmes are students interested in? Students were asked what type of mobility
programme they would like to participate
in, where the programme should take place,
the duration of the mobility programme
Location of Mobility Programme
The students named a wide range of
countries or places they would like to
visit across the world. The most popular
destinations were the United States,
New Zealand, and Denmark. It is worth
noting that in some cases the students
were specific, for example naming the
city ‘Copenhagen’ rather than the country
Denmark.
In other cases, students named regions
or continents such as ‘Southern Europe’
or ‘South America’. For many students,
their initial response was to “see the whole
world” and wanting to visit many countries.
Students also mentioned that they would
like to visit multiple countries in one trip.
The learning extended to an interest in
improving language skills and language
learning. Students felt they would benefit
from being immersed in the local language
and learn more than they would in a
classroom. Related to this, some students
selected locations where they knew they
could speak to the local language.
Students were interested in visiting
locations where they had family or cultural
heritage, to learn more about their own
history, or to spend time with their relatives.
They were also interested in visiting
locations where they had friends locally,
or where friends had visited. In addition,
some students reported being encouraged
by family who like to travel. Related to this,
some students had been dissuaded from
travelling to some locations based on other
people’s reports, for example, where a
parent believes a country has a lot of crime.
It’s best to learn a language by actually visiting the
country and being forced to use the language… when you
are in the country for long enough you can improve to
the level of a native speaker.
To travel is a big dream for me because with my parents we
would only travel to go camping in [Home Country], so the option to go for an Erasmus somewhere and
study was awesome - It’s one of the reasons I even went to university.
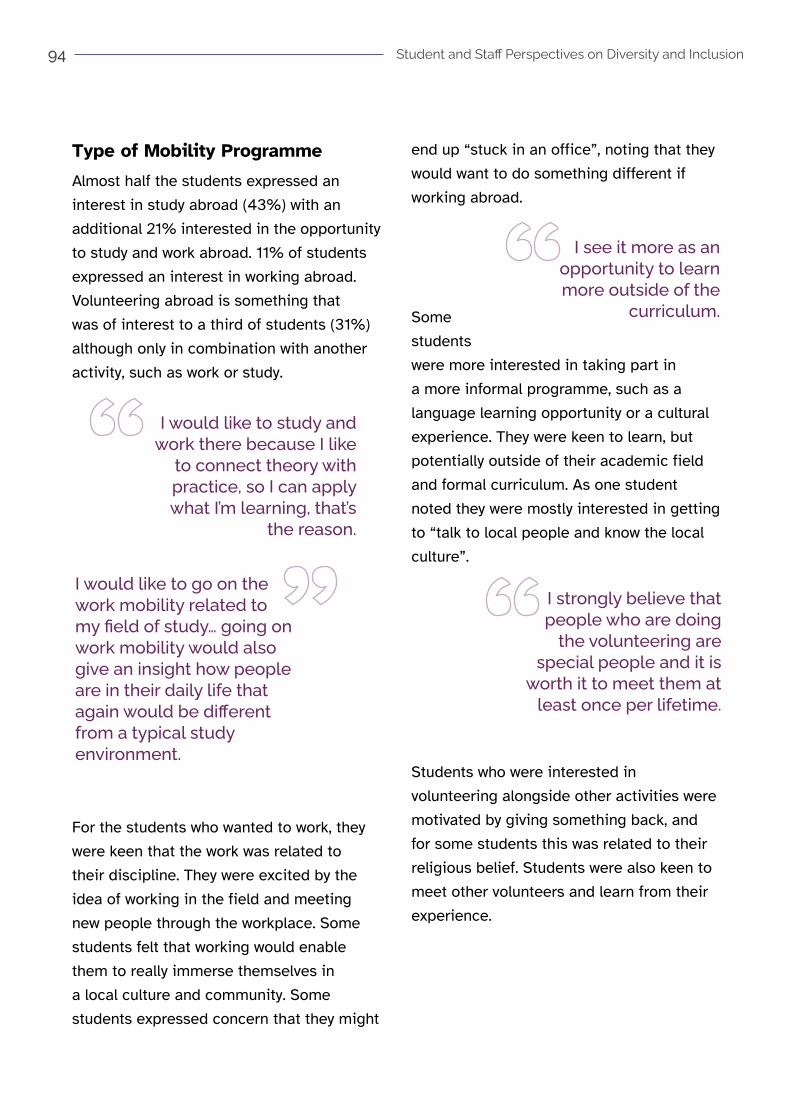
94 Student and Staff Perspectives on Diversity and Inclusion
end up “stuck in an office”, noting that they
would want to do something different if
working abroad.
Some
students
were more interested in taking part in
a more informal programme, such as a
language learning opportunity or a cultural
experience. They were keen to learn, but
potentially outside of their academic field
and formal curriculum. As one student
noted they were mostly interested in getting
to “talk to local people and know the local
culture”.
Students who were interested in
volunteering alongside other activities were
motivated by giving something back, and
for some students this was related to their
religious belief. Students were also keen to
meet other volunteers and learn from their
experience.
Type of Mobility Programme
Almost half the students expressed an
interest in study abroad (43%) with an
additional 21% interested in the opportunity
to study and work abroad. 11% of students
expressed an interest in working abroad.
Volunteering abroad is something that
was of interest to a third of students (31%)
although only in combination with another
activity, such as work or study.
For the students who wanted to work, they
were keen that the work was related to
their discipline. They were excited by the
idea of working in the field and meeting
new people through the workplace. Some
students felt that working would enable
them to really immerse themselves in
a local culture and community. Some
students expressed concern that they might
I would like to study and work there because I like
to connect theory with practice, so I can apply what I’m learning, that’s
the reason.
I would like to go on the work mobility related to my field of study… going on work mobility would also give an insight how people are in their daily life that again would be different from a typical study environment.
I see it more as an opportunity to learn more outside of the
curriculum.
I strongly believe that people who are doing
the volunteering are special people and it is
worth it to meet them at least once per lifetime.

95Student Perspective
For some students, they felt that a shorter
duration mobility would be positive if it
had a specific purpose, for example, a
conference, so that students were sure
to get something out of the experience.
There was the suggestion that a short-term
programme should be structured to make
the most of the time abroad.
Several students were “afraid” to apply for
a full year abroad and opted instead for the
shorter duration mobility. For students who
were worried about going abroad, having a
short-term programme was more appealing
as it would allow them to trial a location or
programme. Students were interested in the
option to extend stays if they were going
well.
Other reasons given for wanting a short-
term duration mobility was family and
community commitments. This included
both formal care provision with children
and dependents, but also romantic
Duration of Mobility Programme
When students were asked about what
duration a mobility programme should be
the results were mixed: Just over a third
of students (39%) were interested in a
semester abroad, with another third (36%)
interested in an academic year abroad.
A quarter of students (25%) wanted to
participate in a short-term programme.
The reasons for length of programme
depended on a few factors, including the
type of mobility programme a student was
interested in participating, the experience
the student had with international travel,
and their home commitments.
Students were keen that the experience
made an impact on them. They were
motivated to make the most of the
opportunity, particularly as there is a
financial outlay. Students expressed
concern that a shorter period abroad would
not allow them to immerse themselves in
the culture. A year abroad offers a better
opportunity for immersion in a local culture,
and to develop skills, particularly language
skills.
During one year you can better learn the
language and culture
I have nothing against shorter conferences, like for a week, if
it has some specific topic, so you leave, you learn something
and then you go back.
I’d like to first try that out for about a month or two weeks
and then go abroad for a longer time, like three or four months, so I’d like to try it out for a shorter time and then I’d
see what to do next.
I have a family and a husband, and I don’t
want to spend so long time separate from them.

96 Student and Staff Perspectives on Diversity and Inclusion
There was a general consensus that
mobility programmes broaden your horizons
and provides different perspectives and
different approaches to studies. Students
felt that going abroad will help their
academic achievement by providing new
insights, methods, and technologies.
Students were also interested in meeting
other students who they could learn from
and as one noted “who may turn out to be
colleagues in the future”. Students also
felt that mobility would lead to an increase
in confidence making them more likely
to participate in classes which would
have a positive impact on their academic
attainment.
Some students were not sure if the mobility
would improve their academic attainment,
students thought this depended on the
length of the mobility, the personal qualities
of the student, and how the academic
modules mapped to their home courses and
if these were credit bearing. A few students
were concerned the experience might
negatively impact their grade, particularly
if they struggled with language barriers or
if the host university did not support their
academic attainment.
There was consensus across all groups that
having a mobility experience looks good on
your CV, and helps you stand out from other
candidates applying for roles. They felt the
experience would be particularly impressive
if the experience were related to specific
career, but that any experience would set
relationships, familial obligations. In
addition, students were concerned about
leaving jobs, social clubs, sports clubs, and
their course mates.
For some students that middle ground was
a semester abroad, which they felt was a
long enough time for them to experience
the learning and culture of a new place
but short enough that they would not miss
out on life at home, particularly friendship
groups and their host university curriculum.
Location also informed the students
decision around the duration of a mobility
opportunity: if it were a short flight a shorter
period abroad would be ok. However, for
long haul trips students felt it would be
better to spend a more substantial time
abroad.
What is the impact of mobility programmes?
In my opinion the perfect length of the stay is one
semester because it’s long enough to really experience
something and learn something.
Studies in other countries are organized differently;
there are different professors, language and environment.

97Student Perspective
You have to make yourself an interesting candidate for the job and I think some experience from abroad can really help.
“

98 Student and Staff Perspectives on Diversity and Inclusion
make friends with people from different
backgrounds. Students talked about the
mobility providing an opportunity to “step
out of (their) comfort zone”, improve
their socializing skills, and develop more
courage. Students felt they would learn
more about themselves, and “learn to be a
better person through the process”.
Students discussed the possibility that
the experience could be negative, the risk
of depression being away from home and
university or work pressures. However,
they agreed that these would still be
opportunities for growth, and that they
would help students to “learn how to react
and deal with difficult situations”. Students
also raised concerns relating to reverse
culture shock on their return to the home
country.
you apart from others. Some students were
keen to work abroad as this was in their
ambitions for the future post-university,
and they were eager to trial this. Students
suggested the mobility programme put you
in contact with more people from different
cultures, which prepares you to work with
people from different backgrounds in the
workplace
Students felt that mobility programmes
provide skills to build on which would
set them up well for future employment
opportunities. Skills named included
confidence, independence, adaptability,
communication, tolerance, and learning
to manage a budget. In addition, students
felt that improving a foreign language,
particularly English, would help them in the
labour market.
Universally, students agreed that going
abroad would help their personal
development. They were excited to develop
new networks, to learn from others, and to
I think that employers like to see that their employees
are able to adapt, are flexible and can speak more languages
compared to others.
I would go with one view and return with another, not
only about that specific place but also about other countries
and cultures.
The stay abroad definitely helped with personal growth
and I think everyone should try that because you can gain a lot by being away from your social
group and social bubble.
Every negative experience teaches you something and helps you to grow.

99Student Perspective
Students who rely on part-time jobs to
support their study at the home university
were unsure if they would be able to work
abroad, and if not, they would be unable
to afford to take part in the programme.
Students were also concerned about losing
their jobs in the home country should they
take up a mobility opportunity, with one
student noting: “I have to start thinking
right away about what I can do to earn
money after an Erasmus”.
Many students were concerned about failing
their academic course if they did not do
well in their studies while they were abroad.
They were concerned that they may also
“have to pay all of the scholarship back”. If
they did not do well academically. Students
were concerned that the courses they want
to study abroad may not be available once
they arrive in country.
Students were also concerned about
the academic barriers to the exchange
programme if there is a minimum
What are the barriers to participation in mobility programmes?
Across all groups, students cited finance as
a barrier. Students had concerns that “the
scholarship wouldn’t be able to cover all
the expenses”, particularly accommodation
costs as well as healthcare costs. One
student described how they were “really
scared (they wouldn’t) have enough money
for food”. Students mentioned that without
family support they did not think they could
afford to go abroad. Other costs mentioned
included insurance, accommodation for
home rentals while abroad, and visas.
Some students lacked information about
what grants and support were available to
them to undertake a mobility experience.
They were unclear how to apply for grants,
and how the grants worked in practice.
I am someone who has to combine five jobs to pay for my room and studies.
I have to spend everything I earn immediately. Saving for Erasmus is
therefore extremely difficult… and especially during this crisis now that
I have also lost some jobs.“I didn’t want to get
kicked out of university just because of an Erasmus”.
The information about grants is not really there.
Which ones exist? Are there specific scholarships for
students like me?
They should give more opportunities to others.
An average of eleven can sometimes be difficult for
people who have to work in addition to studying.

100 Student and Staff Perspectives on Diversity and Inclusion
shared thoughts on the communications
methods used by the university: they receive
a lot of emails, so information on mobility
opportunities shared via email could be
missed.
In addition, students felt there was a lack
of information about the support provided
while abroad. They did not know if they
would have a contact abroad in case of
emergency – students were worried about
what to do if they encountered a crisis.
Students also felt that the communications
about mobility focused too much on the
positives and did not clarify what to do
if things were to ‘go wrong’. This made
students uneasy about how they would
handle a crisis abroad.
A number of students discussed fear
of the unknown as a barrier to mobility.
Students did not know what to expect and
were concerned that the mobility would be
different to what they imagined. Students
were afraid of being “alone” and struggling
attainment needed to access the
programme. This was felt particularly
important where students might have
extenuating circumstances which impacts
their academic attainment, for example
students who “have to work for their studies
or to help at home”. Students expressed
concerns that mobility was an “elitist
opportunity”.
Students flagged administrative barriers,
particularly in trying to navigate the
application process. Students were
confused by the numbers of different
papers and forms they needed to complete
with one student noting that “the pile of
information raises even more questions”.
Additionally, the students struggled to
find where the information on mobility
opportunities was held, and when they
found it they did not have the right
information. Students felt that there was
limited information provided about mobility
programs, about who can go abroad and
what their options are. Students found the
application process too long, and in some
cases they missed the deadline which was
early in the term when they were not in a
position to consider going abroad. Students
I would say culture shock when the cultures
are too different and because of that I don’t want
to go there.
There are so many options, but how to choose the best
one for me and what if at the end I choose but I don’t like it there.
The bureaucracy: (there were) lots of forms and
papers to fill, the information about the places where we
could go was structured badly… it was really hard to find
the information.

101Student Perspective
that were available in English, or a language
they felt comfortable speaking. They were
worried this would impact their academic
attainment while abroad.
Students were also worried about having
to communicate in another language,
particularly if they encountered a crisis.
Students were concerned about becoming
unwell when abroad and what support
would be available to them if they did not
have their local networks.
Medical support was flagged by a
number of students, who were concerned
particularly about accessing affordable
health insurance while abroad.
Students were worried about navigating
the different health insurance companies
and getting the correct coverage. Students
with pre-existing medical conditions were
worried about how they would be supported
abroad, how they would access medical
care and the costs associated with this,
and if they could access their specific
medication while abroad.
with the exchange. Students noted that
due to the Covid-19 outbreak, their fears
were heightened as “the uncertainty is
even bigger as the borders may be closed”.
Students discussed concerns about leaving
behind family, friends, and relationships,
as well as their personal routine. Students
were worried they would be able to get
home in time if there was an emergency.
Fear of being isolated and lonely while
abroad was reported by a number of
students. Students were worried about
going to an “unknown environment, having
no idea how things work there”. Some
students had limited travel experience
and were worried about how they would
cope abroad. This lack of confidence was
compounded by having to go on a mobility
programme alone: “it’s not easy to function
when you’re in a new environment all
alone”.
Many students reported being afraid of the
language barrier. They were particularly
concerned about the number of courses
What if I won’t make friends and be totally
alone there.
I really like to travel but due to my low self-esteem I was
always shy to speak English… it’s always keeping me from
travelling anywhere because I think I won’t be able to communicate properly
in English.
I was ill several times and I started having problems
with my mental health and it’s incredibly hard when you
don’t have things and people you can lean on.
I feel like those are some challenges that might actually
be the reason why people go on Erasmus, not things that should stop
you from going abroad.

102 Student and Staff Perspectives on Diversity and Inclusion
I am a Muslim myself and have Moroccan roots. You always feel a bit of an outsider or discriminated against. In (home institution) you still have an idea of where to go for help or support, but abroad that certainty may disappear. Where do you go when you experience something like this abroad?”
“

103Student Perspective
One student suggested that mobility was
“not for (their) age group”.
Students were concerned about
discrimination based on gender, ethnicity,
disability, sexuality, and age. Students
were concerned about being seen as an
outsider and being treated differently or
discriminated against on the basis of their
identity.
What support is needed to access mobility programmes?
Some students were discouraged by
the administrative process for going
abroad, which they felt was complicated
and confusing. Students were keen for
the information to be more streamlined
and the process to be made clear. It was
important for students that information was
communicated in a “common language,
During the discussion on challenges, a
number of students noted that facing
challenges was part of the development
that going abroad provides. They were
not put off by the challenges themselves
but were keen to know how they would be
supported to deal with these challenges.
Again, this links to the need to ensure
students are aware of who to contact in the
case of an emergency
Discrimination while abroadWhen asked about barriers and challenges
to mobility programmes, a number of
students flagged concerns relating to
experiencing discrimination while abroad:
“You never really know what they think about
racism or migrants abroad.”
I am bisexual myself. Then also being non-white …
discrimination remains something I remain afraid of and you never
know what it will be like for someone else. You never know
how people look at you.”
I also notice that (some) countries are very committed to letting people be who they want to be. And that may not be the case in many other countries. That also scares me. It has happened a few times that people sent me away when it became known that I had a diagnosis of ASD.
There are some countries I would
avoid because of how they treat women. For me it was really scary
because there really is a lot of papers and it’s hard to fill
it all correctly and scan it and then upload it to the right place and sign
it all… mentally it’s really keeping you from even getting into it.

104 Student and Staff Perspectives on Diversity and Inclusion
Across all groups, students were keen
for financial support. Students wanted
a scholarship which would cover the
essentials such as accommodation and
food. Students also discussed needing
information about the opportunity to work
while abroad, which would help support
their budget and make the trip more
financially viable. Information on visas and
right to work would therefore be helpful.
More specifically, students were interested
in cost-of-living information. Students
were keen to have in advance information
relating to rental costs and other essential
costs such as food and travel. In addition to
this, they wanted information about opening
bank accounts, and general financial
for example, that in the international office
people speak in English”. Students were
keen for support in navigating the process
of applying to go abroad. They felt this
would make the process easier but also
set the right expectations with the student.
Students wanted clear deadlines in the
application process.
Students wanted the university to provide
a list of partner institutions (including
research centers, laboratories), traineeship
placements and work experience options
to help understand their different choices.
Students wanted information about the
courses available, how credits would be
transferred, costs involved, information
about the destination. They wanted the
information in one place, so it was easy to
access. They also wanted the information
to be shared via social media channels.
Students would also welcome faculty
presentations on the options to go abroad.
One student noted that their university did
a lot of promotion for study abroad but
that the information they needed was not
available.
In my opinion people often don’t know how to choose and
don’t even know all the possible criteria because they simply have
no experience with that.
You should be able to pay for the necessities with
the scholarship like food and accommodation. Enough
that even students without support from their family
could go abroad.”
“It is nice to have the scholarship, but it would be
useful to have the information about the cost of living in the
chosen country to get an idea how much the scholarship would cover and how much you can do
with it - would you need extra money from home or would you
need to look for a job”.

105Student Perspective
the ambassadors spoke to their challenges
while abroad and how they resolved these.
Students were really keen to have support
while they were abroad. They wanted a
contact in country that could help them
in emergencies but also support from
their home university. Students felt it
was important that the support extend
to “emotional support” where the host
would check in on their wellbeing during
the mobility period. This was particularly
important “in the first few weeks”. It
was important for students that support
from the home university was available,
particularly for those students’ additional
needs or to ensure reasonable adjustments
were in place.
Students were keen for there to be medical
support available to them, and for the
host university to support student health.
They were keen to have more information
and guidance about health insurance.
Students wanted the support that was
available to them at their home institution
to be available at their host (for example.
interpreter for hearing impaired students).
Students would like access to a counsellor,
as they were concerned about both their
mental and physical health.
management while abroad.
Students suggested establishing a buddy
scheme, which would link them with a
local student who could show them around
and help them to adapt to the new study
process, the new university, and the new
city. Students felt that buddies "provide
information that you cannot find on the
internet.” This was particularly important at
the start of the mobility programme when
the student is beginning to navigate the
new environment. There was a suggestion
that international student clubs could
support buddy schemes and take on a
mentoring role.
There was interest in hearing more
from former exchange students before
going abroad as they "know the unknown
situation”. Students would like these to
be in-person meetings or events with the
opportunity to hear from the ambassadors
about their experience and to ask
questions. As above, it was important that
Maybe they would need to talk to a professional
to overcome some fears and uncertainties, to adapt
and come back home. Maybe it’d be good if there was a well-being
officer… the person would help with the specific need
of the person abroad.
A helpful person that would show me around as a newcomer in a place I do not know, who shows how everything works at the host university.

106 Student and Staff Perspectives on Diversity and Inclusion
Students expressed an interest in
participating in mobility with other students
from the home university, which would
provide in-country support and ensure the
student did not feel lonely. For students
happy to go abroad independently, they
were also keen to be networked with other
students at their home university that
were going to the same host university,
city, or country. Students suggested that
short group programs “for example, going
abroad for a week or two with study-field
classmates” would also be helpful.
If there’s forty people in our grade then why
not to do a workshop for two weeks… we’d have our
classmates there and have the same goal.

107Student Perspective

Staff Perspective
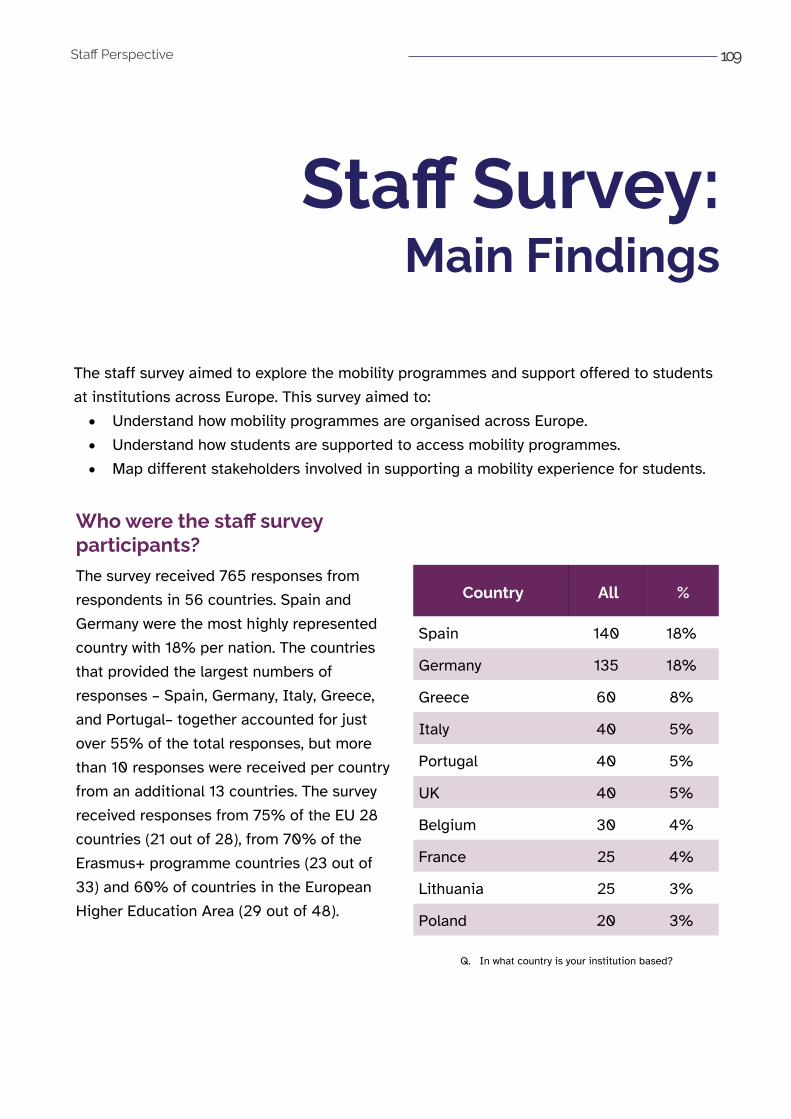
109Staff Perspective
Staff Survey:Main Findings
Country All %
Spain 140 18%
Germany 135 18%
Greece 60 8%
Italy 40 5%
Portugal 40 5%
UK 40 5%
Belgium 30 4%
France 25 4%
Lithuania 25 3%
Poland 20 3%
Q. In what country is your institution based?
Who were the staff survey participants?The survey received 765 responses from
respondents in 56 countries. Spain and
Germany were the most highly represented
country with 18% per nation. The countries
that provided the largest numbers of
responses – Spain, Germany, Italy, Greece,
and Portugal– together accounted for just
over 55% of the total responses, but more
than 10 responses were received per country
from an additional 13 countries. The survey
received responses from 75% of the EU 28
countries (21 out of 28), from 70% of the
Erasmus+ programme countries (23 out of
33) and 60% of countries in the European
Higher Education Area (29 out of 48).
The staff survey aimed to explore the mobility programmes and support offered to students
at institutions across Europe. This survey aimed to:
• Understand how mobility programmes are organised across Europe.
• Understand how students are supported to access mobility programmes.
• Map different stakeholders involved in supporting a mobility experience for students.

110 Student and Staff Perspectives on Diversity and Inclusion
8%
66%
14%
12%
Group 3
Group 2
other
Group 1
Figure 30: Erasmus+ Country groups
The broad geographic reach of the survey
brings diversity of experience and insight
to the findings, which focus on the following
areas of interest:
• Mobility strategy
• Mobility programmes• Funding for mobility programmes• Barriers to mobility programmes• Student support
The European Commission categorises Erasmus+ programmes countries on the basis of living costs52. These are as follows:
• Group 1 - Programme countries with higher living costs (Denmark, Finland, Iceland, Ireland, Luxembourg, Sweden, United Kingdom, Liechtenstein, Norway)
• Group 2 - Programme countries with medium living costs (Austria, Belgium, Germany, France, Italy, Greece, Spain, Cyprus, Netherlands, Malta, Portugal)
• Group 3 - Programme countries with lower living costs (Bulgaria, Croatia, Czech Republic, Estonia, Latvia, Lithuania, Hungary, Poland, Romania, Serbia, Slovakia, Slovenia, North Macedonia, Turkey)
52 Data accessed December 2020
At points throughout this analysis, answers
are considered split by Group, to provide
additional insight on how student mobility is
supported across countries. The majority of
countries represented in the survey (66%)
were Group 2 countries.
Mobility strategyOutgoing mobility is included in 93.3% of respondents’ institutions’ strategic plans, the
vast majority of survey responses. Just over a third of respondents (36.5%) confirmed that
where outgoing mobility is included in the institution’s strategic plan or internationalisation
strategy, this also includes specific reference to less advantaged or underrepresented groups
engaging with mobility programmes.

111Staff Perspective
Response All Group 1 Group 2 Group 3
Yes 67% 93% 69% 39%
No 30% 1% 28% 58%
Total 765 65 500 105
Q. Does the institution have a Diversity and Inclusion Strategy?
Student Group All Group 1 Group 2 Group 3
Students from low-income households 71% 81% 70% 66%
Students from rural areas 25% 29% 19% 31%
Students from minority ethnic groups or with a migration background
47% 67% 50% 32%
Students from Roma and Traveller communities 26% 49% 26% 33%
Students who are first in family to go to univer-sity, pioneer students
27% 65% 27% 8%
Students living with disabilities 61% 71% 63% 57%
Students who are care providers, students with dependants, including student parents
40% 68% 41% 36%
Students with religious beliefs 7% 14% 6% 9%
LGBT+ students 17% 32% 14% 18%
Mature students, life-long learners 24% 56% 22% 20%
None of the above 7% 5% 6% 11%
Total 765 65 500 105
Q. Which students would you classify as being from less advantaged backgrounds or underrepresented groups at your institution?
Two thirds of respondents (67%) reported that their institution had a Diversity and Inclusion
Strategy. This rose to 93% for respondents from Group 1 countries and dropped to 39% for
institutions in Group 3 countries.

112 Student and Staff Perspectives on Diversity and Inclusion
48%
19%
11%14%
2%
16%
Inst
itut
iona
l
Facu
lty/S
choo
l
Dep
artm
ent
Pro
gra
mm
e
Oth
er
N/A
Figure 31: At what level are targets set? Q. If you do have a target, at what level is this target set? (n = 765)
Figure 31: At what level are targets set? Q. If you do have a target, at what
level is this target set? (n = 765)
71% of survey respondents would classify
students from low-income households as
well as students living with disabilities
(61%) to be from a less advantaged or
underrepresented group.
There was a considerable difference
in which student demographics were
recognised across Group 1, Group 2, and
Group 3 countries.
Mobility Targets
The majority of respondents (82%)
reported measuring the rate of outgoing
mobility at their institution. 70% of
respondents had a numerical target for the
number of students they send abroad from
their institution each year.
When looking across the three groups,
respondents from Group 3 reported having
a target at the highest rate (81%), compared
to 64% for respondents from institutions in
Group 1 countries.
lmost half of respondents with a target
reported having an institutional level target
(48%), and a fifth (19%) reported a faculty or
school level target.
While the majority of respondents’
institutions had set targets for outgoing
mobility, most targets (75%) did not include
reference to specific student groups.
When targets did include reference to
specific student group, these targets focused
on students from low-income households
(12%) or students living with disabilities (9%).

113Staff Perspective
Student Group All
Students from low-income households 12%
Students from rural areas 5%
Students from minority ethnic groups or with a migration background 4%
Students from Roma and Traveller communities <1%
Students who are first in family to go to university, pioneer students 4%
Students living with disabilities 9%
Students who are care providers, students with dependants, including student parents
5%
Students with religious beliefs 1%
LGBT+ students 2%
Mature students, life-long learners 3%
None of the above 75%
Total 765
Q. If you have a target for outgoing mobility participation at your institution, do you have a target for specific student groups?

114 Student and Staff Perspectives on Diversity and Inclusion
For almost half of respondents, less
than 10% of students allocated places
on mobility programmes withdraw from
the process and subsequently do not go
abroad. However, 19% of respondents
reported a dropout rate of over 20%, or 1 in
5 students.
43%
19%
11%
3% 2% 3%
18%
0 – 10% 11 – 20% 21 – 30% 31 – 40% 41 – 50% Over 50% Don't know
Figure 32: Drop-out rates of approved students Q. What percentage of students who are allocated a place on a mobility programme withdraw from the process and subsequently do not go abroad? (n = 765)
12%
15%
17%
22%
24%
25%
32%
36%
51%
Health & Safety Office
Health & Counselling Services
No collaborationwith other departments
Widening Participation/ Outreach team
Disability Team
Student Recruitment
Other department
Student’s Union &other student organisations
Student Services
Figure 33: Collaboration with other departments Q. Does the Outgoing Mobility team collaborate with any other departments when delivering mobility programmes? (n = 765)
Withdrawal Rate
Collaboration for Mobility promotionHalf of respondents (51%) reported
that Outgoing Mobility Teams
work with the institution’s Student
Services department to deliver
mobility programmes. A third of
respondents also reported working
with student organisations (36%)
and other departments (32%).
Respondents from Group 1
institutions reported collaboration
with other teams at a higher rate
than the respondents from Group 2
and 3, namely the Disability Team
(60.3%) and the Health and Safety
Office (49.2%).

115Staff Perspective
Programmes
Respondents reported offering a wide range of different mobility opportunities and
programmes to students, the most popular being Erasmus+ programmes (85%, 82%), other
forms of student exchange (61%), and short-term programmes (49%). Group 1 institutions
reported delivering short-term mobility programmes (78%) at a higher rate than Group 2
(44%) and Group 3 institutions (42%).
Subject Discipline
Respondents reported that mobility programmes are offered by institutions across a
range of academic disciplines. Two thirds of institutions offered mobility to Economic and
Business Sciences students (62%), and just over half offered programmes for Engineering
(58%), Humanities (55%) and Social Sciences (57%). However, only a third of respondents
offered programmes for Medical Sciences students (32.9%).
10%
19%
21%
22%
41%
48%
61%
82%
85%
Volunteering programme
International full degree
Other mobility programme
Erasmus Mundus
Other traineeship
Short mobility programme
Other study exchange
Erasmus+ traineeship
Erasmus+ studies
Figure 34: Mobility programmes offered by the university Q. What type of outgoing mobility programmes do you offer? (n = 765)

116 Student and Staff Perspectives on Diversity and Inclusion
Universities offer a range of mobility durations for students, with everything from short-term
(less than four weeks) to a full academic year abroad. The most reported duration was one
semester, which 86% of respondents reported delivering. There was a difference in the
duration of programmes offered across the different country groups, mainly for the short-
term durations of less than four weeks.
Funding for Mobility Programmes
The majority of respondents (91%) use Erasmus+ grant funding to support outgoing mobility
programmes at their institutions. Just over half (56%) reported that students’ self-fund.
Just under half of respondents (43%) reported offering institutional financial support. 38%
of respondents reported using partner or other stakeholder grants to fund programmes. A
higher percentage of responders from Group 1 (76%) reported that students self-fund their
programmes, compared to 46% for Group 3 respondents.
Almost three quarters of respondents (72%) reported not offering institutional funding to
Less than 4 weeks
More than 4 weeks but less than a semester
One semester
More than one semester
Group 1
Group 2
Group 3
Total
87%69%70%
67%
94%87%
93%86%
51%44%
40%44%
52%27%28%
31%
Figure 35: Mobility duration offered by university Q. What duration of mobility experience do you offer at your institution? (n = 765)

117Staff Perspective
students. 26% of respondents offered targeted funding to students, while 25% offered
funding to all students. Group 1 respondents reported providing targeted funding at a higher
rate (44%) than Group 2 and Group 3 (24%, 18%).
19%
38%
43%
56%
91%
Host institutionfinancial support
Other partner orstakeholder grant
Home institutionfinancial support
Students self-fund
Erasmus+ grant
Figure 36: Mobility fundingQ. How are outgoing mobility programmes funded at your institution? (n = 765)
45%
22%
32%
Group 1
24%
26%
48%
Group 2
18%
20%
59%
Group 3
Figure 37: internal funds for studentsQ. Are there any internal funds available to students, and if so, are these targeted? (n = 765)
Yes,targeted
Yes, not targeted
No internal funds

118 Student and Staff Perspectives on Diversity and Inclusion
Where targeted funding was available, 25% of respondents reported that funding was
reserved for students from low-income households, and 12% reported providing funding for
students living with disabilities. When looking across the different nation groupings, 19% of
Group 1 countries reported providing funding for first generation students to go abroad. In
addition, 14% of respondents from this group reported funding for students from minority
ethnic groups or students with a migration background, including students from Roma or
Traveller communities (10%). 16% of Group 1 respondents provided grants for students who
are care providers, and 14% provided grants for mature students. For Group 3 institutions,
10% of respondents reported providing funding for students from rural areas.
Student Group All Group 1 Group 2 Group 3
Students from low-income households 71% 40% 21% 23%
Students from rural areas 5% 3% 2% 10%
Students from minority ethnic groups or with a migration background
6% 14% 3% 6%
Students from Roma and Traveller communities 2% 10% 1% 3%
Students who are first in family to go to univer-sity, pioneer students
4% 19% 1% 1%
Students living with disabilities 12% 16% 10% 18%
Students who are care providers, students with dependants, including student parents
6% 16% 5% 4%
Students with religious beliefs 1% 3% <1% 1%
LGBT+ students 2% 6% 1% 1%
Mature students, life-long learners 3% 14% 1% 1%
None of the above 53% 41% 55% 62%
Total 765 65 500 105
Q. If you offer targeted funds to students, which groups are these targeted at?

119Staff Perspective
6%
24%
40%
21%
6%
3%
12%
32%
36%
11%
4%4%
53%
31%
6%
2%
7%
18%
29% 29%
10%
5%
€100 - €300 per month €301 - €500 per month €501 - €700 per month €701 - €900 per month €901 - €1100 per month Over €1101 per month
Group 1
Group 2
Group 3
Total
Figure 38: Cost of living per countryQ. What is the average cost of living needed for a student in your area? (n = 765)
Respondents reported a range of different costs of living for their nation. For half of
respondents (58%) costs of living was between €501 and €900 per month. When reviewing
respondents by nation, we found Group 1 respondents reporting a higher cost of living when
compared to Group 2 and 3.

120 Student and Staff Perspectives on Diversity and Inclusion
75% of respondents agreed that insufficient
funding to support a period abroad was
a barrier to students. In two thirds of
respondents (67%) felt that students did
not go abroad for personal reasons. Just
over half of respondents (55%) reported
that students have no interest in going
abroad. Concerns about the impact that
a period abroad might have on academic
achievement were also cited.
For respondents from Group 1 countries, a
higher percentage (63%) reported a lack
of flexibility in degree programme as a
barrier, with 1 in 4 (25%) strongly agreeing.
Over half the respondents (57%) from
Barriers to Mobility Programmes
1%
5%
7%
7%
10%
11%
12%
21%
35%
8%
17%
28%
26%
41%
30%
42%
46%
39%
21%
17%
29%
22%
21%
25%
24%
27%
13%
40%
34%
22%
27%
19%
23%
12%
3%
8%
26%
24%
12%
16%
9%
9%
8%
2%
3%
Fear of discrimina�on while abroad
Lack of recogni�on for �me spent abroad
Unable or unwilling toextend degree programme
Lack of knowledgeof the opportuni�es to go abroad
Concerns about impact period abroad will have on academic achievement
Lack of flexibility in degree programme
No interestin going abroad
Personal reasons
Insufficient fundingto support period abroad
Stronglyagree Agree Neutral Disagree
StronglyDisagree
Figure 39: HEI’s vision on barriers to mobility for students Q. In your opinion, what are the main reasons for students not going abroad? (n = 765)
Group 1 also cited a lack of knowledge of
opportunities as a barrier, with 18% strongly
agreeing. Group 3 respondents reported
students having no interest in going abroad
at a higher rate (61%), with a fifth of
respondents (21%) strongly agreeing.

121Staff Perspective
There was some variation across
respondents from different country groups:
half of respondents (51%) in Group 1
countries offer a social event for students,
and a third (31%) of respondents from
Group 3 countries support students via an
event with a student organisation.
Student Support
Outgoing Students
Over two-thirds of respondents (71%)
reported offering meetings with
international officers as part of their pre-
departure support package for students. In
addition, 63% offered a group information
session, and 59% offered a briefing event.
2%
5%
14%
21%
51%
43%
87%
84%
70%
6%
10%
16%
20%
24%
38%
58%
63%
71%
2%
10%
30%
22%
28%
46%
51%
68%
86%
6%
9%
17%
19%
27%
38%
59%
63%
71%
Do not offer any pre-departure activities
Skype session with international officer
Event delivered by student organisation
Other activity
Social event
Event with mobility alumni
Briefing event
Group information session
Meeting with international officer
Group 1
Group 2
Group 3
Total
Figure 40: Pre-departure support for outgoing studentsQ. Do you offer any pre-departure activities at your institution for outgoing mobility students? (n = 765)

122 Student and Staff Perspectives on Diversity and Inclusion
There was some variation across
respondents from different country groups,
most notably that respondents from Group
3 reported offering targeted advice to
students from low-income households and
students living with disabilities at a higher
rate than Group 1 and 2 respondents.
59% of respondents do not offer
targeted advice to less advantaged or
underrepresented groups prior to their
mobility experience. The student groups
who do receive targeted advice are
students from low-income households
(23%) and students living with disabilities
(28%). In addition, around 1 in 10
respondents (11%) offer targeted advice to
student carers.
Student Group Total Group 1 Group 2 Group 3
Students from low-income households 23% 14% 18% 33%
Students from rural areas 8% 0% 5% 11%
Students from minority ethnic groups or with a migration background
8% 6% 7% 8%
Students from Roma and Traveller communities 3% 3% 3% 4%
Students who are first in family to go to university, pioneer students
6% 10% 5% 4%
Students living with disabilities 28% 24% 27% 38%
Students who are care providers, students with dependants, including student parents
11% 13% 12% 4%
Students with religious beliefs 3% 3% 2% 5%
LGBT+ students 4% 11% 4% 2%
Mature students, life-long learners 5% 6% 4% 2%
No target audience 59% 68% 61% 51%
Total 765 65 500 105
Q. Do you offer targeted guidance or advice for less advantaged or underrepresented groups?

123Staff Perspective
For a third of respondents (36%) no other
departments are involved in providing
support for students while they are abroad.
For just over a quarter of institutions (27%)
Students Services teams support mobile
students while they are abroad, and for
29% of respondents another department
supports students. In addition, 44% of
Group 1 respondents reported that the
Disability Team provides mobile student
support and 40% reported that the Health
and Counselling Services are available to
students while they are abroad.
77% of respondents reported sending
regular emails to students while they are
abroad. In addition, 60% of respondents
provide students with a key contact
while they are abroad. A fifth (20%) of
respondents use staff visits to support
students although this rose of almost a
third for Group 1 (30%) and Group 3 (30%)
respondents. In addition, a third (37%) of
Group 1 respondents schedule check-in
sessions as part of their ongoing support
to mobile students.
Response Total Group 1 Group 2 Group 3
Key contact 60% 76% 56% 61%
Check-in sessions 15% 37% 13% 11%
Programme networks 14% 10% 12% 11%
Alumni links 14% 11% 13% 11%
Other mobile student links 14% 19% 13% 12%
Skype meetings 13% 18% 15% 8%
Staff visits 20% 30% 18% 30%
Regular emails 77% 79% 80% 82%
Other activity 14% 14% 13% 16%
Total 765 65 500 105
Q. How does the university support students while they are abroad?
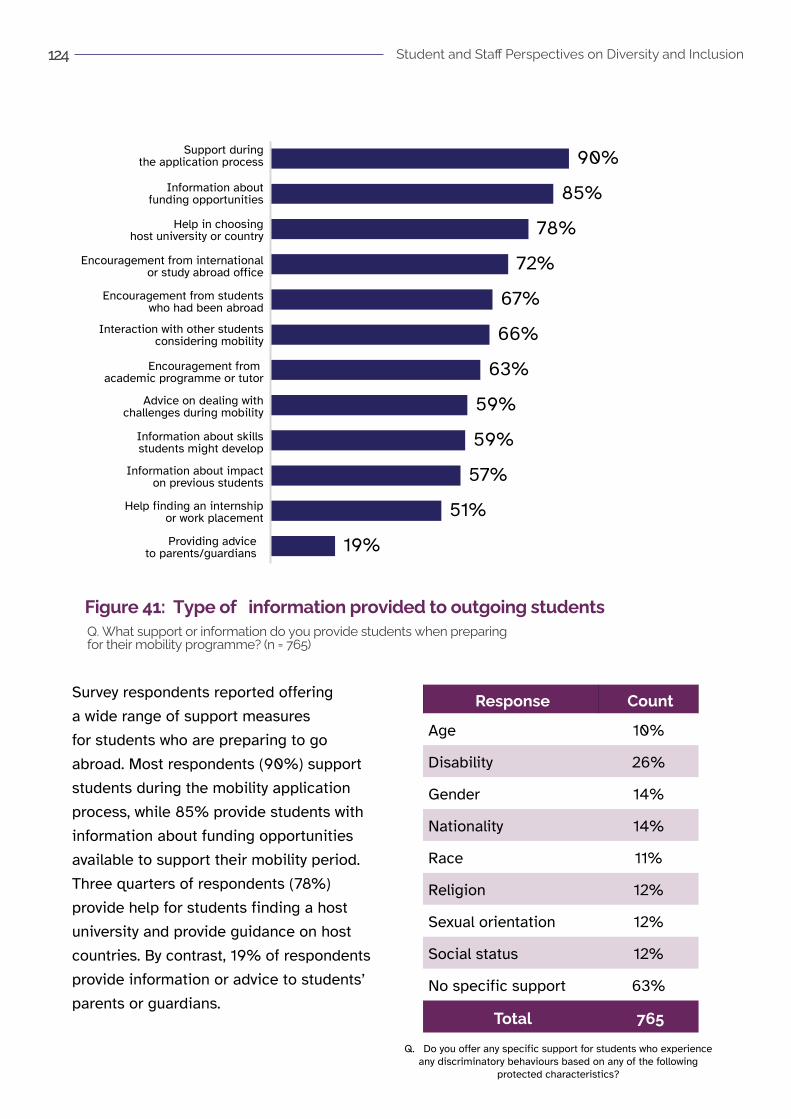
124 Student and Staff Perspectives on Diversity and Inclusion
Survey respondents reported offering
a wide range of support measures
for students who are preparing to go
abroad. Most respondents (90%) support
students during the mobility application
process, while 85% provide students with
information about funding opportunities
available to support their mobility period.
Three quarters of respondents (78%)
provide help for students finding a host
university and provide guidance on host
countries. By contrast, 19% of respondents
provide information or advice to students’
parents or guardians.
19%
51%
57%
59%
59%
63%
66%
67%
72%
78%
85%
90%
Providing adviceto parents/guardians
Help finding an internshipor work placement
Information about impacton previous students
Information about skillsstudents might develop
Advice on dealing withchallenges during mobility
Encouragement from academic programme or tutor
Interaction with other studentsconsidering mobility
Encouragement from studentswho had been abroad
Encouragement from internationalor study abroad office
Help in choosinghost university or country
Information aboutfunding opportunities
Support duringthe application process
Figure 41: Type of information provided to outgoing studentsQ. What support or information do you provide students when preparing for their mobility programme? (n = 765)
Response Count
Age 10%
Disability 26%
Gender 14%
Nationality 14%
Race 11%
Religion 12%
Sexual orientation 12%
Social status 12%
No specific support 63%
Total 765
Q. Do you offer any specific support for students who experience any discriminatory behaviours based on any of the following
protected characteristics?

125Staff Perspective
Two thirds of respondents (63%) do not offer any specific support for students who
experience discriminatory behaviours while they are abroad. However, 26% of respondents
offer support to students who experience disability discrimination. On average, 1 in 10
respondents provide specific support to students who encounter discrimination on other
grounds including Age, Gender, Nationality, Race, Religion, Sexual Orientation and Social
Status.
Incoming Students
The majority (86%) of respondents provide a welcome meeting for incoming students to
their institution. In addition, two-thirds (75%) offer a meeting with an international officer
at the university. 71% of respondents also provide a student ambassador or buddy scheme
to help connect incoming students with local students. Only 4% of respondents did not
offer any formal activities for incoming mobility students.
Student Group Count Group 1 Group 2 Group 3
Students from low-income households 13% 2% 11% 12%
Students from rural areas 6% 0% 3% 7%
Students from minority ethnic groups or with a migration background
9% 5% 9% 10%
Students from Roma and Traveller communities 2% 0% 3% 0%
Students who are first in family to go to university, pioneer students
4% 2% 3% 3%
Students living with disabilities 25% 19% 26% 29%
Students who are care providers, students with dependants, including student parents
8% 5% 10% 2%
Students with religious beliefs 5% 6% 4% 5%
LGBT+ students 4% 3% 4% 3%
Mature students, life-long learners 4% 3% 4% 3%
No target audience 64% 76% 65% 60%
Total 765 65 500 105
Q. Do you offer targeted guidance or advice for less advantaged or underrepresented groups?

126 Student and Staff Perspectives on Diversity and Inclusion
64% of respondents do not offer targeted advice to incoming students from less
advantaged or underrepresented groups. However, a quarter of respondents provide
guidance for students living with disabilities (25%). In addition, 13% offer targeted advice to
students from low-income households.
There was some variation across respondents from different country groups, most notably
that respondents from Group 2 and 3 reported offering targeted advice to students from
low-income households and students living with disabilities at a higher rate than Group 1
respondents.
The majority of respondents to this survey agreed or strongly agreed that international
students had equal access to resources (82%) and opportunities (75%) when compared
to local students. 78% of respondents agreed that measures were in place to support
international students in their academic work. By contrast, 6% of respondents disagreed
44%
35%
32%
22%
38%
40%
46%
28%
8%
13%
15%
26%
5%
8%
3%
10%
1%
1%
1%
10%
International students haveequal access to resources
compared to local students
International students haveequal access to opportunities
compared to local students
Measures are in place to supportinternational students in their academic work
Insensitive, degrading or insulting remarks made about international students
are addressed through a university process
Stronglyagree Agree Neutral Disagree
StronglyDisagree
Figure 42: Inclusion & Equality of international students Q. Please read the following statements and rate how much you agree or disagree that they reflect the expe-rience of being an international student at your university. (n = 765)

127Staff Perspective
that students had equal access to resources, with almost 1 in 10 (9%) reporting that
international students did not have equal access to opportunities compared to local
students.
Half of respondents (50%) agreed or strongly agreed that insensitive, degrading or insulting
remarks made about international students are addressed through a university process.
By contrast, 20%, or 1 in 5 respondents, disagreed that insensitive, degrading or insulting
remarks made about international students were addressed through a university process.
Just over half of respondents (55%) do not offer any specific support for incoming students
who experience discriminatory behaviours. However, a third of respondents (33%) offer
support to students who experience disability discrimination. On average, one quarter of
respondents provide specific support to students who encounter discrimination on the
grounds of Gender, Nationality, and Race, and on average one fifth of respondents provide
specific support to students who encounter discrimination on the grounds of Religion and
Sexual Orientation.
17%
33%
26%
23%25%
21%23%
18%
Ag
e
Dis
abili
ty
Gen
der
Nat
iona
lity
Rac
e/Et
hnic
ity
Rel
igio
n
Sex
ual o
rien
tati
on
Soc
ial s
tatu
s
55%of universities
do not offer support for students who
encountereddiscriminatory behaviour
45%offer support for students encountering discriminatorybehaviour
Figure 43: Support for students who encounter discriminationQ. Do you offer any specific support for students who experience any discriminatory behaviours based on any of the following protected characteristics? (n = 765)

Conclusion

129Conclusion
students from minority ethnic groups or
with a migration background as students
from a disadvantaged background, pioneer
students (27%) students from rural areas
(27%).
As this report shows (Page 86-87),
intersectionality of characteristics
decreases participation, and a lack
of certain demographics being
addressed in strategic plans, both in
“Diversity and Inclusion Strategies” and
“Internationalisation Strategies” prevents
institutions from strategic reflections on
the intersectional effects active in the local
environment of the institution.
Mobility ProgrammesThe Erasmus+ programme remains one
of the most popular programmes for
student mobility, with a majority (78%)
of respondents taking part in mobility
opportunities through the Erasmus+
programme. This is significantly more
than the EU 27 average recorded in the
European Education and Training Monitor
2020 that indicates that approximately
50% of credit mobility across Europe is
undertaken through Erasmus+ programmes.
This difference can be explained both
by the targeting done through the
Erasmus Student Network, but also the
profile of countries responding, with
higher participation to the survey with
students coming from countries where
the participation rate to the Erasmus+
programme is higher.
International student mobility is well
embedded in the institutional strategies
across Europe, with 93% of institutions
including outgoing student mobility in the
institutional strategic plans, showcasing
that student mobility is acknowledged by
institutions as a key feature in an overall
student experience for students enrolled in
HEI’s. Two thirds of institutions reportedly
have a “Diversity and Inclusion Strategy”,
with vast differences among nations as in
Group 1 countries, ranging from 93% in
Group 1 to 39% of institutions in Group 3.
However, only 36, 5% reference the desire
to widen participation in student mobility by
students from less advantaged backgrounds
and underrepresented groups in their
strategic plans to engage with mobility
programmes.
This can partially explain why there is a
lower uptake of international student
mobility in students from less-advantaged
groups. The intersection between strategies
focusing on Internationalisation and
Diversity and Inclusion, is key to ensure
targets are set widen participation of
underrepresented groups in mobility
programmes.
This is further compounded by the fact
that not all student groups with fewer
opportunities as defined in the Erasmus+
Programme guide are considered less-
advantaged at institutional level, ranging
from students from low-income households
at 71% and students living with a disability
at 61%, to 47% of institutions recognising

130 Student and Staff Perspectives on Diversity and Inclusion
desire to participate is not necessarily the
biggest barrier to participation.
Barriers to mobilityStudents experience three types of barriers
to participation in mobility experiences:
Institutional, Environmental and Attitudinal.
Given that the both the student and staff
survey were opinion surveys, the answers
tackle the perceptions around such barriers.
Institutional barriers are barriers that
reflect the programmes that are being
offered and the regulations that coincide
with these programmes that may impact
the access of specific student groups
to mobility opportunities. The biggest
institutional barriers are related to funding;
82% of mobile students and 81% of non-
mobile students express that the need
to advance initial costs for their mobility
related to travel, accommodation (rent
and deposits) and insurance, is a barrier
to participation, as they would need to be
able to access sufficient cash flow to
cover these initial costs. This indicates
that students fear that the mobility funding
will not be received on time to cover these
costs in time. 45% of mobile students
agree that insufficient funding is available,
while 57% of non-mobile students indicate
that this is a barrier for them. When it
comes to other institutional barriers, we
see that only 17% of mobile students
consider the lack of credit recognition of
their mobility a problem for their exchange,
which is echoed by 18% of their non-
The responses received from non-mobile
students indicate that the Erasmus+
programme has a high top-of-mind
awareness among students, as 63% of
respondents indicated an interest to take
part in Erasmus+ Higher Education Study
Mobility, followed by 53% of respondents
showing interest in Erasmus+ Higher
Education Traineeship Mobility. The interest
of non-mobile students to take part in
short-term mobility is high, as 48% of
students indicate an interest in this type of
mobility programme. Students from lower
socio-economic backgrounds and students
from ethnic minority backgrounds tend
to participate more in short term mobility
programmes as this makes participation
more accessible.
With 49% of university staff members
indicating they offer short-term mobility
programmes, we see that participation of
short-term mobility programmes is low; only
3% of students take part in this mobility
type. This might indicate that while on
offer, the number of available spots and
the awareness on this type of mobility
opportunities among students is low. With
23% of non-mobile respondents interested
in short-term mobilities, we can see that
there is interest in short term mobility
types, however, the most preferred duration
is still one semester (43%) or more than
one semester (33%) together with only 2%
of non-mobile students indicating they are
not interested in studying abroad during
their degree, this might indicate that their

131Conclusion
and non-mobile (48%), However next to
financial considerations, there are also
other considerations that are experienced
as barriers, such as the worry to find
accommodation while abroad (49% for
both mobile and non-mobile students) or
visa application processes for mobilities
not taking place within the EU. A majority
of students do not report concerns about
personal safety abroad, however with
72% of mobile respondents indicating no
concerns for personal safety, the reality
is higher than the expected fear, as 51%
of non-mobile students reportedly had no
concerns for personal safety.
An important note to make is that this
questionnaire started before the COVID-19
crisis, which might impact perception on
personal safety, as health concerns were
addressed more explicitly during the focus
groups that took place afterwards.
Attitudinal barriers tackle the belief
system and emotions around the topic of
mobility opportunities, to see how they
influence their participation rates. In
the case of student mobility we wanted
to know if students have concerns or
personal opinions that might impact their
mobility participation. 85% of non-mobile
participants indicated to be interested in
participating in student mobility abroad,
which is in stark contrast with the fact
that 55% of institutions say students
do not participate because of a lack of
interest. Overall both mobile and non-
mobile students, while 67% of students
disagree that this is a barrier. This is an
indication that the past work on automatic
recognition for credit has had an impact on
the student’s perception. A majority of both
mobile students (53%) and non-mobile
students (45%) consider that their degree
allows for participation in mobility, whereas
25% of mobile students and 28% of non-
mobile students indicate that their degree
structure does not allow for participation in
mobility. This might be highly dependent
on the type of discipline that students
follow, as the answers from our staff survey
indicate that students with state-regulated
degrees such as medicine or pharmacy
experience this more as a barrier, given
that participation rates in these sectors are
lower.
Environmental barriers reflect on
environmental and societal factors that
influence the person’s decisions to take
part in a mobility. Environmental barriers
also reflect on the financial impact of
mobility on the overall living conditions
of the student, indicating the impact a
mobility participation has on their personal
situations.
While both mobile (56%) and non-mobile
students (71%) indicated that the total cost
of mobility is a barrier to participation,
there is a clear indicator that this barrier is
more persistent for non-mobile students.
The loss of income through student
jobs while abroad is also indicated as
a major barriers by both mobile (41%)

132 Student and Staff Perspectives on Diversity and Inclusion
are connected to their social context and
living environment, as well as the access
to mobility opportunities and the funding
available at institutional level.
Financial barriers and support
The cost of a mobility period and the
available funding connected to this remains
one of the main barriers addressed by
students. 60% of mobile respondents
indicated that they had less than 50% of
the total cost covered by a scholarship or
grant funding. Students from lower income
households tend to have a lower living cost
on exchange, as 68% of them indicate to
spend up to 700 EUR while on exchange,
while this is the case for 56% of students of
higher income households.
Our results also show that students from
lower economic backgrounds as well as
minority ethnicities tend to lean more
on available grant structures in order to
cover a larger portion of their expenses, as
they indicate that a larger portion of their
expenses are covered by the grant, ensuring
that they can cover more of their costs with
the external funding awarded to them.
With 67% of respondents indicating
that their overall living cost abroad was
above 501 EUR, it showcases that the
current grant levels offered in Erasmus+
are insufficient to cover more than half
of their expenses, while 53% of non-
mobile students indicated they would need
scholarship or grant funding to cover the
majority (75%-100%) to be covered, this
mobile students respondents’ perceptions
or relatively positive on elements related
to attitudinal barriers. The biggest barrier
addressed by students is that 34% of
mobile students were worried about feeling
lonely or isolated while abroad, while
this is the case for 29% of non-mobile
students. Only 10% of mobile students
experienced a fear to leave family and
friends behind, while 17% of non-mobile
students expressed this fear. Overall non-
mobile respondents seem to be convinced
of the benefits of mobility on personal
development (96%), employment prospects
(88%) and academic achievement (80%)
which is another indicator that they
perceive mobility as a positive experience,
and that these are not the barriers that
prevent them from participating.
In certain cases a discrepancy between
the perceptions of students and staff
can be noticed. As the perceived barriers
are based on the personal perceptions
both groups have on the matter, whereas
institutions might believe sufficient
support is offered for the diverse groups,
lack of access to information as well
as self-imposed barriers might impact
the participation rates of students of
underrepresented groups. When looking
at the overall personal perceptions of
students on barriers to participation in
mobility, it is clear that students have
an overall positive attitude towards the
impact of a study abroad experience. The
majority of concerns raised by students

133Conclusion
to note that over half of respondents did
not access social events on the topic of
international student mobility, or student
organised mobility events to interact
with mobility alumni, something that was
highlighted by non-mobile students that
they would like to participate in this type
of events. Students experience learning
in different ways and are convinced by a
diverse range of motivating factors and
stakeholders that can offer encouragement
and inspiration, from university staff to
fellow students or future employers. It
is therefore important that institutions
consider diversifying their methods to
reach out to their student population.
The majority of mobile respondents
had positive experiences while abroad,
as only 10% of respondents felt that they
were treated differently or unfairly at their
host university and 15% felt that they did
not have equal access to resources and
opportunities compared to home students
or that they could not address academic
issues with their professors.
Although the majority of students did
not feel treated unfairly or negatively by
students from the host institutions (62%),
professors (67%) or staff from the host
university (71), it is important to note
that there is a group of students that had
negative experiences abroad, with a quarter
of respondents reported experience some
form of discrimination while abroad on a
mobility programme. Different forms of
discrimination were experienced more
increases to 70% for students from low-
income backgrounds and 69% of students
from minority ethnic groups.
According to the Erasmus+ Annual
report 201753, only 7% of students from
disadvantaged backgrounds received an
additional top-up, while according to the
answers from the staff survey, we see that
25% of universities offer targeted support
for students from low-income households.
Funding is also one of the issues touched
upon in the reflections of the students on
information provision; 94% of students
indicated that they find information on
available funding useful when preparing for
a mobility programme.
Student GuidanceWith 88% of students indicating they
would find support for the application
process useful, students indicated that
the most useful form of support accessed
before departure was direct meetings
with the International relations officer,
followed by group information sessions.
While almost all institutions indicated that
they offered information on the funding
opportunities (85%) and support with the
application process (90), a significant part
of the student respondents indicated a
lack of access to information on mobility
opportunities 31%) and practical (34%) or
academic (33%) support. It is important
53 Erasmus_ Annual report 2017, 2019, European Commission

134 Student and Staff Perspectives on Diversity and Inclusion
in line with the Erasmus Impact Study54
findings that students find a job quicker
after graduation.
Overall students report an increased
interest in international affairs and
further study or work abroad and a boost
in confidence in their foreign language
proficiency and their ability to work
in international teams, a pattern that
holds across demographics, with a more
pronounced impact reported by students
from ethnic minorities and first-generation
students. This indicates that first-
generation students and students from an
ethnic minority group report higher levels of
perceived impact of mobility participation.
In general this can indicate that students
that have participated in a mobility
opportunity experience a boost of self-
confidence and a new perspective on their
future personal and career development
that might help them overcome some of
the barriers, sometimes self-imposed they
experience in life.
54 Erasmus+ Higher Education Impact study, 2019, European Commission
commonly by respondents from some
of the target groups; as almost a third
of respondents from ethnic minority
backgrounds or students from low income
background reported experiencing
discrimination based on their background.
More striking is that when seeking
support, the majority of students reach
out to their personal support systems,
where a smaller group accesses support
through host or home university. Although
the majority of institutions indicate that
measures are in place to ensure equal
access to resources or academic support,
only half of the institutions indicate that a
university process is in place to address
discrimination, whereas the majority
of university staff do not offer targeted
guidance or advice for students of
underrepresented groups, combined with
the majority of institutions not offering not
offering any specific support for incoming
students experiencing discriminatory
behaviour, the lack of offer and signposting
might indicate why students rarely access
support.
Mobility impactThe positive experience during exchange
is replicated after the exchange as well;
the majority of students report no negative
impact on their academic performance.
Mobile students report a faster attainment
of employment after graduation, which is

135Conclusion

Erasmus Student Network, Brussels 2021