Embed Size (px)
Citation preview

May the definition of pollen season influence aerobiological results?
Victoria Jato1,*, F.J. Rodrıguez-Rajo1, P. Alcazar2, P. De Nuntiis3, C. Galan2 &P. Mandrioli31Department of Plant Biology and Soil Sciences, University of Vigo, Campus As Lagoas, E-32004, Ourense,Spain; 2Department of Plant Biology, University of Cordoba, Campus de Rabanales, E-14071, Cordoba,Spain; 3Institute of Atmospheric Sciences and Climate (ISAC), I-40129, Bologna, Italy; (*Author forcorrespondence: Phone: +349-88-387054; Fax: +349-88-387001; E-mail: [email protected])
Received 22 December 2004; accepted 10 October 2005
Key words: atmospheric pollen, Olea, Platanus, Poaceae, pollen season, Quercus
Abstract
This paper reviews the terms and major criteria used to define and limit the pollen season. Pollen data fromCordoba (Spain), Ourense (Spain) and Bologna (Italy) were used to ascertain the extent to which aero-biological results and pollen curves are modified by the criteria selected. Results were analysed usingSpearman�s correlation test. Phenological observations were also used to determine synchronization be-tween pollen curves and plant phenology. The criteria for limiting the shortest and longest pollen seasonperiods, as well as the earliest and latest start and end dates, varied according to the city and the taxonunder study; in many cases, results for a given taxon also depended on the year. The smallest differenceswere obtained for Platanus and the greatest for Poaceae.
1. Introduction
The annual pollen curve of a given taxon chartsdaily mean pollen concentrations over the year.Aerobiological studies often use only pollen datafrom the period over which most of the annualtotal pollen count is recorded. Various terms areused in the literature to define this period: pollenseason, main pollen season or main pollen period(Makinen, 1977; Nilsson and Persson, 1981), peri-od of maximum pollen production (Gonzalezet al., 1998; Nitiu, 2003), pollination period, polli-nation season, main pollination season, principalpollination period (Lejoly-Gabriel and Leuschner,1983; Jager et al., 1996; Clot, 1998; Comtois,1998; Frenguelli et al., 2002; Syrigon et al., 2003),effective pollen season (Giorato et al., 2000) andatmospheric pollen season (Jato et al., 2002).
This period has been defined in a number ofways. One of these – widely used in the past and
still found today – is the period over which a gi-ven percentage of the total annual pollen countis recorded in the atmosphere (Nilsson and Pers-son, 1981; Andersen 1991; Torben, 1991; Galanet al., 1995). Another definition refers to the peri-od between the first and last day with pollencounts higher or lower than a specific level(Davies and Smith, 1973; Giorato et al., 2000;Clot, 2001; Sanchez-Mesa et al., 2003).
Daily cumulative pollen counts can be repre-sented by a sigmoid curve with two bends, onecorresponding to the start and the other to theend of the main pollination period (Pathirane,1975), representing the percentage of the totalpollen amount including variable amounts(Makinen, 1977). Several authors have definedthe period in terms of the time elapsing between2 days on which specific values or conditionsare registered (Mullenders et al., 1972;Lejoly-Gabriel and Leuschner, 1983; Spieksma
Aerobiologia (2006) 22: 13–25 � Springer 2006DOI 10.1007/s10453-005-9011-x

et al., 1995; Jager et al., 1996; Feher and Jarai-Komlodi, 1997).
In order to develop models for predicting theonset of pollination, various criteria can also beused to select only the pollen-season start-date.The start-date is most commonly taken to be thedate when cumulative average daily pollencounts (accumulated from a specific date accord-ing to the taxon concerned, generally 1 January)reach a given value. For the grasses, these areS50, S75, S100 and S125; for birch, S25. Otherauthors use the first date on which daily averageconcentrations reach either a given value (Daviesand Smith, 1973; Driessen et al., 1989, 1990;Rogers, 1997; Norris Hill, 1998; Newnham, 1999;Clot, 2001), or a given percentage of the annualtotal (Pathirane, 1975; Frenguelli et al., 1991).Finally, the start of the pollen season can be ta-ken as the date from which pollen grains are re-corded on a continuous basis; in this case, arange of criteria are used to determine such data(Clot 1998; Garcıa-Mozo et al., 1999; Jato et al.,2002).
Pollen curves charting airborne pollen fromplants flowering in the vicinity of the pollen-trapare therefore held to represent the timing of flow-ering of these plants. However, pollen-curvebehaviour may be influenced by a number ofother factors. The start-date may, in fact, corre-spond to pollen from earlier-flowering plantselsewhere, subsequently transported over longdistances; some authors therefore exclude thispollen in order to avoid confusion (Dahl andStrandhede, 1996; Porsbjerg et al., 2003). Giventhat this pollen can prompt high counts, calcula-tion of the pollen season may vary considerably,and pollen curves may be substantially modified.Moreover, turbulence may keep wind-dispersedpollen in the air, or resuspend it, after the end offlowering; this can alter the synchronization be-tween flowering dates and pollen curves byincreasing airborne pollen counts even once flow-ering has ended.
Some pollen types include several specieswhose flowering periods occur at different timesof year. In certain cases, two or more clearly sep-arated pollen seasons can be defined; this is trueof Fraxinus angustifolia, which flowers in lateDecember or early January, and F. excelsior,which flowers later in parts of Galicia-northwest-ern Spain (Jato et al., 2004). Depending on local
weather conditions, certain species may flowertwice in the same year; this has been reported forboth Quercus rotundifolia and Q. suber in south-ern Spain, which flower in spring but also, insome years, in the autumn (Gomez-Casero,2003).
It would therefore be useful to determinewhether a single criterion can reasonably be usedto delimit the main period during which pollen ispresent in the air or whether the selection of cri-teria is of necessity governed by pollen type, geo-graphical area or other considerations. Currentaerobiological terminology also requires somestandardization to enable precise definitions thatare readily understood in all quarters.
The aims of this paper were to analyse theterms used in aerobiological literature, with aview to selecting, if possible, the most appropri-ate of these for defining the period in questionand to examine the extent to which aerobiologi-cal results and pollen curves are influenced bythe criteria used to fix the start and end of thepollen season.
2. Materials and methods
In addition to analysing the terms and criteriawidely used to define and limit the pollen season(Mullenders et al., 1972; Davies and Smith, 1973;Pathirane, 1975; Makinen, 1977; Nilsson andPersson, 1981; Lejoly-Gabriel and Leuschner,1983), we have reviewed relevant papers pub-lished in Aerobiologia and Grana since 1990 andin the International Journal of Biometeorologyfrom 2000 in order to examine the most com-monly used terms and criteria. Pollen season wascharacterized by means of ten criteria (Table 1).The selection was made taking into account itsfrequency but also the diversity of definitions,including criteria to select both the start and enddates of pollen season.
The study reported here used data on fivepollen types (Betula, Poaceae, Olea, Platanus andQuercus) from three different areas (Ourense andCordoba in Spain and Bologna in Italy) recordedfrom 2001 to 2003 (Figure 1). Hirst-type LanzoniVPPS 2000 volumetric samplers were used to col-lect airborne pollen in all sampling locations.Daily values were represented as number of pol-len grains per cubic metre of air. Counts were
14

performed on four continuous longitudinal linesalong the slide (Domınguez et al., 1992).
Spearman�s correlation test was used to estab-lish the degree of association, if any, betweenmeteorological parameters and daily mean pollencounts and to analyse differences in correlationcoefficient values as a function of the period se-lected. Pollen and phenological information fromCordoba and various sites in the province of Ou-rense were also used to analyse other factors thatmight be involved in defining the period.
3. Results
The criteria shown in Table 1 used to define themain pollen season were applied in order toexamine resulting changes in pollen curves. Ta-ble 2 shows, for each taxon, city and year, theminimum and maximum length of the pollen sea-son obtained; in each case, the criterion used and
the number of days� difference between maximumand minimum are shown. The earliest and latestpollen-season start and end dates are also shown.The considerably changing pattern of the graphsas a function of the criteria used, together withthe shortest and longest periods obtained, areshown in Figure 2.
The results obtained for Platanus were themost homogeneous, with the differences in dura-tion and the start and end dates being smallerthan for the other taxa. The greatest difference inpollen-season duration (27 days) was obtained inOurense in 2001, when there was continuous andheavy rainfall during the pollen season.
The 98% criterion (Galan et al., 1995) yieldedthe longest Poaceae season in all cities and years,while the criteria proposed by Mullenders et al.(1972) and by Spieksma et al. (1995) yielded theshortest season (Figure 2b). Major differences(over 100 days) were observed between pollen-season durations as determined by the various
Table 1. Criteria used to limit the pollen season used
Authors Definition
Nilsson and Persson (1981) The period from the time the sum of daily mean pollen concentrations reaches 5% of the
total sum until the time when the sum reaches 95%; i.e. the time with 90% of the whole
pollen amount.
Andersen (1991), Torben (1991) The period from which the sum of daily mean pollen concentrations reaches 2.5% of the
total sum until the time when the sum reaches 97.5%; i.e. the time with 95% of the whole
pollen amount.
Galan et al. (1995) The period from which the sum of daily mean pollen concentrations reaches 1% of the total
sum until the time when the sum reaches 99% i.e. the time with 98% of the whole pollen
amount.
Mullenders et al. (1972) Define the main period as beginning on the day when 5 day�s concentration reaches at least
1% of the joint total during three consecutive days and ends when the concentration is less
than 0.9% during more than 10 days.
Spieksma et al. (1995) Use the same criterion as that of Mullenders et al. (1972) but suggest that the 1% of the
annual total should be defined as the mean annual total for the years considered.
Jager et al. (1996) Pollen season starts the first day that has a daily count higher than 1% of the annual pollen,
presupposing that no more than six subsequent days follow with a zero count. It ends when
95% of the total annual pollen is reached.
Lejoly-Gabriel and Leuschner
(1983)
It starts on the day when the sum of the annual percentages of pollen released by a taxon
reaches 5%, provided that this day corresponds to a release higher than 1%. It ends on the
last day when the daily percentage is higher than 1% and the sum of the percentage of this
day and the percentages of the two preceding days are higher than or equal to 3%.
Giorato et al. (2000) Period in which the daily pollen count exceeds 30 p/m3 for Graminaceae and Urticaceae and
20p/m3 for other families
Sanchez Mesa et al. (2003) The start and end of the grass pollen season are defined as the first and last day, respectively,
when the pollen counts are ‡30 p/m3
Feher and Jarai-Komlodi (1997) Between the first and last days when a concentration of 3 g/m3 is consistently exceeded;
i.e. the pollen concentration is above 3 g/m3 on at least 5 days during the following week.
15

criteria. Start and end dates also varied consider-ably; the greatest difference was observed forstart-date in Ourense in 2001, and for end-datein Bologna in 2002 (Table 2b).
Betula is not found in southern Spain, so onlydata from Ourense and Bologna were compared.The 98% criterion (Galan et al., 1995) also yiel-ded the longest pollen season in each year in bothcities. The criterion yielding the shortest seasonvaried and was dependent on the year in the caseof Ourense. In Bologna, due to the lower dailymean pollen counts recorded, the shortest seasonwas obtained using the criterion proposed bySanchez Mesa et al. (2003) (Table 2, Figure 2c).
Differences with respect to the pollen-seasonstart-date were minor (with the exception of 2001in Bologna, where there was a difference of40 days); end-date differences were greater, espe-cially in Bologna. It was noticeable that the lon-gest pollen seasons were recorded in the citywhere the least annual total Betula pollen is cap-tured and that differences between the shortestand longest periods were also greatest in Bologna.
Finally, Olea is also a monospecific pollentype. Every year, the Feher and Jarai-Komlodi(1997) criterion yielded the longest pollen season
for Olea in Cordoba, while the Galan et al.(1995) criterion gave the longest season in Ou-rense and Bologna for those years when totalpollen counts enabled calculation of the pollenseason. Once again, the criteria yielding theshortest period varied depending on year andcity. Differences in pollen-season start dates inCordoba were minimal, although end-date differ-ences were greater (Table 2, Figure 2d).
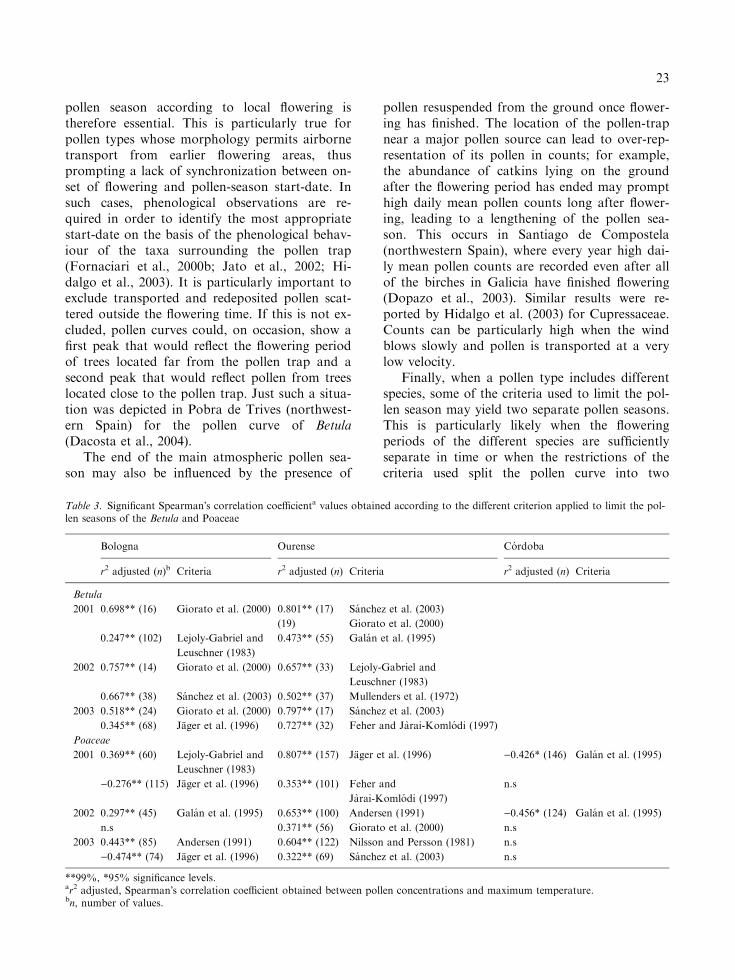
In order to determine the extent to which theperiod selected can influence the results obtained,Spearman�s correlation test was applied to pollendata and meteorological parameters (maximum,minimum and medium temperature and rainfall).Where significant correlations were obtained,there were considerable differences between coef-ficient values depending on the criterion used.For example, for Betula in Bologna and Ourense,there was a positive correlation with maximumtemperature (99% significance level); however,substantial differences were found in coefficientvalues every year, especially in 2001 (values ran-ged from 0.698 to 0.247 in Bologna and from0.801 to 0.473 in Ourense) depending on the cri-terion used to limit the pollen season (Table 3).Similar results were found for Poaceae in
Figure 1. Location of the three monitoring stations.
16

Table
2.Minim
um
andmaxim
um
length
ofthepollen
seasona,earliest
andlatest
start
andenddatesforeverytaxon,city
andyear
Location
Ourense
Cordoba
Bologna
Pollen
season
2001
2002
2003
2001
2002
2003
2001
2002
2003
Number
days(criteria)
Number
days(criteria)
Number
days(criteria)
Number
days(criteria)
Number
days(criteria)
Number
days(criteria)
Number
days(criteria)
Number
days(criteria)
Number
days(criteria)
Platanus
Length
Shortest
12(i,h)
11(f)
19(a)
12(l)
12(a)
14(a,f)
16(a,f)
24(h)
1(h,j)23(l)
Longest
39(d)
27(d)
26(d)
32(j)
35(j)
30(j)
33(d)
36(j)
55(d)
Start
Earliest
March15
March21
March18
March2
March8
March10
March23
March22
April1
Latest
March22
March23
March20
March4
March19
March13
March26
April1
April7
End
Earliest
April2
April2
April7
March15
March30
March26
April10
April24
April29
Latest
April22
April18
April13
April4
April11
April8
April26
April26
April26
Poaceae
Length
Shortest
54(e,f,l)
35(e)
29(l)
34(e,l)
22(e,l)
23(e,l)
54(l)
45(e)
39(e,l)
Longest
194(d)
164(d)
191(d)
146(d)
124(d)
80(d)
176(d)
174(d)
149(d)
Start
Earliest
February
20
April26
March8
March6
April16
April21
March31
April14
March23
Latest
May29
June19
June10
April27
May8
May9
April25
April24
April24
End
Earliest
July
21
July
23
July
8May30
May29
May26
June17
June5
June11
Latest
September
1August
17
August
19
August
18
August
18
July
17
September
26
September
21
August
26
Betula
Length
Shortest
11(l)
33(f)
17(h)
14(h)
3(h)
0(h)23(j)
Longest
55(d)
44(d)
57(d)
109(d)
58(d)
78(d)
Start
Earliest
March25
March22
March17
February
13
March19
March10
Latest
April8
March25
March31
March25
May31
April2
End
Earliest
April17
April26
April16
April7
April2
April25
Latest
May22
May5
May14
June6
May16
May26
Olea
Length
Shortest
7(l)
1(h)12(l)
46(a,f)
35(l)
29(f)
26(h)
Longest
63(d)
69(d)
75(j)
67(j)
91(j)
72(d)
Start
Earliest
May1
April27
April3
April21
April18
April16
Latest
May27
May20
April9
April26
May2
April19
End
Earliest
June2
May31
May24
May28
May30
May14
Latest
July
2July
4June26
June26
June21
June28
aa,NilssonandPersson(1981);c,
Andersen(1991);d,Galanet
al.(1995);e,
Mullenderset
al.(1972);f,Lejoly-G
abriel
andLeuschner
(1983);h,Sanchez
Mesaet
al.(2003);
i,Giorato
etal.(2000);j,Feher
andJarai-Komlodi(1997);l,Spieksm
aet
al.(1995)
17

Ourense, Bologna and Cordoba; nevertheless, inCordoba 95% significance levels were recordedonly in 2001 and 2002. The different number ofdays considered with every criteria broadly mod-ify the r2 adjusted value.
The graphs for daily mean Quercus pollencounts in 2002 and 2003 in Cordoba and Ou-rense show more than one peak, illustrating con-secutive flowering periods in both cities(Figures 3, 4). Depending on the criterion used, asecond, completely separate pollen season maybe identified in the autumn in Cordoba(Figure 3). Similarly, application of the mostrestrictive criteria, such as those of Lejoly-Gab-riel and Leuschner (1983) or Spieksma et al.(1995), yielded two distinct pollen seasons in Ou-rense (Figure 4).
4. Discussion
Different terms can be used to define the period oftime during which most of the annual total pollencount is recorded. Pollen Season appears to referto a recurring period marked by the presence ofpollen, while Main Pollen Season (Makinen 1977;Nilsson and Persson, 1981) may be interpreted asthat portion of the pollen season during whichmost pollen is recorded. The term Period of Maxi-mum Pollen Production (Gonzalez et al., 1998; Ni-tiu, 2003) appears to refer to the period of timeduring which pollen is produced by the plant, thusstressing the plant�s physiological activity morethan the presence of pollen in the air. However, itis well known that maximum pollen counts andmaximum pollen production are not always re-corded simultaneously. Other factors such astransport, resuspension and/or weather-relatedfactors can influence pollen content. Similarly, theterms Pollination Period, Pollination Season, MainPollination Season and Principal Pollination Peri-od (Lejoly-Gabriel and Leuschner, 1983; Jageret al., 1996; Clot, 1998; Comtois, 1998; Frenguelliet al., 2002; Syrigon et al., 2003) all allude to thefertilization process, i.e. the transfer of pollenfrom anther to stigma. The same factors men-tioned earlier (transport, resuspension and/ormeteorological factors) determine the presence ofpollen in the air outside the fertilization period.The viability of pollen grains can be altered by theinfluence of environmental factors, including
ultraviolet rays and pollution; many captured pol-len grains are unable to fertilize due to changes in-duced in the atmosphere. The term EffectivePollen Season (Giorato et al., 2000) is somewhatambiguous: it may denote a period of expectedpollen production or of effective pollination; itmay even be interpreted as the time during whichthe pollen count is sufficient to provoke allergysymptoms. Finally, the term Atmospheric PollenSeason (Jato et al., 2002) is readily understood asthe period of time during which pollen is presentin the atmosphere, whilst Main Atmospheric Pol-len Season could be used to delimit the periodduring which most pollen is recorded.
The flowering-period for some pollen types –Cupressaceae and, in some sites, Alnus – extendsfrom the end of one year to the early months ofthe next, a fact to be borne in mind in calculat-ing annual total pollen counts.
The use of different methods to delimit theperiod gives rise to major differences in the result-ing length. As indicated earlier, a common meth-od is to use a given percentage of the annual total.Long tails at the beginning and end of the mainpollen season hinder statistical analysis andprompt considerable variations when a percentageof the annual total is used to limit the pollen sea-son; if annual total pollen counts vary signifi-cantly from year to year (ranging from very highto very low), the same given percentage will corre-spond to very different values. The application ofother methods may therefore prove more useful.
The criteria yielding the shortest and longestperiods and the earliest and latest start and enddates varied according to both the city and thetaxon under study; in many cases, results for agiven taxa also depended on the year. The small-est differences were obtained for Platanus. This isa monospecific pollen type, and most of its pol-len generally comes from ornamental trees lo-cated in the city and near the pollen-trap.Moreover, blooming is explosive, consequentlyprompting high airborne pollen counts over justa few days. However, differences appear to begreater when there is heavy rainfall during thepollen season (see data on Ourense, 2001). Thelength of the pollen season and annual total pol-len recorded each year may be influenced by theweather. Hot periods at the onset of floweringfavour the release of pollen from anthers andmay lead to a shorter pollen season; in contrast,
18

release is slower in rainy weather or on dayswithout sunshine, and the pollen season thereforelasts longer (Corden et al., 2000; Clot, 2001; La-talowa et al., 2002; Dopazo et al., 2003). In somecases, particularly long tails may be observed atthe beginning and the end of the period.
Betula can be also considered to be a mono-specific pollen type. Only B. alba is present inOurense, apart from a few ornamental B. pendulatrees. In Bologna, most of the captured Betulapollen probably came from B. pendula treeslocated in the mountains far away from the
pollen-trap. The pollen grains captured camefrom birches located at different distances fromthe trap; since at different altitudes, birches flow-er at different times, this would lead to longerpollen seasons. It was noticeable that the longestperiods in the whole study were found for Bolo-gna, which is also the city for which the lowestannual total Betula pollen counts were recordedand where differences between the shortest andlongest periods were the greatest.
The longest pollen seasons were of a similarduration for Olea in all three cities, even though
Figure 2. (a) Shortest and longest pollen season for the Platanus. Ourense 2001: Sanchez-Mesa et al. (2003) and Galan et al. (1995)criteria, respectively, determined the shortest and longest pollen season. Cordoba 2002: Nilsson and Persson (1981) and Feher andJarai-Komlodi (1997). Bologna 2003: Sanchez-Mesa et al. (2003) and Galan et al. (1995). (b) Shortest and longest pollen seasonfor the Poaceae. Ourense 2003: Mullenders et al. (1972) and Galan et al. (1995) criteria, respectively, determined the shortest andlongest pollen season. Cordoba 2001 and Bologna 2002: Spieksma et al. (1995) and Galan et al. (1995). (c) Shortest and longestpollen season for the Betula. Ourense 2002: Spieksma et al. (1995) and Galan et al. (1995) criteria, respectively, determined theshortest and longest pollen season. Bologna 2001: Sanchez-Mesa et al. (2003) and Galan et al. (1995). (d) Shortest and longest pol-len season for theOlea. Cordoba 2003: Lejoly-Gabriel and Leuschner (1983) and Feher and Jarai-Komlodi (1997) criteria, respec-tively, determined the shortest and longest pollen season. Ourense 2002 and Bologna 2001: Sanchez-Mesa et al. (2003) and Galanet al. (1995).
19

the abundance of this tree clearly differs. Theability of Olea pollen to travel over middle andlong distances has been highlighted by variousinvestigators (Meiffren, 1988; Fornaciari et al.,2000b) and, and this factor probably plays a keyrole in the pollen counts recorded in Ourenseand Bologna since there are no major local sour-ces of Olea pollen to account for the levels re-corded. In contrast, very high pollen counts wererecorded every year in Cordoba due to the pre-dominance of extensive olive-groves. Olea pollenin Cordoba comes not only from the groves sur-rounding the city but also from later-floweringtrees located at higher altitudes and further fromthe city (Fornaciari et al., 2000b).
The greatest differences in duration, start-dates and end-dates as a function of the criteriaselected were observed for Poaceae. This pollentype includes pollen from a large number of spe-
cies whose flowering-periods overlap from springto the end of summer. Therefore, it can be con-cluded that the number of species included in thesame pollen type significantly influences the dura-tion of the pollen season.
When aerobiological data are used with aview to deriving models to predict daily meanpollen counts, the relationship between weather-related parameters and pollen concentrations isoften analysed in order to select the best meteo-rological parameter to be used as independentvariable for the model. In the data assembledhere, each taxon behaved differently as a func-tion of each weather parameter, and both levelsof significance and correlation coefficient valuesvaried depending on the criteria used and the cityunder study (Table 3). With respect to correla-tion coefficients, therefore, there is no particularreason why we should use only one specific
Figure 2. (Continued).
20

Figure 2. (Continued).
21

criterion to limit the pollen season; the main aimshould be to achieve the best predictive model,irregardless of the criterion used: the criterionused should be the one which is best suited tothe aim of each aerobiological survey.
Pollen data can be used as a phenologicalindicator of flowering, and many phenologicalstudies using pollen data have been conducted in
order to determine the chilling and heat require-ments for flowering in various species and geo-graphical areas (Garcia-Mozo et al., 2000; Jatoet al., 2000; Fornaciari, et al., 2000a; Galanet al., 2001; Laaidi, 2001). Meteorological dataare usually supplied by local weather stations toenable calculation of thermic phenological in-dexes; accurate determination of the start of the
Figure 3. Pollen seasons of Quercus in Cordoba according to the criteria of Galan et al. (1995) and Lejoly-Gabriel and Leuschner(1983) in 2002 and according to the criteria of Galan et al. (1995) and Spieksma et al. (1995) in 2003.
Figure 4. Pollen seasons of Quercus in Ourense according to the criteria of Feher and Jarai-Komlodi (1997) and Lejoly-Gabrieland Leuschner (1983) in 2002 and according to the criteria of Feher and Jarai-Komlodi (1997) and Spieksma et al. (1995) in 2003.
22
pollen season according to local flowering istherefore essential. This is particularly true forpollen types whose morphology permits airbornetransport from earlier flowering areas, thusprompting a lack of synchronization between on-set of flowering and pollen-season start-date. Insuch cases, phenological observations are re-quired in order to identify the most appropriatestart-date on the basis of the phenological behav-iour of the taxa surrounding the pollen trap(Fornaciari et al., 2000b; Jato et al., 2002; Hi-dalgo et al., 2003). It is particularly important toexclude transported and redeposited pollen scat-tered outside the flowering time. If this is not ex-cluded, pollen curves could, on occasion, show afirst peak that would reflect the flowering periodof trees located far from the pollen trap and asecond peak that would reflect pollen from treeslocated close to the pollen trap. Just such a situa-tion was depicted in Pobra de Trives (northwest-ern Spain) for the pollen curve of Betula(Dacosta et al., 2004).
The end of the main atmospheric pollen sea-son may also be influenced by the presence of
pollen resuspended from the ground once flower-ing has finished. The location of the pollen-trapnear a major pollen source can lead to over-rep-resentation of its pollen in counts; for example,the abundance of catkins lying on the groundafter the flowering period has ended may prompthigh daily mean pollen counts long after flower-ing, leading to a lengthening of the pollen sea-son. This occurs in Santiago de Compostela(northwestern Spain), where every year high dai-ly mean pollen counts are recorded even after allof the birches in Galicia have finished flowering(Dopazo et al., 2003). Similar results were re-ported by Hidalgo et al. (2003) for Cupressaceae.Counts can be particularly high when the windblows slowly and pollen is transported at a verylow velocity.
Finally, when a pollen type includes differentspecies, some of the criteria used to limit the pol-len season may yield two separate pollen seasons.This is particularly likely when the floweringperiods of the different species are sufficientlyseparate in time or when the restrictions of thecriteria used split the pollen curve into two
Table 3. Significant Spearman�s correlation coefficienta values obtained according to the different criterion applied to limit the pol-len seasons of the Betula and Poaceae
Bologna Ourense Cordoba
r2 adjusted (n)b Criteria r2 adjusted (n) Criteria r2 adjusted (n) Criteria
Betula
2001 0.698** (16) Giorato et al. (2000) 0.801** (17) Sanchez et al. (2003)
(19) Giorato et al. (2000)
0.247** (102) Lejoly-Gabriel and
Leuschner (1983)
0.473** (55) Galan et al. (1995)
2002 0.757** (14) Giorato et al. (2000) 0.657** (33) Lejoly-Gabriel and
Leuschner (1983)
0.667** (38) Sanchez et al. (2003) 0.502** (37) Mullenders et al. (1972)
2003 0.518** (24) Giorato et al. (2000) 0.797** (17) Sanchez et al. (2003)
0.345** (68) Jager et al. (1996) 0.727** (32) Feher and Jarai-Komlodi (1997)
Poaceae
2001 0.369** (60) Lejoly-Gabriel and
Leuschner (1983)
0.807** (157) Jager et al. (1996) )0.426* (146) Galan et al. (1995)
)0.276** (115) Jager et al. (1996) 0.353** (101) Feher and
Jarai-Komlodi (1997)
n.s
2002 0.297** (45) Galan et al. (1995) 0.653** (100) Andersen (1991) )0.456* (124) Galan et al. (1995)
n.s 0.371** (56) Giorato et al. (2000) n.s
2003 0.443** (85) Andersen (1991) 0.604** (122) Nilsson and Persson (1981) n.s
)0.474** (74) Jager et al. (1996) 0.322** (69) Sanchez et al. (2003) n.s
**99%, *95% significance levels.ar2 adjusted, Spearman�s correlation coefficient obtained between pollen concentrations and maximum temperature.bn, number of values.
23

separate seasons. The Quercus pollen curve inOurense reflects the sequence of Quercus flower-ing in Ourense, while a late peak is commonlyrecorded that coincides with Q. suber flowering(Jato et al., 2002). Depending on the criteria usedto limit the pollen season, the portion of the pol-len curve corresponding to the Q. suber floweringperiod may be presented as a separate pollen sea-son. Moreover, the possibility of two floweringperiods in the same year for a given taxon, as oc-curs in some years for Q. rotundifolia and Q. su-ber in southern Spain (Gomez-Casero, 2003) orfor Cupressus macrocarpa and C. sempervirens(Hidalgo et al., 2003), may also prompt the split-ting of the pollen curve into two pollen seasons,which are detectable only with certain pollen-sea-son criteria. Different criteria yield different pol-len curves, which may or may not indicate suchevents; this is particularly the case when the cri-teria used are based on percentages of the annualtotal pollen count.
4.1. Conclusion
Pollen-season terminology needs to be reviewedand unified. Atmospheric Pollen Season appearsto be the term best suited to describing this con-cept.
The limits of the pollen season should be setin accordance with the aims of each survey. Inevery city, all the factors affecting the presence ofpollen in the air, such as number of species in-cluded in the pollen type, pollen transport abil-ity, meteorological conditions, annual totalpollen variability, among others, should be con-sidered in the interpretation of the aerobiologicalresults.
More specifically, certain factors, such asthe possibility of pollen transport, should betaken into consideration, and phenologicalobservations should be made in order to selectthe best criterion according to local floweringbehaviour. These considerations will be of par-ticular importance when airborne pollen is usedas bioindicator of flowering phenophase inclimate changes investigations. In the samemanner, resuspension favours the presence ofpollen in the air even when there is no pollensource are in flower, leading to a prolongationof the pollen season under favourable weatherconditions.
Decisions taken should not be universal innature, but will vary as a function of the pollen-type under study and the particular features ofthe sampling site involved.
References
Andersen T.B.: 1991, A model to predict the beginning of the
pollen season, Grana 30, 269–275.
Clot B.: 1998, Forecast of the Poaceae pollination in Zurich and
Basel (Switzerland), Aerobiologia 14, 267–268.
Clot B.: 2001, Airborne birch pollen in Neuchatel (Switzer-
land): onset, peak and daily patterns, Aerobiologia 17, 25–29.
Comtois P.: 1998, Statistical analysis of aerobiological data. In:
Mandrioli P., Comtois P., Levizzani V. (eds), Methods in
Aerobiology. Pitagora Editrice: Bologna.
Corden J., Millington W., Bailey J., Brookes M., Caulton E.,
Emberlin E., Mullins J., Simpson C. and Wood A.: 2000,
UK regional variations in Betula pollen (1993–1997), Aer-
obiologia 16, 227–232.
Dacosta N., Rodrıguez-Rajo F.J. and Jato V.: 2004, Aero-
palinologıa de Pobra de Trives (Ourense) y su relacion con la
meteorologıa. Ano 2002, Bot. Complut. 28, 109–120.
Dahl A. and Strandhede S.O.: 1996, Predicting the intensity of
the birch pollen season, Aerobiologia 12, 97–106.
Davies R.R. and Smith L.P: 1973, Forecasting the start and
severity of the hay fever season, Clin. Allergy 3, 263–267.
Domınguez E, Galan C, Villamandos F. and Infante F.: 1992,
Handling and evaluation of the data from the aerobiological
sampling, Monografıas Rea/Ean 1, 1–13.
Dopazo A., Jato V. and Aira M.J.: 2003, Models for predicting
the onset of pollination and daily pollen concentrations of
Betula sp, Bot. Helv. 113, 145–157.
Driessen M.N.B.M., Van Herpen R.M.A., Moelands R.P.M.
and Spieksma F.Th.M.: 1989, Prediction of the start of the
grass pollen season for the western part of the Netherlands,
Grana 28, 37–44.
Driessen M.N.B.M., Van Herpen R.M.A. and Smithuis
L.O.M.J.: 1990, Prediction of the start of the grass pollen
season for the southern part of the Netherlands, Grana 29,
79–86.
Feher Z. and Jarai-Komlodi M.: 1997, An examination of the
main characteristics of the pollen seasons in Budapest,
Hungary (1991–1996), Grana 36, 169–174.
Fornaciari M., Orlandi F. and Romano B.: 2000a, Phenological
and aeropalynological survey in an olive orchard in Umbrıa
(Central Italy), Grana 39, 246–251.
Fornaciari M., Galan C., Mediavilla A., Domıngues E. and
Romano B.: 2000b, Aeropalynological and phenological
study in two different Mediterrranean olive areas: Cordoba
(Spain) and Perugia (Italy), Plant Biosys. 134, 199–204.
Frenguelli G., Spieksma F.Th.M., Bricchi E., Romano B.,
Mincigrucci G., Nikkels A.H., Dankaart W. and Ferranti F.:
1991, The influence of air temperature on the starting dates of
the pollen season of Alnus and Populus, Grana 30, 196–200.
Frenguelli G., Tedeschini E., Veronesi F. and Bricchi E.: 2002,
Airborne pine (Pinus spp.) pollen in the atmosphere of
Perugia (Central Italy): Behaviour of pollination in the two
last decades, Aerobiologia 18, 223–228.
24

Galan C., Emberlin J., Domınguez E., Bryant R.H. and
Villamandos F.: 1995, A comparative analysis of daily
variations in the Gramineae pollen counts at Cordoba, Spain
and London, UK, Grana 34, 189–198.
Galan C., Garcıa-Mozo H., Carinanos P., Alcazar P. and
Domınguez-Vilches E.: 2001, The role of temperature in the
onset of the Olea europaea L. pollen season in southwestern
Spain, Int. J. Biometeorol. 45, 8–12.
Garcıa-Mozo H., Galan C., Carinanos P., Alcazar P., Mendez
J., Vendrell M., Alba F., Saenz C., Fernandez D., Cabezudo
B. and Domınguez E.: 1999, Variations in the Quercus sp.
pollen season at selected sites in Spain, Polen 10, 59–69.
Garcıa-Mozo H., Galan C., Gomez-Casero M.T. and Domın-
guez-Vilches E.: 2000, A comparative study of different
temperature accumulation methods to predicting the start of
the Quercus pollen season in Cordoba (South West Spain),
Grana 39, 194–199.
Giorato M., Lorenzoni F., Bordin A., De Biasi G., Gemignani
C., Schiappoli M. and Marcer G.: 2000, Airborne allergenic
pollens in Padua: 1991–1996, Aerobiologia 16, 453–454.
Gomez-Casero M.T.: 2003, Fenologıa floral y aerobiologıa en
distintas especies perennifolias de Quercus en la provincia de
Cordoba. PhD thesis, University of Cordoba, Spain.
Gonzalez F.J., Iglesias I., Jato V., Aira M.J., Candau M.P.,
Morales J. and Tomas C.: 1998, Study of the pollen
emissions of Urticaceae, Plantaginaceae and Poaceae at five
sites in western Spain, Aerobiologia 14, 117–129.
Hidalgo P., Galan C. and Domınguez E.: 2003, Male phenology
of three species of Cupressus: correlation with airborne
pollen, Trees 17, 336–344.
Jager S., Nilsson S., Berggren B., Pessi A.M., Helander M. and
Ramfjord H.: 1996, Trends of some airborne tree pollen in
the Nordic countries and Austria, 1980–1993. A comparison
between Stockholm, Trondheim, Turku and Vienna, Grana
35, 171–178.
Jato V., Frenguelli G., Rodrıguez F.J. and Aira M.J.: 2000,
Temperature requirements of Alnus pollen in Spain and Italy
(1994–1998), Grana 39, 240–245.
Jato V., Rodrıguez-Rajo F.J., Mendez J. and Aira M.J.: 2002,
Phenological behaviour of Quercus in Ourense (NW Spain)
and its relationship with the atmospheric pollen season, Int.
J. Biometeorol 46, 176–184.
Jato V., Rodrıguez-Rajo F.J., Dacosta N. and Aira M.J.: 2004,
Heat and chill requirements of Fraxinus flowering in Galicia
(NW Spain), Grana 43, 213–217.
Laaidi M.: 2001, Forecasting the start of the pollen season of
Poaceae: evaluation of some methods based on meteorolog-
ical factors, Int. J. Biometeorol. 45, 1–7.
Latalowa M., Mietus M. and Uruska A.: 2002, Seasonal
variations in the atmospheric Betula pollen count in Gdansk
(southern Baltic coast) in relation to meteorological param-
eters, Aerobiologia 18, 33–43.
Lejoly-Gabriel and Leuschner: 1983, Comparison of air-borne
pollen at Louvain-la-Neuve (Belgium) and Basel (Switzer-
land) during 1979 and 1980, Grana 22, 59–64.
Makinen T.: 1977, Correlation of atmospheric spore frequen-
cies with meteorological data, Grana 16, 149–153.
Meiffren J.: 1988, Airborne pollen of Toulouse, southern
France. Comparison with Bordeaux and Montpellier, Grana
27, 183–201.
Mullenders W., Dirickx M., Van Der Haegen D., Bastin-
Servais D. and Desair Coremans M.: 1972, La pluie
pollinique a Louvain, Louvain Med 91, 159–176.
Newnham R.M.: 1999, Monitoring biogeographical response to
climate change: The potential role of aeropalynology,
Aerobiologia 15, 87–94.
Nilsson S. and Persson S.: 1981, Tree pollen spectra in the
Stockholm region (Sweden) 1973–1980, Grana 20, 179–182.
Nitiu D.S.: 2003, Annual, daily and intradiurnal variation of
Celtis pollen in the city of la Plata, Argentina, Aerobiologia
19, 71–78.
Norris Hill J.: 1998, A method to forecast the start of the
Betula, Platanus and Quercus pollen seasons in North
London, Aerobiologia 14, 165–170.
Pathirane L.: 1975, Graphical determination of the main pollen
season, Pollen Spores 17, 609–610.
Porsbjerg C., Rasmussen A. and Backer V.: 2003, Airborne
pollen in Nuuk, Greenland, and the importance of meteo-
rological parameters, Aerobiologia 19, 29–37.
Rogers C.: 1997, An aeropalynological study of metropolitan
Toronto, Aerobiologia 13, 243–257.
Sanchez-Mesa J.A., Smith M., Emberlin J., Allitt U., Caulton
E. and Galan C.: 2003, Characteristics of grass pollen
seasons in areas of southern Spain and the United Kingdom,
Aerobiologia 19, 243–250.
Spieksma F.Th.M., Emberlin J., Hjelmroos M., Jager S. and
Leuschner R.M.: 1995, Atmospheric birch (Betula) pollen in
Europe: Trends and fluctuations in annual quantities and the
starting dates of the seasons, Grana 34, 51–57.
Syrigon E., Zanikou S. and Papageorgiou P.S.: 2003, Grasses,
olive, parietaria and cypress in Athens: Pollen sampling from
1995 to 1999, Aerobiologia 19, 133–137.
Torben B.A.: 1991, A model to predict the beginning of the
pollen season, Grana 30, 269–275.
25