Embed Size (px)
Citation preview

May 8, 2015Tony D’Agostino
Research Director, MOTT

Economic Impact of Tourism on MA
Review of International and Overseas Travel to MA
Summary of Canadian visitation to Mid Atlantic states, New England states and MA
Focus on top Origin Provinces to Mid Atlantic states, New England state and MA
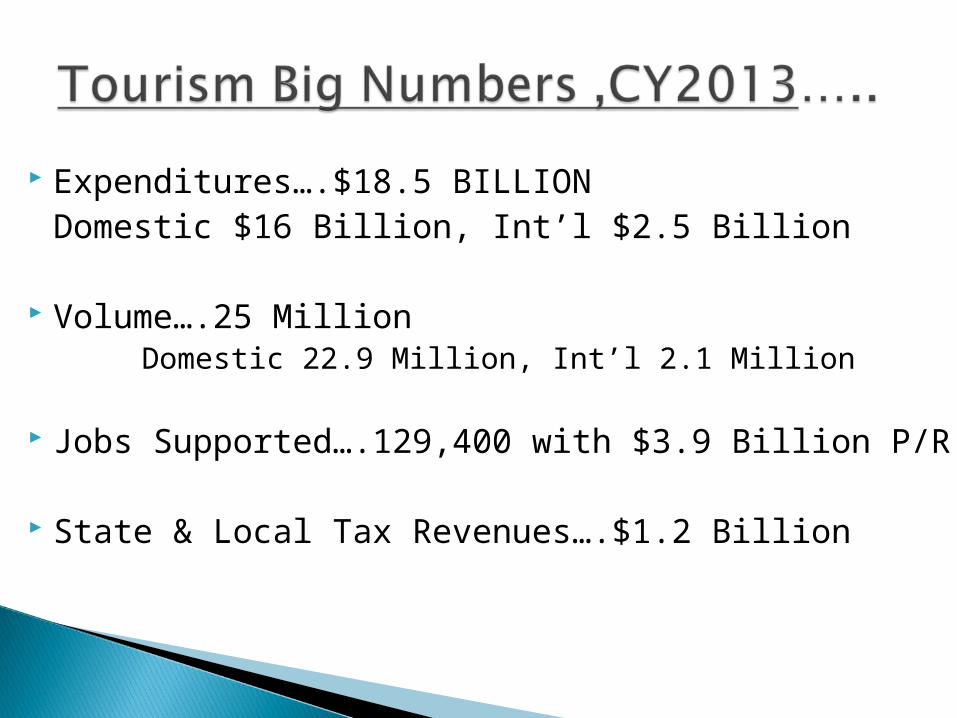
Expenditures….$18.5 BILLIONDomestic $16 Billion, Int’l $2.5 Billion
Volume….25 Million Domestic 22.9 Million, Int’l 2.1 Million
Jobs Supported….129,400 with $3.9 Billion P/R
State & Local Tax Revenues….$1.2 Billion

Economic Impact of Domestic and International Traveler to MA , CY2013
Travel Expenditures Domestic v. International2013p 2013p
($ Millions) % of total ($ Millions) % of total
Public Transportation $5,263.6 32.8% $300.2 12.2%
Auto Transportation 2,364.8 14.8% 35.4 1.4%
Lodging 3,327.8 20.8% 866.3 35.2%
Foodservice 3,135.0 19.6% 462.8 18.8%
Entertainment & Recreation 924.6 5.8% 194.3 7.9%
General Retail Trade 1,008.3 6.3% 598.8 24.4%
Total $16,024.1 100.0% $2,457.7 100.0%

Domestic Visitors Origin: Top States and Regions, 2013…… 23 MILLION TOTAL
Person Trips Share of all
Origin State to Massachusetts Person Trips
Massachusetts 7,250,000 33.1%
New York 2,412,000 11.0%
Connecticut 2,211,500 10.1%
New Hampshire 1,541,500 7.0%
Rhode Island 618,000 2.8%
All New England States 13,069,500 59.7%All Mid Atlantic States(NY,NJ,PA) 3,688,500 16.8%
Source:TNS, Travels America

Int’l Travel to U.S. & MA is considered an Export !!!
Travel Industry falls within SERVICE SECTOR
TRAVEL is FASTEST-GROWING INDUSTRY within the FASTEST-GROWING SECTOR of U.S. Exports
Int’l travel to U.S. accounted for 10% of all U.S. exports and generated a $74 Billion trade surplus

Overseas visitor data come from in-flight survey and compiled by U.S. Dept. of Commerce
Canadian visitor data come from StatsCanada

700,000
700,000
700,000
Origin of 2.1 Million Visitors
Canada
Europe
Other
…Quebec,Ontario, Nova Scotia
…PRC, Australia and South America
…western Europe

Generating $29 in state & local taxes

2013 Change 2013 2012 2012
(State/Territory) Visitation (000) (%) Market Share
Market share
change
Visitation (000)
Market
1 New York 9,804 5% 30.6 dn 9,315 31.3
2 Florida 7,209 10% 22.2 up 6,577 22.1
3 California 6,472 8% 20.2 flat 6,012 20.2
4Hawaiian Islands
3,172 12% 9.9 up 2,827 9.5
5 Nevada 2,915 5% 9.1 dn 2,768 9.3
6 Texas *** 1,570 17% 4.9 up 1,339 4.5
7 Guam 1,474 5% 4.6 dn 1,399 4.7
8 Illinois 1,442 3% 4.5 dn 1,399 4.7
9 Massachusetts 1,378 3% 4.3 dn 1,339 4.5
10 Pennsylvania 993 4% 3.1 dn 952 3.2
11 New Jersey 929 8% 2.9 flat 863 2.9
U.S. visitation from Overseas up 8% to 32,000,000
*** Texas passes Ma
2013 Rank

2012Visits Share
1 New York 4,263 18.8% competitive set
2 Florida 3,559 15.7%
3 Washington 2,933 12.9%
4 Michigan 1,612 7.1%
5 Nevada 1,587 7.0%
6 California 1,543 6.8%
7 Pennsylvania 975 4.3% competitive set
8 Maine 928 4.1% competitive set
9 Montana 776 3.4%
10 North Dakota 761 3.4%
11 Arizona 728 3.2%
12 Minnesota 696 3.1%
13 MA 691 3.0%
14 Vermont 667 2.9% competitive set
15 Virginia 652 2.9%
TOP 5 International Destinations
U.S., Mexico ,Cuba, U.K. and Dominican Republic
N.J.

Total = 678,000
Quebec
Ontario
Nova Scotia
New Brunswick
British Columbia
Alberta
Other
Quebec…302,000
Ontario…216,000
Nova Scotia…50,000

Visits from Quebec, Ontario and Nova Scotia to New England & Mid Atlantic statesCalendar Year 2011
New England / Mid Atlantic states New England
% of NE/MidAtl Mid Atlantic
% of NE/MidAtl
Quebec to … 2,650,000 1,422,000 54% 1,228,000 46%
Ontario to … 4,020,000 654,000 16% 3,336,000 83%
Nova Scotia to… 384,000 306,000 80% 78,000 20%
Mid Atl includes NY,NJ,PA

Canadian Visits to Mid Atlantic and New England States (1+ nights)Calendar Year 2011
VOLUME AND SHARE
New England / Mid Atl Massachusetts Vermont Maine
Quebec to … 2,650,000 302,000 11% 480,000 18% 347,000 13%
Ontario to … 4,020,000 216,000 5% 157,000 4% 114,000 3%
Nova Scotia to… 384,000 50,000 13% 7,000 2% 189,000 49%
Ontario is basically Toronto and is analogous to NYC for domestic travel to MA

Canadian Visits to Mid Atlantic and New England states (1+ nights)ALL CANADIAN visitors …not just from Quebec,Ontario and Nova Scotia
Percentage of Destination Totals
Mid Atlantic New England Massachusetts Vermont Maine
Auto 3,889,000 77% 2,260,000 78% 384,000 56% 569,000 86% 848,000 90%
Air 846,000 17% 303,000 10% 170,000 25% 28,000 4% 33,000 3%
Bus 175,000 3% 192,000 7% 108,000 16% 28,000 4% 24,000 3%
Other 125,000 2% 141,000 5% 28,000 4% 34,000 5% 40,000 4%
Only 20% of domestic visitors to MA came by AIR

Canadian Visits to Mid Atlantic and New England States (1+ nights)
Percentage of State Totals
Mid/Atl New England Massachusetts Vermont Maine
Business/Convention 439,000 9% 192,000 7% 107,000 16% 16,000 2% 27,000 3%
Visits Frnds/Rltvs 769,000 15% 413,000 14% 109,000 16% 105,000 16% 99,000 10%
Holiday/Vacation 3,155,000 62% 1,964,000 68% 390,000 58% 510,000 77% 652,000 69%
Other 694,000 14% 332,000 11% 71,000 10% 33,000 5% 169,000 18%
5,057,000 2,901,000 677,000 664,000 947,000
Domestic Traveler Main purpose…47% VFR

Canadian Visits to Mid Atlantic and New England States (1+ nights)Percentage of State Totals
Mid/Atl New England Massachusetts Vermont Maine
Shopping 3,727,000 74% 2,106,000 73% 499,000 74% 399,000 60% 739,000 78%
Sightsee 2,302,000 46% 1,417,000 49% 429,000 63% 256,000 39% 408,000 43%
Visit Frnds/Rltvs 1,485,000 29% 796,000 27% 219,000 32% 185,000 28% 206,000 22%
Outdoor Activity/Sports 1,211,000 24% 916,000 32% 139,000 21% 273,000 41% 295,000 31%
Historic Sites 1,386,000 27% 763,000 26% 312,000 46% 108,000 16% 177,000 19%
Night Club 986,000 19% 445,000 15% 155,000 23% 78,000 12% 116,000 12%
National/State Park 855,000 17% 568,000 20% 111,000 16% 142,000 21% 132,000 14%
Museum/Art Gallery 988,000 20% 535,000 18% 237,000 35% 67,000 10% 123,000 13%
Theme Park 431,000 9% 236,000 8% 27,000 4% 29,000 4% 126,000 13%
Cultural Event 675,000 13% 245,000 8% 97,000 14% 39,000 6% 51,000 5%
5,057,000 2901000 678000 663000 947000

Canadian Visits to U.S. and New England States (1+ nights)
Percentage of State Totals
Mid/Atl New England Massachusetts Vermont
Camping 330,000 7% 278,000 10% 19,000 3% 95,000 14%
Cottage/Cabin 106,000 2% 153,000 5% 10,000 1% 67,000 10%
Hotel/Motel 3,106,000 61% 1,655,000 57% 433,000 64% 310,000 47%
Friends/Relatives 596,000 12% 292,000 10% 100,000 15% 64,000 10%
OTHER 489,000 10% 314,000 11% 86,000 13% 71,000 11%
Not Stated 431,000 9% 208,000 7% 30,000 4% 55,000 8%
5,058,000 2,900,000 678,000 662,000 100%
Domestic visitors stay at friend or family just over 40%Paid Accommodations also just over 40%

Canadian Visits to U.S. and New England States (1+ nights)
Percentage of State Totals
Mid/Atl New England Massachusetts Vermont Maine
Under 12 281,000 6% 183,000 6% 29,000 4% 37,000 6% 75,000 8%
12 - 19 343,000 7% 147,000 5% 34,000 5% 35,000 5% 51,000 5%
20 - 34 551,000 11% 322,000 11% 100,000 15% 74,000 11% 78,000 8%
35 - 54 1,499,000 30% 894,000 31% 206,000 30% 205,000 31% 286,000 30%
55 or older 2,111,000 42% 1,178,000 41% 249,000 37% 273,000 41% 416,000 44%
Not Stated 271,000 5% 177,000 6% 60,000 9% 38,000 6% 41,000 4%
5,056,000 2,901,000 678,000 662,000 947,000
Domestic visitors have higher % in 20-54 ages and lower % in 19 and under ages

Percentage of State Totals
Mid/Atl New England Massachusetts Vermont Maine
One Night 1,590,000 31% 728,000 25% 128,000 19% 182,000 27% 231,000 24%
2 - 6 Nights 3,147,000 62% 1,874,000 65% 472,000 70% 429,000 65% 596,000 63%
7 - 13 Nights 261,000 5% 253,000 9% 65,000 10% 46,000 7% 103,000 11%
14+ Nights 59,000 1% 46,000 2% 14,000 2% 6,000 1% 18,000 2%
Total 1+ Nights 5,057,000 100% 2,901,000 100% 679,000 100% 663,000 100% 948,000 100%
Average nights 2.9 3.2 3.7 2.8 3.3
Domestic overnights average just under 4 nights
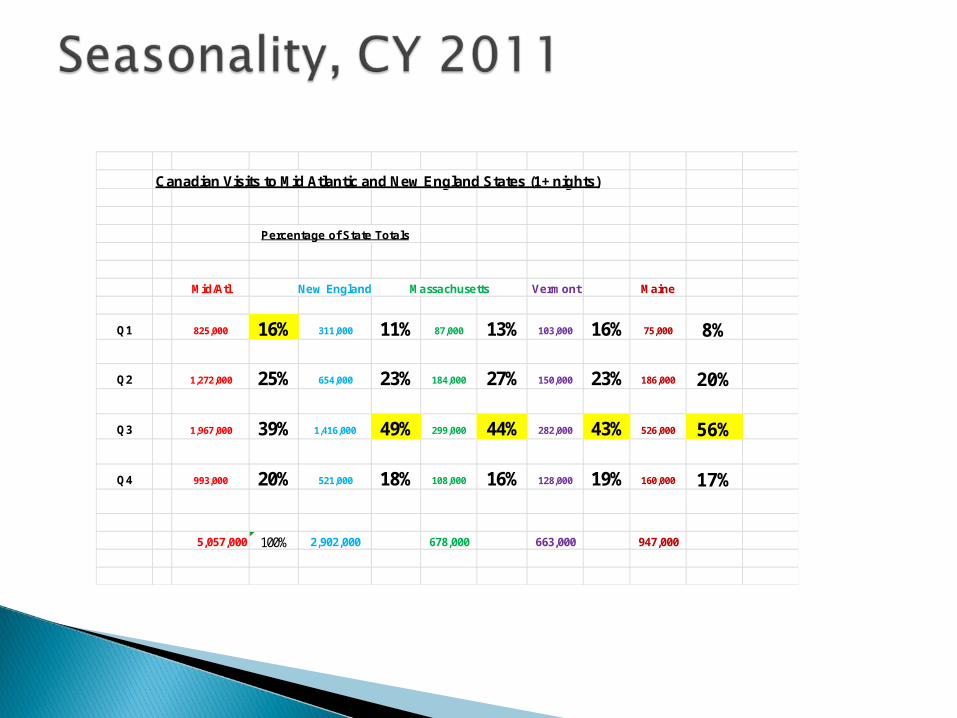
Canadian Visits to Mid Atlantic and New England States (1+ nights)
Percentage of State Totals
Mid/Atl New England Massachusetts Vermont Maine
Q1 825,000 16% 311,000 11% 87,000 13% 103,000 16% 75,000 8%
Q2 1,272,000 25% 654,000 23% 184,000 27% 150,000 23% 186,000 20%
Q3 1,967,000 39% 1,416,000 49% 299,000 44% 282,000 43% 526,000 56%
Q4 993,000 20% 521,000 18% 108,000 16% 128,000 19% 160,000 17%
5,057,000 100% 2,902,000 678,000 663,000 947,000

0
5
10
15
20
25
30
35
40
45
50
Q 1 Q 2 Q 3 Q 4
Domestic visitor
Canadian visitor
Quarterlies from provinces not available!!

Growth of travel to U.S. from Canada slowing…to MA???

Canadian visitor profile similar to Domestic Visitor …Purpose and length of stay are different
MA competes with other New England and Mid Atlantic states
Economic Impact of Canadian visitor to MA fits in between Domestic and Overseas visitor
Current MA market share of top origin provinces is fairly small

Travel Spending in MA is a big business
We must work it like playing a pinball machine