Embed Size (px)
Citation preview
Dissolution Technologies | MAY 2013 21
Effect of a Fiber-Optic Probe on the Dissolution of Salicylic Acid Tablets in USP Apparatus 2
Bing Wang1, Gerard Bredael2, and Piero M. Armenante1,* 1New Jersey Institute of Technology, Otto H. York Department of Chemical, Biological and
Pharmaceutical Engineering, 323 M. L. King Boulevard, Newark, NJ 07102-1982, USA2Merck & Co., Inc., Summit, NJ 07901, USA
ABSTRACTFiber-optic probes permanently inserted in the dissolution medium in dissolution vessels can automate the sampling
process but can also potentially affect the hydrodynamics in the vessel, possibly resulting in increased drug dissolution rates. In this work, dissolution experiments with non-disintegrating salicylic acid calibrator tablets were conducted in dis-solution testing Apparatus 2 in both the presence and absence of a commercially available fiber-optic probe (Opt-Diss). Tests were conducted using tablets dropped in the medium according to USP guidelines, as well as with tablets fixed at nine positions on the vessel bottom (i.e., either centered in the vessel or placed at different off-center locations with respect to the vessel vertical centerline). The results were compared using statistical tools. In many cases, the presence of the probe resulted in slightly faster dissolution rates. The difference between the results obtained in experimental sys-tems with the probe and those obtained with the control system without the probe depended on tablet position. Larger differences were observed when the tablets were on inner circle positions (10° off-center circle), especially when the tab-lets were located immediately downstream of the probe. A paired t-test as well as the difference factor (f1) and similarity factor (f2) were used to statistically analyze the results. In most cases, the results obtained with the inserted probe were statistically different, according to the paired t-test, from those obtained without it. It can be concluded that fiber-optic sampling probes can often result in small but measurable enhancements in the dissolution rates, which can produce ap-preciable variations in test results.
INTRODUCTION
In most industrial applications, the use of USP dissolu-tion testing Apparatus 2 to test drug release from solid oral dosage forms requires periodically removing liquid
samples manually during the dissolution process and ana-lyzing them separately, for example with a spectropho-tometer or another analytical device, to quantify the drug concentration in the dissolution medium as a function of time. There are several disadvantages in this approach such as labor intensiveness, the possible introduction of operator error, the small number of data that can be reasonably collected with this approach due to the need for human intervention, and the progressive removal of medium over time as a result of sampling.
A different approach that can overcome the limitations of manual sampling uses probes that are permanently inserted in the dissolution medium and are connected to an external device to measure the dissolving drug concentration continuously. Since this method can save time and minimize errors, different types of probes have been developed, and several studies have appeared in the literature (1–24) describing their performance as well as their advantages and limitations. Fiber-optic probes, which are widely used sampling probes, are devices per-manently immersed in the medium within the dissolution vessel. A light signal generated externally travels through
a small gap in the fiber-optic cable located in the dissolu-tion medium. The attenuated light signal received at the other end of the cable is used by the external detection device to determine the evolving concentration of the dissolving drug. Fiber-optic probes and their applications in dissolution testing have been studied for a number of years since the early study by Josefson (2). These studies have indeed shown that probes can be advantageously used in dissolution testing and that they generate accu-rate and reproducible dissolution data.
Despite these advantages, the use of fiber-optic probes in dissolution testing can also raise some issues, especially when a previously validated manual sampling process is converted to automatic sampling using a permanently inserted fiber-optic probe. One of the main concerns is the effect that the presence of the probe can have on the hydrodynamics in the dissolution vessel and its impact on dissolution rates. Probes are typically small, but they can introduce asymmetry in the vessel and can act as small obstacles (“baffles” in the fluid mixing literature) in an oth-erwise undisturbed flow. This in turn can possibly result in changes in the fluid velocity profile and shear rates, which can cause variations in dissolution testing profiles and dis-solution rates. Several investigators have in fact observed such changes in dissolution rates (3, 4, 9, 11, 12, 15, 19, 23, 24).
Therefore, the objective of this work was to quantify the possible changes in dissolution rates that can result *Corresponding author.
e-mail: [email protected]
dx.doi.org/10.14227/DT200213P21
22 Dissolution Technologies | MAY 2013
from the introduction of a commercial fiber-optic probe in the vessel. Here, dissolution tests were conducted with non-disintegrating salicylic acid calibrator tablets in two USP Apparatus 2 systems, the experimental sys-tem (with the probe) and the standard control system (without the probe), to observe the changes in dissolu-tion profiles caused by the probe itself when the tablets were dropped in the vessel at the beginning of the test. Significant efforts were made to minimize the effect of any other factor that could play a role in the dissolution tests. In addition, and to make the system more sensitive to the effect of small geometric differences, tests were also conducted with tablets fixed at several positions in the vessel. As shown in previous studies by this group (25–27), tablets placed at different locations on the ves-sel bottom can have different dissolution rates since they experience different flows around them and different shear stresses, especially if the system is nonsymmetrical. Therefore, in this work, dissolution tests were conducted not only with the standard tablet drop technique speci-fied in the USP (28), but also with tablets fixed in place at nine positions on the vessel bottom (i.e., the central position, four positions on the 10° off-center circle, and four other positions on the 20° off-center circle). Statisti-cal tools were used to evaluate and compare the results at each tablet position.
EXPERIMENTALApparatus
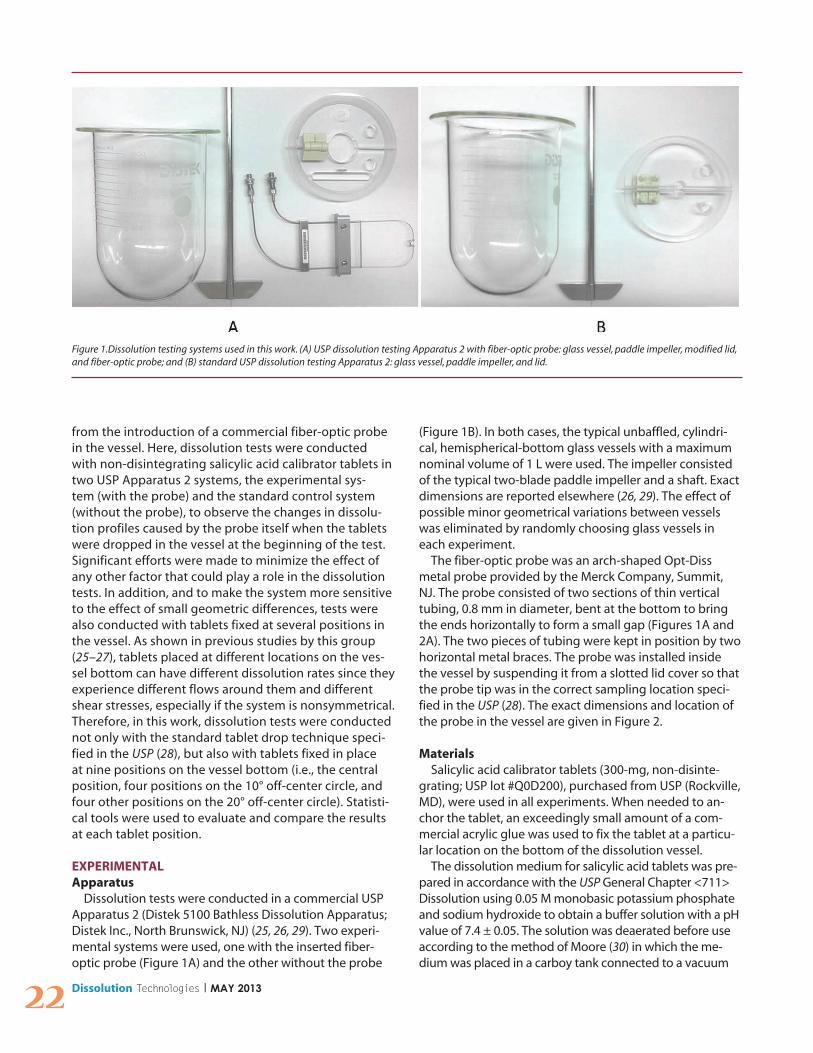
Dissolution tests were conducted in a commercial USP Apparatus 2 (Distek 5100 Bathless Dissolution Apparatus; Distek Inc., North Brunswick, NJ) (25, 26, 29). Two experi-mental systems were used, one with the inserted fiber-optic probe (Figure 1A) and the other without the probe
(Figure 1B). In both cases, the typical unbaffled, cylindri-cal, hemispherical-bottom glass vessels with a maximum nominal volume of 1 L were used. The impeller consisted of the typical two-blade paddle impeller and a shaft. Exact dimensions are reported elsewhere (26, 29). The effect of possible minor geometrical variations between vessels was eliminated by randomly choosing glass vessels in each experiment.
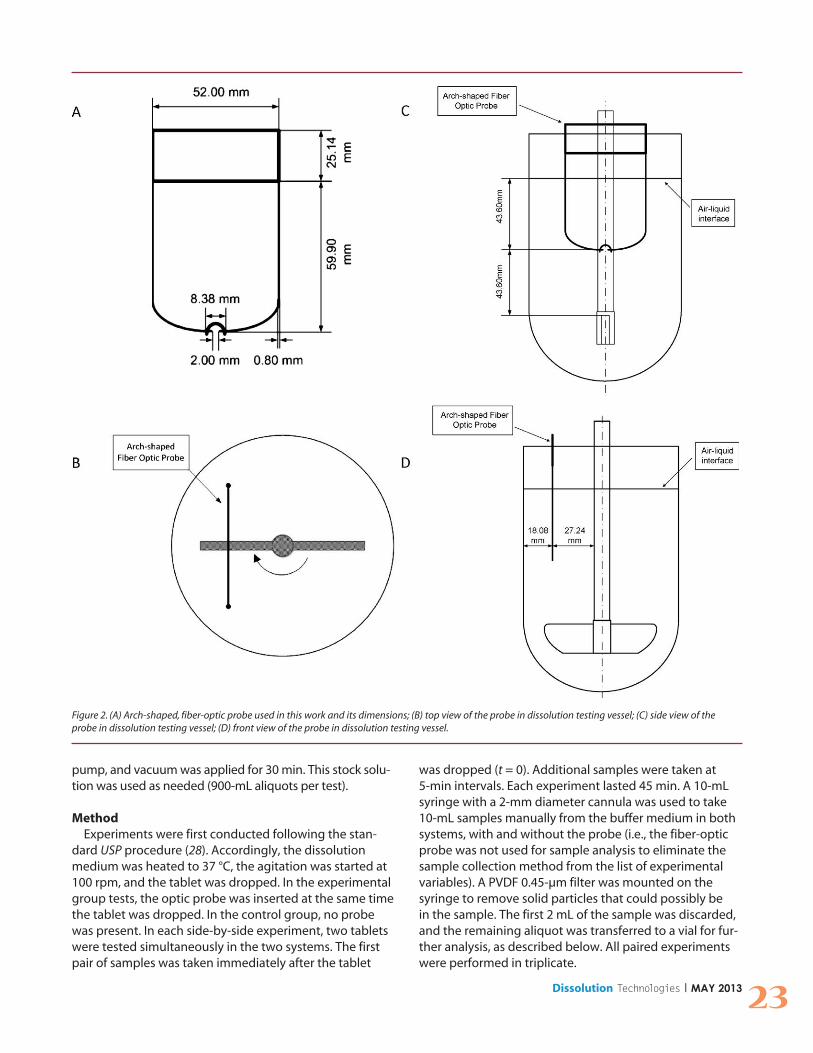
The fiber-optic probe was an arch-shaped Opt-Diss metal probe provided by the Merck Company, Summit, NJ. The probe consisted of two sections of thin vertical tubing, 0.8 mm in diameter, bent at the bottom to bring the ends horizontally to form a small gap (Figures 1A and 2A). The two pieces of tubing were kept in position by two horizontal metal braces. The probe was installed inside the vessel by suspending it from a slotted lid cover so that the probe tip was in the correct sampling location speci-fied in the USP (28). The exact dimensions and location of the probe in the vessel are given in Figure 2.
MaterialsSalicylic acid calibrator tablets (300-mg, non-disinte-
grating; USP lot #Q0D200), purchased from USP (Rockville, MD), were used in all experiments. When needed to an-chor the tablet, an exceedingly small amount of a com-mercial acrylic glue was used to fix the tablet at a particu-lar location on the bottom of the dissolution vessel.
The dissolution medium for salicylic acid tablets was pre-pared in accordance with the USP General Chapter <711> Dissolution using 0.05 M monobasic potassium phosphate and sodium hydroxide to obtain a buffer solution with a pH value of 7.4 ± 0.05. The solution was deaerated before use according to the method of Moore (30) in which the me-dium was placed in a carboy tank connected to a vacuum
Figure 1.Dissolution testing systems used in this work. (A) USP dissolution testing Apparatus 2 with fiber-optic probe: glass vessel, paddle impeller, modified lid, and fiber-optic probe; and (B) standard USP dissolution testing Apparatus 2: glass vessel, paddle impeller, and lid.
Dissolution Technologies | MAY 2013 23
pump, and vacuum was applied for 30 min. This stock solu-tion was used as needed (900-mL aliquots per test).
MethodExperiments were first conducted following the stan-
dard USP procedure (28). Accordingly, the dissolution medium was heated to 37 °C, the agitation was started at 100 rpm, and the tablet was dropped. In the experimental group tests, the optic probe was inserted at the same time the tablet was dropped. In the control group, no probe was present. In each side-by-side experiment, two tablets were tested simultaneously in the two systems. The first pair of samples was taken immediately after the tablet
was dropped (t = 0). Additional samples were taken at 5-min intervals. Each experiment lasted 45 min. A 10-mL syringe with a 2-mm diameter cannula was used to take 10-mL samples manually from the buffer medium in both systems, with and without the probe (i.e., the fiber-optic probe was not used for sample analysis to eliminate the sample collection method from the list of experimental variables). A PVDF 0.45-µm filter was mounted on the syringe to remove solid particles that could possibly be in the sample. The first 2 mL of the sample was discarded, and the remaining aliquot was transferred to a vial for fur-ther analysis, as described below. All paired experiments were performed in triplicate.
Figure 2. (A) Arch-shaped, fiber-optic probe used in this work and its dimensions; (B) top view of the probe in dissolution testing vessel; (C) side view of the probe in dissolution testing vessel; (D) front view of the probe in dissolution testing vessel.

24 Dissolution Technologies | MAY 2013
Additionally, a separate group of experiments was conducted in which the tablets were not dropped into the medium but instead glued on the bottom of the ves-sel before the beginning of the test. This approach was similar to that previously described (29) and was used here to determine the sensitivity of the tablet dissolution process to tablet location, as when the tablet sticks to the vessel bottom during the dissolution process. Therefore, the experimental procedure was slightly modified from that specified in the USP since the tablets had to be glued on the bottom of the vessel before beginning the test. Before the experiment, two tablets were fixed with a very small bead of glue in the same position in both setups (i.e., in the standard system without the probe and in the experimental system with the fiber-optic probe inserted). The probe system was nonsymmetrical since the probe was sitting on one side of the vessel. Therefore, nine different tablet locations were investigated, as shown in
Figure 3. Tablets in Position O were at the center of the vessel bottom. Tablets in Positions A1, B1, C1, and D1 were on the inner circle 10° off center from the vessel vertical centerline. Tablets in Positions A2, B2, C2, and D2 were 20° off center on the same outer circle. Positions on the same circles were spaced 90° apart from one other. In each experiment, two tablets at the same positions were tested simultaneously in the two systems. After the vessels with the attached tablets were properly setup in the Distek system, 900 mL of deaerated buffered medium, preheated to 37.5 °C, was poured gently along the vessel wall with the help of a plastic funnel to minimize gas introduction and to reduce dissolution of the tablet before the test started. Because of the heat loss during the liquid transfer into the vessels, the resulting buffer solution temperature was 37 °C. Throughout the dissolution test, the tempera-ture was maintained at 37 °C by the system temperature controller. The agitation at 100 rpm was started immedi-ately after pouring the dissolution medium, the probe was inserted in the experimental system, and a stopwatch was started simultaneously. The first pair of samples was taken at this time (t = 0). Additional samples were collected at 5-min intervals for 45 min, as described above. Again, trip-licate paired experiments were conducted for all positions.
Sample analysis was carried out using 1-cm quartz cells placed in a UV spectrophotometer (Cole Parmer S2100UV+; Cole Parmer, Vernon Hills, Illinois), measuring absorbance at 296 nm, specified for salicylic acid in USP. The cell was rinsed three times with the sample solution before it was filled with sample solution. Sample absor-bance was converted to concentration using a calibration curve previously obtained by preparing standard solutions of different known concentrations. The absorbance-vs.-concentration calibration curve was linear (R2 = 0.9998).
Data AnalysisThe mass fraction of drug dissolved in the medium at
any time t relative to initial total tablet drug amount, mD/mT, was calculated from the concentration data and plot-ted as a function of time. The amount of drug removed during sampling and not replaced was accounted for in the calculations.
The dissolution profiles for both systems with and without the probe were statistically compared using the paired Student’s t-test equations to determine if the dis-solution profiles were statistically similar to one other (null hypothesis). The corresponding t-test equations are as follows (31):
where is the sample mean (the average of the dif-ferences between curves at the same time t), µ0 is the
Figure 3. (A) Top view of the bottom of the dissolution vessel with the locations of the nine different tablet positions used in the testing system; (B) Side view of the bottom of the dissolution vessel with three different tablet positions (0°, 10°, and 20°) in the standard system.

Dissolution Technologies | MAY 2013 25
population mean (the average difference between the profiles; i.e., µ0 = 0 here if the null hypothesis is correct), SD is the sample standard deviation (the standard devia-tion of the differences between curves), n′ is the number of samples (equal to 9 since each profile consisted of 10 points but the initial data point at t = 0 was not used), and DF is degrees of freedom (equal to 8 here). The T-value significance was chosen here to be 0.05 (i.e., if the T-value, P(t-test), was smaller than 5%, the null hypothesis was re-jected), and the two groups of dissolution data (with and without the probe) were considered statistically different.
In addition, the similarity of the two dissolution profiles was also determined using the FDA-recommended ap-proach consisting of a model-independent method based on the difference factor (f1) and the similarity factor (f2) proposed by Moore and Flanner (32):
where Rt is the reference assay at time t (in this case the standard system), Tt is the test assay (in the probe system), and n is the number of samples. The value of f1 is in the range 0–100. High f1 values are associated with large aver-age differences between the experimental and control
Figure 4. Dissolution profiles for experiments in the presence and absence of the fiber-optic probe with (A) tablets dropped according to USP proce-dure and (B) tablets in Position O.
Table 1. Probability Associated with Paired t-Test (P(t-Test)), Difference Factor (f1), and Similarity Factor (f2) for Average Dissolution Profiles (Drug Release Mass Ratio, md/mt, vs. Time) Obtained with and Without the Fiber-Optic Probe
Tablet Position Tablet Off-center Angle P(t-test) f1 f2
Dropped Tablet USP procedure 0.00007 5.64 93.22
O 0° 0.00021 8.91 90.27
A1 10° 0.00030 14.92 78.08
B1 10° 0.00186 11.53 80.54
C1 10° 0.00067 10.16 85.39
D1 10° 0.53083 1.11 99.12
A2 20° 0.00038 13.17 77.55
B2 20° 0.00335 3.64 94.54
C2 20° 0.00071 1.66 98.70
D2 20° 0.00511 1.93 93.22
26 Dissolution Technologies | MAY 2013
profiles. The f2 value is a logarithmic transformation of the sum-squared error of the differences between the dis-solution curves. High f2 values are associated with small average differences between the experimental and con-trol profiles. Statistical similarity between the two curves requires that 0< f1 <15 or 50 < f2 <100 (32, 33).
RESULTSThe effect of the probe on dissolution was obtained by
comparing each pair of dissolution profiles for all cases studied here. The average mD/mT values for each triplicate experimental pair of dissolution profiles were calculated and plotted as a function of time.
Dissolution Profiles for Dropped TabletsThe dissolution profiles obtained using the USP pro-
cedure in which the tablets were dropped in the vessel at the beginning of the experiment are shown in Figure 4A. The percentage drug release was systematically higher in the system with the probe than in the standard system without the probe, although the difference was typically only about 1%. At t = 45 min, the mD /mT ratio was 30.4% with the probe and 29.3% without the probe. The average standard deviations are 0.82% and 0.36%, respectively. The f1 and f2 values are 5.64 and 93.22,
respectively, which are within the FDA requirement (Table 1). However, the P(t-test) value is 0.00007, which is significantly lower than 0.05, indicating that the two dis-solution profiles are statistically different, although the difference between them is small.
Dissolution Profiles for Centrally Positioned TabletsThe dissolution profiles for tablets fixed at the center
of the vessel bottom (Position O) are presented in Fig-ure 4B. For this case, the percentage of dissolved drug is also higher in the system with the probe throughout the whole experiment (average difference ≈ 1.5%). The final difference in drug released at 45 min is close to 2%. The average standard deviations for each profile are 0.93% and 1.29%, respectively. The results of the t-test (P(t-test) = 0.00021; Table 1) indicate that the two curves came from different populations, although the f1 and f2 values are 8.91 and 90.27, respectively, both of which are in the recommended FDA range.
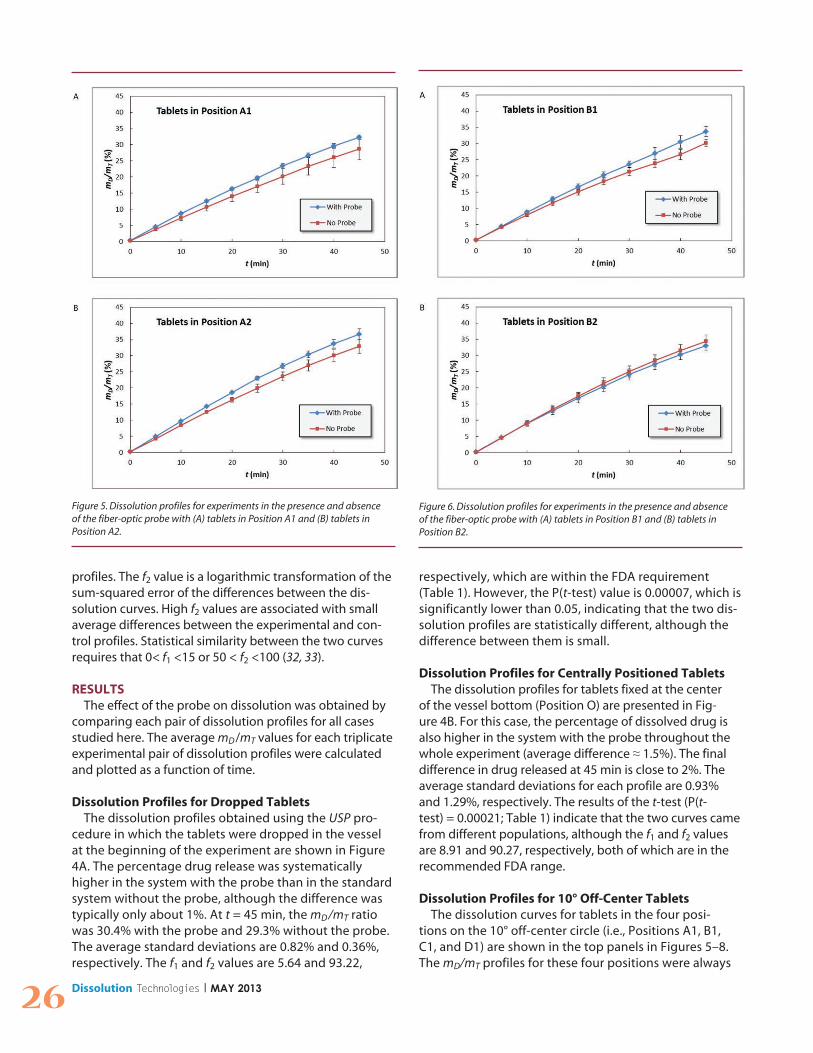
Dissolution Profiles for 10° Off-Center TabletsThe dissolution curves for tablets in the four posi-
tions on the 10° off-center circle (i.e., Positions A1, B1, C1, and D1) are shown in the top panels in Figures 5–8. The mD/mT profiles for these four positions were always
Figure 5. Dissolution profiles for experiments in the presence and absence of the fiber-optic probe with (A) tablets in Position A1 and (B) tablets in Position A2.
Figure 6. Dissolution profiles for experiments in the presence and absence of the fiber-optic probe with (A) tablets in Position B1 and (B) tablets in Position B2.

Dissolution Technologies | MAY 2013 27
higher than for Position O (centered position), irrespec-tive of the presence of the probe. Typically, mD/mT was about 28–31% for the 10° off-center tablets, while it was 22–24% for the centered tablet. Figures 5A–7A show that the presence of the probe resulted in dissolution profiles that were appreciably different from the corre-sponding profiles obtained without the probe. However, the magnitude of the difference between the curves in each panel depended on tablet position. The dissolution curves were independent of the presence of the probe only for the tablet positions just before the probe (Posi-tion D1).
The dissolution curves for tablets in Position A1 were consistently higher when the probe was present than when it was not, with average differences of about 3–4% (Figure 5A–D). This is consistent with the fact that this position is immediately downstream of the first vertical element of the probe and the closest to the probe. The values of the P(t-test), f1, and f2 reinforced this observa-tion. In particular, the f1 value (14.92) was very close to 15, the upper limit for acceptance (Table 1). Position B2, immediately downstream of the whole probe, was the second position most significantly affected by the probe for tablets on the 10° circle. The presence of the probe resulted in faster dissolution rates, with differences
between the curves on the order of 3–4% and values of P(t-test), f1, and f2 consistent with this effect (Table 1). Tablets in Position C1 on the other side of the probe were less affected by the probe, as shown in Figure 7A and by the values of f1 and f2. Finally Tablets in Position D1 (Figure 8A), the most downstream with respect to the probe, were nearly unaffected by the presence of the probe. This was confirmed by the large value of the P(t-test), the very small value of f1, and large value of f2 (Table 1). In fact, the two curves in Figure 8A are nearly superimposable.
The results for all of the four positions can be ex-plained by the concept that the turbulence effects gen-erated by the rotating fluid as it moves past the probe propagates tangentially (i.e., downstream of the probe). This hydrodynamics effect was large for Position A1 since it was the first position downstream of the probe and the closest one. This turbulence effect propagated downstream tangentially, but with decreasing intensity, through Positions B1 and C1. When these disturbances reached Position D1, they had little impact on dissolu-tion. This effect can be clearly seen by examining Figures 5A–8A, as well by observing the decreasing values of f1 and the increasing values of f2 (Table 1) as one moves tangentially and clockwise with the flow (Figure 3).
Figure 7. Dissolution profiles for experiments in the presence and absence of the fiber-optic probe with (A) tablets in Position C1 and (B) tablets in Position C2.
Figure 8.Dissolution profiles for experiments in the presence and absence of the fiber-optic probe with (A) tablets in Position D1 and (B) tablets in Position D2.

28 Dissolution Technologies | MAY 2013
Dissolution Profiles for 20° Off-Center TabletsThe dissolution profiles for the four positions (i.e., Posi-
tion A2, B2, C2, and D2) on the 20° off-center circle are shown in Figures 5B–8B. The difference between dissolu-tion profiles was larger for Position A2 (3–4%) than for any other position downstream. No significant difference could be observed for Positions B2, C2, and D2. In some of these runs, the dissolution curves for the systems with the probe were identical or even lower than those without the probe.
A comparison of the results for tablets on the 20° circle with those at 10° off center indicates that mD/mT curves for tablets on the outer circle are larger than those for tablets on the inner circle. Typically, the final mD/mT value was about 33–39% for these 20° off-center tablets, while it was 27–33% for the 10° off-center tablets. However, such a comparison also shows some similarities. At Positions A1 and A2 (i.e., at the same azimuthal [tangential] location on different circles), the rotating fluid downstream of the first vertical element of the probe produced higher differences between systems with and without the probe. This dif-ference was still evident for tablets at other downstream locations on the inner circle but was not significant for tablets on the outer circle.
DISCUSSIONBy examining the totality of the results obtained in this
work (Figures 4–8), one can conclude that, in general, the presence of the fiber-optic probe can potentially have an effect on the dissolution process. The experimental results presented here show that salicylic acid tablets in systems with a probe have dissolution profiles that are consis-tently higher than those obtained in standard systems without a probe, although for some tablets located on the outer 20° circle (Positions B2, C2, and D2), the dissolution profiles with and without the probe were almost identi-cal. The magnitude of the dissolution enhancement effect generated by the probe depends on how the process is conducted and the exact location of the tablet during the dissolution process.
Irrespective of whether the probe was present or not, the dissolution profiles for tablets on the outer 20° circle were higher than those on the inner 10° circle, which in turn were higher than those for tablets fixed at the central position. This observation is consistent with previous work by this group (25–27, 34), which shows that the region just below the impeller is poorly mixed and that tablets located just outside this small region can experience a sig-nificantly higher flow and hence faster dissolution rates. However, the presence of the probe increased the dissolu-tion rate appreciably and more significantly when the tab-lets were closer to the center of the vessel than when they were away from it. For example, tablets fixed at the center of the vessel exhibited a percent dissolution that was about 1–2% larger with the probe than without it. This increase is appreciable considering that the final percent
dissolution of the tablets at 45 min was about 22–24% and that it can be exclusively attributed to the presence of the probe. These differences in dissolution profiles could not be attributed to data scatter since the average standard deviation was relatively small (i.e., 0.93% and 1.29% with and without probe, respectively). This increase in dissolu-tion was even more significant for tablets downstream of the probe on the 10° circle. The percent dissolution for tablets in Position A1 (i.e., closest to the probe) was about 3–4% larger with the probe than without. Similar but smaller increases were observed for tablets further downstream of the probe (Positions B1 and C1), although the probe effect was reduced for Position D1. On the 20° circle, the probe effect could still be observed but was typically much smaller except for Position A2, which was the closest to the probe.
The dissolution profiles for tablets dropped in the vessel according to the USP-recommended method were also af-fected by the presence of the probe. During these experi-ments, one could clearly observe that the tablets typically remained close to the central position, although they also moved periodically to the 10° off-center circle. This movement can be expected to result in higher dissolution profiles, which were in fact found here to be intermedi-ate between those for the central position and those on the 10° circle. The results in Figure 4A show that dropped tablets typically produced an absolute increase of about 1% in mD/mT caused by the presence of the probe, which represents a measurable increase over the baseline with-out the probe.
For most of the cases examined here, and especially for those cases that were more sensitive to the presence of the probe and presented the largest differences between curves with and without the probe, the values of the P(t-test) were smaller than the 0.05 value selected as the lowest value to identify statistical similarity (Table 1). This implies that in those systems, the dissolution profiles with and without the probe were statistically different (i.e., the results obtained in those paired experiments were un-likely to belong to the same underlying population). The P(t-test) does not require that the difference between the two population be necessarily large, but only that such difference be significant enough with respect to variations associated with the experimental error (and captured by the standard deviation) to manifest itself consistently. In some cases the magnitude of this difference was small (e.g., in many of the positions on the 20° circle), while in others the presence or absence of the probe caused relatively large differences between the dissolution curves (e.g., Positions A1 and A2).
In all cases, the values of the FDA-recommended similarity factor f1 and difference factor f2 were within the suggested range, indicating that the effect introduced by inserting the probe, although statistically observable, was not significant enough to fail the dissolution test. However, for positions where the dissolution process was

Dissolution Technologies | MAY 2013 29
more significantly affected by the probe such as Positions A1 and B1, higher f1 and smaller f2 values were obtained, which were appreciably closer to the acceptance limits (Table 1). This work indicates that there is an increased risk of enhanced dissolution profiles when fiber-optic probes are used. Therefore, routine verification checks of dissolu-tion results obtained with probes and through manual sampling should be performed.
It should be noted that the measureable impact on dissolution observed in this work was caused by an extremely small probe consisting of two vertical ele-ments only 0.8 mm in diameter. The probe was inserted in the medium by only 43.60 mm (i.e., it was located in the upper portion of the solution), whereas the tablets were on the bottom of the vessel. This fact points to the extreme sensitivity of USP Apparatus 2 to small geomet-ric changes in the system. The reasons for these effects are likely to reside in the changes to the vessel hydrody-namics introduced by the probe. Two related phenom-ena may be at work here. Firstly, the vertical elements of the probe can act as small “baffles” in the rotating fluid, disrupting the smooth tangential flow generated by the impeller and producing an enhanced dissolution rate. This phenomenon is well known and amply described (35, 36). Secondly, the presence of a single probe on only one side of the vessel introduces a small asymmetry in an otherwise symmetrical system. Previous studies have shown that Apparatus 2 is very sensitive to any devia-tion from symmetry (25–27, 34, 37). The small asymmetry caused by the probe can result in a nonsymmetrical flow, thus enhancing mixing effects. The combined effects of the baffling and asymmetry can generate a small but appreciable flow difference, especially in the region near the bottom of the vessel where the tablet resides and where the flow has been shown to be particularly weak (25, 27) and easily affected by small geometric changes. Hence, higher dissolution rates can be expected when the probe is used, as shown here for most tablet posi-tions. Recently, a modification of the existing Apparatus 2, called “OPI” for “Off-center Paddle Impeller,” has been proposed in which the impeller is placed off center with respect to the vertical centerline in the vessel (29). Previ-ous dissolution tests conducted in this novel appara-tus have resulted in dissolution profiles that are quite insensitive to small geometric changes such as the tablet location. It is likely that the use of the OPI system could alleviate the sensitivity of the current Apparatus 2 to the presence of inserted probes.
CONCLUSIONSThe effect of an arch-shaped fiber-optic probe on disso-
lution was studied in a USP dissolution testing Apparatus 2 using non-disintegrating salicylic acid calibrator tablets that were either dropped in the vessel according to the USP procedure or fixed in place at nine different positions on the vessel bottom. In most cases, the presence of the
probe resulted in statistically significant increases in the dissolution curves with respect to the curves obtained without the probe, as assessed using a paired t-test ap-proach.
In general, tablets at or close to the center of the vessel were more significantly affected by the presence of the probe, and so were tablets located immediately down-stream of the probe. The magnitude of the absolute increase in the dissolution profiles for the most sensitive tablet positions was usually between 2% and 4%. With such differences, the value of the FDA-recommended difference (f1) and similarity (f2) parameters were always within their acceptance limits, although in some cases just barely for f1.
The findings of this work suggest that a comparison between the dissolution tests results obtained with per-manently inserted fiber-optic probes and those obtained through manual sampling should be conducted prior to the adoption of an automatic probe sampling protocol.
ACKNOWLEDGMENTThis work was partially supported through a grant from
the Merck & Co., whose contribution is gratefully acknowl-edged.
REFERENCES1. Bijlani, V.; Yuonayel, D.; Katpally, S.; Chukwumezie,
B. N.; Adeyeye, M. C. Monitoring Ibuprofen Release from Multiparticulates: In Situ Fiber-Optic Technique Versus the HPLC Method: A Technical Note. AAPSPharmSciTech 2007, 8 (3), Article 52, E1–E4.
2. Josefson, M.; Johansson, E.; Torstensson, A. Optical fiber spectrometry in turbid solutions by multivariate calibration applied to tablet dissolution testing. Anal. Chem. 1988, 60 (24), 2666–2671.
3. Wells, C. E. Effect of sampling probe size on dissolution of tableted drug samples. J. Pharm. Sci. 1981, 70 (2), 232–233.
4. Savage, T. S.; Wells, C. E. Automated sampling of in vitro dissolution medium: effect of sampling probes on dissolution rate of prednisone tablets. J. Pharm. Sci. 1982, 71 (6), 670–673.
5. Cox, D. C.; Furman, W. B.; Moore, T. W.; Wells, C. E. Guidelines for dissolution testing: an addendum. Pharm. Technol. 1984, 8 (2), 42–46.
6. Aldridge, P. K.; Kostek, L. J. In Situ Fiber Optics Dissolution Analysis. Dissolution Technol. 1995, 2 (4), 10–11.
7. Cho, J. H.; Gemperline, P. J.; Walker, D. S. Wavelength Calibration Method for a CCD Detector and Multi-Channel Fiber Optic Probes. Appl. Spectrosc. 1995, 49, 1841–1845.
8. Cho, J. H.; Gemperline, P. J.; Salt, A.; Walker, D. S. UV/Visible Spectral Dissolution Monitoring by in Situ Fiber-Optic Probes. Anal. Chem. 1995, 67 (17), 2858–2863.
9. Schatz, C.; Ulmschneider, M.; Altermatt, R.; Marrer, S.; Altorfer, H. Manual In Situ Fiber Optic Dissolution

30 Dissolution Technologies | MAY 2013
Analysis in Quality Control. Dissolution Technol. 2000, 7 (2), 6–13.
10. Schatz, C.; Ulmschneider, M.; Altermatt, R.; Marrer, S.; Altorfer, H. Thoughts on Fiber Optics in Dissolution Testing. Dissolution Technol. 2001, 8 (2), 6–11.
11. Bynum, K.; Roinestad, K.; Kassis, A.; Pocreva, J.; Gehrlein, L.; Cheng, F.; Palermo, P. Analytical Performance of a Fiber Optic Probe Dissolution System. Dissolution Technol. 2001, 8 (4), 13–22.
12. Inman, G. W.; Wethington, E.; Baughman, K.; Horton, M. System Optimization for In Situ Fiber-Optic Dissolution Testing. Pharm. Technol. 2001, 25 (10), 92–100.
13. Nir, I.; Johnson, B. D.; Johansson, J.; Schatz, C. Application of Fiber-Optic Dissolution Testing for Actual Products. Pharm. Technol. 2002, 26 (3), 20–28.
14. Gray, V. Dissolution Testing Using Fiber Optics—A Regulatory Perspective. Dissolution Technol. 2003, 10 (4), 33–36.
15. Lu, X.; Lozano, R.; Shah, P. In-Situ Dissolution Testing Using Different UV Fiber Optic Probes and Instruments. Dissolution Technol. 2003, 10 (4), 6–15.
16. Wunderlich, M.; Way, T.; Dressman, J. B. Practical Considerations When Using Fiber Optics for Dissolution Testing. Dissolution Technol. 2003, 10 (4), 17–19.
17. Toher, C. J.; Nielsen, P. E.; Foreman, A. S.; Avdeef, A. In situ Fiber Optic Dissolution Monitoring of a Vitamin B12 Solid Dosage Formulation. Dissolution Technol. 2003, 10 (4), 20–25.
18. Inman, G. W. Quantitative Assessment of Probe and Spectrometer Performance for a Multi-Channel CCD-based Fiber Optic Dissolution Testing System. Dissolution Technol. 2003, 10 (4), 26–32.
19. Martin, C. A. Evaluating the Utility of Fiber Optic Analysis for Dissolution Testing of Drug Products. Dissolution Technol. 2003, 10 (4), 37–39.
20. Gray, V. Challenges to the Dissolution Test, including Equipment Calibration. Dissolution Technol. 2006, 13 (2), 6–9.
21. Liu, L.; Fitzgerald, G.; Embry, M.; Cantu, R.; Pack, B. Technical Evaluation of a Fiber-Optic Probe Dissolution System. Dissolution Technol. 2008, 15 (1), 10–20.
22. Muhammad, T.; Wang, J.; Li-wan, M.; Chen, J. Monitoring Dissolution Rate of Amiodarone Tablets by a Multiple Fiber-Optic Sensor System. Dissolution Technol. 2008, 15 (1), 22–27.
23. Mirza, T.; Liu, Q. J.; Vivilecchia, R.; Joshi, Y. Comprehensive validation scheme for in situ fiber optics dissolution method for pharmaceutical drug product testing. J. Pharm. Sci. 2009, 98 (3), 1086–1094.
24. Nie, K.; Li, L.; Li, X.; Zhang, Y.; Mu, X.; Chen, J. Monitoring Ambroxol Hydrochloride Sustained-Release Tablets
Release by Fiber-Optic Drug Dissolution In Situ Test System. Dissolution Technol. 2009, 16 (1), 14–17.
25. Bai, G.; Armenante, P. M. Hydrodynamic, mass trans-fer, and dissolution effects induced by tablet location during dissolution testing. J. Pharm. Sci. 2009, 98 (4), 1511–1531.
26. Bai, G.; Armenante, P. M. Velocity Distribution and Shear Rate Variability Resulting from Changes in the Impeller Location in the USP Dissolution Testing Apparatus II. Pharm. Res. 2008, 25 (2), 320–336.
27. Bai, G.; Armenante, P. M.; Plank, R. V.; Gentzler, M.; Ford, K.; Harmon, P. Hydrodynamic investigation of USP dis-solution test apparatus II. J. Pharm. Sci. 2007, 96 (9), 2327–2349.
28. The United States Pharmacopeia and National Formulary USP 35–NF 30; The United States Pharmacopeial Convention, Inc.: Rockville, MD, 2012.
29. Wang, Y.; Armenante, P. M. A novel off-center paddle impeller (OPI) dissolution testing system for reproduc-ible dissolution testing of solid dosage forms. J. Pharm. Sci. 2012, 101 (2), 746–760.
30. Moore, T. W. Dissolution Testing: A Fast, Efficient Procedure for Degassing Dissolution Medium. Dissolution Technol. 1996, 3 (2), 3–5.
31. Lapin, L. Statistics: Meaning and Method; Harcourt Brace Jovanovich, Inc.: New York, 1975.
32. Moore, J. W.; Flanner, H. H. Mathematical comparison of curves with an emphasis on in vitro dissolution pro-files. Pharm. Tech. 1996, 20 (6), 64–74.
33. Dissolution Testing of Immediate Release Solid Oral Dosage Forms; Guidance for Industry; U.S. Department of Health and Human Services, Food and Drug Administration, Center for Drug Evaluation and Research (CDER), U.S. Government Printing Office: Washington, DC, 1997.
34. Bai, G.; Wang, Y.; Armenante, P. M. Velocity profiles and shear strain rate variability in the USP Dissolution Apparatus 2 at different impeller agitation speeds. Int. J. Pharm. 2011, 403 (1–2), 1–14.
35. Akiti, O.; Yeboah, A.; Bai, G.; Armenante, P. M. Hydrodynamic effects on mixing and competitive reac-tions in laboratory reactors. Chem. Eng. Sci. 2005, 60 (8–9), 2341–2354.
36. Hemrajani, R. R.; Tatterson, G. B. Mechanically Stirred Vessels. In Handbook of Industrial Mixing: Science and Practice; Paul, E. L., Atiemo-Obeng, V. A., Kresta, S. M., Eds.; John Wiley & Sons: Hoboken, NJ, 2004; pp 345–390.
37. Tanaka, M.; Fujiwara, H.; Fujiwara, M. Effect of the Irregular Inner Shape of a Glass Vessel on Prednisone Dissolution Results. Dissolution Technol. 2005, 12 (4), 15–19.