Embed Size (px)
Citation preview

8/8/2019 May 2010 Geo-Heat Center Quarterly Bulletin
http://slidepdf.com/reader/full/may-2010-geo-heat-center-quarterly-bulletin 1/28
GEO-HEAT CENTER QUARTERLY BULLETIN
OREGON INSTITUTE OF TECHNOLOGY • KLAMATH FALLS, OREGON 97601-8801 • (541) 885-1750
VOL. 29 NO. 1 MAY 2010
ISSN 0276-1084
USA GeothermAl UpdAte
oIt CAmpUS development promoter pIpe wIth
downhole heAt exChAnGer

8/8/2019 May 2010 Geo-Heat Center Quarterly Bulletin
http://slidepdf.com/reader/full/may-2010-geo-heat-center-quarterly-bulletin 2/28
CONTENTS
Comments from the Editors ............................... 1
Te United States of America
Country Update 2010 ........................................ 2
John W. Lund, Karl Gawell, Tonya L. Boyd and Dan Jennajohn
Geothermal Uses and Projects on the
Oregon Institute of echnology Campus .......... 12
John W. Lund and Tonya “Toni” Boyd
Use of Promoter Pipes with Downhole Heat
Exchangers in Klamath Falls, Oregon .............. 18
Tonya “Toni” Boyd and John W. Lund
Oregon’s First Geothermal Combined Heat
and Power Plant Dedication ............................. 24
Kristina Hakanson Maupin and John W. Lund
PUBLISHED BY
GEO-HEA CENER Oregon Institute of echnology 3201 Campus Drive
Klamath Falls, OR 97601Phone: (541) 885-1750
Email: [email protected]
All articles for the Bulletin are solicited. If you wish to contribute
a paper, please contact the editor at the above address.
EDITORS
John W. Lund
Tonya “Toni” Boyd
Cover Design – SmithBates Printing & Design
WEBSITE:
http://geoheat.oit.edu
ACKNOWLEDGEMENT
This material is based upon work supported by the Department
of Energy (National Nuclear Security Administration) under
Award Number DE-EE0002741.
DISCLAIMER
This Bulletin was prepared as an account of work sponsored by
an agency of the United States government. Neither the United
States Government nor any agency thereof, nor any of their
employees, makes any warranty, express or implied or assumes
any legal liability or responsibility for the accuracy, completeness,
or usefulness of any information, apparatus, product or process
disclosed, or represents that its use would not infringe privately
owned rights. Reference herein any specic commercial product,
process, or service by trade name, trademark, manufacturer, or
otherwise does not necessarily constitute or imply endorsement
recommendation, or favoring by the United States Government
or any agency thereof.
SUBSCRIPTIONS
Te Bulletin is mailed free of charge. Please send your name andaddress to the Geo-Heat Center for addition to the mailing list.
If you wish to change your Bulletin subscription, please completethe form below and return it to the Geo-Heat Center.
Name _____________________________________________
Address ____________________________________________
City, State, Zip ______________________________________
Country ____________________________________________
Vol. 29 No. 1 MAY 2010
GEO-HEAT CENTER QUARTERLY BULLETINISSN 0276-1084
A Quarterly Progress and Development Report on the Direct Utilization of Geothermal Resources
Cover - Upper gure: Geothermal projects and resource areas in the United Sates
Lower Left Figure: Picture of the 280 kW binaryunit on the Oregon Institute of Technologycampus showing the turbine generator set on theevaporator.
Lower Right Figure: Promoter pipe withdownhole heat exchanger

8/8/2019 May 2010 Geo-Heat Center Quarterly Bulletin
http://slidepdf.com/reader/full/may-2010-geo-heat-center-quarterly-bulletin 3/28
1GHC BULLETIN, MAY 2010
COMMENTS FROM THE EDITORS
We are back!! Our last Quarterly Bulletin was the January
2008 issue (Vol. 28, No. 4). With a reduction in the USDOE
Ofce of Geothermal Technologies budget over the past
years, no funds were available to continue the publication of
the Bulletin. With the recent Stimulus Funds for geothermal
and an increase in the Ofce of Geothermal Technologies
budget, we have again been funded for at least three years topublish the Bulletin.
Much has happened in the past two years on campus. In
February of 2009 the drilling of a deep geothermal well on
campus was started (see article this issue). In just under 40
days, the well was drilled 5,300 ft (1,600 m) and intersection
the high angle (70˚) normal fault on the east side of campus.
We had hoped to reach around 300˚F (150˚C) geothermal
uids (based on geochemistry), but a subsequent pump test
produced only 196˚F (91˚C) water, and the well proved to be
isothermal over the entire length. Even though we only test
pumped the well to 1,500 gpm (95 L/s) with a 23-ft (7-m)
drawdown, it appears that we can pump up to 2,500 gpm (158
L/s) with only a 75-foot (23-m) drawdown. If this is proven and
we obtain the water rights for the higher amount, this ow
should be adequate for a 1.0 to 1.2 MWe (gross) binary power
plant, which we hope to install by 2012.
The second major event on campus was the installation and
commissioning of a 280 kW (gross) binary power plant (see
article this issue). The plant, installed in our heat exchange
building near our existing production wells, is a PureCycle¨
United Technology Corporation (UTC) unit (now under Pratt
and Whitney). The plant was delivered on campus in March
2009 and was dedicated in an ofcial ceremony April 20,
2010. It uses geothermal water from our existing wells, up to
600 gpm (38 L/s) at up to 196˚F (91̊ C), and uses a wet cooling
tower for the condenser water. The “waste water” is then used
to heat campus. The electricity from the plant can either be
used directly on campus or fed into the Pacic Power grid.
Much has happened to the original founders of the Geo-
Heat Center in 1975. Paul Lienau, the rst Director, passed
away on Camano Island, Washington on September 27, 2008
after a long bout with cancer. John Lund and Toni Boyd
attended his memorial service. Lars Svanevik has retired but
continues as an adjunct professor of chemistry and renewable
energy on campus. Unfortunately, he suffered a stroke in
December 2009 and is convalescing in Klamath Falls. Gene
Culver, retired for several years, continues to ranch and raisesheep and alpacas south of Klamath Falls. He also occasionally
helps with research projects at the Center. John Lund, after
working on campus for 43 years, both as a professor of Civil
Engineering and then as Director of the Center will retire in
June. Toni Boyd, who was hired 15 years ago, is still with the
Center as the Assistant Director. A Mechanical Engineer and
Program Manager will be hired and hopefully will be on
board in July. The Center is now part of the Oregon Renewable
Energy Center (OREC) established on campus in 2001. John
and Toni have been teaching geothermal classes for the new
Renewable Energy Engineer Bachelors degree that is offer
both at our Portland and Klamath Falls campuses.
In August of 2010, the Geo-Heat Center along with the
Geothermal Energy Association of Washington, D.C. held a
two-day geothermal conference and eld trip on campus. The
emphasis was on the direct utilization of geothermal energy,
with presentation by many local geothermal developers. Theeld trip visited the campus, the downtown district heating
system, and various agri-business applications at “Gone
Fishing” and the Liskey Ranch south of Klamath Falls. It was
attended by over 100 persons.
Both John and Toni were actively involved with the recent
World Geothermal Congress 2010 (WGC2010) that was held
in Bali, Indonesia in late April. Around 2,500 persons from
at least 85 countries attended the Congress, with over 1,000
papers and posters presented. John and Toni were involved
with ve papers, including the World Direct-Use Summary
and the U.S. Geothermal Summary (see paper this issue).
John was also convener of geothermal heat pump workshop
at the Congress, and his son Thomas (age 16) as the youngest
participant, presented a paper on the heating systems of the
three Klamath Falls schools he had attended. Toni presented
the other two papers published in this issue.
The Geo-Heat Center has received a number of contracts
recently that has helped to continue the operation of the
Center. These included:
“A Review of the Geothermal Resources Underlying
Glenwood Springs, Colorado and of the Technologies
Appropriate for Use in Their Potential Development” (a
feasibility study and nal report was prepared and submittedto the City of Glenwood Springs in September, 2009).
“Oregon Institute of Technology Geo-Heat Center” – a grant
from USDOE Ofce of Geothermal Technologies for
funding the drilling of the deep well and for the 1.0 to 1.2
MWe binary power plant. It also provides funding to
continue the operation of the Center
“National Geothermal Database” a contract to Boise State
University of which the Center is a subcontractor. This is
ve-year contract.
“The Potential Employment, Energy and Environmental
Impacts of Direct-Use Applications” a USDOE subcontractunder Bob Lawrence & Associates, Inc., Virginia. This is a
three-year contract, and includes providing technical
assistance and the publication of our Quarterly Bulletin.
“Geothermal Workforce Education Development and
Retention” to establish a geothermal training facility on the
University of Nevada, Reno campus. The Center is
subcontracted to provide the geothermal direct-use training.
This is a one-year contract with possible extensions.
The Editors

8/8/2019 May 2010 Geo-Heat Center Quarterly Bulletin
http://slidepdf.com/reader/full/may-2010-geo-heat-center-quarterly-bulletin 4/28
2 GHC BULLETIN, MAY 2010
THE UNITED STATES OF AMERICA COUNTRY UPDATE 2010 John W. Lund and Tonya L. Boyd, Geo-Heat Center, Oregon Institute of TechnologyKarl Gawell and Dan Jennejohn, Geothermal Energy Association, Washington, DC
1The total installed capacity number (3,048 MWe) closely parallelsestimates of recent reports such as the Geothermal Energy Associa-tions U.S. Geothermal Power Production and Development Updatewhich estimates installed capacity to be 3153 MWe (See Figure 2,page 6)
ABSTRACTGeothermal energy is used for electric power generation
and direct utilization in the United States. The presentinstalled capacity (gross) for electric power generation is
3,048 MWe1 (installed) with 2,024 MWe net (running)delivering power to the gird producing approximately16,603 GWh per year for a 0.62 gross capacity factor anda 0.94 net capacity factor. Geothermal electric power plantsare located in California, Nevada, Utah and Hawaii withrecent installation in Alaska, Idaho, New Mexico, Oregon,and Wyoming, with 514 MWe being added the last veyears. The two largest concentrations of plants are at TheGeysers in northern California and the Imperial Valley insouthern California. The Geysers continues to receivewaste water from Clear Lake and Santa Rosa, Californiathat is injected into the eld and has resulted in the recoveryof approximately 200 MWe of power generation. Thelowest temperature installed plant is at Chena Hot Springsin Alaska, where binary cycle plants uses 74˚C geothermaluids to run three units for a total of 730 kWe (gross). Withthe recent passing of the production tax credit by thefederal government (2.0 cents/kWh) and renewableportfolio standards requiring investments in renewableenergy, the annual growth rate for electric power generationover the past ve years is 3.7 percent. The direct utilizationof geothermal energy includes the heating of pools andspas, greenhouses and aquaculture facilities, space heatingand district heating, snow melting, agricultural drying,industrial applications and ground-source heat pumps. The
installed capacity is 12,611 MWt and the annual energyuse is 56,552 TJ or 15,709 GWh. The largest application isground-source (geothermal) heat pumps (84% of theenergy use), and the next largest direct-use is sh farmingand swimming pool heating. Direct utilization (withoutheat pumps) remained static over the past ve years withgains balancing losses; however, ground-source heatpumps are being installed at a 13% annual growth ratewith one million units (12 kW size) in operation. Theenergy saving from all geothermal energy use is about 7.3million tonnes of equivalent fuel oil per year (48.5 millionbarrels) and reduces air pollution by almost 6.6 milliontonnes of carbon and 18.8 million tonnes of CO2 annually
(compared to fuel oil).
INTRODUCTION
Geothermal resources capable of supporting electricalgeneration and/or direct use projects are found primarilyin the Western United States, where most of the recent
volcanic and mountain building activity have occurred(Figure 1). The San Andreas fault, running throughCalifornia from the Imperial Valley to the San Franciscoarea, and the subduction zone off the coast of northern
California, Oregon and Washington and Cascade volcanismare the source of much of the geothermal activity in theUnited States. However, geothermal (ground-source) heatpumps extend the utilization to all 50 states. The totalidentied potential for electrical production is estimated at21,000 MWe (above 150˚C) and 42 EJ (between 90˚ and150˚C) of benecial heat (Mufer, 1979), and a recentestimate by the U.S. Geological Survey estimates a meanprobability of electrical power generation from identiedgeothermal resources in12 western states during the next30 years of 8,866 MWe (USGS, 2008), which would nearlytriple the existing electrical capacity.
Achieving this electric capacity potential will bedependent upon a number of factors including competingprices for energy and incentive programs that encouragedevelopment of renewable energy resources. Recentlypassed Renewable Portfolio Standards (RPS) in a numberof states along with the extension of the Production Tax
Credit (PTC) by Congress to 2015, which provides a 2.0cent per kilowatt hour credit, have attracted developers tostart new projects. Other incentives are the recent stimulusfunds for geothermal energy, at US$400 million, approvedby Congress which will shortly be allocated for varioustypes of geothermal projects, along with a tax credit (30%of the cost up to US$1,500) for geothermal heat pumpinstallations under the 2005 Energy Policy Act andextended by the American Recovery and ReinvestmentAct of 2009. All of these measures will greatly improvegeothermal’s ability to compete with fossil fuel generation,
Figure 1: Geothermal resource map of the United States.
Source:UURI(EGI)
8/8/2019 May 2010 Geo-Heat Center Quarterly Bulletin
http://slidepdf.com/reader/full/may-2010-geo-heat-center-quarterly-bulletin 5/28
3GHC BULLETIN, MAY 2010
both for electrical energy and direct-use. The federalgovernment has also approved a 30% investment tax creditas a grant for commercial operation of power plants. Arecent report by the Energy Information Administration(EIA, 2009), conrms the continued growth of renewablesas fossil fuel use plummet and nuclear power stalls.
The United States continues to lead the world in installedgeothermal power capacity as well as in electrical
generations, and along with geothermal heat pumps, is oneof the leaders in direct-use applications. Geothermalenergy remains, however, a small contributor to the electricpower capacity and generation in the United States. In2009, geothermal plants constituted about 0.27 percent of the total operable power capacity, and those plantscontributed an estimated 0.48 percent of the totalgeneration.
Since the last U.S. Country Update was completed in2005 gross geothermal electrical production capacity hasincreased in the United States by approximately 514 MWeto a total an installed capacity of 3,047.66 MWe and a net
running capacity of 2,023.51 MWe due to derating of plants in The Geysers, for a gross capacity factor of 0.62and a net of 0.94. The low gross value is due to plants,especially in The Geysers, operating in a load followingmode rather than in a base load mode and due to a reductionin pressure and output of the steam eld. Total generationin 2007 was 14,974 GWh and the geothermal electricpower generation accounted for 4% of the total renewablebased electricity consumption in the United States. On astate level, geothermal electric generation is a major playerin California and Nevada. It is a minor source of power inthe other states. The generation in California providesabout 4.5% of the state’s energy consumption. It is also
signicant on the Big Island of Hawaii where it nowprovides approximately 20% of the electricity requirements.Recent projects have brought several new states into theelectricity “club”, including, Alaska, Idaho, New Mexico,Oregon and Wyoming. Alaska is most noted, as a 225 kWbinary cycle generator installed in 2006 uses the lowesttemperature geothermal uid in the world to produceelectricity at 74˚C, however, it should be noted that it alsohas 4˚C cooling water from a stream allowing for anacceptable “∆T” (Lund, 2006). The growth in installedcapacity during the 1980s was about 11 percent, however,from 1990-1998 it averaged only 0.14 percent due to a
leveling off of new plant construction, and from 2000 to2004 only approximately 70 MWe of new capacity wasadded. Since, 2005, the growth has been almost 20percent.
The period 1990-2004 also saw a reduction at TheGeysers geothermal eld in northern California from1,875 to around 1,529 MWe installed capacity and 945MWe running capacity. Today, the installed capacity is1,584 MWe and 844 MWe running capacity. This was dueto the closing of four units and a reduction in the steamavailability. Some capacity has been restored due to the
construction of two efuent pipelines, one from ClearLake and the other from Santa Rosa, that brings about72,000 tonnes of water per day (19 million gallons/day) toThe Geysers for injection. This has restored an estimated200 MWe of capacity to the eld.
Direct-use, other than geothermal heat pumps, hasremained static with increases being balanced by closingof some facilities. The main increases has been in
expanding the Boise City District Heating System from 48to 58 buildings; adding additional wells for space heatingin Klamath Falls; expanding the snow melting system onthe Oregon Institute of Technology campus from 316 m2to 3,753 m2, increasing the amount of aquaculture productbeing produced, mainly Tilapia; starting two biodieselplants; adding an absorption chiller for keeping the IceMuseum at Chena Hot Springs in Alaska intact during thesummer months, and adding additional space heating tothe Peppermill Casino in Reno. Losses have been theclosing of the district heating systems at the CaliforniaCorrectional Center (now using natural gas) and the NewMexico University heating system (due to difculty withmaintenance), and the closing of the Empire oniondehydration plant (due to competition with imported garlicfrom China) near Gerlach, Nevada.
Geothermal heat pumps have seen the largest growth,increasing from and estimated 600,000 to 1,000,000equivalent 12 kWt installed units. The estimated installationrate is from 100,000 to 120,000 units per year, or about a12 to 13 percent annual growth, with most of the growthtaking place in the mid-western and eastern states. A fewstates have tax rebate programs for geothermal heat pumps,and as mentioned above, Congress has established a taxcredit of 30% of costs up to $1,500 for installations.
Otherwise, there is little support for implementing direct-use projects.
Enhanced (Engineered) Geothermal Systems (EGS) isthe current R&D interest of the U.S. Department of Energy,Ofce of Geothermal Technologies as part of a revivednational geothermal program. EGS includes the earlier hotdry rock technology, but now includes any other method inwhich to improve geothermal reservoir performance. EGSis associated with both magmatic and high heat producingcrustal sources of geothermal energy commonly at depthsof about 4 to 5 km to reach 200˚C, but also havingapplications with normal gradient resources. However,
EGC projects are currently at an early experimentaldemonstration stage. Several technological challengesneed to be met for widespread efcient use of EGS. Thekey technical and economic changes for EGS over the nexttwo decades will be to achieve economic stimulation of multiple reservoirs with sufcient volumes to sustain longterm production, with low ow impedance, limited short-circuiting fractures and manageable water loss (Tester etal., 2006). Over the next 10 to 30 years, lessons learnedwhile deploying early EGS power plants can reasonably beexpected to facilitate wider, efcient deployment of EGS

8/8/2019 May 2010 Geo-Heat Center Quarterly Bulletin
http://slidepdf.com/reader/full/may-2010-geo-heat-center-quarterly-bulletin 6/28
4 GHC BULLETIN, MAY 2010
technologies for both power production and direct use, oras in Europe in a combined heat and power installation.One of the public relations problems associated with EGSprojects, is the generation of micro earthquakes (usually<3.5 on the Richter scale), that has slowed, threatened orshut down projects.
In a Massachusetts Institute of Technology (MIT)-ledassessment (Tester et al., 2006), the U.S. geothermal
resource was estimated to be 14 million EJ with atechnically extractable capacity of about 1,200 GWe todepths of 10 km. The report estimated that with reasonableinvestment in R&D, EGS could provide 100 GWe or moreof cost-competitive generating capacity in the next 50years. It further stated: “…EGS provides a secure sourceof power for the long term that would help protect Americanagainst economic instabilities resulting from fuel price
uctuations or supply disruptions.” Unfortunately, a currentproject near The Geysers has been placed on hold due tothe inferred generation of micro earthquakes affectingnearby residences.
PRODUCTION OF ELECTRICITY
Table 1 presents operable electric production capacityand power generation in the United States from all sourcesfor 2005-2008. All data in this table came from the USDOEEnergy Information Administration (EIA, 2009).
Geothermal power production is summarized in Table 2by plant and location. The total installed capacity in 2009was 3,048 MWe producing 16,603 GWh from a runningcapacity of 2,024 MWe. A total of 514 MWe has beeninstalled since the WGC2005 report, amounting to a 20percent increase or 3.7 percent annual increase.
Ref: www.eia.doe.gov
Table 1. Present and Planned Production of Electricity
Geothermal Fossil Fuel Hydro Nuclear Other Renewables Total
Capacity
MWe
Gross
ProdGWh/yr
Capacity
MWe
Gross
ProdGWh/yr
Capacity
MWe
Gross
ProdGWh/yr
Capacity
MWe
Gross
ProdGWh/yr
Capacity
MWe
Gross
ProdGWh/yr
Capacity
MWe
Gross
ProdGWh/yr
In Operation inDecember 2009
3,048 16,6 850,486 2,928 97,999 248.1 105,764 806.2 33,542 127.7 1,090,839 4,126.6
Under Construction inDecember 2009
0
Funds committed, butnot yet under construction inDecember 2009
4,239-6,643
132 projects
Total projected use by2015
7,482-9,676
Table 2. Utilization of Geothermal Energy for Electric Power Generation as of 31 December 2009
Locality Total Installed Capacity
MWe*
Total Running CapacityMWe*
Annual EnergyProduced 2009
GWh/yr
Total under Construction or Planned
MWe
ALASKA 0.73 1,626.80 3.94 50 – 95
CALIFORNIA 2,496.80 1,471.75 13,604.60 1,555 – 1,939
HAWAII 35 30.00 236.52 8
IDAHO 15.80 11.50 90.67 238 – 326
NEVADA 447.56 311.26 2,278.97 1,776 – 3,3
NEW MEXICO 0.24 0.15 0.54 20
OREGON 0.28 0.15 0.11 317 – 368
UTAH 51 43.00 387.54 272 – 332
WYOMING 0.25 0.15 0.48 0
Total 3,047.66 2,023.51 25,116 4,249 – 6,443* Installed capacity is maximum gross output of the plant; running capacity is the actual gross being produced.

8/8/2019 May 2010 Geo-Heat Center Quarterly Bulletin
http://slidepdf.com/reader/full/may-2010-geo-heat-center-quarterly-bulletin 7/28
5GHC BULLETIN, MAY 2010
INSTALLED & FUTURE CAPACITY UPDATE
Alaska
Alaska’s rst geothermal power plant came online in 2006in Chena Hot Springs. It is a small organic rankine cycle(ORC) unit (225 kWe gross) and produces electricity fromthe area’s low temperature (74 C̊) geothermal resource. Sincecoming online the power plant has added another 225 kWeunit as well as a 280 kWe unit, bringing total production
capacity to 730 kWe (gross).
Alaska currently has 70 to 115 MWe of planned geothermalproduction coming down the pipeline. Of projects withpotential to come online, the Southwest Alaska RegionalGeothermal Energy Project, 25 MWe, is in an exploratorydrilling and resource conrmation phase. Other notableprojects are Tongass (20 MWe), Unalaska (10–50 MWe),Pilgrim Hot Springs (10 MWe), and Chena Hot Springs II(5-10 MWe).
Arizona
Geothermal power production does not currently occur in
Arizona. However, the Arizona Public Service is currentlyplanning a 2 – 20 MWe development known as the Cliftongeothermal project. Also, although the scope of electricityproduction is not known, Northern Arizona University isplanning a geothermal plant for which they have federalfunding for drilling.
California
Current geothermal electricity production capacity inCalifornia is approximately 2,497 MWe. In 2007, 4.5% of California’s electricity generation came from geothermalpower plants, amounting to a net total of 13,605 GWh. The50 MWe North Brawley facility is the states most recentgeothermal power plant addition. Generally, geothermalpower generation remains concentrated in California withthe majority of production occurring at The Geysers in thenorth and Imperial Valley in the south.
California has approximately 1,841.8 – 2,435.8 MWe of planned geothermal resource production in various stages of development. Production drilling and facility constructionare underway at Western GeoPower Corp.’s Unit 1 (35 MWe)at The Geysers as well as CHAR, LLC’s Hudson Ranch I(49.9 MWe). Final permitting and PPA’s are being securedfor Ormat Technologies East Brawley project (30 MWe),Calpine Corporations Buckeye-North Geysers (30 MWe)
and Wildhorse-North Geysers (30 MWe) projects, andCalEnergy’s Black Rock 1, 2, and 3 units (53 MWe each)(California Energy Commission, 2009).
Colorado
Although there are no geothermal power plants currentlyproducing electricity in Colorado, Mount PrincetonGeothermal is currently conducting exploratory drilling andresource conrmation operations at its Mount Princeton HotSprings project site. Total capacity of the project is expectedto be 10 MWe once completed.
Florida
No geothermal power production is occurring in Florida atthis time. However, Quantum Resources Management, andPratt and Whitney (UTC Power) are in the early stages of developing a 200 kWe co-production geothermal powerproject. The project has the potential to produce 1 MWe of power.
Hawaii
There is only one geothermal power plant in all of Hawaii.Located on the big island, the Puna Geothermal Venturefacility has a 35 MWe nameplate capacity and delivers 25–35 MWe of energy on a continuous basis and supplies 20%of the electricity needs of the big island. Ormat is in theprocess of securing a PPA and nal permitting for an 8 MWeexpansion of its Puna project.
Idaho
Idaho’s rst geothermal power plant, Raft River, cameonline in January 2008. Raft River is a binary plant that usesa 150˚C resource and has a nameplate production capacity of
15.8 MWe. Current net production output is between 10.5and 11.5 MWe. US Geothermal is securing a PPA and nalpermitting for a 13 – 26 MWe expansion of the Raft Riverplant.
Another geothermal company, Idatherm, is developing anumber of projects throughout Idaho. Idatherm has begunexploratory drilling and resource conrmation operationsfor its Willow Springs project (100 MWe). It is also planningto develop its China Cap (100 MWe), Preston Area Project(50 MWe), and Sulfur Springs (25 – 50 MWe) resources, butis still in the process of conducting initial exploratory drillingand securing rights to resource. Total potential geothermal
production for Idaho is 238 to 326 MWe (Idaho Ofce of Energy Resources, 2009).
Nevada
In 2008 Nevada had 18 geothermal power plants with atotal nameplate capacity of 333 MW and with a total grossoutput of 10,791 MWh. In 2009 Nevada increased its installedgeothermal capacity with the addition of the Stillwater(ENEL, 47.3 MWe), Salt Wells (ENEL, 18.6 MWe), and theBlue Mountain “Faulkner 1” (Nevada Geothermal Power,49.5 MWe) power plants. Currently Nevada has moredeveloping projects than any other state and it is expectedthat gross capacity will increase signicantly in the future.
The following companies have begun production drillingand facility construction at various project sites: VulcanPower (Salt Wells, 175 – 245 MWe), Presco Energy (RyePatch, 13 MWe), and US Geothermal (San Emidio “Repower”Project, 8.4 MWe), Ormat (Jersey Valley, 18 – 30 MWe).Many other companies are in the process of securing PPA’sand nal permitting for a number of projects and othercompanies are in the early exploratory stages of developingnumerous geothermal resources. Nevada currently has 1,876to 3,473 MWe of geothermal capacity in development.(Nevada Bureau of Mines and Geology, 2009).

8/8/2019 May 2010 Geo-Heat Center Quarterly Bulletin
http://slidepdf.com/reader/full/may-2010-geo-heat-center-quarterly-bulletin 8/28
6 GHC BULLETIN, MAY 2010
New MexicoIn July 2008, a 0.24 MWe pilot installation project came
online at Burgetts Greenhouses near Animas. The pilotinstallation is part of a larger project known as LightningDock that aims to bring a 20 MWe capacity geothermalpower plant online in 2009.
Oregon
While there is only one small unit producing geothermalelectricity, signicant developments are forthcoming. TheOregon Institute of Technology (OIT) has installed a 280kW(gross) binary units and is currently producing power foruse on campus – the rst campus in the world to generate itsown power from a resource directly under campus. OIT hasalso completed production drilling of a 1,600-m deep welland will install a 1.0 to 1.2 MWe binary power unit by 2012using the 93ºC resource at 158 L/s. Davenport Power, U.S.Renewables Group, and Riverstone are securing a PPA andnal permitting for their 120 MW Newberry Geothermalproject as is Nevada Geothermal Power for its 40 – 60 MWeCrump Geyser project. U.S. Geothermal, Inc. successfully
completed the drilling of its second full sized productionwell at Neil Hot Springs (20 – 26 MWe) in October 2009.Overall there are 317.2 to 368.2 of potential geothermalpower capacity in planning in Oregon.
UtahCurrently, Utah has three power plants online. Unit 1 of
the Blundell Plant has a gross capacity of 26 MWe and Unit2 has a capacity of 11 MWe. Utah’s third power plant cameonline in December 2008 and was the rst commercialpower plant in the state in more than 20 years. The ThermoHot Springs power plant, a Raser Techologies operation,came online in 2009 and has a gross capacity of 14 MWe
and is expected to generate with a net capacity of approximately 10 MWe.
Shoshone Energy is currently working to secure a PPA aswell as other nal permitting for its 100 MW ShoshoneRenaissance Geothermal Project. ENEL North Americahas begun exploratory drilling and resource conrmationoperations at its Cove Fort (69 MWe) project site. Othercompanies have potential geothermal sites that are in theearly stages of planning/development and overall Utah has272.4 to 332.4 MWe of planned geothermal capacity forfuture production.
WashingtonAlthough Washington is not currently producing powerfrom any of its geothermal resources Vulcan Power isplanning to develop the Mt. Baker geothermal resource.AltaRock Energy is pursuing an EGS project in SnohomishCounty.
WyomingIn August 2008, a 250 kWe Ormat organic Rankine cycle
(ORC) power unit was installed at Rocky Mountain Oil TestSite and a month later it began operating. As of January
2009, the unit had produced more than 485 MWh of powerfrom 413,000 tonnes of hot water annually. The demonstrationproject will operate until September 2009. During itsoperation there will be an evaluation of how to reduceuctuations of power and to generate more than 250 kWe.
Figure 2. November 2009 Geothermal Power Capacity
Online (MW). Source: GEA
3153
2605.3
448.4
47 35 15 .8 0 .73 0. 28 0 .25 0. 240
500
1000
1500
2000
2500
3000
3500
T o t a l
C a p a
c i t y
C a l i f o
r n i a
N e v a
d a U t a h
H a w a
i i
I d a h o
A l a s k a
O r e g o
n
W y o m
i n g
N e w M
e x i c o
C a p a c i t y ( M W )
StatePhase I to Phase IV
(MWe)
TOTAL (withUnconfirmed)
(MWe)
Alaska 5/50 – 95 6/70 – 115
Arizona 1/2 – 20 1/2 – 20
California 32/1,554.9 – 1,938.9 37/1,841.8 – 2,435.8
Colorado 1/10 1/10
Florida 1/0.2 – 1 1/0.2 – 1
Hawaii 2/8 2/8
Idaho 5/238 – 326 5/238 – 326
Louisiana 0 1/.05
Mississippi 0 1/.05
Nevada 60/1,776.4 – 3,323.4 64/1,876.4 – 3,473.4
New Mexico 1/20 1/20
Oregon 13/317.2 – 368.2 13/317.2 – 368.2
Utah 10/272.4 – 332.4 10/272.4 – 332.4
Washington 1/Unspecified 1/Unspecified
Total132 Projects
4,249.1 – 6,442.9
144 Projects
4,699.9 – 7,109.9
Phase I: Indentify site, secured rights to resource, initial,exploration drilling. Phase II: Exploratory drilling andconfirmation underway; PPA not secured. Phase III: SecuringPPA and final permits. Phase IV: Production drilling underway;facility under construction. Unconfirmed: Proposed projects thatmay or may not have secured the rights to the resource, but someexploration has been done on the site. Source: GEA
Table 3. Developing projects by state.

8/8/2019 May 2010 Geo-Heat Center Quarterly Bulletin
http://slidepdf.com/reader/full/may-2010-geo-heat-center-quarterly-bulletin 9/28
7GHC BULLETIN, MAY 2010
GEOTHERMAL DIRECT UTILIZATION
BackgroundGeothermal energy is estimated to currently supply for
direct heat uses and geothermal (ground-source) heat pumps56,552 TJ/yr (15,709 GWh/yr) of heat energy in the United
States. The corresponding installed capacity is 12,611 MWt.Of these values, direct-use is 9,152 TJ/yr (2,542 GWh/yr)and 611 MWt, and geothermal heat pumps the remainder. Itshould be noted that values for the capacity and energysupplied by geothermal heat pumps are only approximate(and probably conservative) since it is difcult to determinethe exact number of units installed, and since most are sizedfor the cooling load, they are generally oversized in terms of capacity for the heating load.
Most of the direct use applications have remained constantor decreased slights over the past ve years; howevergeothermal heat pumps have increased signicantly. A total
of 20 new projects have come on line in the past ve years.Agricultural drying has decreased the most due to theclosing of the onion/garlic dehydration plant at Empire,Nevada. Two district heating projects have also shut down;the Litcheld Correctional Facility in California and theNew Mexico State University system. There have beenslight increase in snow melting, cooling and sh farming,with a major increase in industrial process heating due totwo biodiesel plants (Oregon and Nevada), a brewery(Oregon) and a laundry (California) coming on line. Insummary, when considering direct-use without geothermal
heat pumps, the distribution of annual energy use is asfollows: 34% for sh farming, 28% for bathing andswimming pool heating, 15% for individual space heating,9% for greenhouse heating, 8% for district heating, 3% foragricultural drying, 2% for industrial process heating, 1%for cooling and <1% for snow melting. Geothermal heatpumps accounts for 84% of the annual use, and has almostdouble (1.81 times) in the past ve years with a 13% annualgrowth rate.
Table 4. Utilization of Geothermal Energy for Direct Heat
as of 31 December 2009 (other than Heat Pumps)
Annual UtilizationLocality Type * Capacity(MWt)
Energy(TJ/yr)
CapacityFactor
Alaska H,G,B,C 7.8 156.2 0.63
Arkansas H 0.4 7.3 0.66
Arizona H,F,B 23.5 317.4 0.43
California D,H,G,F,B 105.1 2138.6 0.66
Colorado D,H,G,F,B 29.5 627.6 0.67
Georgia H,B 0.6 11.0 0.57
Idaho D,H,G,F,B 89.3 1429.1 0.51
Montana H,G,F,B 15.8 297.8 0.60
New Mexico D,H,G,F,B 38.7 335.7 0.28
Nevada D,H,F,A,B 74.8 1153.6 0.49
New York H,B 0.9 12.1 0.44
Oregon D,H,G,F,I,A,S,B 78.2 812.4 0.33
South Dakota D,H,F,B 66.3 577.6 0.28
Texas H,B 4.0 27.4 0.22
Utah H,G,F,B 45.8 449.9 0.31
Virginia H 0.3 3.1 0.30
Washington B 1.9 45.5 0.76
West Virginia B 0.1 3.7 0.80
Wyoming H,G,F,S,B 28.3 701.0 0.79
TOTAL 611.5 9,151.8 0.47
I – Industrial Process Heat; A – Agricultural Drying; F – FishFarming; S – Snow Melting; H – Individual Space Heating; D – District Heating; B – Bathing and Swimming; G – Greenhouse andSoil Heating
2600
2700
2800
2900
3000
3100
3200
M ar -0 6 No v- 06 M a y- 07 Jan -0 8 A u g- 08 M ar - 09 Oc t- 09
I n s t a l l e d C a p a c i t y ( M W )
34
51
69
83
97
132
121
0
20
40
60
80
1 00
1 20
1 40
Mar-06 Nov-06 May-07 Jan-08 Aug-08 Mar-09 O ct-09
N u m b e r o f P r o j e c t s
Figure 3. Total Installed Capacity 2006 – 2009. Source:
GEA
Figure 4. Total conrmed development project for
electricity power 2006-2009. Source: GEA
8/8/2019 May 2010 Geo-Heat Center Quarterly Bulletin
http://slidepdf.com/reader/full/may-2010-geo-heat-center-quarterly-bulletin 10/28
8 GHC BULLETIN, MAY 2010
Space Heating
Space heating of individual buildings (estimated at over2,000 in 17 states) is mainly concentrated in KlamathFalls, Oregon where about 600 shallow wells have beendrilled to heat homes, apartment houses and businesses.Most of these wells use downhole heat exchangers tosupply heat to the buildings, thus, conserving thegeothermal water (Culver and Lund, 1999). A similar useof downhole heat exchangers is found in the Moana area of Reno, Nevada (Flynn, 2001). Installed capacity is 140
MWt and annual energy use is 1,361 TJ (378 GWh).
District HeatingThere are 20 geothermal district-heating systems in the
United States, most being limited to a few buildings. Thenewest is a small project in northern California (Merrick,2002 and 2004). In this rural community of Canby,geothermal heat is used for heating buildings, a greenhouse,and most recently driers and washers in a laundry (Merrick,2009). The city system in Boise, Idaho has added 10buildings to their system and will be extended to Boise
State University next year. Klamath Falls system hasexpanded by adding a brewery and an additionalgreenhouse. Extensions have also been added for a futurecommercial develop on the edge of a local lake in town.The local hospital and Oregon Institute of Technologyhave both added new buildings to their systems (Lund andBoyd, 2009). Installed capacity is 75 MWt and annualenergy use is 773 TJ (215 GWh).
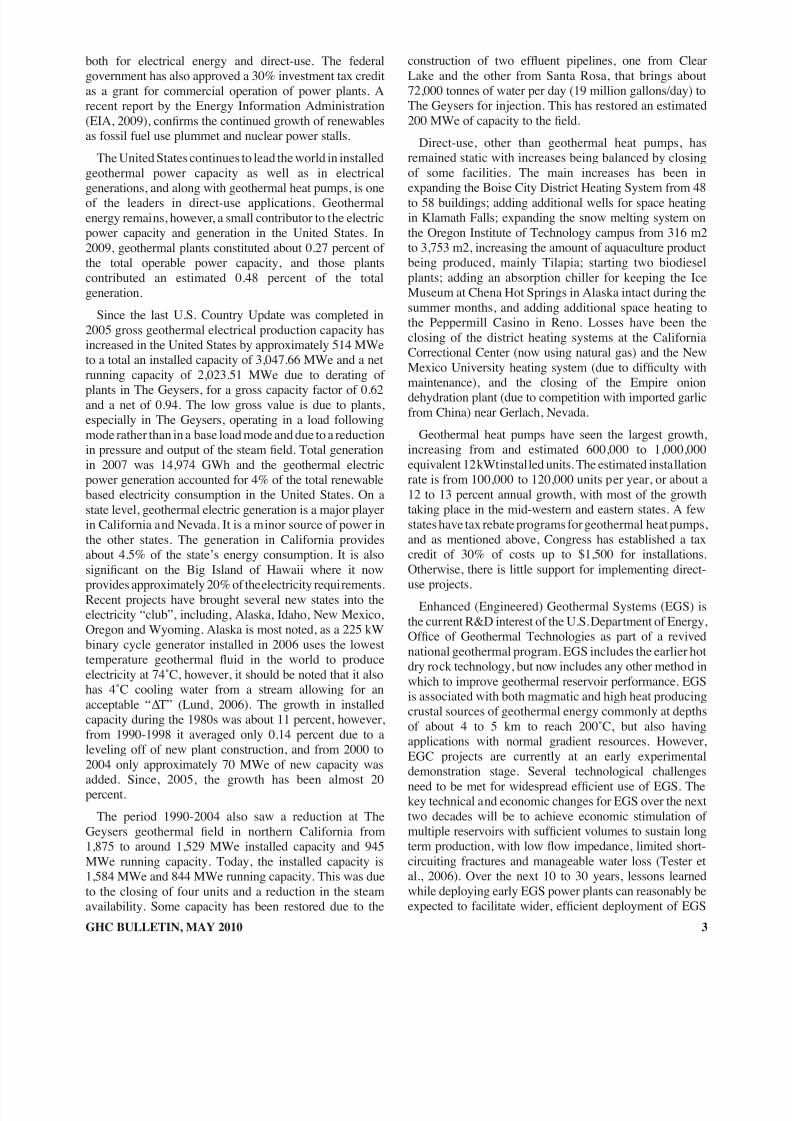
Table 5. Geothermal (Ground-Source) Heat Pumps as of 31 December 2009
Locality Ground or Water Temp.(oC)
Typical Heat PumpRating or Capacity
(kW)
Number of Units
Type * COP HeatingEquivalentFull LoadHr/Year
ThermalEnergyUsed
(TJ/yr)
CoolingEnergy(TJ/yr)
States
East: 20% 5-25 12.0 V=45% 3.5
Midwest: 34% 5-25 12.0 H=45% 3.5
South: 35% 5-25 12.0 W=10% 3.5
West: 11% 5-25 12.0 3.5
1,000,000 2,000 47,400 29,600
TOTAL 1,000,000 2,000 47,400 29,600
• V = vertical ground coupled; H = horizontal ground coupled; W = water source (well or lake water) ** Residential: V/H = 30%/70%, Commercial/
Industr ial: V/H = 90%/10%. Ref: www.eia.doe.gov
Use InstalledCapacity(MWt)
AnnualEnergy Use(TJ/yr = 1012
J/yr)
CapacityFactor
Individual Space Heating 139.89 1,360.6 0.31
District Heating 75.10 773.2 0.33
Air Conditioning (Cooling)* 2.31 47.6 0.50
Greenhouse Heating 96.91 799.8 0.26
Fish Farming 141.95 3,074.0 0.69
Agricultural Drying ** 22.41 292.0 0.41
Industrial Process Heat *** 17.43 227.1 0.41
Snow Melting 2.53 20.0 0.25
Bathing and Swimming **** 112.93 2,557.5 0.72
Subtotal 611.46 9,151.8 0.48
Geothermal Heat Pumps 12,000.00 47,400 0.13
Total 12,611.46 56,551.8 0.12
Table 6. Summary Table of Geothermal Direct Uses as of
31 December 2009
* Other than heat pumps; ** Includes drying or dehydration of grains,
fruits and vegetables; *** Excludes agricultural drying and dehydration;
**** Includes Balneology
0
2000
4000
6000
8000
10000
A n n u a l E n e r g y ( T J / y r )
1975 1980 1985 1990 1995 2000 2005 2010
Resor t /Spa Space Hea ti ng F ish Farming Greenhouse I ndus tri al
Figure 5 shows the direct-use development over the past 35
years, without heat pumps. A summary of direct-heat use by
category is presented in Table 6.
Figure 5. Direct-use growth in the United States.

8/8/2019 May 2010 Geo-Heat Center Quarterly Bulletin
http://slidepdf.com/reader/full/may-2010-geo-heat-center-quarterly-bulletin 11/28
9GHC BULLETIN, MAY 2010
Aquaculture Pond and Raceway HeatingThere are 51 aquaculture sites in 11 states using geothermal
energy. The largest concentration of this use is in the ImperialValley in southern California and operations along the SnakeRiver Plain in southern Idaho. There is a report that some of the facilities in the Imperial Valley have closed, but reliableinformation is lacking. A large facility at Kelly Hot Springs innorthern California has been expanding and now produces
slightly over half a million kg of tilapia annually. Two uniqueaquaculture related projects are in operation in Idaho andColorado – that of raising alligators (Clutter, 2002). Recenttrends in the U.S. aquaculture industry have seen a decline ingrowth due to saturation of the market and competition fromimports. Installed capacity is 142 MWt and annual energy useis 3,074 TJ (855 GWh).
Greenhouse Heating
There are 44 greenhouse operations in nine states usinggeothermal energy. These cover an area of about 45 ha, havean installed heat capacity of 97 MWt and an annual energyuse of 800 TJ/yr (222 GWh). The main products raised are
potted plants and cut owers for local markets. Some treeseedlings and vegetables are also grown in Oregon; howevervegetable raising is normally not economically competitivewith imports from Central America, unless they areorganically grown. One unusual greenhouse product, startedrecently, is spider mites grown on lima bean plants at LiskeyFarms south of Klamath Falls, Oregon. They are grown fortheir eggs which are then shipped south as feed for predatormites, which in turn are sold to farms to eat spider mites – acomplicated process, as the mites and eggs are almostmicroscopic in size and difcult to see (Northwest FarmCredit Services, 2009).
Industrial Applications & Agricultural DryingIndustrial applications have increased signicantly due to
the addition of two biodiesel plants (Oregon and Nevada).These plants primarily use geothermal energy for thedistillation of waste grease from restaurants, but one also usedcanola oil. Small industrial uses include clothes driers andwasher installed in Canby, California, and a brewery usingheat from the Klamath Falls district heating system forbrewing beer and heating the building (Chiasson 2006,Merrick, 2009). The main loss is the closing of an onion/garlicdehydration plant at Empire, Nevada due to competition withimported garlic from China. The installed industrial capacityfor these two applications is 40 MWt and the annual energyuse 519 TJ/yr (144 GWh/yr) with nine facilities located inthree states.
Cooling and Snow MeltingThe two major uses of geothermal energy are for pavement
snow melting, on the Oregon Institute of Technology (OIT)campus, and keeping the Aurora Ice Museum frozen year-round at Chena Hot Springs, Alaska. OIT has increase theircampus snow melt system from 316 m2 to 3,753 m2 and theammonia absorption chiller in Alaska keeps a 1,000 tonnesof ice frozen even though it reaches 32˚C outside in the
summer. Over 10,000 visitors a year visit the facility that hasa bar, beds and many ice sculptures (Holdman and Erickson,2006). The installed capacity for this application is 2.5 MWtand the annual energy use is 20 TJ/yr (6 GWh/yr).
Spas and Swimming Pools
This is one of the more difcult applications to quantifyand even to nd all the actual sites, as most owners do notknow their average and peak ow rates, as well as the inletand outlet temperatures. Most of the locations and some of the data, have come from a number of hot spring/spapublications available for most states. As a result, we oftenhave to estimate the capacity and energy use based on ourexperience with similar facilities. There are 242 facilities in17 states that we have identied, with an estimated installedcapacity of 113 MWt and annual energy use of 2,557 TJ/yr(711 GWh/yr).
Geothermal (Ground-Source) Heat Pumps
The number of installed geothermal heat pumps hassteadily increased over the past 15 years with an estimated
100,000 to 120,000 equivalent 12 kWt units installed this pastyear. Present estimates are that there are at least one millionunits installed, mainly in the mid-western and eastern states.The present estimates are that approximately 70% of the unitsare installed in residences and the remaining 30% incommercial and institutional buildings. Approximately 90%of the units are closed loop (groundcoupled) and the remainingopen loop (water-source). Within the residential sector, of theclosed loops systems, approximately 30% are vertical and70% horizontal, as the latter are cheaper to install. In theinstitutional and commercial sector, 90% are vertical andonly 10% horizontal, constrained by ground space in urbanarea. Presently, the ratio of new installation to retrot
installations is 3:1. The estimated full load hours in heatingmode is 2,000/yr, and in cooling mode is 1000/yr. Theinstallation cost is estimated at US$6,000 per ton (3.5 kWt)for residential and US$7,000 per ton (3.5 kWt) for commercial.The units are found in all 50 states and are growing 12 to 13%a year. It is presently a US$2 to US$3 billion annual industry.Even though the actual number of installed units is difcult todetermine, input has been provided from various industryrepresentatives for these estimates (personal communication:John Geyer, Warren (Trey) Austin, and Patrick Hughes,October, 2009, Dan Ellis, November 2009). The currentinstalled capacity is 12,000 MWt and the annual energy usein the heating mode is 47,400 TJ/yr (13,1678 GWh/yr). The
largest installation currently under construction is for BallState University, Indiana where 4,100 vertical loops are beinginstalled to heat and cool over 40 buildings.
Conclusions – Direct-Use
The distribution of capacity and annual energy use for thevarious direct-use applications are shown in Table 6 and arebased on records keep at the Geo-Heat Center. We estimatethat the estimates are anywhere from 10 to 20% underreported, due to their small sizes, lack of data and oftenisolated locations.
8/8/2019 May 2010 Geo-Heat Center Quarterly Bulletin
http://slidepdf.com/reader/full/may-2010-geo-heat-center-quarterly-bulletin 12/28
10 GHC BULLETIN, MAY 2010
The growth of direct use over the past ve years is all due tothe increased use of geothermal heat pumps, as traditionaldirect-use development has remained at as shown in Figure4. Unfortunately, there is little interest for direct-use at thefederal level, as their interests are mainly in promoting anddeveloping Enhanced (Engineered) Geothermal Systems(EGS). There are few incentives for the traditional direct-usedevelopment, but as mentioned earlier, there are tax incentivesfor geothermal heat pumps at the federal level and in somestates such as Oregon. Since, most direct-use projects aresmall, there are few, if any, developers and/or investors whoare interested in supporting these uses.
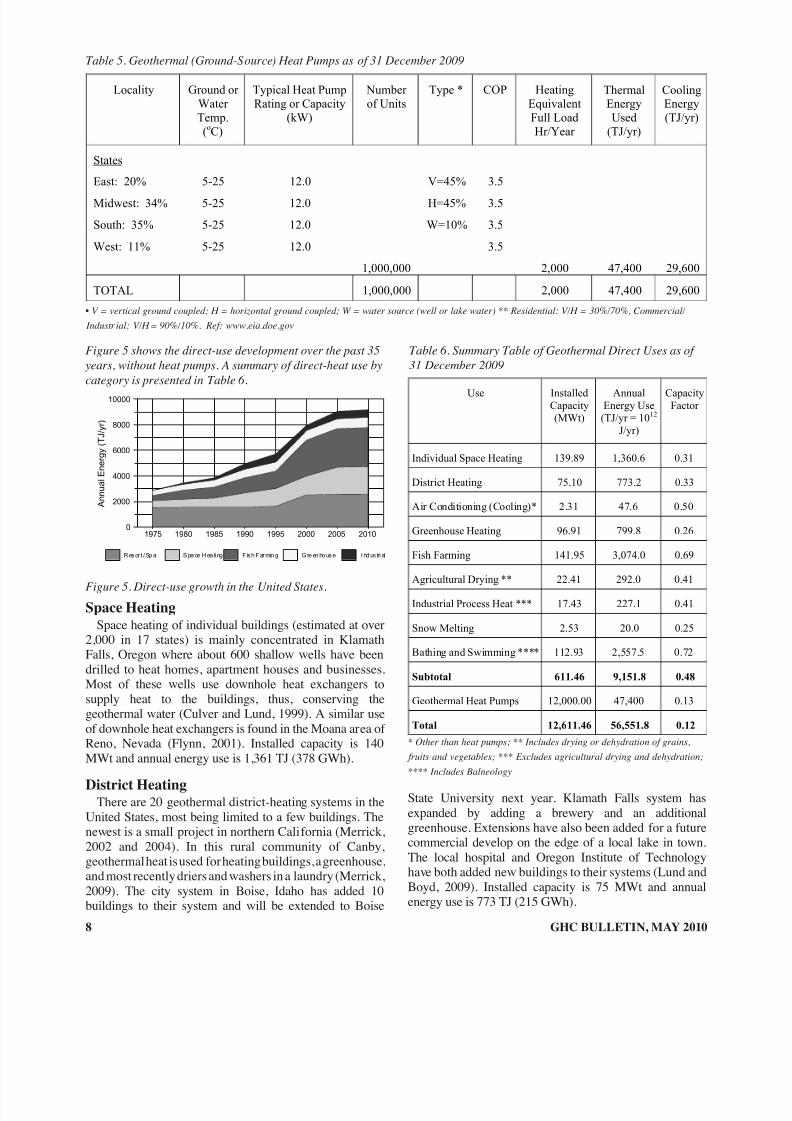
WELLS DRILLEDMost wells drilled for geothermal use were for power
generation. Assuming 3 MWe per well, and each approximately2,000 meters deep (deeper at The Geysers and shallower inNevada where most of the wells were drilled), the increase of 514 MWe added approximately 400 km (vertical) includingexploratory and injection wells, and direct use addedapproximately 4 km. Most direct-use work concentrated on
improving and refurbishing existing wells. See Table 7 fordetails. Geothermal heat pumps wells, which are not includedin this table, probably added 200,000 vertical holes at 75 meach for a total of 15,000 km over the ve years.
PROFESSIONAL GEOTHERMALPERSONNEL
Professional geothermal personnel with university degreesare higher mainly due to an increase in the installed capacityof power plants. Geothermal Power plants are estimated toemploy 1.7 person/years per installed megawatt (Kagel, 2006).It is assumed that approximately 0.5 person/year is due toprofessional personnel. Due to limits on funding from USDOEOfce of Geothermal Technologies, during the years 2005 to2008, personnel in private industry as well as with thegovernment institutions, as well as National Laboratories and
Universities were reduced. Only about 50 person/years are dueto direct-use geothermal. See Table 8 for details.
INVESTMENT IN GEOTHERMALAgain, the majority of the investment in geothermal was for
geothermal electric power plants. We estimate that US$4,000(Western Governor’s Association, 2006) is invested for everykilowatt of installed capacity. Thus, for the new 514 MWe of installed capacity over the past ve years, US$2,000 billionwas invested. Above half of this was for eld and plantdevelopment and 25% each for R&D and for the operation.Direct-use only added about US$2,000 million; however, not
shown in Table 9 is the approximately US$2.5 billion is spentannually on geothermal heat pump installations and equipment(personal communication, John Geyer, Oct. 2009).
ENERGY AND CARBON SAVINGS
The total electricity produced from geothermal energy inthe U.S. is equivalent to savings 28.3 million barrels (4.24million tonnes) of fuel oil per years (generating at 0.35efciency). This produces a savings of 3.71 million tonnes of carbon annually. The total direct utilization includinggeothermal heat pump energy use in the U.S. is equivalent tosaving 13.3 million barrels (2.01 tonnes) of fuel oil per years(producing heat at 0.70 efciency). This produces a savings of
1.76 million tonnes of carbon annually. If the savings in thecooling mode of geothermal heat pumps is considered, thenthis is equivalent to an additional savings of 6.9 million barrels(1.03 million tonnes) of oil annually.
In total, the savings from present geothermal energyproduction in the U.S., both electricity and direct-use amountsto 48.5 million barrels (7.28 million tonnes) of fuel oilequivalent (TOE) per year, and reduces air pollution by 6.65million tonnes of carbon annually. CO2 reduction is estimatedat 18.8 million tonnes
Number of Wells DrilledPurpose WellheadTemp.
ElectricPower
DirectUse
Combined
TotalDepth(km)
Exploration * (all) 50 0 50 25
Production >150oC 100 0 100 200
150-100oC 67 6 73 135
<100oC 0 4 4 4
Injection (all) 20 0 20 40
Total 237 10 247 404
Table 7. Wells Drilled for Electrical, Direct and Combined
Use of Geothermal Resources from January 1, 2005 to
December 31, 2009 (excluding heat pump wells)
* Includes thermal gradient well, but not ones less than 100 m deep
Table 8. Allocation of Professional Personnel to Geothermal
(Restricted to personnel with University degrees)
Professional Person-Years of EffortYear
(1) (2) (3) (4) (5) (6)
2005 2 2 10 0 0 1,200
2006 2 2 10 0 0 1,200
2007 2 2 10 0 0 1,000
2008 2 2 10 0 0 1,000
2009 2 2 10 0 0 1,500
Total 10 10 50 0 0 5,900
(1) – Government; (2) – Public Utilities; (3) – Universities; (4) – Paid
Foreign Consultants; (5) – Contributed through Foreign Aid Programs;
(6) – Private Industry

8/8/2019 May 2010 Geo-Heat Center Quarterly Bulletin
http://slidepdf.com/reader/full/may-2010-geo-heat-center-quarterly-bulletin 13/28
11GHC BULLETIN, MAY 2010
REFERENCESAustin, W. (Trey): Geo-Energy Services, LLC, Centennial, CO,
personal communication (October, 2009).
California Energy Commission: http://energyalmanac.ca.gov/powerplants /POWER_PLANTS.XLS (2009).
Chaisson, A.: “From Creamery to Brewery with GeothermalEnergy: Klamath Basin Brewing Company”, Geo-Heat CenterQuarterly Bulletin, 27/4, Oregon Institute of Technology,Klamath Falls, OR, (2006) pp. 1-3.
Culver, G and J. W. Lund: “Downhole Heat Exchangers”, Geo- Heat Center Quarterly Bulletin, 20/3, Oregon Institute of Technology, Klamath Falls, OR, (1999) pp. 1-11.
Clutter, T.: “Out of Afr ica – Aquaculturist Ron Barnes UsesGeothermal Water in Southern Oregon to Rear Tropical Fishfrom African Rift Lake”, Geo-Heat Center Quarterly Bulletin,
23/3, Oregon Institute of Technology, Klamath Falls, OR, (2002)pp. 6-8.
EIA: Energy Information Agency, Washington, D.C., (2009)from their website: www.eia.doe.gov.
Ellis, D.: Climate Master, Oklahoma City, OK. personalcommunication (November, 2009)
Flynn, T.: “Moana Geothermal Area, Reno, NV – 2001 Update”,Geo-Heat Center Quarterly Bulletin, 22/3, Oregon Institute of Technology, Klamath Falls, OR, (2001), pp. 1-7.
Geyer, J.: John Geyer and Assoc., Vancouver, WA, personalcommunication (October, 2009)
Holdmann G., and D. C. Erickson: “Absorption Chiller for the
Chena Hot Springs Aurora Ice Museum”, Geo-Heat CenterQuarterly Bulletin, 27/3, Oregon Institute of Technology,Klamath Falls, OR, (2006) pp. 5-6.
Hughes, P.: Oakridge National Laboratory, TN, personalcommunication (October, 2009).
Jennejohn, D.: U.S. Geothermal Power Production and Development Update, Geothermal Energy Association,Washington, DC (2009).
Kagel, A.: A Handbook on the Externalities, Employment, and Economics of Geothermal Energy, Geothermal EnergyAssociation, Washington, DC, (2006) 65 p.
Lund, J. W.: “Chena Hot Springs”, Geo-Heat Center Quarterly
Bulletin, 27/3, Oregon Institute of Technology, Klamath Falls,OR, (2006) pp. 2-4.
Lund, J. W. and T. L. Boyd: “Geothermal Utilization on theOregon Institute of Technology Campus, Klamath Falls,Oregon”, Geothermal Resources Council Transactions, 33,Davis, CA (2009)(CD-ROM).
Merrick, D.: “Adventures in the Life of a Small District HeatingProject”, Geothermal Resources Council Transactions, 28,Davis, CA (2002).
Merrick, D.: “Adventures in the Life of a Small District HeatingProject (or The Little Project That Could)”, Geothermal
Resources Council Transactions, 26, Davis, CA (2004)(CDROM).
Merrick, D.: “Canby’s Geothermal Laundromat”, Geothermal Resources Council Transactions, 33, Davis, CA (2009)(CDROM).
Mufer. L.J.P., (editor): “Assessment of Geothermal Resourcesin the United States – 1978”. U.S. Geological Survey Circular790, U.S. Department of Interior, Arlington, VA (1979).
Nevada Bureau of Mines and Geology: Geothermal Energy –2008, Nevada Bureau of Mines and Geology, Reno, NV (2009).
Northwest Farm Credit Services: “Geothermal Ingenuity”,Yields, Spokane, WA (2009).
Tester, J. W., B.J. Anderson, A. S. Batchelor, D.D. Blackwell, R.DiPippo, and E.M, Drake (editors): The Future of Geothermal
Energy Impact of Enhanced Geothermal Systems on the United
States in the 21st Century, prepared by the MassachusettsInstitute of Technology for the U.S. Department of Energy,Washington, D. C., (2006) 358 p.
USGS U.S. Geological Survey: Assessment of Moderate- and High-temperature Geothermal Resources of the United States,U.S. Geological Survey Fact Sheet 2008-3082, by Williams,Colin, F., Reed, Marshall J., Mariner, Robert H., DeAngelo,Jacob, Galanis, S. Peter, Jr., Menlo Park, CA (2008).
Western Governor’s Association: Geothermal Task Force Report , Western Governor’s Association, Denver, CO, (2006) 66 p.
Table 9. Total Investments in Geothermal in (2009) US$
Utilization Funding TypePeriod Research &Development Incl.
Surface Explor. AndExploration Drilling
Million US$
Field DevelopmentIncluding ProductionDrilling & Surface
Equipment
Million US$
Direct
Million US$
Electrical
Million US$
Private
%
Public
%
1995 – 1999 N/A N/A
2000 – 2004 250 200 100 200 80 20
2005 - 2009 500 1,000 2 500 95 5
8/8/2019 May 2010 Geo-Heat Center Quarterly Bulletin
http://slidepdf.com/reader/full/may-2010-geo-heat-center-quarterly-bulletin 14/28
12 GHC BULLETIN, MAY 2010
GEOTHERMAL USES AND PROJECTS ON THE OREGON INSTITUTEOF TECHNOLOGY CAMPUS John W. Lund and Tonya “Toni” Boyd, Geo-Heat Center, Oregon Institute of Technology
ABSTRACTOregon Institute of Technology moved their campus to
the present location in the early 1960s to take advantage of
the geothermal hot water that could be used for heating thebuildings. Three wells between 1,200 and 1,800 feet (365and 550 m) deep were drilled, producing 192˚F (89˚C) waterat a maximum ow of 980 gpm (62 L/s). There are presently12 buildings being geothermally heated covering approxi-mately 732,000 ft2 (68,000 m2) of oor space, saving ap-proximately $1,000,000 annually in heating costs. Line-shaft pumps with variable frequency drives are used to pro-duce the geothermal uids from the well, and then the hotwater is gravity fed to all buildings on campus. Plate heatexchangers are located in each building to separate the po-tentially corrosive geothermal uids from the secondary“clean” water for heating the various rooms. The geother-
mal water is nally injected into two injection wells locatedapproximately 2,000 feet (610 m) from the production wells.A 280 kWe (gross) binary power plant was installed oncampus to use the existing well water to provide some of theelectricity needs for the campus. In addition, a 5,300 foot(1,600 m) deep well was drilled to tap into a 196˚F (91˚C)geothermal resource in the fault system on the east edge of campus. The uids would be used to power a 1.0 to 1.2 MWe(gross) binary plant to provide some of the electricity needsfor campus. Thus, the campus would become the rst in theworld to provide some of its energy needs from a geother-mal resource found on its property. Finally, the “waste” uidfrom the heating system would be used to provide heat for
experimental greenhouses and aquaculture facilities oncampus. All of these future uses would be available for stu-dent projects and as a demonstration site for interested in-vestors and developers of geothermal energy.
HISTORICAL BACKGROUND (PURVINE, 1974, LIENAU, 1996)
In 1959 the Oregon State Board of Higher Education wasawarded a State appropriation of $150,000 for use in explo-ration related to the selection of a new campus for OregonInstitute of Technology. The old campus was a military fa-cility, built for the treatment of malaria victims from WorldWar II. These funds were to be used for the master plan of
the new campus and for exploration to determine the avail-ability of geothermal water for space heating. At that time,approximately $100,000 per year was spent on coal and oilheating for the campus. Since the Board wished this to be adecision based on good information, a study was made as tothe location of hot wells, hot springs, faults, and other fac-tors useful in determined the potential location of the cam-pus. This study was carried out by Gene Culver, a Mechani-cal Engineering Technology faculty member and later oneof the founders of the Geo-Heat Center. One of the earlyobservations was the existence of a broad series of normalfaults running from Ft. Klamath (south of Crater Lake) in
the north to Alturas in northern California in the south. Atvarious locations along this broad fault zone were hot springsand hot water wells. The fault zone seemed to be the source
of subsurface hot water which many of the wells had en-countered.
Local well drillers were interviewed based on their expe-rience with drilling geothermal wells in the area. In additionthe Oregon State Engineer’s Ofce was consulted, andbased on a US. Geological Survey map that was in prepara-tion, it indicated that the fault system in the area consistedon northwest-southeast trending fracture zone with perpen-dicular offsets producing faults in echelon. Finally, to con-rm the locations of these faults and the potential for pro-ducing hot water, then President Winston Purvine noticedthat for one area being considered for the new campus, thefrost and light snowfalls would be melted off by as early as
8:30 to 9:30 in the morning, too early to be inuenced by thesun. This was assumed to indicate that the soil was beingwarmed by subsurface hot water, and thus the site was aprime candidate for geothermal drilling.
After these preliminary studies the location for the geo-thermal wells and potential campus was selected in thenorthern edge of the City of Klamath Falls. The rst well(OIT #1) was drilled in 1959 to a depth of 1,200 feet (366 m)and produced 510 gpm (32 L/s) of 78˚F (26˚C) water, whichwas later used for the domestic water supply. Moving fur-ther west and south within the border of the new campus, asecond 1,200-foot (366 m) well (OIT #2) was drilled in1960. This was more successful, producing 170 gpm (11 L/s)
of 176˚F (80˚C) geothermal water (Fig. 2). Two other wells(OIT #5 and #6) were later drilled in 1963 in the same areato depths of 1,716 feet and 1,800 feet (523 and 549 m) bothproducing 191˚F (88˚C) geothermal water at 442 gpm and250 gpm (28 and 16 L/s) of geothermal water respectively(Fig. 2). This temperature, with time, increased to 192˚F(89˚C). We later learned that the rst or cold water well wasdrilled into the up-throw (hanging wall) of the normal faultand the latter three in the down-throw (foot wall) of the faultblock tapping the outow zone of the geothermal waterfrom the fault. At the time, these two deeper wells weredrilled for about $32,000 each or $18 per foot!!! The wellspenetrated at mixture of volcanic ash (tuff) and diatoma-
ceous earth (locally called “chalk rock”), then into variouslayers of dense basalt and andesite, clayey tuffs, broken lavaand cinders. The casing varied from 12 inches (30.5 cm) atthe surface to 6 inches (15 cm) at the bottom. The staticwater level was at 358 feet (109 m) for the deeper wells. Theoriginal wells were set in a cellar, but were later raised toground level and enclosed in a building in 1970 (Fig. 3).
Enclosed lineshaft pumps with the bowls set at around 550feet (168 m) with 26 stages are used in the deeper wells. Theoriginal pumps were basically irrigation well water pumpswith direct-coupled motors, open lineshaft with rubber bear-

8/8/2019 May 2010 Geo-Heat Center Quarterly Bulletin
http://slidepdf.com/reader/full/may-2010-geo-heat-center-quarterly-bulletin 15/28
13GHC BULLETIN, MAY 2010
ings and standard lateral pumps with bronze bearings andimpellers. Problems were experienced with broken line-shafts, motors overheating, pump impellers loosened on theshaft due to differential expansion and bronze bearings corro-sion (Culver, 1994). Since hot water does not lubricate the
bearings well, an oil drip system had to be installed within anenclosed lineshaft, and allowance had to be made for the dif-ference in thermal expansion between the line shaft and theimpellers – which can be as much as 5.5 inches (14 cm) as thesystem is heated during the initial startup (Rafferty and Ke-iffer, 2002). The wells are pumped with 75 hp (56 kW) pumps,and a variable speed uid drive to regulate the amount of water needed was added in 1970. These were later replacedwith variable frequency drives. The water is then piped into aheat/water collection building where it enters a settling tankfor removal of sand and to meet peak demands. From here the
water is then gravity fed into the various buildings on cam-pus. Initially the geothermal water was used directly in theheating systems, but due to 2 ppm (2 mg/L) of hydrogen sul-de which attacked the copper and solder in the radiators,isolation plate heat exchangers had to be installed in eachbuilding (Fig. 4) at a later date. In the beginning, the wastewater was disposed into a drainage ditch and eventually end-ed up in Upper Klamath Lake, about one mile (1.6 km) to thewest. However, based on a 1990 ordinance passed by the City
of Klamath Falls, all geothermal water produced has to bereturned to the reservoir. As a result, two injection wells (INJ#1 and INJ #2) were drilled in 1990 to 2,005 and 1,675 feet(611 m and 510 m) on the southwest side of campus, approxi-mately 2,000 feet (610 m) from the production wells. Thesetwo well can handle up to 2,500 gpm (158 L/s).
The distribution pipeline around campus initially con-sisted of steel pipe covered by a rigid foam glass insulation
buried directly in the ground between buildings. Unfortu-nately, the metal pipe would expand and contract dependingupon ow rate which changed with the supply temperatureof the geothermal water, however, the insulation did not.Thus, ground water leaked into the cracks in the insulationand corroded the steel pipe. Oxygen was introduced into thewater from a vent in the storage tank causing some minorinternal corrosion of the pipes as well. Also, since the pipewas direct buried, it was often dug up by accident, since theexact location was not well documented. Thus, in 1980 autility tunnel at 6 feet (1.8 m) on a side was constructed tohouse most of the pipeline, as well as other utilities on cam-pus being added later (Fig. 5) (Lund and Lienau, 1980).
Where possible, the tunnel was located under sidewalks, soany residual heat would melt the snow and ice above. Thecost at that time was about $160/ft. ($525/m). A 312 ton(1,095 kW) lithium-bromide/water absorption cycle chillerwas installed on campus in 1980 using the 192˚F (89 C̊ )geothermal water to provide cooling in the summer forabout half of campus (Lund and Lienau, 1980). Chilleduid at 44˚F (7˚C ) was delivered to the space coolingsystem in several of the buildings. Unfortunately, the unitat that time required 240˚F (116˚C ) geothermal water tooperate at 100% efciency, thus the machine only pro-duced half of the normal output. For this reason, and the
Figure 1: 1963 photograph of Storey Drilling, completingone of the deep geothermal wells with a cable tool.
Figure 2: OIT campus map showing the location of wells
and distribution pipelines.
Figure 3: Gene Culver at well #6 showing the 75 hp (56
kW) motor and uid coupling drive. The well house
is moved for maintenance.

8/8/2019 May 2010 Geo-Heat Center Quarterly Bulletin
http://slidepdf.com/reader/full/may-2010-geo-heat-center-quarterly-bulletin 16/28
14 GHC BULLETIN, MAY 2010
required high geothermal ows (600 gpm – 38 L/s), highdischarge temperature and corrosion of the copper pipes inthe generator section, the unit was replaced with an elec-tric chiller in 1998 (Lienau, 1996).
In the beginning the geothermal water, which could bepumped up to 750 gpm (47 L/s) using two wells, heated440,000 ft2 (40,900 m2) of oor space in six buildings us-ing either forced air for interior rooms or base-board hotwater for exterior building walls. An average of 2.8 mil-lion Btu/hr (3.0 GJ/hr) with a maximum of 24.8 millionBtu/hr (26.1 GJ/hr) was used on campus, costing about$12,000 to $14,000 per year compared with $94,000 to$100,000 per year on the old campus with conventionalfuel. A standby oil red boiler from the old campus wasinstalled in the Heat Exchange building, however, it wasnever used and was eventually removed in the 1990s. To-day, only one well is normally used, with two being re-
quired during extreme cold weather (below 0˚F or -18˚C ).The third well is used for standby, and allows maintenanceto be performed without interrupting the usage.
PRESENT CAMPUS OPERATION(BOYD, 1999)
Today, geothermal water is produced from three wells ata temperature of 192̊ F (89 C̊ ), which are located in thesoutheast corner of the campus (Fig. 2). Well water tempera-ture can vary between 192˚ and 196˚F (89˚ and 91˚C ), de-pending on the pumping rate and location of the well. The
water is pumped individually from each well, with a maxi-mum total ow of all the wells at 980 gpm (62 L/s). Thewater is then collected in a 4,000-gallon (15 m3) settlingtank in the Heat Exchange building before it is delivered toeach building via gravity through the distribution systemaccording to the demand on the system. The settling tankprovides the necessary head for the gravity ow system andallows the nes from pumping to settle out of the water. Dueto pipe failures from the direct buried distribution system, aconcrete utility tunnel was constructed in 1980. When newextensions to the tunnel are added, corrugated galvanizedsteel culvert are used instead of concrete, costing about 25%of the tunnel cost.
In the original design, the geothermal water was used di-rectly in each of the building mechanical systems. This“once through” approach eliminated the need for circulationpumps in the buildings. The direct use of the geothermal
uids caused problems due to the corrosive nature of thewater. The original chemical analysis of the water failed toconsider the effect of hydrogen sulde and ammonia on thecopper alloys used in the mechanical system. There were anumber of different types of failures identied that occurredas a result of using the water directly. The more importantones were:
• Failure of the 50/50 tin/lead solder connections,
• Rapid failure of 1% silver solder,
• Wall thinning and perforation of copper tubing was acommon occurrence,
• Control valve failure where plug (brass) was crimped tothe stem (stainless steel). The threaded ones experiencedno problems, and
• Control valve problems associated with packing leakage.
To address these problems, the geothermal water wasisolated from the building heating systems using plate heatexchangers. The type selected consists of 316 stainless steelplates and Buna-N gaskets. The heat exchanger for thecampus swimming pool failed due to the chlorine in thepool water, and thus, had to be replaced with titaniumplates, which was eventually replaced with a brazed plateheat exchanger due to the cost of the titanium plates.
Figure 4: Plate heat exchanger in the College Union
building.
Figure 5: OIT utility tunnel with geothermal pipe and other
utilities.

8/8/2019 May 2010 Geo-Heat Center Quarterly Bulletin
http://slidepdf.com/reader/full/may-2010-geo-heat-center-quarterly-bulletin 17/28
15GHC BULLETIN, MAY 2010
The original discharge temperature of the waste efuentwas initially quite high (135˚F - 57˚C in winter and 170˚F77˚C in summer) when it was delivered to a drainage ditch.This method presented a safety hazard and was stoppedwhen the City Ordinance was put into effect in 1990, asmentioned earlier. Two injection wells were drilled, thatcan now handle up to 2,500 gpm (158 L/s). To reduce theefuent temperature, when Purvine Hall was constructed,it was designed to use the efuent from the rest of campus.
The temperature of the efuent as it enters the building isaround 155˚F (68˚C) and leaves at a temperature of around130˚F (54̊ C). The main components of this building’s heat-ing system are a 4,000-gallon (15-m3) storage tank, circu-lating pumps and heat exchangers. On the building heatingside, space heating is accomplished by 54 variable air vol-ume terminals equipped with hot water coils.
The newest additions to the OIT geothermal system aresections of sidewalks, stairs and handicap ramps equippedwith geothermal snow melting system. In 2009 approxi-mately 37,000 ft2 (3,400 m2) of sidewalk and drivewaysystems were installed in front of the administration build-ing (Snell Hall) (Fig. 6). The pipes in the concrete are 5/8-
to 3/4-inch (1.6- to 1.9-cm) diameter cross-linked polyeth-ylene tubing (PEX), placed 8 to 10 inches (20 to 25 cm)apart. The system should be able to maintain a slab surfacetemperature of 38˚F (3˚C) at -5˚F (-21˚C) air temperatureand 10 mph (16 km/h) wind when the entering 50/50 pro-pylene glycol/water temperature is 144˚F (62˚C). Each ma-
jor area has a separate plate heat exchanger and the systemwill activate when the outside air is 30˚F (-1˚C). The totalamount installed on campus to date covers around 40,400ft2 (3,750 m2).
At present twelve buildings are heated totaling 732,000ft2 (68,000 m2). At peak use, the system provides 16 mil-lion Btu/hr (16.9 GJ/h) or a capacity of 4.7 MWt. The an-nual use is approximately 64.4 billion Btu (67.9 TJ), savingaround $1,000,000 annually in heating costs as comparedto natural gas.
FUTURE CAMPUS PROJECTSFive new geothermal projects are being planned and
some are already underway for the campus. These include:
(1) a low-temperature, 280 kWe (gross) binary power plantusing the existing well water, (2) completing a deep well oncampus producing 196˚F (91̊ C) geothermal water, (3) a 1.0to 1.2 MWe (gross) binary power plant to use the energyfrom the deep well, (4) an incubator greenhouse facility,and (5) an incubator aquaculture facility. Each of theseprojects is described in detail below.
Low Temperature Power Plant
A contract was signed with United Technology Corpora-tion of Connecticut (now Pratt and Whitney, Co.) for a 280kWe (gross) binary power plant that can use the 192˚F(89˚C) geothermal from the existing wells on campus. Weare taking approximately 15˚F (8˚C) off the top, and thenthe remaining 177˚F (81˚C) is still adequate to supply theheating needs of campus. Maximum ow would be 600gpm (38 L/s). In summer and warmer periods, the reject tem-perature can be reduced to as low as 150˚F (66˚C), when thecampus heating demand is less. This unit purchased uses asingle-cell wet cooling tower with 70˚F (21˚C) cooling waterand produce an average net output of 85 to 140 kWe dependingon the outside temperature and humidity. This will provide
approximately 10% of the campus electrical energy demandand save $100,000 annually. In addition, the project will serveas a demonstration site and student laboratory, mainly for stu-dents in the new Renewable Energy Engineering Program.Real time monitoring would be available for students on ourcampus and at other universities.
Figure 6: Installation of PEX pipe for the campus entrance
snow melting system in 2008.
Figure 9. The low-temperature power plant inside the
building.
Figure 10. Building housing the low-temperature power
plant and the associated cooling tower.

8/8/2019 May 2010 Geo-Heat Center Quarterly Bulletin
http://slidepdf.com/reader/full/may-2010-geo-heat-center-quarterly-bulletin 18/28
16 GHC BULLETIN, MAY 2010
Figure 7: East-west seismic prole showing the fault and
fracture zone with the deep well location
Deep Well Drilling ProjectTo produce additional electrical energy for campus, we
drilled a deep (5,308 feet – 1,618 m) geothermal well that in-tersected the high angle normal fault on the east side of cam-pus. The geothermally heated uid upwelling along the fault isalready tapped by our existing geothermal wells. Geochemis-try predicted that up to 300˚F (150˚C) geothermal uids mightbe found at depth – however, the depth and amount could notbe predicted. Unfortunately, the highest temperature found in
the well was just under 200˚F (93˚C). We have tested the wellat 1,500 gpm (95 L/s) and proposed to test it at 2,500 gpm (158L/s) which can supply a 1.0 MWe to 1.2 MWe (gross) powerplant, depending upon the nal temperature and ow rate of the uid. The surface water level is at 320 feet (97.5 m) belowthe surface, which is typical of the other wells in the area. Thedrawdown at 1,500 gpm (95 L/s) was only 23 feet (7.0 m) andpredicted to be 75 feet (23 m) at 2,500 gpm (158 L/s). Fundingwas provided by the US Department of Energy and the Ore-gon University System in a matching grant.
The following projects were completed prior to drilling thewell to better dene the resource and drilling target. In 2008,we contracted for and completed a reection seismic survey of campus to better locate the fault and thus located the drillingsite. Approximately 64 2.2 lb (1 kg) dynamite charges at 18feet (6 m) depth were set off on campus and surrounding prop-erty to bounce energy waves off subsurface structures. Theseismic survey can be viewed at http://geoheat.oit.edu/oit/Ses-imic_Final _Report.pdf. This investigation determined theoptimum drilling target at about the 3,000 to 4,000 foot (900to 1,040 m) depth (Fig. 7). The drill site was located in thesoutheast corner of the upper parking lot.
As a part of the USDOE grant requirements, we completedan environmental assessment (EA) under the NEPA require-
ments. The nal EA can be viewed at http://geoheat.oit.edu/oit/OIT-Deep-Geothermal-Well-andPower-Plant-Project-FEA_0908.pdf.
A Request for Proposal (RFP) for drilling the deep well wasprepared and a contract was awarded to ThermaSource, Inc. of Santa Rosa in December 2008. Drilling of the 30foot (9-m)deep surface casing (conductor pipe) of 30 inch (76 cm) wascompleted in early January by a local contractor. Ther-
maSource had their drilling rig on site and started their drill-ing by the 2nd week of January 2009 (Fig. 8). They then drilledto 300 feet (91 m) and set and cemented a 20-inch (51-cm) di-ameter casing. This was followed by a 2,500-ft (760 m) holefor a 13-3/8-inch (34cm) casing cemented back to the surface.The well was nished with a 9-5/8-inch (24-cm) diameter pro-duction liner that was slotted at selected intervals. Deviateddrilling was used to better intersect and tap the fractured faultzone from 3,200 ft (975 m) to bottom. The only problem thatwe experience on campus was complaints by student due tolack of parking, as the drill site had temporally taken out about75 parking spaces. Noise was not a problem with the residencehall or the adjacent hospital that are located only 500 ft (150m) on either side of the project site.
Moderate Temperature Power PlantA 1.0 to 1.2 MWe power plant (gross) would be design to
use the uids from the deep well. It will be a binary type (or-ganic Rankine cycle using a secondary low boiling point hy-drocarbon) supplying around 0.8 MWe to 1.0 MWe (net) tocampus, enough to cover approximately half of the electricenergy requirements. This would save the campus round$300,000 per year.
The cost of the well and the 1.0 to 1.2 MWe (gross) powerplant would be around $11.7 million, however, the “waste wa-ter” from the power plant at around 175˚F (80˚C), could thenbe sold to adjacent property owners or used to supplement theexisting and new OIT heating demands, generating additionalincome or savings. The site would also become a demonstra-tion site and student laboratory with real time monitoringavailable. Funding for the projects will come from a US De-partment of Energy grant, and from Oregon State bonds andgrants. Additional support will be provided from the EnergyTrust of Oregon and the Climate Trust.
Figure 8: ThermaSource drilling rig on the OIT campus.

8/8/2019 May 2010 Geo-Heat Center Quarterly Bulletin
http://slidepdf.com/reader/full/may-2010-geo-heat-center-quarterly-bulletin 19/28
17GHC BULLETIN, MAY 2010
Incubator Greenhouse FacilityWe are proposing to construct two geothermally heated
greenhouses on campus. The greenhouses would be 100by 60 feet (31 by 18 m) covering 6,000 ft2 (560 m2) anddesigned to grow a variety of cut owers, potted plants andvegetables. Different heating and cooling systems wouldbe provided to each greenhouse as a research and demon-stration project. All heating and cooling in the greenhousewould be monitored and controlled by a computer system.
The greenhouses would be an incubator facility for inter-ested investors/developers to test the feasibility of growingtheir crop in a controlled environment utilizing geother-mal energy. The facility would also provide research proj-ects for students on campus and for the local agriculturalprograms at the community college and rural high school.The facility would require around 140˚F (60˚C) and 60gpm (4 L/s), that could easily be met from our existinggeothermal wells, mainly by cascading the efuent waterfrom the campus heating system.
Incubator Aquaculture FacilityWe are also proposing to construct two geothermally
heated outdoor aquaculture ponds and a covered nurserytank facility on campus. The outdoor ponds would be 100by 30 feet (31 by 9 m) of 3,000 ft2 (280 m2) and the indoorcovered facility would be of greenhouse construction 100by 60 feet (31 by 19 m) covering 6,000 ft2 (560 m2). Dif-ferent heating systems would be provided to each pond asa research and demonstration project. The covered facilitywould consist of a series of berglass tanks, heated by thegeothermal water. All heating systems would be monitoredand controlled by computer. Various sh species, hard-shell aquatic species and even various algae could be test-ed. Efuent water from the campus geothermal heating
system at around 140˚F (60˚C) and 150 gpm (9 L/s) wouldbe required, that could easily be met by cascading. Thefacility would provide an incubator facility for potentialdeveloper/investors and also be used as a laboratory forcampus students.
CONCLUSIONSThe campus was built on its present location mainly to
take advantage of the geothermal energy that is provided
by water moving up along the high-angle normal fault onthe east side of campus. Using three geothermal wells thattap a 192˚F (89˚C) uid and are pumped up to 600 gpm (39L/s), provides an installed capacity of 3.8 MWt and annualsupply of 64.4 billion Btu (67.9 TJ), saving an estimate$1,000,000/yr in heating costs.
A 280 kWe (gross) binary power plant has been installedand is operating providing between 80 and 140 kWe of netenergy to campus, which satises about 10% of the cam-pus electric needs and saves approximately $100,000 an-nually. This is the rst combined geothermal heat andpower plant installed and operating in Oregon, and alsothe rst on a university campus.
With the deep well completed and when the 1.0 to 1.2MWe (gross) power plant is up and running on campus,Oregon Institute of Technology will be the rst campus inthe world to supply all its heating and a majority of itselectrical energy from a geothermal resource directly un-der campus. We will be a showplace for all forms of geo-thermal utilization. Along with our Renewable EnergyEngineering Program and technical assistance providedby the Geo-Heat Center (http://geoheat.oit.edu), we will bea leader for renewable geothermal energy utilization.
REFERENCESBoyd, T. L.: “The Oregon Institute of Technology GeothermalHeating System – Then and Now”, Geo-Heat Center Quarterly
Bulletin, Vol. 20, No. 1, (March), Klamath Falls, OR, pp. 1013(1999).
Culver, G.: Results of Investigations of Failure of Geothermal Direct-Use Well Pumps. Technical Report prepared for U.S. De-partment of Energy, Grant No. DE-FG07-90ID 13040, Geo-Heat Center, Klamath Falls, OR, 33 p (1994).
Lienau, P. J.; “OIT Geothermal System Improvements”, Geo- Heat Center Quarterly Bulletin, Vol. 17, No. 3 (August), KlamathFalls, OR, pp. 24-28 (1996).
Lund, J. W., and P. J.Lienau: “New Geothermal Construction onthe OIT Campus”, Geo-Heat Center Quarterly Bulletin, Vol. 5,
No. 3. (September), Klamath Falls, OR, pp. 21-23 (1980).
Purvine, W. D.: “Utilization of Thermal Energy at Oregon Insti-tute of Technology, Klamath Falls, Oregon”, Proceedings of the
International Conference on Geothermal Energy for Industrial, Agricultural and Commercial-Residential Uses, Oregon Insti-tute of Technology, Klamath Falls, OR, pp. 179191 (1974).
Rafferty, K., and S. Keiffer: “Thermal Expansion in EnclosedLineshaft Pump Columns”, Geo-Heat Center Quarterly Bulle-tin, Vol. 23, No. 2 (June), Klamath Falls, OR, pp. 11-15 (2002).

8/8/2019 May 2010 Geo-Heat Center Quarterly Bulletin
http://slidepdf.com/reader/full/may-2010-geo-heat-center-quarterly-bulletin 20/28
18 GHC BULLETIN, MAY 2010
USE OF PROMOTER PIPES wITH DOwNHOLE HEAT ExCHANGERSIN KLAMATH FALLS, OREGONTonya “Toni” Boyd and John W. Lund, Geo-Heat Center, Oregon Institute of Technology
ABSTRACTA promoter pipe is simply a pipe that is open at both ends
that is placed in a well with a downhole heat exchanger.
These have been used extensively in Rotorua, New Zealand.The promoter pipe sets up a convection cell that is necessaryto increase the temperature of the water over the length of the downhole heat exchanger. It is used when the well casinghas not been perforated just below the low water line and thelive water ow at the bottom of the well, thus preventing thehot water ow from mixing sufciently along the entirewell-bore length. The temperature and heat output of thedownhole heat exchanger can be signicantly increased if aconvection cell is set up in the well. Several examples of wells that have promoter pipes installed in them in KlamathFalls are documented, comparing the temperature outputbefore and after installation.
INTRODUCTIONThe downhole heat exchanger (DHE) exchanger consists
of a system of pipes or tubes suspended in the well throughwhich “clean” secondary water is pumped or allowed tocirculate by natural convection, thus eliminating the problemof disposal of geothermal uid, since only heat is taken fromthe well. These systems offer substantial economic savingsover surface heat exchangers where a single-well system isadequate (typically less than 0.8 MWt, with well depths upto about 500 ft (150 m) and may be economical under certainconditions at well depths to 1500 ft (460 m)(Lund, et al.,1975; Culver and Lund, 1999).
Several designs have proven successful; but, the mostpopular are a simple hairpin loop or multiple loops of ironpipe (similar to the tubes in a U-tube and shell exchanger)extending to near the well bottom (Figure 1). An experimentaldesign consisting of multiple small tubes with “headers” ateach end suspended just below the water surface appears tooffer economic and heating capacity advantages in shallowwells (Culver and Reistad, 1978).
Downhole heat exchangers extract heat by two methods–extracting heat from water owing through the aquifer andextracting stored heat from the rocks surrounding the well,the former being most signicant.
In order to obtain maximum output, the well must bedesigned to have an open annulus between the well bore andthe casing, and perforations at the well bottom for the inowaquifer and just below the lowest static water surface.Natural convection circulates the water down inside thecasing, through the lower perforations, up in the annulusand back inside the casing through the upper perforations. If the design parameters of bore diameter, casing diameter,heat exchanger length, tube diameter, number of loops, owrate and inlet temperature are carefully selected, the velocityand mass ow of the natural convection in the well mayapproach those of a conventional shell-and-tube heat
exchanger. However, this balance is often difcult to achieve,and is usually done by trial and error or based on localexperience.
The interaction between the uid in the aquifer and that inthe well is not fully understood; but, it appears that outputsare higher where there is a high degree of vertical uidmixing in the well bore indicating that somewhat permeableformations with high ows are preferred. Although the
interaction between the water in the well, water in theaquifer, and the rock surrounding the well is poorlyunderstood, it is known that the heat output can besignicantly increased if a vertical convection cell can beset up in the well. Also, there must be some degree of mixing(i.e., water from the aquifer) continuously entering the well,mixing the well water, and water leaving the well to theaquifer. There are two methods of inducing convection inthe past: 1) casing perforations, and 2) “pumping anddumping”.
When a well is drilled in a competent formation and willstand open without casing, an undersized casing can beinstalled. If the casing is perforated just below the lowest
static water level and the near the bottom at the hot aquiferlevel, a convection cell is induced and the well becomesvery nearly isothermal between the perforations (Figure 2).Cold surface water and unstable formations near the surfaceare cemented off above a packer. If a DHE is then installedand heat extracted, a convection cell is induced, owingdown inside the casing and up in the annulus between thewell wall and casing. The driving force is the densitydifference between the water surrounding the DHE andwater in the annulus. The more heat extracted, the higherthe velocity. Velocities of 2 ft/s (0.6 m/s) have been measured
Figure 1: Typical downhole heat exchanger systems in
Klamath Falls, Oregon.

8/8/2019 May 2010 Geo-Heat Center Quarterly Bulletin
http://slidepdf.com/reader/full/may-2010-geo-heat-center-quarterly-bulletin 21/28
19GHC BULLETIN, MAY 2010
with very high heat extraction rates; but, the usual velocitiesare between 0.03 - 0.3 ft/s (0.01 – 0.1 m/s).
Many of the earlier wells drilled in Klamath Falls werenot completed with the two sets of casing perforations thatwould generate the convection cells to maximize the outputof the downhole heat exchangers (DHE). To provide for thisvertical convection of the hotter water from the bottom of
the well, they were equipped with a small suction pump thatpumped water from the well to the storm sewer – locallyreferred to as “pumping and dumping.” This pumpingprovided approximately the same energy transfer to thedownhole heat exchanger as the convection cell.Approximately 60 wells in the City had these pumps, andcould be identied by the steam rising from the storm watergrates adjacent to the well. In addition, larger users, such asOregon Institute of Technology, who could not generateenough energy from a downhole heat exchangers, pumpedwater for the plate heat exchangers in the various buildingson campus, and dumped the waste water to surfacedrainage.
In Klamath Falls, it has been experimentally veried thatwhen a well is drilled there is no ow in the wellbore (seeFigure 3). When the undersized perforated casing is installed,a convection cell is set up owing up the inside of the casingand down the annulus between the casing and well wall.When a DHE is installed and heat is extracted, the convectioncell reverses owing down in the casing (around the DHE)and up the annulus. Similar circulation patterns were notedin New Zealand using convection promoters.
The convector pipe is simply a pipe open at both endssuspended in the well above the bottom and below the staticwater level (Figure 4). The DHE can be installed either in
the convector or outside the convector, the latter being moreeconomical since a smaller convector is used. Both lab andeld tests indicate that the convection cell velocities areabout the same in optimized designs and are similar to thosemeasured in the undersized casing system. A summary of the New Zealand research can be found in the followingreferences: Allis and James, 1979; Freeston and Pan, 1983;Dunstall and Freeston, 1990; Hailer and Dunstall, 1992.
Promoter pipes had been tried on a limited scale inKlamath Falls previous, but not documented to any extent(see Chiasson, et al., 2005; Chiasson and Swisher, 2007).
Figure 3: Temperature vs. depth for a geothermal well (with
and without perforations).
Figure 4: Convector promoter and DHE (New Zealand
type) (Allis and James, 1979).
Figure 2: Well completion systems for DHE (type c with the
vertical convection cell – preferred).
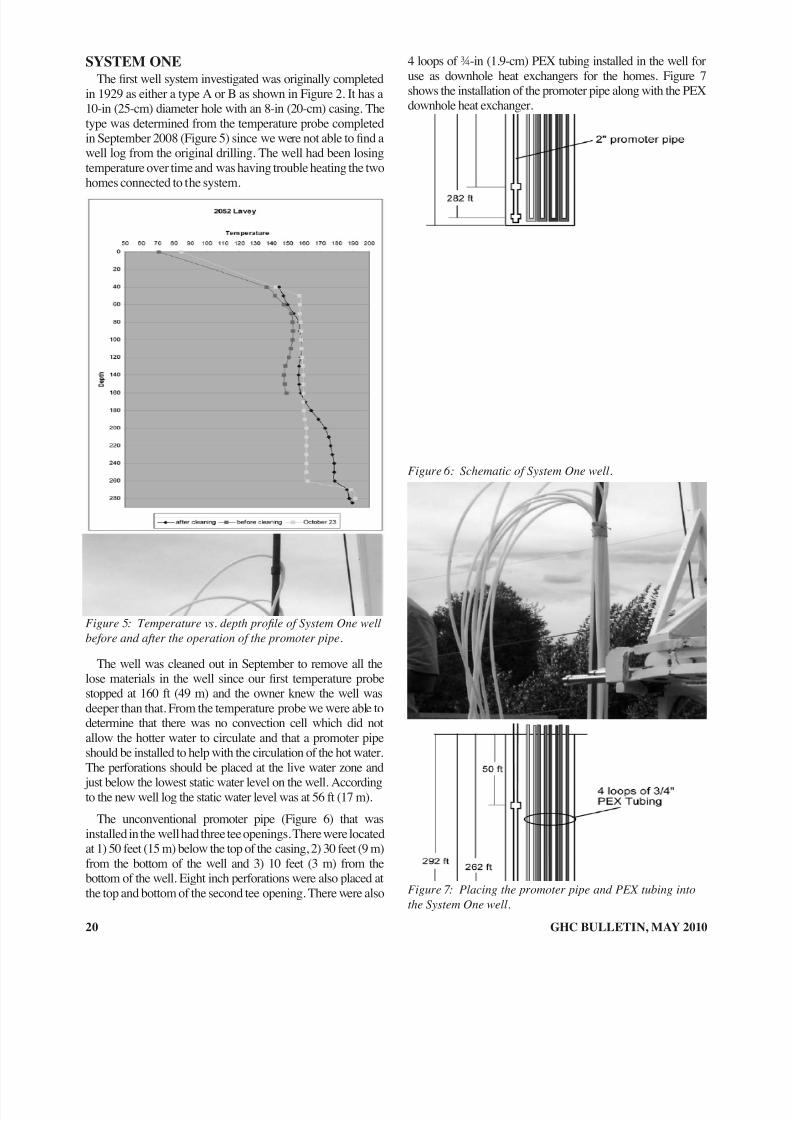
8/8/2019 May 2010 Geo-Heat Center Quarterly Bulletin
http://slidepdf.com/reader/full/may-2010-geo-heat-center-quarterly-bulletin 22/28
20 GHC BULLETIN, MAY 2010
SYSTEM ONEThe rst well system investigated was originally completed
in 1929 as either a type A or B as shown in Figure 2. It has a10-in (25-cm) diameter hole with an 8-in (20-cm) casing. Thetype was determined from the temperature probe completedin September 2008 (Figure 5) since we were not able to nd awell log from the original drilling. The well had been losingtemperature over time and was having trouble heating the two
homes connected to the system.
The well was cleaned out in September to remove all thelose materials in the well since our rst temperature probestopped at 160 ft (49 m) and the owner knew the well wasdeeper than that. From the temperature probe we were able todetermine that there was no convection cell which did notallow the hotter water to circulate and that a promoter pipe
should be installed to help with the circulation of the hot water.The perforations should be placed at the live water zone and
just below the lowest static water level on the well. Accordingto the new well log the static water level was at 56 ft (17 m).
The unconventional promoter pipe (Figure 6) that wasinstalled in the well had three tee openings. There were locatedat 1) 50 feet (15 m) below the top of the casing, 2) 30 feet (9 m)from the bottom of the well and 3) 10 feet (3 m) from thebottom of the well. Eight inch perforations were also placed atthe top and bottom of the second tee opening. There were also
4 loops of ¾-in (1.9-cm) PEX tubing installed in the well foruse as downhole heat exchangers for the homes. Figure 7shows the installation of the promoter pipe along with the PEXdownhole heat exchanger.
Figure 5: Temperature vs. depth prole of System One well
before and after the operation of the promoter pipe.
Figure 6: Schematic of System One well.
Figure 7: Placing the promoter pipe and PEX tubing into
the System One well.

8/8/2019 May 2010 Geo-Heat Center Quarterly Bulletin
http://slidepdf.com/reader/full/may-2010-geo-heat-center-quarterly-bulletin 23/28
21GHC BULLETIN, MAY 2010
Another temperature probe was completed in October2008 to see how the system was performing. The systemwas in operation at the time of the temperature probe. Ascan be seen from Figure 5, the temperature from the top teeto the second tee the temperature is constant, which showsthat a convection cell has been obtained. This was probablydue to the fact that the system was in operation and not fromthe promoter pipe since the top tee is unfortunately abovethe water level of the well. If the water level happens toincrease enough to cover the rst tee then the temperaturecurve from 50 ft to 262 ft should shift to the right.
SYSTEM TWOThe second system had an 8-in (20-cm) well drilled in
2002 to 370 ft (113 m). The well was originally cased with a6-in (15-cm) casing and perforated with the lowerperforations located in the “live water” zone 10 to 20 ft (3 to6 m) from the bottom of the well and the perforations in theupper part of the casing (170 to 190 ft (52 to 58 m) from thetop of casing) placed at the estimated lowest static waterlevel. Static water at the time was 170 ft (52 m) below the
casing and the temperature coming into the home was 175˚F(79˚C). Temperature probes were completed after the wellwas drilled and after the casing was installed as can be seenin Figure 8 and shows that a convection cell was obtained inthe well.
After 6 years of operation, during the early part of 2008,the owner of the system reported that he was having trouble
heating his home. The temperature of the DHE entering thehome was down to 130˚F (54˚C). At that time it wasdetermined that the water level in the well dropped to 188ft (57 m) and has apparently dropped below the top level of the perforations in the upper level, causing the convectioncell of the well to decrease or disappear all together thusdecreasing output temperature of the DHE. The homeowner put water down into the well for 4 hours to raise thelevel of the water into the well. This seemed to help andthe temperature into the house did increase. Thetemperature again decreased in the later part of 2008 andwe were able to determine that the water level has againdropped below the bottom part of the upper perforations.
It was then decided to insert a 2-in (5-cm) diameterpromoter pipe into the well to get a convection cell started.The perforations in the 2-in (5-cm) promoter pipe weretorch cut 1/2-in X 3-in, spaced approximately every 12inches (30.5 cm) alternated in three areas along 18ft (5.5-m) of two lengths. The promoter pipe perforations are nowplaced from approximately 336 ft to 316 ft (102 to 96 m)and 210 ft to 190 ft (64 to 58 m) as shown in Figure 9. The
length of the DHE was also extended another 21 ft (6 m).After the promoter was placed in the well anothertemperature probe was completed and as seen in Figure 8it shows that convection cell has returned. As a result of this improvement, the home’s DHE incoming temperatureis approximately 170˚F (77˚C).
Figure 8: Temperature vs. depth prole of the System Two
before and after casing installation and after installation of
the promoter pipe.
Figure 9: Schematic of System Two well.

8/8/2019 May 2010 Geo-Heat Center Quarterly Bulletin
http://slidepdf.com/reader/full/may-2010-geo-heat-center-quarterly-bulletin 24/28
22 GHC BULLETIN, MAY 2010
SYSTEM THREE (Lund et al., 2008)The third system, at time of completion, was cased with
a 12-in (30.5 cm) diameter casing from the surface to 219ft (67 m) and then with a 10-in (25-cm) casing from 210 ft(64 m) to the bottom at 354 ft (108 m). It only hadperforations at the bottom to allow for hot water inowfrom the fractured basalt aquifer as can be seen in Figure10. Due to the way this well was completed there was no
natural convection cell generated. This well was considereda “pumper and dumper” for they used a suction pump tobring the heat from the bottom of the well and thendischarged to the storm sewer.
System Three was having trouble heating the facilityeven when the pump was running. This was especiallytrue for cold mornings and warm afternoon where thesystem had to adjust to the changing weather conditions.The problem was researched and discussed and there wereseveral options on how to x the problem. The optionswere rip the casing to produce the necessary openings fora convection cell, install a smaller perforated casing inside,lengthen the downhole heat exchanger or install a promoterpipe. It was decided the best solution was to install a 4-in(10-cm) diameter promoter pipe then the estimated 200 ft
(61 m) of downhole heat exchanger pipes would not have tobe removed.
CONCLUSIONSIn early March, 2008, 354 ft (108 m) of 4-in (10-cm)
diameter promoter pipe was installed. Very few problemswere encountered getting the pipe past the downhole heatexchanger and the casing size change. Approximately 1-in(2.5- cm) diameter holes were torch cut in the pipe 7 to 10ft (2 to 3 m) off the bottom and 15 to 20 ft (4.5 to 6 m) fromthe top (Figure 11). The casing was hung from a plate at
the casing top – which is about 3 ft below street level. Weelected to hang the casing off the bottom, as setting it onthe bottom might bury the lower holes in nes sloughedinto the bottom, thus preventing the circulation cell fromworking. The static water level was about 8 ft (2.4 m)below the surface. Before the top holes were cut, wemeasured the water temperature inside the promoter pipeas show in Figure 12 the following day. The problem withthe well is readily shown, with only about 154˚F (68˚C) forthe rst 150 ft (46 m) and then increasing to 192˚F (89˚C)from 225 ft (69 m) to the bottom. Thus, the downhole heat
Figure 10: Schematic of System Three well.
Figure 11: Cutting the 1-in diameter perforations in the
promoter pipe for System Three.
Figure 12: Temperature vs. depth prole of System Three
well before and after the operation of the promoter pipe.

8/8/2019 May 2010 Geo-Heat Center Quarterly Bulletin
http://slidepdf.com/reader/full/may-2010-geo-heat-center-quarterly-bulletin 25/28
23GHC BULLETIN, MAY 2010
exchanger was only exposed to the cooler temperaturewhich is marginal for this type of installation, and sincethere was no convection cell, would cool even more withheating demand.
The top holes in the promoter pipe were then cut and thepipe installed. We then measured the water temperatureprole the next day and received encouraging results. Thepromoter pipe was working and providing around 171˚F
(77˚C) over the entire well depth and obviously creating aconvection cell bringing hot water up from the bottom (seeFigure 12). Subsequent reading produced similar results asshown in Figure 12. The slight variations are due tovariations in heating demand for the building, lowerreadings on cold days and higher reading on warm days.The readings were taken from March 5 through March 14(all around 1:00 PM) where the low temperatures werearound 28˚F (-2˚C) and the highs around 50˚F (10˚C).Another temperature probe was completed in Augustwhich shows the temperature has increase from 175˚F to192˚F (79 to 89˚C).
As can be seen from the three systems described abovethe design and placement of the convection cell system isvery important to the operation of the downhole heatexchanger. The three systems have been completeddifferently and the results have varied greatly. System Onewill probably encounter problems in the future unless theydecide to lower the location of the top tee or the water levelincreases. One of the owners has replied that thetemperature coming in to his home is adequate, but not ashigh as he expected considering the temperature at thebottom of the well. When System Two was completed theperforations should have been placed lower that they werefor they were placed just below the water level. With the
installation of the promoter pipe the system seems to beoperating in a satisfactory matter at this time and theowner is pleased with the temperature coming in to hishome. The less costly option for System Three was theinstallation of the promoter pipe and they have reportedthey are getting very adequate and uniform heat into thebuilding now.
REFERENCESAllis, R. G.: A Study of the Use of Downhole Heat Exchangersin the Moana Hot Water Area, Reno, Nevada. Geo-HeatCenter, Klamath Falls, OR (1981).
Allis, R. G. and R. James: A Natural Convection Promoter forGeothermal Wells, Geo-Heat Center, Klamath Falls, OR(1979).
Chiasson, A. D., G.G. Culver, D. Favata, and S. Keiffer:
“Design, Installation and Monitoring of a New Downhole HeatExchanger”, Transactions, Geothermal Resources CouncilVol. 29, Davis, CA (2005).
Chiasson, A. D. and R. Swisher: “Continuing Advances inPEX Downhole Exchangers for Direct-Use HeatingApplications”, Geo-Heat Center Quarterly Bulletin, Vol. 28,
No. 2, Klamath Falls, OR (2007).
Culver, G. G., and G. M. Reistad: Evaluation and Design of Downhole Heat Exchangers for Direct Applications, Final Report, Contract No. EY-76-S-06-2429, prepared for the U.S.Energy Research and Development Administration, OregonInstitute of Technology, Klamath Falls, Oregon (1978).
Culver, G. G.: DHE. Report prepared for USDOE, Geo-HeatCenter, Klamath Falls, OR (1990).
Culver, G.G. and J. W. Lund: “Downhole Heat Exchangers”,Geo-Heat Center Quarterly Bulletin, Vol. 20, No. 3, KlamathFalls, OR (1999).
Dunstall, M. G. and D. H. Freeston: “U-Tube Downhole HeatExchanger Performance in a 4-Inch Well, Rotorua, NewZealand”, Proceedings, 12th New Zealand GeothermalWorkshop, pp. 229-232 (1990).
Freeston, D. H. and H. Pan: “Downhole Heat Exchanger”,Proceedings, 5th New Zealand Geothermal Workshop, pp.203-208 (1983).
Hailer, S. and M. G. Dunstall: “Downhole Heat ExchangerExperiments in a Laboratory Scale-Model Well”, Proceedings,14th New Zealand Geothermal Workshop, pp. 93-98 (1992).
Lund, J. W., T. Boyd, B. Hackman, and B. Huffman: “Use of Promoter Pipe with Downhole Heat Exchangers in KlamathFalls, Oregon”, Proceedings, New Zealand GeothermalWorkshop and NZGA Seminar 2008 (2008).
Lund, J. W.; Culver, G. G. and L. S. Svanevik: “Utilization of Intermediate-Temperature Geothermal Water in KlamathFalls, Oregon”, Proceedings, 2nd U.N. Symposium in theDevelopment and Use of Geothermal Resources, San Francisco,CA, Vol. 2, p. 2147-2154 (1975).

8/8/2019 May 2010 Geo-Heat Center Quarterly Bulletin
http://slidepdf.com/reader/full/may-2010-geo-heat-center-quarterly-bulletin 26/28
24 GHC BULLETIN, MAY 2010
OREGON’S FIRST GEOTHERMAL COMBINED HEAT AND POwER PLANT DEDICATIONKristina Hakanson Maupin and John W. Lund, Oregon Institute of Technology Photographs by Kristina Hakanson Maupin
Oregon Institute of Technology (OIT) dedicated its newgeothermal electric generation project in a ceremony onApril 20, 2010. The event was followed by tours of the pow-er plant located on the southeast corner of the campus adja-
cent to the existing geothermal wells.This “small” power plant is the rst geothermal combined
heat and power plant in Oregon, and the only geothermalelectric plant currently operating in the state. It is also therst geothermal power plant in the world to operate on acampus from a resource directly underfoot. It has a maxi-mum installed capacity of 280 kilowatts gross power utiliz-ing existing geothermal wells on the campus.
The emcee for the event was John W. Lund, ProfessorEmeritus and Director of the Geo-Heat Center who outlinedthe geothermal development on campus from 1959 to pres-ent. Other speakers at the event were: Oregon State Repre-
sentative Bill Garrard; Bob Simonton, Assistant Vice Chan-cellor for Capital Programs, Oregon University System; andPeter West, Director of Energy Programs for Energy Trustof Oregon. Mr. West presented a check for $487,000 fromthe Energy Trust of Oregon to help cover the cost of thegeothermal plant. Funding support was also provided by theOregon University System, Oregon Department of Energyand a “Blue Sky” grant from Pacic Power. The KlamathUnion High School Jazz Band performed before and afterthe event.
Dave Ebsen, OIT Director of Facilities along with staff members, Scott Keiffer and Don Depuy, were instrumentalin insuring that the plant was operational in time for thededication.
The OIT campus has been entirely heated with geother-mal energy since the early 1960s, saving approximately$1,000,000 per year in heating costs. These wells produce600 gallons per minute (38 liters per second) of 192 to 196˚F(89 to 91˚C) water. After the geothermal water passesthrough the power plant and 15 to 20˚F (8 to 11˚C) is ex-tracted, the water is then used to heat campus buildings be-fore it is injected into wells on the lower part of campus. Thepower plant produces net electricity from 150 to 200 kW,depending upon the season, which is either used on campusor fed into the Pacic Power grid.
A second “big” geothermal power plant is planned, too.The 1.0 to 1.2 megawatt proposed project will utilized a5,300-foot (1,600-meter) deep well drill on campus in 2009.The big project is expected to be complete in 2012.
John Lund, Director of the Geo-Heat Center
Bill Garrard, Oregon State Representative
Bob Simonton, Assistant Vice Chancellor, Oregon
University System

8/8/2019 May 2010 Geo-Heat Center Quarterly Bulletin
http://slidepdf.com/reader/full/may-2010-geo-heat-center-quarterly-bulletin 27/28
25
The power plant building with cooling tower.
The power plant inside the building.
John Lund describing plant operation to Bob Simonton,
with State Senator Doug Whistett and Brian Brown in the
background.
Toni Boyd conversing with a visitor about the power plant.
Right: Presentation of the check from Energy Trust of
Oregon. From left to right: Peter West, OIT President Chris
Maples, John Lund, OIT Interim Vice President for Finance
and Administration Mary Ann Zemke, OIT Geo-Heat
Center Assistant Director Toni Boyd, OIT Director of
Facilities Dave Ebsen, and Bob Simonton.
Klamath Union High School Jazz Band led by Drew
Langley.
GHC BULLETIN, MAY 2010

8/8/2019 May 2010 Geo-Heat Center Quarterly Bulletin
http://slidepdf.com/reader/full/may-2010-geo-heat-center-quarterly-bulletin 28/28
Non-ProftOrganization
U.S. PostagePAID
Klamath Falls, ORPermit No. 45
GEO-HEAT CENTEROregon Institute of TechnologyKlamath Falls, OR 97601-8801
Dave Ebsen discussing the power plant operation with
Brian Brown.
Scott Keiffer describing the plant operation with Peter West.
Don Depuy conversing with Mike Ronzello about the power
plant.
Pratt & Whitney representative Mike Ronzello.