Embed Size (px)
Citation preview

Université du Québec
A CROSS-CUL TURE STUDY OF RISK MANAGEMENT IN
SOFTW ARE PROJECTS
MÉMOIRE
PRÉSENTÉ À
L'UNIVERSITÉ DU QUÉBEC À RIMOUSKI
comme exigence partielle
du programme de maîtrise en gestion de projet(M.Sc.)
By
Xuke Cao (Colin)
May, 2006

UNIVERSITÉ DU QUÉBEC À RIMOUSKI Service de la bibliothèque
Avertissement
La diffusion de ce mémoire ou de cette thèse se fait dans le respect des droits de son auteur, qui a signé le formulaire « Autorisation de reproduire et de diffuser un rapport, un mémoire ou une thèse ». En signant ce formulaire, l’auteur concède à l’Université du Québec à Rimouski une licence non exclusive d’utilisation et de publication de la totalité ou d’une partie importante de son travail de recherche pour des fins pédagogiques et non commerciales. Plus précisément, l’auteur autorise l’Université du Québec à Rimouski à reproduire, diffuser, prêter, distribuer ou vendre des copies de son travail de recherche à des fins non commerciales sur quelque support que ce soit, y compris l’Internet. Cette licence et cette autorisation n’entraînent pas une renonciation de la part de l’auteur à ses droits moraux ni à ses droits de propriété intellectuelle. Sauf entente contraire, l’auteur conserve la liberté de diffuser et de commercialiser ou non ce travail dont il possède un exemplaire.

II
ACKNOWLEDGMENTS
It is indeed challenging, thankfully, stimulating and fun for the author to write this thesis
into an understandable and practical form . This undertaking could not have happened
without the help of many people. It is impossible to acknowledge appropriately all the
many individuals whose experiences, insights and support influenced the development
and writing ofthis thesis . But there are specifie people to whom the author especially
owes a great deal of thanks. My thanks to : ail the Chinese and Canadian experts who
supported me to fulfill the research.
The author especially wants to thank the supervisor: Professor Didier Urli who gave the
valuable supervisions and suggestions to this thesis.

III
ABSTRACT
Prior literature suggests that an adequate assessment of software project risk is a major
source of problems in rs development projects. A systematic and rigorous procedure to
identify the risks is the first step of the risk assessment. An authoritative list of risk
factors is one of the most useful strategies to identify the risks and to go further of the
study and theory development. However most of the published lists are too old and vary
too much in their level of detail and scope. This paper used a Delphi survey to provide
an updated and practical list of common risk factors. This li st was based on the
responses of a multicultural set of Chinese and Canadian project managers in software
projects. We also had them ranked those risk factors according to their professional
experiences. This multicultural study will not only help the Chinese software industry to
develop more healthy and speedy, but also, it will help the Canadians to understand
more about Chinese software industry. It is very interesting to compare our findings
with the previous list from the literature. We compared and analyzed the risk factors and
the ranking obtained in this paper with published lists, we also compared and analyzed

IV
the results between the two countries. Finally we concluded that this study has several
implications for software risk management and further research.

v
TABLE OF CONTENTS
ACKNOWLEDGMENTS .. .......... ... ............................................................ ......... .... 1
ABSTRACT ........ ................................................... ........................................... .. . XII
TABLE OF CONTENTS ..... .. ...... ....... ........ .... .. .. .. ...... ... ........... .. ....... .. ..... ........... XIII
LIST OF FIGURES ............................................ ....... ................. ........ ......... ..... .. XV
LIST OF TABLES ........... ....... .. ...... .... ................................. ..... ...... ... ........ ........ XVI
LIST OF APPENDIXES ........ .... .................. .. ........ ....... .... ...... ............. .. ... ........ XVII
CHAPTER 1 INTRODUCTION ....... ... ........ ..... .......... ..... ... ........ ....... ... .................. 1
1.1 General Content ...... .... ..... .............................. .... ... ... ... .... ...... ..... .... ... .. .. .. 1
1.2 Research Background and Motivation .................... .. ............................... 2
1.3 Contributions and Benefits .............................. .... .............. ................ ....... 7
1.4 Document Structure ................................................................................. 8
CHAPTER 2 LlTERATURE REVIEW ................................................................. 10
2.1 Risk Theories .. .. .. ..................... .............................................. ................ 10
2.1 .1 High Failure .. ......... ... .... ........................ ... ............ .. .......... ........... . 10
2.1.2 Risks varies by project and activity ........ .. ................................ .... 12
2.2 Project management theories .................................. ........ .... .... .. .... ........ 13
2.2.1 General PM theories .. ............ ...... ...... .. .......... ............ .................. 13

VI
2.2.2 project Management in Managing Risk .......... .. .. ...... .. .. .... .. ......... 14
2.3 Risk Management Theories .............. .... .... ............ .... .. ........ .. .... .... ... .. .... 19
2.4 Theories of Risk Management in Software Projects ... ... ......... ..... .. ....... . 21
2.4.1 Management and Control Software Project Risks ....... .. ...... ........ 23
2.5 Risk Identification (PMBOK 2004) ........................ ..... .. ............ ...... .... .... 24
2.5.1 Risk Identification: Toois and Techniques .. .......... .. .... ........ .. .. .. ... 26
CHAPTER 3 RESRARCH DESIGN AND METHODOLOGY .. ... .. .. .. ................ .. . 30
3.1 Design of the Study and Research Method .. ...... .. ...... .. ............ ..... ........ 30
3.2 Composition of the panels .... .. ... ...... ....................... ........................... .. .. 31
3.3 Data Collection and Analysis Method .... .... .... ...... .. .......... .... ........ .. .... .. .. 31
3.3 Results ...... ... ... ..... ........... .. .... ... .... ...... .......... ... .... ... ... .. .. .. ........ .. .... .... ..... 33
3.3.1 Compared with Previous List.. ..... .... .. .. .... .. ...... .. ...... .. ...... .. .......... 33
3.3.2 Rank of Risk Factors ...... .. ...... .. .............. ........ .. .. .. .............. .. ...... .41
3.3.3 Analyses of Results ............ ....... .. ...... .. .. .. .......... .... .. .. .. ...... .......... 44
3.4 Limits of Research .................. ...... .................. .. ..................................... 48
3.5 Future Research ........ ..... .. ... .... .... ....... ... ............ ... .... ... .. .... ....... ...... ... .... 49
CHAPTER 4 CONCLUSiON .. ... .................. .. ...... .. .............. .. .. .. .... .. ..... ......... ...... 51
REFERENCES .... ...... ........ ... .......... ..... .... .. ........ ... .......... .... ... ........... .. ................ 53

VII
LIST OF FIGURES Figure 1.1 Project manage in software development process (Reference 24) .... .4
Figure 2.1 Project Risk Management processes ....... .... .............. ... .... ................ 17
Figure 2.2 Process Flow Diagram of Risk Management by PM ....................... .. . 18
Figure 2.3 PM Risk Identification ....................................... .. ................... ....... .... . 25

VIII
LIST OF TABLES Table 1 List of Risk Factors .. ............. ..... .. .... ..... ... ... ... ......... ... .... ..... ...... ............. 36
Table 2 List of New Factors .. ........ ........... .. ..... ... .... .......................... ...... .......... ... 40
Table 3 Rank of Risk Factors ......... ....... ........ ............ .......... .... ..... ......... ............. .42
Table A: Average Scale of Risk Factors ........ ... ...... ..... ............. .... ... .... .............. . 59
Table B: Compared with the list of literature .............. .............. .... ...... ....... ... ....... 63

IX
LIST OF APPENDIXES Appendix A. Average Scale of Risk Factors .... ...... .... . Erreur! Signet non défini.
Appendix B. Compared with the List of Literature .... ... Erreur! Signet non défini.
Appendix C Text in French .. .. .... .... .. .......................... . Erreur! Signet non défini.

IX
LIST OF APPENDIXES Appendix A. Average Scale of Risk Factors .. .... ...... .............. ............ .. .. ............. 59
Appendix B. Compared with the List of Literature .................................. .......... ... 63
Appendix C Text in French .... .. .... .. .... .... ................ ............ .. .. .... .... .. ........ .. .. .. ..... 66

CHAPTER 1
INTRODUCTION
1.1 General Content
1
In the third industrial revolution, one of the most useful innovations is the
computer science. As a new technology, computer science has changed a lot of our life.
It can be found everywhere in your daily life now. And software teclmology is one of the
fastest growing industries in developed countries (Hartman and Ashrafi, 2002). Software
projects can implement a rapidly expanding range of equipment, applications, services,
and basic technologies that provide information to support the operation, management,
analysis and decision-making functions within an organization.
But it isn't doing very during its development. In 2004, the Standish Group
International study of 9,236 IT projects revealed that 53% were late or over budget, 18
% were abandoned, scaled back or modified, and only 29% were completed on time and
on budget. Since a large proportion of the cause of late, over budget delivery of software
are management related, the research for taking managerial actions to solve the problem
has been important. Software project risk management is the key to reduce the chance of

2
failure. And among aIl the process of risk management, the identifying and analyzing
can be the most important parts of ail. (Boehm. B 1991)
China is the biggest developed country in the world. According to the National
Bureau of Statistics of China, in the year 2002 the software industry increased from
1359 enterprises to 3740 compared with the year 2001. The mmual sale in software
industry increased from 2 190 472 RMB to 5 855 742 RMB . But it is still a new
burgeoning industry in China, the y even don not have statistics figure in the year 2000 .
A lot of management skills such as project management have been just introduced in
Chinese software industry.
We found sorne Chinese and Canadian experts in software projects to help us to do
this cross-culture research. This research will try to find out a list of risk factors and the
key risk factors in software projects in the frame of project management.
1.2 Research Background and Motivation
In contrast to on-goll1g, functional work, a project IS "a temporary endeavor
undertaken to create a unique product, service, or result" (A Guide to the Project
3
Management Body of Knowledge (PMBOK® Guide, Third Edition, Project
Management Institute, 2004, p. 5). Projects are temporary because the y have a definite
beginning and a definite end. They are unique because the product or service they create
is different in some distinguishing way from similar products or services.
What' s the project management? Project management is the application of
knowledge, skills, tools and teclmiques to project activities to meet project requirements.
Project management is accomplished through the use of the pro cesses of initiating,
planning, executing, monitoring and controlling, and closing. The project manager is the
individual responsible for managing the project. Project management is the discipline of
defining and achieving tat'gets while optimizing the use of resources (time, money,
people, space, etc) . Thus, it could be classified into several models : time, cost, scope,
and intangibles.
Software Project Management is a crucial part of Project Management. Because of
more uncertainty of software Projects, it usually means more risks and more potential
costs, and the Risk Management of software Projects goes more important and difficult.
The research applies to analysis the Risk Source of software Projects, and also offers
Risk Resolution for each Risk Source, so we can make it clear about the Risk & Risk
Management of software Project.

4
Within the context of the software development process the project management
role is responsible for driving the work through the pro cess and to completion. Starting
with the earliest requirements discovery sessions and ending after the training has been
completed, the project manager is the one role that should be consistent tlu·oughout.
Project managers work with both the development team and with business stakeholders
to ensure that what is being built will match what the customer expectations and that this
development occurs within the expected time frame .
Figure 1.1 Project ma nage in software development process (Reference 24)
Su~ Matier c--"] E1pert
1
1 Subjocl Mattar
Expen c--"]
Subjocl Matter Expert
!
;
·t'orol Fune Alla t)"St
1 Functonal An.lys!
;
-
. ..1
S()lh,~,. Oeveloprr."nllff~ Cyel" (Nêrsigl11
Oe~eklpmrlrll f-- Pr~ect Manager Manager
1 ! 1
1 ~[::~h Developmem 1 lead G 'f-1
J ' Devebper
&>lutions Aid'iied
Oevel:Jper r-
,--_l_e~_é --' i Oevelopef J Ü\1veIoprnool EJ
1 1 1 1
QuaUiy Assurance
Quati!)' Assurance
: j - ;
Depb
I ;
Risk is defined as "The possibility of suffering harm or 10ss; danger." Even if
we're not familiar with the formaI definition, most of us have an innate sense of risk. We
are aware of the potential dangers that permeate even simple daily activities, from

5
getting injured when crossing the street to having a heart attack because our cholesterol
level is too high. Although we prefer not to dwell on the myriad of hazards that surround
us, these risks shape many of our behaviors. Experience (or a parent) has taught us to
look both ways before stepping off the curb and most of us at least think twice before
ordering a steak. Indeed, we manage personal risks every day.
Risk management is becoming recognized as a best practice 10 the software
industry for reducing the surprise factor. While we can never predict the future with
certainty, we can apply structured risk management practices to peek over the horizon at
the traps that might be looming, and take actions to minimize the likelihood or impact of
these potential problems. Risk management means dealing with a concern before it
becomes a crisis.
The term risk management is app lied in a number of diverse disciplines. People in
the fields of statistics, economics, psychology, social sciences, biology, engineering,
toxicology, systems analysis, operations research, and decision theOl'y, to name a few,
have been addressing the field of risk management.
Kloman summarized the meaning of risk management in the context of a number
of different disc iplines in an article for Risk Analysis:
6
What is risk management? Ta many social analysts, politicians, and academics it
is the management of environmental and nuclear risks, those technology-generated
macro-risks that appear ta threaten our existence. Ta bankers and jinancial officers if is
the sophisticated use of such techniques as currency hedging and interest rate swaps. Ta
insurance buyers and sellers if is coordination of insurable risks and the reduction of
insurance costs. Ta hospital administrators it may me an "qualily assurance. " Ta safety
professionals il is reducing accidents and injuries.
For a risk to be understandable, it must be expressed clearly. A statement of
Software Engineering Institute (SEI) must include
•
•
A description of the CUlTent conditions that may lead to the loss
A description of the loss
The SEI Software Risk Evaluation (SRE) Service is a diagnostic and decision-
making tool that enables the identification, analysis , tracking, mitigation, and
communication of risks in software-intensive programs. An SRE is used to identify and
categorize specific pro gram risks emanating from product, process, management,
resources, and constraints. The program's own personnel participate in the identification,
analysis, and mitigation of risks facing their own development effort.

7
Risk identification is a creative process, which has to be done by risk management
personnel. It cannot be replaced by any software. Whether software project managers
choose to employ common checklists, but at the end managers will need to think through
ail processes and identify the steps that can become subject to a threat. Doing risk
identification will help managers to get a feeling of the uncertainties in their business or
project. They will learn what uncertainties may be combined to a single one or which
uncertainty contains different risks and therefore should be divided into separate risk .
The task of risk identification is crucial to success of risk management. The software
project managers should spend time and thoughts on this. Consistent with the views of
March and Shapira (Managerial perspectives on risk and risk taking 1987) regarding
management risk, we define a risk factor as a condition that can present a serious threat
to the successful completion of a software development project. Though several lists of
risk factors have been published in literature (eg: reference No. 2, NO . 3, No. 37), we
believe our understanding of the typical risk factors is still not very correct. Because
most of the lists are relatively old and their data collect and analyze method is
questionable .
1.3 Contributions and Benefits

8
During their management of Software Projects, the managers would always ask
what are the typical risk factors in the software projects? Which risk factors would the y
consider more deserving of their attention? Which strategies are more effective in
mitigating risk, given a particular set of risk factors?
In this research, we will try to figure out the first two questions, as the first two
questions are the keys to continue further study and development to answer the third
question. We will report a new list of risk factors and make a rank of these risk factors .
These findings will help the software projects managers to have a list of risk factors to
follow in the risk management process, and particularly pay more attention to the top
ranked risk factors. Besides as our research is based on a cross-culture study, we hope
our research can help the mangers to de al with different cultures in their software project.
1.4 Document Structure
In the first part, the related research and methodology used to achieve in this
research are presented. The second part shows the proposed researched design and
methodology used in conducting the whole study. Thirdly we present the major finding

9
of the research. FinaUy, the last part presents the application and the conclusion of our
research and the potential for future research.

CHAPTER2
LITERATURE REVIEW
2.1 Risk Theories
2.1.1 High Failure
10
Project failure is an ongoing issue in software projects. During the relative infancy
of computerized information systems in the 1960s, the difficulties of software project
management and associated project fai lure were traced to inadequate system definition,
improper vesting of responsibility, inherent complexity and fascination with technology
to the detriment of meeting business needs (Gale 1968). Recent authors have conc1uded
that software projects fail due to the inconsistent use of estimation metrics, complexity
in both the design and implementation of software, insufficient experiences staff
available to complete project tasks, inadequate project management (Glass 1998; Reel
1999).
Another explanation for the high fai lure rates in software projects IS " that
managers are not taking prudent measures ta assess and manage the risks involved in

1 ]
these projects" (Keil 1998, p 76). But taking prudent risk management measures may be
hindered by the complexity encountered when attempting to collect sufficient
information to develop an informed judgment. It is rarely sufficient to simply ask other
project participants for their views about a project's status and its associated risks.
Understanding a project ' s risk characteristics requires reliable information. To acquire
this information, a manager cou Id be faced with the overwhelming task of examining a
mountain of project documents. This examination could inc1ude reading and analyzing
project schedules, budgets, status reports and meeting minutes as weIl as assessing the
status and quality of various types of project deliverables .
One research response to the problem of software project failure is the software
project risk steam. Gartner (1995) believes that the goal of studying risk detection is to
facilitate identification of risks that may lead to larger problems in the future. Heemstra
and Kusters (1996) and Lister (1997) both emphasize the relationship between effective
risk management and increased probabilities in the success of a software project.
As project management and project control principles and practices become
familial' and established, the technology for estimating, budgeting, planning, and
scheduling are becoming weil understood and are coming into everyday use. In many

12
organizations, upper management IS now expanding the envelope to incJude risk
management as a routine requirement in any project management effOli.
2.1.2 Risks varies by project and activity
Many authors have made a well-reasoned case that risks vary by project and that
risk management practices must accordingly deal with the specific detail in each case
(Lister 1997). Project attributes that have discussed in the literature include Slze
(Moynihan 1997) and activity - maintenance vs. new development (Charette 1997).
Charette et al. (1997) argue that software maintenance risks differ in fundamental
ways from new develops. The authors describe a project that endeavors to
institutionalize risk management processes for an organization's software maintenance
processes. Key differences from new development risk management arise due to the
software maintenance project's need to sustain existing system availability while adding
functionality. The authors believe maintenance can be an inherently risky activity
because application systems may be decades old . Changes to existing software can be
complicated by the existence of li tt le or poorly kept documentation and software code
that has been subj ected to lays of changed. Charette et al. (1997) cite one other
13
difference between maintenance and new deve10pment. The typica1 risk reassessment
cycle of six to eight weeks for new deve10pment projects was considered to infrequent to
meet the demands caused by the respective and cumulative nature of software
maintenance releases (Charette 1997).
2.2 project management theories
2.2.1 General PM theories
In contrast to on-gomg, functional work, a project IS "a temporary endeavor
undertaken to create a umque pro duc t, service, or result" (A Guide to the Project
Management Body of Knowledge (PMBOK® Guide, Third Edition, Project
Management Institute, 2004, p. 5). Projects are temporary because they have a definite
begilming and a definite end . They are unique because the product or service they create
is different in sorne distinguishing way from similar products or services.
What's the project management? Project management is the application of
knowledge, skills, to01s and techniques to project activities to meet project requirements .
Project management is accomplished through the use of the processes of initiating,

14
planning, executing, monitoring and controlling, and closing. The project manager is the
individual responsible for managing the project. Project management is the di scipline of
defining and achieving targets while optimizing the use of resources (time, money,
people, space, etc). Thus, it could be classified into several models: time, cost, scope,
and intangibles. (PMBOK 2004)
2.2.2 Project Management in Managing Risk
The Project Management ro le is the first role in the software development pro cess
that isn't on the main line. The project manager isn't a person doing "real work." The
project management role is one that is des igned to help ensure that the software
development process works as it is intended. The project management ro le works closely
with the development management role in order to facilitate, encourage and prioritize
the process.
The project management role is perhaps the most clearly defined role within the
software development process due to the development of project management as a
profession.

15
While the software industry is nascent, the project management industry is
enJoyll1g the advancement of a powerful organization in the Project Management
Institute. They have assembled a guide to the body of knowledge for the project
management profession that is often referred to as the PMBOK Guide. This organization
has developed a widely recognized certification, Project Management Professional
(PMP), which has both practical experience requirements as weil as traditional testing
requirements.
Project Risk Management includes the processes concerned with conducting risk
management planning, identification, analysis, responses, and control on a project. The
objectives of Risk Management are to increase the probability and impacts of positive
events and decrease the probability and impacts of events adverse to project objectives.
Figure 2.1 provides an overview of the Project Risk Management processes and Figure
2.2 provides a process flow diagram of those processes and their inputs, outputs, and
other related knowledge are a pro cesses. The Project Risk Management processes include
the following. (PMBOK 2004)
1. Risk Management Planning - deciding how to approach, plan and execute the
risk management activities for a project.
2. Risk Identification - determining which risks might affect the project and
documenting their characteristics.

16
3. Qualitative Risk Analys is - prioritizing ri sks for subsequent further analysis or
action by assessing and combining their probability and impacts.
4. Quantitative Risk Analysis - analyzing numericall y the effect on overall project
objectives of identified ri sks.
5. Risk Response Planning - developing options and actions to enhance
opportunities and to reduce threats to project obj ectives.
6. Risk Monitoring and Control - tracking identified risks, monitoring res idual risks,
identifying new ri sks, executing risk response plans, and evaluating their
effectiveness throughout the proj ect life cycle.

17
Figure 2.1 Project Risk Management processes

Figure 2.2 Pro cess Flow Diagram of Risk Management by PM
Entel prise Commerci a 1 d<lt~ba5es E nvlronml?n tal
FactOrs
Policios. procedures. and guid<>1 Ines
Lessons rearned OrganizalÏl;Iflal Knowleoge base
Proccss As&ct.&
l~ l;il ~ .,: "':" SèopQ DeIInttJon P oJee! scope sttltel11en
Ir, l ,'" 5.2 l ', ':, . S3·2.Z·3) 1 ..
~.,.
Il .'fi' :» """ ...
COSI Mana~érnent Plan Schedule Manilgement Plan
Performance reporting
Oir:eet&~ PÎ"ojecl ~eC\ltioo l' I-W_or_Y. _Pc_r_fQ(_I11_(l_"c_e_l n_fa_J_m_3t_io~n
l '~ 4.4 !'
~j':j(3'2:3.~} .'
Risl\ (ogister Organizilt ional process assoIs
tupdatés)
RI* Mlllagement Phlnnk!(
11.1 (3.2.2.16)
Project management PlélM
RISk m<lnagernen! olan
Nlproved change reqr;ests Approved correctil'C octions Approvcd prc~n1 iVC actions
RIsk IdelltUlelltion
11.2 (3.2.2.16)
1" Approved ch<lnge requests
Risk r~ster
1 " Qualitative Rllik Analysls 11.3
(3.2.2.171
Risk register (updates)
Quantitative Ri,k Ai\tII~s u'.4
(3.2.2.18)
Risk mgisler (uP\lales)
Risi< RHJiOMe PilInnlnt
U .S (3.2.2.19)
Pro-ject miln ~gemel1 1
plan (updales)
Risk regi ster (\Ip<!ates) Ri k·n. lil ted cûr,WlClual agreeolènls
R,~è(m\:nu n(j.xl prt1\'t'nliw ,tClion,;; r-r-',----L--'T'"l ffecomnended oorreeU"e actions
Rlik Monltorinjl: .... d Control
11.6 (3.2.4.11)
Requested Cl12l1gêS l " .• oiili ' ,~, Rigi{ re{!ister (updates) ' 1t\~6~êd
"Change Cooùôl "..6' .
Plc;cct managolllflnt f3.2.ÜI , • LL ___ _ ---L-I plan ~ÙfXI1llcsJ
Note: Not ail process interactions and data flow allloilg the processes me shovm.
18

19
2.3 Risk Management Theories
Risk management covers a range of topics and uses a portfolio of tools. The
process of risk management covers risk planning, risk identification, ri sk assessment,
risk response, and risk documentation.
Every human endeavor involves risk (Wider and Davis, 1998). A risk has two
components-probability of occurrence and the effect of each occurrence. Projects are
unique undertakings that involve a degree of uncertainty and are inherently risky
(Chapman, 1998; Conroy and Soltan, 1998; Mak et al., 1998; PMI, 2000; Czuchry and
Yasin, 2003). Risk in projects can be defined as the chance of an event occurring that is
likely to have a negative impact on project objectives and is measured in tenus of
likelihood and consequence (Wideman, 1992; Carter et al., 1993 ; Chapman, 1998). Risk
management is an essential practice in achieving the successful delivery of SOFTW ARE
projects (Tuman, 1993; Remenyi, 1999). More specifically, it consists of the fo llowing
processes (Standards Australia, 1999):
• Establish the context;
• Identify risks ;
• Analyze risks;
• Evaluate risks ;

20
• Treat risks;
• Monitor and review;
• Communicate and consult.
The treatment of risk invo)ves the determination of the most appropriate strategies
for dealing with its occurrence (Standards Australia, 1999). According to Zhi (1994),
there are four main strategies for responding to project risks:
• A voidance - not undertaking the activity that gives ri se to risk.
• Reduction - reduce the probabi lity of a risk event occurring, and/or the
impact of that event. Risk reduction is the most common of ail risk-
handling strategies (Pritchard, 1997).
• Transfer - transfer of risk in whole or part to another party.
• Retention - accept risk and therefore the consequences should it
eventuate.
McFarlan (1981) suggested that projects fail due to lack of attention to individual
project risks, aggregate risk of portfo lio of projects and the recognition that different
types of projects require different types of management. Yet, software risk management
is either not undertaken at al! or is very poorly performed by many, if not most
organizations (Remenyi, 1999). A reason for this is that focusing on potential problems

21
may be viewed as being negative. However, management often wants to instill a positive
attitude towards the implementation of software, as it is often viewed as "flagship" for
change and subsequent process improvement within organizations.
2.4 Theories of Risk Management in Software Projects
Numerous attempts have been made to advance the understanding of the
underlying causes of and ways to alleviate software project failure . According to
Software Productivity Center Inc. Root causes of the most common project problems:
• Poor requirements definition and scope control
• Project estimation and risk plamling
• Project plam1ing
• Quality assurance
• Testing
• Configuration management
• Development process

22
Schmidt et al. (200 1) identify possible avenues for future research in their study of
software project risks. The authors ' recommendations include the following research
priorities:
1. Identify countermeasures for individual risks and specify both the
underlying behavior and sources of each risk.
2. Investîgate the possible interactions between risks .
3. Assess the different perceptions about a software project's risks that stem
from multiple organization perspectives.
4. Evaluate changes in software project risks over time for any given project
and combined project manager evaluations of the most important software
project risks.
5. Add cultural and environmental factors to account for perception
variances in software project risk.
6. Advance theory development for risk management especially in the area
of risk domains and behaviors.
Schmidt et al. (2001) conclude by starting "there is also a need to investigate how
managers today are actually managing risks - what works, what does not and why"
(Schmidt 2001 , P. 30)

23
2.4.1 Management and Control Software Project Risks
It is generally agreed (Heemstra 1996; Lister 1997) that effective risk management
111 software projects can help increase the probability of success. This can be
accompli shed by providing projects managers with risk management approaches that
enable managers to :
1. Cope with uncertainty inherent 111 software projects by identifying potential
problems before they occur.
2. Improve the process of risk identification and mitigation definition with
consistent application of these processes across multiple projects
3. Describe and address a project's unique issues and circumstances.
4. Develop mitigation measures to address a project's unique characteristics.
5. Justify the inclusion money and time in the form of contingency funds .
6. Provide cost rustication for proposed mitigation measures .
7. Demonstrate and address a divergence in opinion as to the risk that troubles any
given software project.
8. Periodically review and update risk mitigation approaches.
Risk management underlies two components of software projects - management
behavior and methodology. A risk manager ' s behavior may be described as proactive,
24
reactive or non-existent. Risk management methodoiogy encompasses systematic
approaches to identifying and addressing risks. Together, behavior and methodoiogy can
be used to expiain the capacity of software project teams to deal with both foreseen and
unforeseen risks (Phelps 1996).
2.5 Risk Identification (PMBOK 2004)
Risk Identification determines which risks might affect the project and documents
their characteristics. Participants in risk identification activities can include the
following, where appropriate: project manager, project team members, risk management
te am (if assigned), subject matter experts from outside the project team, customers, end
users, other project managers, stakeholders, and risk management experts . While these
personnel are often key participants for risk identification, ail project persolmel should
be encouraged to identify risks.
Risk Identification is an iterative process because new risks may become known as
the project progresses through its life cycle. The frequency of iteration and who
participates 111 each cycle will vary from case to case. The project team should be
involved in the pro cess so that the y can develop and maintain a sense of ownership of,

25
and responsibility for, the risks and associated risk response actions. Stakeholders
outside the project te am may provide additional objective information. The Risk
Identification process usually leads to the Qualitative Risk Analys is process.
Alternatively, it can lead directly to the Quantitative Risk Analysis process when
conducted by an experienced risk manager. On sorne occasions, simply the identification
of a risk may suggest its response, and these should be recorded for further analysis and
implementation in the Risk Response Planning process.
Figure 2.3 PM Risk Identification

26
2.5.1 Risk Identification: Tools and Techniques
2.5.1.1 Documentation Reviews
A structured review may be performed of proj ect documentation, including plans,
assumptions, prior proj ect files, and other information. The quality of the plans, as weIl
as consistency between those plans and with the project requirements and assumptions,
can be indicators of risk in the project.
2.5.1.2 Information Gathering Techniques
Examples of information gathering techniques used in identify ing risk can include:
• Brainstorming. The goal of brainstorming is to obtain a comprehensive list of proj ect
risks. The project team usually performs brainstorming, often with a multidisciplinary
set of experts not on the team. Ideas about project risk are generated under the
leadership of a facilitator. Categories of risk such as a risk breakdown structure can
be used as a framework. Risks are then identified and categorized by type of risk and
their definitions are sharpened.

27
• Delphi technique. The Delphi technique is a way to reach a consensus of experts.
Project risk experts participate in this technique anonymously. A facilitator uses a
questionnaire to solicit ideas about the important project risks . The responses are
summarized and are th en recirculated to the experts for further comment. Consensus
may be reached in a few rounds of this process. The Delphi technique helps reduce
bias in the data and keeps any one person from having undue influence on the
outcome.
• Interviewing. Interviewing experienced project participants, stakeholders, and subject
matter experts can identify risks . Interviews are one of the main sources of risk
identification data gathering.
• Root cause identification. This is an inquiry into the essential causes of a project' s
risks . It sharpens the definition of the risk and allows groupl11g risks by causes.
Effective risk responses can be developed if the root cause of the risk is addressed.
• Strengths, weaknesses, opportunities, and threats (SWOT) analysis. This technique
ensures examination of the project from each of the SWOT perspectives, to increase
the breadth of considered risks.
2.5.1.3 Checklist Analysis
Risk identification checklists can be developed based on historical information and

28
knowledge that has been accumulated from previous similar projects and from other
sources of information. The lowest level of the RBS can also be used as a risk checklist.
While a checklist can be quick and simple, it is impossible to build an exhaustive one.
Care should be taken to explore items that do not appear on the checklist. The checklist
should be reviewed during project closure to improve it for use on future projects.
2.5.1.4 Assumptions Analysis
Every project is conceived and developed based on a set of hypotheses, scenarios,
or assumptions. Assumptions analysis is a tool that explores the validity of assumptions
as they apply to the project. It identifies risks to the project from inaccuracy,
inconsistency, or incompleteness of assumptions.
2.5.1.5 Diagramming Techniques
Risk diagramming techniques may include:
• Cause-and-effect diagrams These are also known as Ishikawa or fishbone diagrams,
and are useful for identifying causes of risks.
• System or process flow charts. These show how various elements of a system
interrelate, and the mechanism of causation.

29
• Influence diagrams. These are graphical representations of situations showing causal
influences, time ordering of events, and other relationships among variables and
outcomes.

CHAPTER3
RESRARCH DESIGN AND
METHODOLOGY
3.1 Design of the Study and Research Method
30
This study aims to provide a list of risk factors of the software projects, and finds
out which of these risk factors are the key factors for the software project managers.
Software development is the daily work for the software experts, as to be an expert need
a lot of experiences; nobody knows better software risks than them. Obviously to find
out a list of risk factors in software projects, the software experts would be the best
source of information. And more experts join in this research; the list of risk factors will
be more valid and comprehensive. So we decided to have two panels of experts: Chinese
and Canadian, to present the OrientaIs and the Westerns. We also noticed that only one
round of research is not enough to have the feedback from the experts, we designed 3
steps of study: brainstorming, narrowing down and ranking. We will use systematic
procedures to elicit and rank factors.

31
3.2 Composition of the panels
We formed our panel of experts by recruiting software project managers from two
different socioeconomic environments to achieve variation in respondents' background
and culture settings.
We placed the members of the two panels from among experienced software
project managers in each culture. In China, we conununicated with Beihang University
who has a research center of Project Management. They provided us a list of experts of
14 panelists. In Canada, my director of Research Didier Urli who is an expert in
software project management built up a list of Il panelists that he knows. These two
lists are quite valid that the experiences of the panelists are minimum 5 years and the
education level is minimum bachelor degree.
3.3 Data Collection and Analysis Method
The survey process will be divided into three phrases: Brainstorming, Narrowing
Down and Ranking. In the first phase, a brainstorming techl1ique will be used to
contribute as many factors as possible from the panels. We will demand each panelist to

32
submit at least six factors of risk, and to provide short descriptions of each of them to
help the researchers in their collation. Exact duplicates will be removed, and the list of
all the factors will be provided to every panelist for correction, addition and validation.
The validation will be used to confirm that the factors we removed were exactly the
same factors, not just the similar factors.
In the second phase, we will divide the panels by country into two panels. Every
panel will narrow down the factors independently in their corner. We expect the list of
factors to be narrowed down into a manageable number: about 20 factors . This narrow
down process is to help the researchers to rank the factors in a meaningful way. But the
number of factors is just suggested, we will leave the panelists to decide the size of the
list. The panelists will be asked to choose (not to rank) at least ten factors as the most
deserving due to their experiences. Finally in this process, we will choose 15- 25 factors
as the most important ones in each panel. The criterion for narrowing the list could be
that factors chosen as important by over certain percentage of the panelists wi ll be
maintained for ranking phase.
In the Ranking process we will find out the most important factors according to the
project managers ' attention. The panelists will be asked to rank the factors of the second
process due to their influence to the success of a project. Several ranking rounds will be

33
conducted until each panel reached an acceptable level of consensus. We will use
Kendall ' s coefficient of concordance (W) to measure the degree of consensus arnong the
panelists.
3.3 Results
In this part, we will present the results of our research which contain the list of risk
factors , the list of new factors , the ranking of risk factors . Furthermore, we will analyze
the results by cornparing with previous literature, analyzing the influences of culture
differences.
3.3.1 Compared with Previous List
Table 1 presents the risk factors identified in the brainstorming phase. We have
cataloged total 58 Risk Factors into 13 Catalogues. The experts were asked to mark the
importance of risk factors from 1 to 10 (1 not important. . . 10 most important) . We also
asked the experts to correct and validate the list. The scale in the table 1 now is the
average.

34
The first purpose of this research is to figure out an updated and multicultural-
based list of software projects risk factors. We compared the new Iist with prior list of
the literature. The prior list of risk factors is based on the references [2] , [3] and [37].
This list is combination of these three references, and the risk factors are the top ranked
factors in their studies. These risk factors are well known in the concept of risk
management of software projects. However, some of these factors are too old or the
detail level is not very appropriate for the further study or managing of the risks. So we
hope that the new 1 ist will co ver most of these prior factors , and of course some of them
will disappear. More importantly, the new list will also provide some new factors that
never appeared in the prior Iist. We have Il factors presented in table 2 are the new
factors in this research.
In the appendix (Table B: Compared with the list of literature), the risk factors that
didn ' t appear in this new list are the NO.3 developing the wrong user interface from
Boehm. This factor is somehow related to the user ' s requirements study and stakeholder
study, but in this research, the expelis don't think that it is necessary to have this specifie
factor in this list. And another factor from Boehm No. 9 real time performed shortfall is
one of the top 10 risk factors in his age, but how it seems that it is too old for our days .
The experts even didn't mention this factor. No. 24 type of users is a key risk factor

35
according to Barki et al.. We think that this factor is also a part of study of stakeholder
and user' s requirements; different types ofusers will have different requirements.
Sorne of those factors that remain in our list are not exactly the same detaillevel as
we described in our list. No. 2 unrealistic schedules and budgets, we separated into two
factors: No. 36 Non-availability of the funds or the budget and No. 37 Artificial or
unrealistic deadlines. We believe that NO.6 Continuing stream of requirements changes
is a result of No. 7 Lack of consensus among the partners and No. 12 Continuing stream
of requirements changes of the new list. No. 7 Shortfalls in externally furnished
components contains the No. 47 Bad control of the work of the consultants or external
experts and No. 53. An internai development oriented culture often puts the projects that
carried out with external suppliers in danger. And there is same situation like NO.I0
Straining computer-science capabilities contains NO.51 Level of interdependence with
other projects or modules and NO.52 Transitional measures between the new system and
the old one are inadequate. The NO.16 Lack or loss of resources contains NO.32 Problem
of under financing of the project and No. 46 Problem of non-availability of experienced
human resource. The NO.20 Team experiences contain No. 41 Lack of skills of the
manager of project and No.42 Lack of skills and expertise on the developers in their
respective field. Sorne others may be not the exactly same description as in the prior

36
literature, but they are similar, example: NO.1 of prior list Personnel shortfall is similar
as No. 42 Lack of skills and expertise on the developers in their respective field .
1
2
3
4
5
6
7
8
9
10
l1
Table 1 List of Risk Factors
> "" .:',{ ,;;:' .;C .~':."
. Organizational environment ", . . ~
A climate of change in the organization, which creates the instability in managing the projects. Many new resources which have to be integrated into the organizational culture Many changes in the manage team that caused problems ofboth project and organization objectives
$upport/sponsorship of theproject, Lack of top management support in the projects Lack of engagement of the future user who thus prefer the manager for project to take responsible. (Ex: No the technical support)
Conflicts between departments aimed by the project. Everyone just considers his own benefits .
Lack of consensus among the partners as for objectives etc. Conflict between operational department and department of IT, who want to continue to keep control on the 1T projects.
The business objective or the anticipated benefit of the project is unrealistic
Lack of the interests of users to take their responsibilities. It takes time for the clients to deliver his opinion on the plan or the design of 1S
Lack of consensus of user departments on the problem and/or the suggested solution (objective of the system and suggested functions)

12 13 14
15
16
17
18
19
20
21 22 23
24
25 26 27 28
29
30 31
Does not consider waitîng for the users. (Not only of the needs) Lack of adequate involvement (or no implication) of the users in the project. Little or bad experiences with this user Bad taking into account of sorne stakeholders. Forget certain very influential people.
Too much waiting for certain customers already involved in the II.
Lack of experience of certain users. Hard to clearly explain the operation of the system for them.
Does not use suitable methodology of project management (procedures, standards, documents.)
37
An inappropriate management of change. Does not take or not weIl record the minors or major change of the project (extra costs)
Does not study enough the scope (ex te nt) of the project, which can thus waste tîmes. Confusions between the roles and the responsibilities of the participants. Bad or non-existent risk management. The important risks are badly followed. No control of project (progress report, syndrome of the 90% completed, etc.) Problem of communication if there are several departments or organizational units, which take part in the same project.
Does not study enough the customer requirements, which can thus waste time. Size of project team. Badly definite manager of project Conflîct of the te am Bad management of te am (ex: Confusion of the roles between the members of the team, several roles held by the same task)
Bad planning (not practices or difficult to make) Bad organizational structure to carry out the projects
5 Financing '
32
33
34
35
36
Problem of under financing of the project. Project team make out a figure before analyzing the more precise need and does not modify the financing.
Bad estimate: use little or not tools or method to estimate suitably the project (frequent undervaluation)
Bad estimates of project when the project is distributed on several sites. Tendency "almost natural" of the developers to underestimate the workload to be carried out
Non-availability of the funds or the budget

37
38
39
40
41
42
43
44
45
46
47 48
49
50
51 52
53
54
55
Artificial or unrealistic deadlines which create a very strong pressure on the effected tests or on the training of the us ers
Problems ofuse of the resources when there are several projects .
Proc~ss .9f development .
Lack of skills and expertise on the developers in their respective field (ex: new language or turn towards new platform)
Part-time allocation of resources on the project (generally late and a lack of implication creates)
38
Bad hum an resource management (when engage or select the consultants and experts)
Use too many external consultants, consequence: problem of over cost or lack of managers' involvement.
Problem of non-availability of experienced human resource wh en you need sorne. Bad control of the work of the consultants or external expelis. Lack of key resources
Technologies~spect Introduction a new technology not tested The level of performance of the awaited system is critical for the system (ex: time, authentification, others.)
Level of interdependence with other projects or modules Transitional measures between the new system and the old one are inadequate
An internai development oriented culture often puts the projects that carried out with external suppliers in danger
Quality Asp'ect Lack of standards which can induce a development not standardized and non-reproducible
No external quality assurance with the team of development

56
57
58
Lack of assigned resources to control the quality related to the additional costs Bad comprehension of what is a risk, a problem ... briefly confusion on the concepts
Sale of the new version not developed yet to the customer
39

22
31
34
36
45
50
51
52
55
Table 2 List of New Factors
A climate of change in the organization, which creates the instability in managing the projects.
Bad or non-existent risk management. The important risks are badly followed.
Bad organizational structure to carry out the projects.
Bad estimates of project when the project is distributed on several sites.
Non-availability of the funds or the budget
40
Use too many external consultants, consequence: problem of over co st or lack of managers' involvement.
The level of performance of the awaited system is critical for the system (ex: time, authentification, others.)
Level of interdependence with other projects or modules
Transitional measures between the new system and the old one are inadequate
No external quality assurance with the team of development
Bad comprehension of what is a risk, a problem ... briefly confusion on the 57 concepts
Table 2 presents the new risk factors. Although most of the risk factors remain
stable, we still find some new factors. It shows that there are some new eJements of risk
added during last few years. A lot of new factors are in the catalog of project

41
management. As we study the risk factors in a dimension of project management, the
experts pa id more attentions to the catalog of project management. In the catalog of
technology, we have 3 more new factors ; it means that we have a lot of new
technologies introduced these years. We have a new catalog of quality; it shows that the
quality control is one of the most important risk management aspects.
3.3.2 Rank of Risk Factors
The Table 3 shows the final rank of risk factors by the Canadian and Chinese
experts . There are totally 26 risk factors ranking in this list, the Chinese experts chose
15 factors , and the Canadians chose 18 factors. We have 7 factors that are chosen by
both Canadian and Chinese: No.4 Lack of top management support in the projects,
NO.19 An inappropriate management of change, NO.23 No control of project, NO.24
Problem of communication if there are several departments or organizational units,
NO.30 Bad planning, No.41 Lack of skills of the manager of project, No.42 Lack of
skills and expertise on the developers in their respective field . Most of these cornrnon
factors are located in the catalog of project management and the catalog of skill of
project te am aspect. Although the 1110St risky factor that the two countries chose is not
the same one, it is still sirnilar: the factor No. 25 Does not study enough the custorner

42
requirements that the Chinese experts chose is one aspect of No. 20 Does not study
enough the scope (extent) ofthe project that the Canadian chose.
The differences are obvious. When we look at the catalogs the experts chose, we
can find that the Canadian shared the risk factors in 7 catalogs, but the Chinese
emphasized in the catalog of project management. The Canadian chose several factors in
the catalog of Management of the client relationship and the catalog of financing, but the
Chinese didn ' t chose any in these two catalogs.
Rank
1
2
3 2
4 4
5
6 5
1
3
Table 3 Rank of Risk Factors
20. Does not study enough the scope (extent) of the project, which can thus waste times.
25. Does not study enough the customer requirements, which can thus waste time.
37. Artificial or unrealistic deadlines which create a very strong pressure on the effected tests or on the training of the users
13 . Lack of adequate involvement (or no implication) of the users in the project.
29. Bad management of team (ex: Confusion of the roles between the members of the team, several roles held by the same task)
33. Bad estimate: use little or not tools or method to estimate suitably the project (frequent undervaluation)

43
7 4 27. Badly definite manager of project
8 6 35. Tendency "almost natural" of the developers to underestimate the workload to be carried out
9 6 44. Bad human resource management (when engage or select the consultants and experts)
10 6 6. Conflicts between departments aimed by the project. Everyone just considers his own benefits.
3 5 22. Bad or non-existent risk management. The important risks are badly followed.
13 2. Many changes in the manage team that caused problems of both project and organization objectives
18 12 4. Lack of top management support in the projects
16 12. Does not consider waiting for the users .
12 15. Bad taking into account of sorne stakeholders. Forget certain very influential people.
19. An inappropriate management of change. Does not 8 7 take or not weil record the minors or major change of
the project (extra costs)
Il 2 23 . No control ofproject
24. Problem of communication ifthere are several 9 departments or organizational units, which take part
in the same project.
13 8 30. Bad planning (not practices or difficult to make)
14 31 . Bad organizational structure to carry out the projects
32. Problem of under financing of the project. Project 17 team make out a figure before analyzing the more
precise need and does not modify the financing .
14 34. Bad estimates of project when the project is distributed on several sites.
9 Il 41. Lack of skills of the manager of project
15 10 42. Lack of skills and expertise on the developers in their respective fie ld
15 43 . Part-time allocation of resources on the project
10 49. Introduction a new technology not tested.

44
3.3.3 Analyses of Results
In this part, we will analyze the region difference influence to the ranking of the
risk factors.
Obviously we can not ignore the influences of the culture differences to this
research. China and Canada are two of the biggest countries in the world, but China is
still a developing country, and he has the biggest population in the world. Canada is
second biggest country, but he has a very little population and he is much more
developed than China. It is very interesting to discuss the influences of the culture. It is a
huge work to research how the culture differences affect the ranking of the risk factors,
the author can only provide their own opinions of the influences according literature and
the discussion with some of the experts.
An approach that may be useful in identifying the various dimensions along which
cultural differences could be measured is one developed by Geert Hofstede' (Arvind V.
P. 1995: 132). Hofstede (1984) proposed four dimensions:
• Power distance refers to the distance between individuals because of
different social hierarchy, educational level and occupation;

45
• Uncertainty avoidance measures the extent to which people tend to feel
threatened by un certain ambiguous future ;
• Individualism is the tendency of people to look after themselves which is in
direct contrast with collectivism, the tendency of people to belong to groups;
• Masculinity tends to assertiveness, materialism and less concern for others,
while femininity emphasizes a concern for others and relationships.
We would like to discuss his four dimensions separately. Initially, China had many
traditional cultures about centralism, which was one person control the main power at
hand. In this case, we can easily find that the phenomena occurred before because of
factors that have been important historically in China, such as traditional thoughts under
traditional education, inequality and authority of different classes. Hence low-power
classes accept the big pressure resulted from the dominant class ' s high power and class-
consciousness. We observe that the top ranked risk factors chosen by Chinese experts
can be easily influenced by superiors. Such as No. 4 Lack of top management support in
the projects; No.19 An inappropriate management of change, when the superior what to
change the Chinese project management team have to obey the order; No. 27 Badly
definite manager of project, the top management decide who is in charge; No. 31 Bad
organizational structure to carry out the projects which is also according to top

46
management ' s decision. Comparatively, in North-America people will have more liberty
of speech and action.
Countries with a high level of uncertainty avoidance have clear mIes and
regulations. Jobs provide more security and stability. Opposite to it, low level of
uncertainty avoidance leads to lower anxiety and stress form jobs. Companies are less
formaI and some managers take more risks. For instance, China may change their
decisions after business contract has been signed and prefer to keep necessary silence
during business meetings. We have examples: No. 3 Many changes in the manage te am
that caused problems of both project and organization objectives NO.25 Does not study
enough the customer requirements, because customers ' requirements always change.
While North-Americans are convinced contract should be a stable element in the
changeable international environment.
When referred to individualism, Hofstede (1984) found that economically
advanced countries tend to place greater emphasis on individualism than do developing
countries. Thus Chinese project management team has a tendency to share the
responsibility. In other words, nobody wants to take the responsibility. That can explain
why Chinese experts chose several factors about conflict management and human

47
resources management: No. 6 Conflicts between departments aimed by the project, No.
29 Bad management of team, No.43 Part-time allocation of resources on the project.
When mentioned masculine cultures, China represents a "masculine" culture,
where personal inadequacies are not readily admitted.
Wh en we look at the ranked risk factors that the experts chose, we can discover
that the catalogs the chose are really different. The Canadian ranked the factors
averagely in eight catalogs, but the Chinese ranked the most of risk factors in the catalog
of project management. It shows that the Chinese managers are still lack of project
management. We discussed with the Chinese experts, they said that the project
management theory had been just introduced in China. They think that the Chinese
managers should earn more project management skills. Thus it can be seen that the
socioeconomic environment can also affect the ranking of the risk factors .
In sum, Canada and China have sorne differences in the ranking of the risk factors.
These differences are not only caused by the culture difference, but also it is affected by
the socioeconomic enviromnent. Institutional theory do es explicitly incorporate the role
of the state on organization through coercive and normative isomorphic pressure,
example at the individual level, (Weber et al 1998) obtained significant differences in
48
managerial preferences for risk taking between managers from China and the USA.
According to the Hofstede's theory, we analyze the differences by four dimensions. And
we discussed the socioeconomic environment influences with the experts. We found that
it is a very important element affecting the risk ranking.
3.4 Limits of Research
Because this research is based on a Delphi method, the number of samples is
limited. We didn't have many experts involved in our study. Though we chose the
experts according their experiences of software projects management, we didn ' t consider
the type or size of the projects as variables. As Canada and China are big countries, we
only chose the samples in Quebec in Canada and Beijing in China. We believe that in
other region of these two countries, there cou Id be sorne differences because of the level
of development or other factors .
The amount of data collected was only sufficient for the first step of brainstorming.
The number of respondents in last two steps was insufficient. The low response rate is
indicative of two issues: (l) the type of information being requested and (2) the length of
survey. Though a significant consideration for email-based studies, non-response bias
49
was assessed but no action deemed appropriate. One method considered was the use of
late-arriving responses as indicative of non-responders (Armstrong 1977).
Another limit is the language, we write this thesis in English. But during our
survey, as the native language in China is Chinese and in Quebec a lot of people 's native
language is French, the responses sometimes were in Chinese or French. We can not
assure the translation is one hundred percent as they de scribe in their native language.
3.5 Future Research
The data collection method we use is a Delphi technology, because of the time and
budget limits we can only use email to contact our respondents. If we can meet the
project managers or interview them by phone, the validation and the quality of the
responses could be much better. We also hope that in the future, we can have more
choice of respondents to make the list more general and authoritative.
Although we think this research is very useful, we believe that there are a lot more
to do in the future. As we focus on the first step of the risk management, identification of
risks, we provide a useful foundation of the software risk management, the further study

50
will try to find out the proper strategies or develop a model of risk management process .
For the project managers, the y should update and enrich the new risk factors during their
daily work.
In this study, we only request the project managers to provide the risk factors. In
fact, the risks in software projects should vary according to the level of management.
The level of management will not only affect the number of risks, but also the ranking of
risk. In addition, there are more variables affecting the results of study, such as type of
software projects, size of projects, future researchers could make a study more
specifically.

CHAPTER4
CONCLUSION
51
In this article, we represented the recent statistics of the success rate of the
software projects published by Standish Group in 2004, the rate is still very dissatisfied.
Previous studies have proposed that risk is a complex construct. In software projects the
risk performs as a factor that affects the success of a project. Project manager recognize
and accept the fact that risk is inherent in software projects. The most successful project
managers choose to deal proactively with risk. The process of risk management involves
two steps, the identification and subsequent mitigation of project variables. However
proper risk management is based on the identification of the risk factors , to address the
identification step, researchers have focused extensively on establishing lists of risk
factors. In other words, before we assess risk or develop strategies to counter the risks,
we should know what the risks are existed in projects; what are the most important risks
the project managers should pay more attention. We addressed these two questions by
providing a cataloged li st of 58 risk factors and a ranking of risk factors. We also tried to
analyze the influence of culture difference.
After having made this study by a Delphi method between Canadian and Chinese
experts, we can conclude that the factors of risk have certain persistence. We find in our

52
study the majority of the risk factors were already enumerated in the former studies.
However, we still discovered Il new risk factors. We also list the top 10 factors of aIl
the risk factors. We think that this study can be extremely useful for the managers of
projects which are brought to manage the risks in the projects of system development of
information. The project managers can use the li st of risk factors as a fundamental risk
management, and the project managers can pay more attentions to the top 10 risk factors.
The cross-culture study provides a general idea of culture differences in software
projects risk management for both Canadian and Chinese. We talk a lot about culture
differences wh en we manage a cross country project, but it is not easy to analyze the
influences of culture differences. In this research, we use Hofstede's culture difference
theory to analyze the differences that the Canadians and Chinese treat the risk in the
identification step, we found that the Hofstede's theory can really help us explain the
culture differences' influences.

53
REFERENCES
1. Alter, S. , and Ginzberg, M. Managing uncertainty in MIS implementation. Sloan
Management Review, 20, 1 (Fall 1978), pg. 23-31
2. Barki, H. ; Rivard, S. ; and Talbot, 1. Toward an assessment of software development
risk. Journal of Management Information Systems. 1,2, (FaU 1993), pg.203-225 .
3. Boehm, B. Software Risk Management Tutorial. Washington, DC: IEEE Computer
Society Press, 1989.
4. Boehm, B. Software Risk Management: principles and practices. IEEE Software,
January 1991 , pg. 32-41.
5. Brooks, Frederick P. No Silver Bullet, Computer 20, 4 (April 1987), pg. 10-19.
6. Carr, Marvin 1. ; Konda, Suresh; Monarch, Ira; Ulrich, Carol; & Walker, Clay.
Taxonomy-Based Risk Identification (CMU/SEI-93-TR-6, ADA266992). Pittsburgh,
Pa.: Software Engineering Institute, Carnegie Mellon University, 1993 .
7. Chittister, Clyde & Haimes, Yacov. Assessment and Management of Software
Technical Risk, IEEE Transactions on Systems, Man, and Cybernetics 24, 2
(February 1994), pg.l87-202.
54
8. Christopher K. Hsee; EIke U. Weber, Cross-national differences in risk preference
and lay predictions Journal of Behavioral Decision Making; JUil 1999; 12, 2;
ABIIINFORM Global pg. 165
9. Cule, P. , Strategies for heading off is project failure, Information Systems
Management; March 1, 2000, Vol. 17, Issue 2
10. Ginzberg, M.J. (1981), Early diagnosis of MIS implementation failure: promising
results and unanswered questions, Management Science, Vol. 27 No. 3, pg. 349-378.
11. D. McComb, J.Y. Smith, System project failure: the heuristics of risk, Journal of
Information Systems Management 8 (1), 1991 , pg. 25- 34.
12. Davis, G.B. and OIson, M.H. (1984), Management Information Systems, Conceptual
Foundations, Structure, and Development, 2nd ed., McGraw-Hill , New York, NY.
13. Department of Information Resources. InternaI QualUy Assurance Guidelines. May
2005. State of Texas. http: //www.dir.state.tx.us/eod/ga/index.htm.
14. Fredrik, B., Institutional theory: A new perspective for research into ISIIT security
in organizations 0-7695-2056 IEEE, January 2004
15. Heemsta, F and Kusters, R Dealing with risk: a practical approach. Journal of
Information Technology, (December 1996), pg.333-346
16. Hervé Courtot. La gestion des risques dans les projets. Paris, France Economica,
1998
17. Hofstede, G., Culture 's Consequences, London, Sage. 1984

55
18. Jean-Claude, u., International & Cross-Cultural Management Research, London,
Sage. 1998
19. Jiang,J.1. and Klein G. Risks to different aspects of system success, Information and
Management 36, 1999, pg. 264- 272.
20. Jiang, J.1. and Klein, G. (2001), Software project risks and development focus,
Project Management Journal, Vol. 32 No. 1, pg. 3-9.
2l. Jones, C. (1993), Assessment and Control of Software Risks, Prentice-Hall ,
Englewood Cliffs, NJ
22. J. Ropponen, K. Lyytinen, Can software risk management improve systems
development: an exploratory study, European Journal of Information Systems 6 (6),
1996, pg. 41 - 50.
23 . J. Cumming, IT portfolio management: balancing risks and rewards of projects
yields significant retums, Network World 19 (13), 2002, pg. 48.
24. Keil , M. Pulling the Plug: Software Project Management and the Problem of Project
Escalation, MIS Quarterly 19, 4, 1995, pg. 421-447.
25. Keil , M.; Cule, P.; Lyytinen, K.; and Schmidt, R. A Framework for identifying
software project risks . Communications of A CM, 41, Il (November 1998), pg. 227-
251

56
26. Keil , K. Bernard C y Tan, Kwok-Kee Wei, and Timo Saarinen, A cross-cultural
study on escalation of commitment behavior in software projects. MIS Quarterly.
Minneapolis: Vol.24, Iss. 2; June 2000.pg. 299-326.
27. Kwak Y.H. and Stoddard, 1. Project risk management: lessons learned from software
development environment. Agi/ent Technologies , 2679 Monument Drive, Santa Rosa,
CA 95407, USA.
28 . Linda Wallace, Mark Keil , Arun Rai, Understanding software project risk: a cluster
analysis . Information & Management 42-2004, pg. 115- 125
29. Lyytinen, K. , Mathiassen, L., and Ropponen, 1. Attention Shaping and Software Risk:
A Categorical Analysis of Four Classical Risk Management Approaches, Information
Systems Research 9, 3, 1998, pg. 233-255.
30. McFarlan, F. W. (1981), Portfolio approach to information systems, Harvard
Business Review, Vol. 142, September- October, pg. 142-150.
31 . Moynihan, T. How experienced project managers assess risk. IEEE Software, (May-
June 1997), pg. 35-41.
32. Moynihan, T. , Coping with ' requirements-uncertainty' : the theories-of-action of
experienced IS/software project managers. Journal of Systems and Software Volume
53 , Issue 2, 31 August 2000, pg. 99-109
33. March, 1. G., and Shapira, Z. Managerial Perspectives on Risk and Risk Taking,
Management Science 33,11 , 1987, pg. 1404-1418.

57
34. Nidumolu, S.R., 1996. Standardization, requirements uncertainty and software
project performance. Information and Management 31, pg. 135-150.
35. Project Management Institute (PMI) (2004), Project Management Body of
Knowledge (PMBOK) - 2004 Exposure Draft, PMI, Pennsylvania, PA.
36. Ropponen, J. , and Lyytinen, K. Components of Software Development Risk: How to
Address Them? A Project Manager Survey, IEEE Transactions on Software
Engineering 26, 2, 2000, pg. 98-112.
37. Ronald P. Higuera, Yacov Y. Haïmes, Software Risk Management. CM U/SEI-96-
TR-OI2. ESC-TR-96-012
38. Roy Schmidt; Kalle Lyytinen; Mark Keil ; Paul Cule. Identifying software project
risks: An international Delphi study. Journal of Management Information Systems;
Spring 2001; 17, 4; ABIIINFORM Global pg. 5
39. Seigel, S. , and Castellan, N. Nonparametric Statistics for The Behavioral Sciences.
New York; McGraw-Hill, 1988
40. Trompenaars, F. , Riding the Waves of Culture, London, Brealey. 1997.
41. Van Genuchten, M. , 1991. Why is software late? An empirical study of reasons for
delay in software development. IEEE Transactions on Software Engineering 1 7 (6) ,
582- 590.

58
42. Van Scoy, Roger L. Software Development Risk: Opportunity, Not Problem
(CMU/SEI-92-TR-30, ADA 258743). Pittsburgh, Pa.: Software Engineering Institute,
Carnegie Mellon University, 1992
43. Wallace L. , The development of an instrument to measure software project risk,
unpublished Doctoral Dissertation, Georgia State University, 1999.
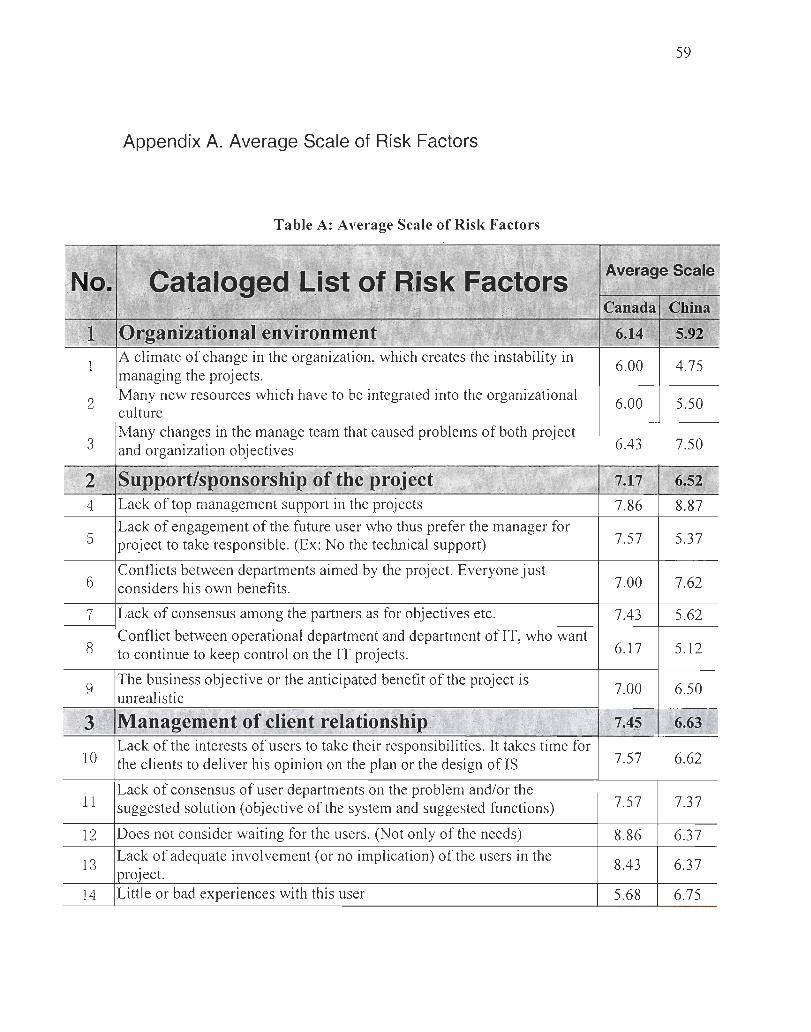
59
Appendix A. Average Scale of Risk Factors
Table A: Average Scale of Risk Factors
;1;,.
Organiz~tional envirônment
1 A climate of change in the organization, which creates the instability in 6.00 4.75 managing the projects.
2 Many new resources which have to be integrated into the organizational 6.00 5.50 . culture
3 Many changes in the manage te am that caused problems ofboth project
6.43 7.50 and organization objectives
2 Support/sponsorship of the project 7.17 6.52 4 Lack of top management support in the projects 7.86 8.87
5 Lack of engagement of the future user who thus prefer the manager for
7.57 5.37 project to take responsible. (Ex: No the technical support)
6 Conflicts between departments aimed by the project. Everyone just
7.00 7.62 considers his own benefits.
7 Lack of consensus among the partners as for objectives etc. 7.43 5.62
8 Conflict between operational department and department of IT, who want
6.17 5.12 to continue to keep control on the IT projects .
9 The business objective or the anticipated benefit of the project is 7.00 6.50 unrealistic
l\1anag~~ei1t of clie!1t relation.sli~p 7.45 6.~3
10 Lack of the interests of users to take their responsibilities. It takes time for
7.57 6.62 the clients to deliver his opinion on the plan or the design ofIS
Il Lack of consensus of user departments on the problem and/or the
7.57 7.37 suggested solution (objective of the system and suggested functions)
12 Does not consider waiting for the users. (Not only of the needs) 8.86 6.37
13 Lack of adequate involvement (or no implication) of the users in the 8.43 6.37 project. 14 Little or bad experiences with this user 5.68 6.75
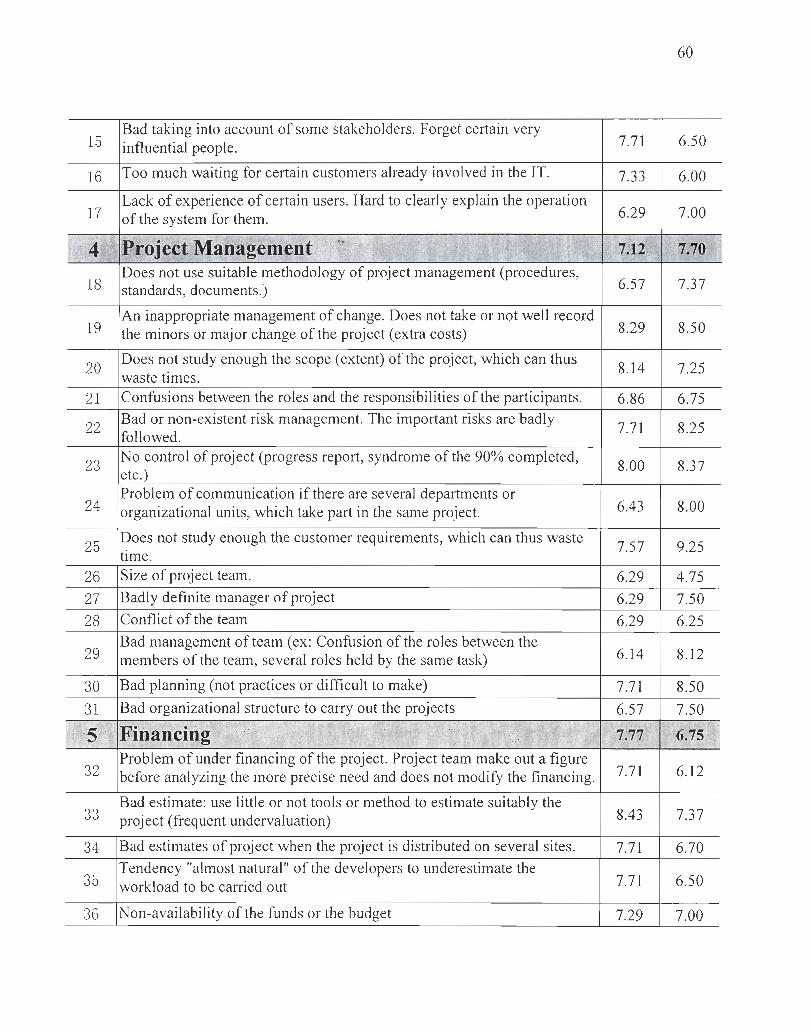
60
15 Bad taking into account of sorne stakeholders. Forget certain very
7.71 6.50 influential people.
16 Too much waiting for certain customers already involved in the IT. 7.33 6.00
17 Lack of experience of certain users. Hard to cleariy explain the operation
6.29 7.00 of the system for them.
f: .r4 ' P,t,ojecf ManagemeIÎr, '·.'fi~Yiki ,'~ '~, ;.t;«;fr:,:~ cti!~~~' 1';'''{12 i
" ",' ~? 70 1
18 Does not use suitable methodology of project management (procedures,
6.57 7.37 standards, documents.)
19 An inappropriate management of change. Does not take or not weil record
8.29 8.50 the minors or major change of the project (extra costs)
20 Does not study enough the scope (extent) of the project, which can thus 8.14 7.25 waste times. 21 Confusions between the roles and the responsibilities of the participants. 6.86 6.75
22 Bad or non-existent risk management. The important risks are badly 7.71 8.25 followed.
23 No control of project (progress report, syndrome of the 90% completed, 8.00 8.37 etc.)
24 Problem of communication if there are several departments or
6.43 8.00 organizational units, which take part in the same project.
25 Does not study enough the customer requirements, which can thus waste 7.57 9.25 time. 26 Size of project team. 6.29 4.75 27 Badly definite manager of project 6.29 7.50 28 Conflict of the team 6.29 6.25
29 Bad management of te am (ex: Confusion of the roles between the
6.14 8.12 members of the team, several roles he Id by the same task)
30 Bad planning (not practices or difficult to make) 7.71 8.50 31 Bad organizational structure to carry out the projects 6.57 7.50 ;5'" Financing 'i J" " ";,~. +k" ,,~!'-',~~;!''' 7.77 1;' 6.75 r .
'C, ,
32 Problem ofunder financing of the project. Project team make out a figure
7.71 6.12 before analyzing the more precise need and does not modify the financing.
33 Bad estimate: use little or not tools or method to estimate suitably the
8.43 7.37 project (frequent undervaluation)
34 Bad estimates of project when the project is distributed on several sites. 7.71 6.70
35 Tendency "almost natural" of the developers ta underestimate the
7.71 6.50 workload to be carried out
36 Non-availability of the funds or the budget 7.29 7.00

61
1 6 Time/Sclledule Aspect 'i'. , . "'~''iJ
7.71 7.06 1
37 Artificial or unrealistic deadlines which create a very strong pressure on
7,86 7,25 the effected tests or on the training of the users
38 Problems of use of the resources when there are several projects, 7,57 6,87
7 Process of development 7.21 5.19
39 Absence of test methodology to carry out a project 7.29 6,25
40 Use of a not tested new methodology by the developers 7,14 4,12
'ri-i8 g skiIls 9~:nroject tea iUwAspe ct pr Li}:~" . ',r;1~" .~. .r,
1 ;,.~.ji.~,~ ',l.~· ." ,~§>OO ':,i 8.13 ~ " 'J'
41 Lack of skills of the manager of project 8,14 7,62
42 Lack of skills and expertise on the developers in their respective field (ex:
7,86 8,62 new language or turn towards new platform)
1 '~9 . ~lInanŒ'Resource Management1\s'p;ect ;,tL}~~1- :,"::~. } .A2 6.56 .
~
43 Part-time allocation of resources on the project (generally late and a lack
7,29 7,50 of implication creates)
44 Bad human resource management (when engage or select the consultants
8,00 7.25 and experts)
45 Use too many external consultants, consequence: problem of over co st or
6,86 5,63 lack of managers' involvement
46 Problem of non-avai labi lity of experienced human resource wh en you
7,57 7,1 2 need sorne, 47 Bad control of the work of the consultants or external experts, 7,29 5.12
48 Lack of key resources 7,50 6,75 )~;,' "
Techn~lo.gies Aspeét'} , l1~:; ' ~';. ~'~~t~:~\t· ,. ~'\"\.:' . -,1 "~' " 4.88 l"; l O.rj. ,'il i'i ,!!~ . \~ .J.,{: 7.18 .. , ': 49 Introduction a new technology not tested 7,86 5.25
50 The level of performance of the awaited system is critical for the system
7,43 5,63 (ex: time, authentification, others,)
51 Level of interdependence with other projects or modules 6,86 4,12
52 Transitional measures between the new system and the old one are
6,57 4,50 inadequate '" Externat dependencesAspect
r' . ."
1,, 11 " 6A3 5.50
53 An internai development oriented culture often puts the projects that
6,43 5.50 carried out with external suppliers in danger
12 QualityAspect l' th 1. :' .i, 7.11 6.27 . "
54 Lack of standards which can induce a development not standardized and
7.00 6,50 non-reproducible
55 No external quality assurance with the team of development 7,43 6,34

62
56 Lack of assigned resources to control the quality related to the additional 7.67 6.71 costs
57 Bad comprehension ofwhat is a risk, a problem .. . briefly confusion on the
6.33 5.50 concepts
6.57 2.88
58 Sa.le of the new version not developed yet to the customer 6.57 2.88

63
Appendix B. Compared with the List of Literature
Table B: Compared with the Iist of literature
~1%~~Tc c ' .'" /il . b'
Prior Risk Factors from literature :..: Factors of this researc'h I ~ .. ,~ .
,';'cx{'f' ':;(' .... >.-)'4 ", " ."'," ~'\;' ' ;?~ :::.'>.J. ':,~~ "
1 Personnel shortfall [3, 37] 42
2 Unrealistic schedules and budgets [3] 36,37
,., Developing the wrong function and properties [3 ,37] 25 .)
4 Developing the wrong user interface [3] None
5 Gold-plating [3 ,37] 9
6 Continuing stream ofrequirements changes [3 ,3 7] 7,12
7 Shortfalls in externally furnished components [2,3 ] 47,53
8 Shortfalls in externally performed tasks [2,3] 53
9 Real time performance shortfalls [3] None
10 Straining computer-science capabilities [3 ,3 7] 51 ,52
11 Size [2,37] 24,26
12 Multiple implementers [2,37] 21
13 Staffing levellteam size [2,37] 26
14 New technology/experience with technology [2] 49
15 Application novelty [2] 15
16 Lack or 10ss of resources [2] 32,46
17 Unclear task [2] 25

64
18 Team turnover [2] 29
19 Team members have no work together before None
20 Team experiences [2,37] 41,42
21 Number ofusers [2] 21
22 User turnover [2] 17
23 Number of user department [2] 12
24 Type of users [2] None
25 Unwilling users [2] 10
26 Resistance to change [2] 13
27 User's feeling ofresponsibility [2,37] 5
28 Conflicting preferences [2,37] 11
29 Interpersonal conflicts [2] 28
30 Lack of top management support [2,37] 4
31 Failure to manage end user expectation [37] 25
32 Changing scope/objectives [37] 19
33 Failure to gain user commitment [37] 10
34 Lack of adequate user involvement [37] 13
This list is based on the references:
2. Barki, H. ; Rivard, S.; and Talbot, 1. Toward an assessment of software development
risk. Journal of Management Information Systems. 1,2, (FaU 1993), pg. 203-225 .

65
3. Boehm, B. Software Risk Management Tutorial. Washington, DC: IEEE Computer
Society Press, 1989.
37. Roy Schmidt; Kalle Lyytinen; Mark Keil ; Paul Cule. Identifying software project
risks: An international De1phi study. Journal of Management Information Systems;
Spring 2001 ; 17, 4; ABI/INFORM Global pg. 5
Appendix C Text in French
Identification des risques des projets informatiques: une
comparaison multiculturelle et historique
Par le biais d'une approche Delphi auprès d'experts
canadiens et chinois, nous avons constitué une liste
comprenant 57 facteurs de risques . Cette liste a par la suite
était étudiée selon une dimension culturelle et historique.
Introduction
66
La collecte d' information pour dresser un état des lieux de la production de
logiciel est difficile. On estime donc qu'aujourd ' hui 90% du coût d'un système
informatique repose sur le logiciel. Le développement et la maintenance des logiciels
représentent dans le monde des sommes colossales. Et malgré ce marché, les
industriels considèrent encore l'industrie du logiciel comme « risquée », « mal

67
maîtrisée », source de coûteux dépassements de budget et de délai. En 1990, une
étude effectuée sur 9 projets du Département de Défense des USA (DoD),
correspondant à quelques millions de dollars, affichait les résultats suivants:
• 28.8% avait été payé mais non livré
• 19.2% avait été transformé ou abandonné
• 47.27% n'avait pas été utilisé avec succès
• 2.95% avait été utilisé après quelques modifications
• 1. 77% avait été util isé tel que livré
Des statistiques plus récentes publiées par le Standish Group en 2004 montre
toujours des résultats mitigés malgré les nombreuses études et standards publiés depuis
ces dix dernières années. En effet, on remarque que seulement 29% des projets sont des
succès alors que 18 % sont des échecs et 53% ont connu de sérieux problèmes
(Standish Group, 2004).
Ces données sont d'autant plus inquiétantes que l'on développe de plus en plus de
logiciels pour des systèmes de plus en plus complexes. Il est vrai que l' industrie du
logiciel est relativement immature au regard des autres industries. Immaturité qui
s'explique par sa relative jeunesse, par le caractère abstrait du produit, par la taille du

68
système à automatiser et par l'évolution rapide des technologies et des techniques de
modélisation et de programmation.
C'est donc dire également que les défis pour améliorer la production de logiciels
sont toujours d' actualité. En fait, on constate que si la technologie évolue, l'industrie
souffre d 'une inertie assez forte. En fait, il semble que l'organisation du développement
logiciel progresse lentement, mais surtout que son déploiement dans l' industrie se fasse
à tout petit pas. Il est plus difficile de changer les habitudes d'organisation des personnes
que de changer leurs outils de travail, même quand la volonté est là.
Par ailleurs, le développement de logiciel est toujours considéré comme une
activité «créatrice » qui ne peut être rationalisée. Le mythe du «génial programmeur»
traîne encore dans les esprits. Pourtant, tout comme n'importe quelle activité menant à
satisfaire les besoins de personnes, la production de logiciel se modélise et se contrôle,
bref se gère.
Schématiquement, on peut ainsi considérer que cette industrie est confrontée aux
principaux problèmes que sont:
• Le manque de connaissance et de compréhension de ce que le développement
logiciel implique.

• Le manque de rigueur dans la mise en place des techniques d'organisation.
Les bonnes intentions sont contraignantes et paraissent parfois alourdir un
processus déjà sous de fortes contraintes budgétaires et de calendrier.
69
• Le manque d'outils pour maîtriser les risques du développement. Les outils
d'organisation, de prévision, de contrôles sont complexes et difficiles à mettre
en oeuvre.
• Le manque d'anticipation et d' analyse des risques inhérents au développement
logiciel.
Dans cette article et prenant en considération les deux derniers points énumérés ci-
dessus, nous allons nous concentrer sur la gestion des risques dans les projets de
développement de systèmes d'information. De plus, tenant compte qu'un projet est
toujours le reflet de la façon dont une organisation ou une société humaine, envisagent et
préparent leur avenir, nous avons voulu également savoir s' il y a un effet culturel sur
cette gestion des risques ?

70
Problématique
La gestion des risques a été longtemps appliquée de façon accessoire et implicite
dans la gestion des projets ormatiques. À l' heure actuelle, de plus en plus
d'organisations formalisent un tel processus, principalement pour les projets d' envergure
ou stratégiques. En fait, dès 1994, le « Software Engineering Institute » a publié un
rapport technique concernant l'adoption de programmes visant à réduire le nombre et la
fréquence des problèmes reliés au processus de développement et d'entretien
d ' applications (CMU/SEI-94-TR-013) . Dans le même ordre d ' idées, le « Project
Management Institute » définit la gestion des risques comme l'une des neuf pratiques clé
de la gestion de projets. La gestion des risques connaît donc une popularité grandissante
et fait maintenant partie des « meilleures pratiques » en informatique. En schématisant,
on considère que l' analyse du risque peut se modéliser par les phases suivantes :
1. Identification du risque
2. Évaluation du risque
3. Réaction au risque
4. Apprentissage
Dans cette étude, nous nous sommes concentrés sur la première phase, soit celle
portant sur l'identification des risques. Trois raisons expliquent ce choix. La première
BIBLIOTHEQUE: 'Jniverslté du Québèc à Rim6Usk

71
raison s' explique par le fait que cette phase sert de fondation aux autres phases. Elle est
donc primordiale. La deuxième raison provient du fait que les réponses proposées par les
différents auteurs sont souvent datées historiquement et ne prennent pas forcément en
compte les évolutions récentes tant au niveau des méthodes de développement des
systèmes d'information qu'au niveau des nouvelles tec1mologies. La troisième raison
s'explique par le fait que la plupart des modèles proposés par le SEI, le PMI et par de
nombreux auteurs sont souvent idiosyncrasiques. Dans cette dernière perspective, la
contrainte culturelle semble inexistante et sans importance. Or, en se basant sur les
travaux de Geert Hofstede et en poursuivant les travaux entamés par Sc1ullidt (Schmidt,
2001 ; Keil, 1998), nous pensons que la culture peut avoir une certaine influence dans
l ' identification des risques.
Par ailleurs et de façon plus conceptuelle, on remarque aussi que les solutions
apportées à l'identification des risques proviennent de trois champs disciplinaires
complémentaires à savoir la gestion de projet, le génie logiciel et la littérature portant sur
l' implantation des systèmes d'information. Ceci peut expliquer certaines visions
restrictives qui n'ont pas pris en considération ces trois approches complémentaires.

72
Méthodologie de recherche
Pour identifier les risques, diverses approches ont vu le jour. Parmi les plus
connues, on peut citer la méthode des scénarios, la méthode par analogie (Boehm, 1991 ;
Heemstra, 1996) et la méthode par checklist (Barki , 1993 ; Boehm, 1989 ; Boehm, 1991 ;
Keil, 1998 ; Ropponen, 2000 ; Schmidt, 2001).
Par ailleurs, on peut aussi citer les études de Zmud et Lucas sur l' identification et
la catégorisation des facteurs qui peuvent influencer le succès des projets et donc
indirectement les risques (voir aussi McFarlan, 1981 ; Alter, 1978).
Pour les fins de cette recherche, et allant dans la même veine des travaux entamés
par Schmidt (Schmidt, 2001), l'approche Delphi a été retenue. Les experts ont été
sélectionnés au sein de deux contextes socio-économiques différents mais surtout au
sein de deux cultures différentes, à savoir la Chine et le Canada. En Chine, nous avons
communiqué avec l' université de Beihang qui nous a introduit à 14 experts. Par ailleurs,
le fait qu ' un des auteurs soit chinois a sans aucun doute été utile pour établir de bons
liens de communication. Au Canada, par le biais de notre réseau, nous avons contacté Il
expe11s. Tous ces experts ont tous un minimum de 6 ans d 'expérience, ont pour la

73
plupart un baccalauréat et ont une bOlme expertise avec les nouvelles teclmologies et
méthodologies de développement.
L'enquête a été divisée en trois phases: une phase de brainstorming, une phase de
réduction et de consolidation et une phase de rangement. La première phase visait à
obtenir le plus de facteurs de risque possible avec une courte description pour chacun
tout en évitant les doublons syntaxiques et sémantiques. La deuxième phase servait à
réduire le nombre de facteurs à un nombre "opérationnel". Cette opération s'est faite au
sein des deux panels d'experts chinois et canadiens. Chaque expert devait indiquer sa
préférence pour chaque facteur sur une échelle de 1 à 10. Des seuils ont été retenus pour
réduire le nombre de facteurs à une quinzaine. Finalement, la troisième phase consistait
à effectuer le rangement. En fait, on voulait aussi tester le degré de consensus des
experts en utilisant le coefficient de concordance de Kendall.
Principaux résultats de l'étude
La table 1 ci-après présente les facteurs de risque identifiés suite à la première
phase de brainstorming. Cette phase a duré quatre mois. Ce sont les experts canadiens

74
qui ont fourni les listes les plus détaillées, les plus fournies . Nous ne savons pas
pourquoi les expelis chinois semblaient plus réticents à donner leur opinion.
Table 1 : Liste des facteurs de risque (Canada et Chine)
No Facteur Canadien C hinois
E nvironnement de l'organisation 6,14 5,92
U n climat de changement dans l'organisation a créé de l' instabilité dans la gestion des projets. 6,00 4,75
Beaucoup de nouve lles ressources qui ont du s'intégrer à la culture 2 organi sationnelle 6,00 5,50
Beaucoup de changement dans l'équipe de direction ont causé des 3 problèmes de fit entre les objectifs des projets et ceux de l'organisat ion 6,43 7,5 0
Appui / parrainage du projet 7,17 6,52
4 Manque d 'engagement clair de la direction à s' investir dans les projets 7,86 8,88
Manque d 'engagement de la part des futurs clients qui préfèrent a ins i 5 rendre responsable le gérant de proj et. (Ex: pas de support technique) 7,57 5,38
Confiits entre départements visés par le proj et. Chacun voulant tirer à 6 so i la couverture. 7,00 7,63
Problème de manque de consensus entre les partenaires quant aux 7 objectifs etc. 7,43 5,63
Confiit entre département opérationnel et département des NTIC qui 8 veulent continuer à garder le contrôle sur les projets NTlC 6, 17 5,13
Les objectifs d'affaires, les bénéfices anticipés par le proj et sont 9 irréal istes 7,00 6,50
Gestion de la relation C lient 7,45 6,63
Manque d ' intérêt du client à prendre ses responsabilités. Il prend du 10 temps pour donner son av is sur le plan ou la conception du ST 7,57 6,63
Manque de consensus sur le problème et/ou sur la solution proposée 11 (objectifs du système et fonctions proposées) 7,57 7,38

75
Mauvaise prise en considération des attentes des usagers. (et pas 12 uniquement des besoins) 8,86 6,3 8
Manque d ' implication adéquate (ou pas d'implication) des utilisateurs 13 dans le projet. 8,43 6,38
14 Aucune expérience ou mauvaise expérience avec ce client 5,86 6,75
Mauvaise prise en compte des diverses parties prenantes. On peut 15 oublier certaines personnes très influentes. 7,71 6,50
Attentes très élevées de certains clients déjà au fait des NTlC et qui 16 ont des attentes presque démesurées. 7,33 6,00
Manque d 'expérience de certains utilisateurs pour exp liquer clairement 17 le fonct ionnement du système à l'étude. 6,29 7,00
Gestion de projet 7,12 7,70
On n'utilise pas de méthodologie appropriée de gestion de projet 18 (procédures, normes, documents .. ) 6,57 7,3 8
Une gestion de changement inappropriée. On ne tient pas ou pas bien compte des changements mineurs ou majeurs au projet. (coûts
19 add itionnels) 8,29 8,50
On ne gèle pas assez le scope (l ' étendue) du projet qui peut ainsi 20 déraper avec le temps . 8,14 7,25
Il peut avoir des confusions entre les rôles et les responsabilités des 21 participants. 6,86 6,75
Mauvaise gestion du risque ou inexistante. On suit malles risques 22 importants. 7,71 8,25
Pas de contrôle de projet (état d ' avancement, syndrome du 90% 23 achevé, etc .. ) 8,00 8,3 8
Prob lème de communication s'i l existe plusieurs départements ou 24 unités organisationnelles qui participent au même projet. 6,43 8,00
On ne gèle pas assez les besoins du client qui peuvent ainsi déraper 25 avec le temps. 7,57 9,25
26 Tai ll e de l'équipe de projet trop importante 6,29 4,75
27 Imputabilité de l'équipe et du gérant de projet mal définis 6,29 7,50
Mauvaise gestion d ' éq uipe (ex: Confusion des rô les entre les 28 membres de l'équ ipe, plusieurs rôles tenus par la même personne) 6, 14 8, 13
29 Mauvaise planification (pas pratique ou difficile à faire) 7,7 1 8,50

76
30 Mauvaise structure organisationnelle pour réa liser les projets 6,57 7,50
F ina ncement 7,77 6,75
Sous financement du projet. On lance un chiffre avant de fa ire 31 l'analyse des besoins plus précise et on ne modifie pas le financement. 7,7 1 6,13
Mauvaise est imation: on uti lise peu ou pas d 'outi ls ou de méthode 32 pour estimer convenablement le projet (sous-estimation fréquente) 8,43 7,38
Mauva ises estimations de projet quand le projet est réparti sur 33 plusieurs sites . 7,7 1 6,75
Tendance "presque naturelle" des développeurs à sous-estimer la 34 charge de travai 1 à effectuer 7,7 1 6,50
35 Non-disponibi lité des fond s ou du budget 7,29 7,00
Aspect temps/cédule d u projet 7,71 7,06
On crée des deadlines artific iels ou non réalistes qui créent une 36 press ion très fo rte sur les tests à effectuer ou sur le training des usagers 7,86 7,25
Problèmes d ' uti lisation des ressources sur plusieurs projets. Le plus 37 « fort » aura gain de cause mais avec quelles conséquences? 7,57 6,88
P rocessus de développement 7,21 5,19
38 Absence de méthodologie éprouvée pour réa liser un projet 7,29 6,25
Uti lisation d ' une nouvelle méthodologie pas encore éprouvée par les 39 développeurs 7, 14 4, 13
Aspect habiletés des ressources 8,00 8,13
40 Manque d ' habiletés du gestionnaire de projet 8, 14 7,63
Manque d ' habi letés et d ' experti se des développeurs dans leur domaine 4 1 respectif (ex: nouveau langage ou virage vers nouve lle plate-forme) 7,86 8,63
Aspect gestion des ressources humaines 7,42 6,56 Affectation à temps partiel de ressources sur le proj et (crée
42 généra lement des délais et un manque d' imp lication) 7,29 7,50
Mauvaise gestion des ressources humaines (ex: lors de l'embauche ou 43 de la sélection des consultants/experts) 8,00 7,25
On uti lise trop de consultants externes, conséquence: problème de surcoût ou de manque d ' imp lication de la part des gestionnaires sur
44 place. 6,86 5,63

77
Problème de non-disponibi lité d ' une ressource d 'expérience quand 45 vous en avez besoin . 7,57 7,13
46 Mauvais contrôle du travail des consu ltants ou experts externes. 7,29 5,13
Risque de perdre des ressources c lés (dans le marché des NTIC très 47 vo lati le) 7,50 6,75
Aspect Technologies 7,18 4,88
Introduction une nouve lle technologie pas encore testée par d'autres 48 compagn ies, l'effet de mode. 7,86 5,25
Le niveau de performance du système attendu est critique pour le 49 système (ex: dé lai, authentification, autres .. ) 7,43 5,63
50 Niveau d'interdépendance avec d'autres projets ou modu les 6,86 4,13
Mesures transito ires entre le nouveau système et l'ancien qui sont 51 inadéq uates 6,57 4,50
Aspect dépendances externes 6,43 5,50
Une culture très orientée développement interne met souvent en péril 52 les projets réalisés avec des fourn isseurs externes 6,43 5,50
Aspect Q ualité 7,11 6,27
Manque de standards qui peuvent induire un développement non 53 normalisé et non reproductible 7,00 6,50
54 Pas d'assurance qua lité externe à l'éq uipe de déve loppement 7,43 6,38
Manque de ressources affectées au contrôle de la qualité impliq uant 55 des coûts supplémentaires 7,67 6,71
Mauvaise compréhens ion de ce qu'est un risque, un problème, une 56 problématique .... bref confusion sur les concepts 6,33 5,50
Autres dimensions 6,57 2,88
57 Vente de la nouve lle version pas encore déve loppée au c li ent 6,57 2,88
Nous avons ainsi recueilli 57 facteurs de risque. Dans un premier temps, nous
pouvons constater qu'il y a une proximité avec les études antérieures sur le sujet tels que
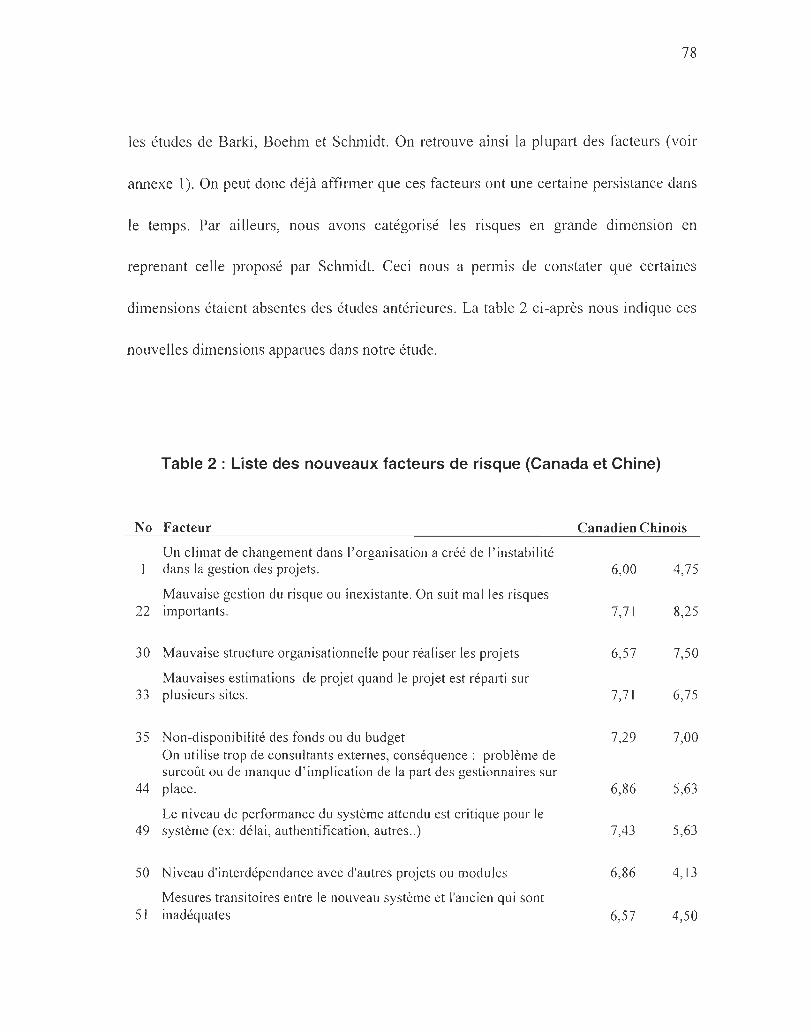
78
les études de Barki, Boehm et Schmidt. On retrouve ainsi la plupart des facteurs (voir
annexe 1). On peut donc déjà affirmer que ces facteurs ont une certaine persistance dans
le temps. Par ailleurs, nous avons catégorisé les risques en grande dimension en
reprenant celle proposé par Schmidt. Ceci nous a permis de constater que certaines
dimensions étaient absentes des études antérieures. La table 2 ci-après nous indique ces
nouvelles dimensions apparues dans notre étude.
Table 2 : Liste des nouveaux facteurs de risque (Canada et Chine)
No Facteur Canad ien Chinois
Un cl imat de changement dans l'organisation a créé de l' instabi lité dans la gestion des projets. 6,00 4,75
Mauvaise gestion du risque ou inexistante. On suit mal les risques 22 importants. 7,71 8,25
30 Mauvaise structure organisationnelle pour réaliser les projets 6,57 7,50
Mauvaises estimations de projet quand le projet est réparti sur 33 plusieurs sites. 7,71 6,75
35 Non-disponibi lité des fonds ou du budget 7,29 7,00 On utilise trop de consultants externes, conséquence: problème de surcoût ou de manque d'imp lication de la part des gestionnaires sur
44 place. 6,86 5,63
Le niveau de performance du système attendu est critique pour le 49 système (ex: dé lai, authentification, autres .. ) 7,43 5,63
50 Niveau d'interdépendance avec d'autres projets ou modules 6,86 4,13
Mesures transitoires entre le nouveau système et l'ancien qui sont 51 inadéquates 6,57 4,50

54 Pas d'assurance qualité externe à l'équipe de développement
Mauvaise compréhension de ce qu'est un risque, un problème, une 56 problématique . ... bref confusion sur les concepts
7,43
6,33
79
6,38
5,50
Parmi ces nouvelles dimensions, on ne peut passer sous silence le facteur 22 qui
traite de la gestion de risque. Ce facteur obtient pour les deux panels d'experts, le chiffre
le plus important. On voit ainsi apparaître une prise de conscience importante sur la
nécessité de gérer les risques. Par ailleurs, les facteurs 33 (estimation) et 49 (criticité)
peuvent sûrement être mis en relation avec la webification de nombreux processus
d'affaires réalisés depuis quelques années .
Nous avons comparé le jugement des experts chinois et canadiens. Dans un
premier temps, nous avons calculé une différence absolue pour nous permettre d'établir
éventuellement un profil type. La table 3 ci -après donne ces comparaisons.
Table 3 : Liste des principaux écarts entre experts canadiens et chinois (en valeur
absolue)
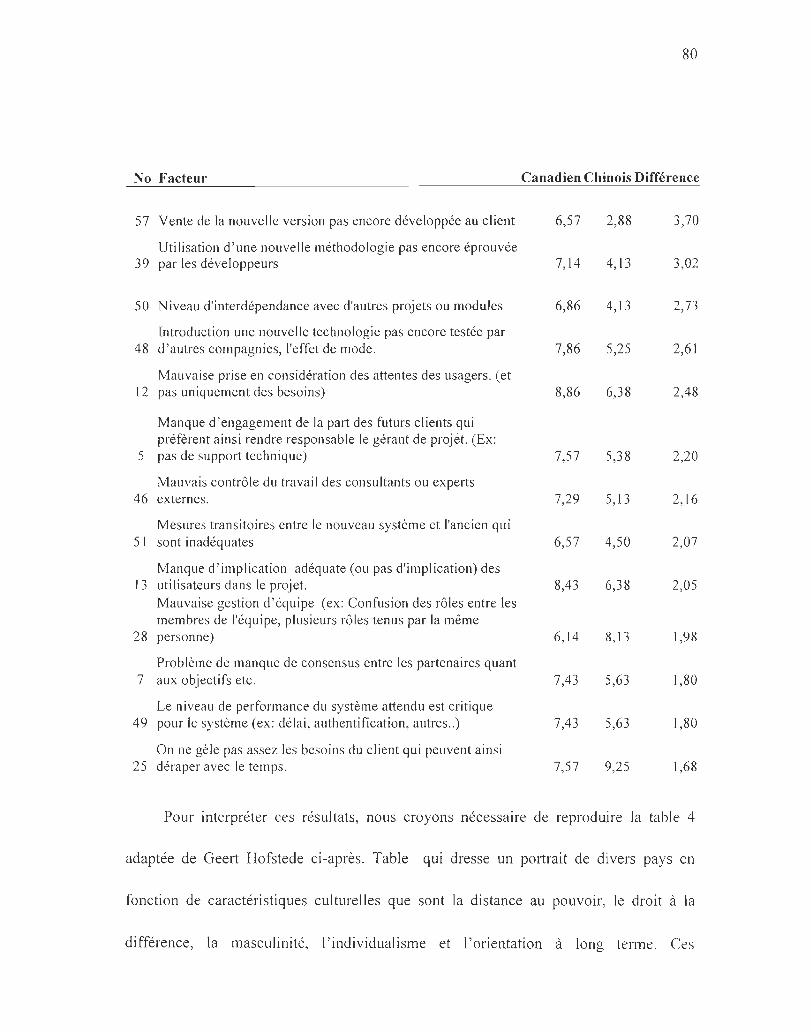
No Facteur
57 Vente de la nouve lle version pas encore développée au client
Utilisation d ' une nouvelle méthodo logie pas encore éprouvée 39 par les déve loppeurs
50 Ni veau d'interdépendance avec d'autres projets ou modules
[n troduction une nouve lle technologie pas encore testée par 48 d ' autres compagnies, l'effet de mode.
Mauvaise prise en considération des attentes des usagers. (et 12 pas uniquement des besoins)
Manque d 'engagement de la part des futurs clients qui préfèrent a insi rendre responsable le gérant de projet. (Ex:
5 pas de support technique)
Mauva is contrô le du trava il des consultants ou experts 46 externes.
Mesures transitoires entre le nouveau système et l'ancien qui 5 1 sont inadéquates
Manque d ' implication adéquate (ou pas d'implication) des 13 utilisateurs dans le projet.
Mauvaise gestion d 'équipe (ex: Confusion des rôles entre les membres de l'équipe, plusieurs rô les tenus par la même
28 personne)
Problème de manque de consensus entre les partenaires quant 7 aux obj ectifs etc.
Le ni veau de performance du système attendu est critique 49 pour le système (ex: délai, authentification, autres .. )
On ne gèle pas assez les besoins du c lient qui peuvent ainsi 25 déraper avec le temps.
80
Canadien Chinois Différence
6,57 2,88 3,70
7,14 4,13 3,02
6,86 4,13 2,73
7,86 5,25 2,61
8,86 6,38 2,48
7,57 5,38 2,20
7,29 5,13 2,16
6,57 4,50 2,07
8,43 6,38 2,05
6, 14 8, 13 1,98
7,43 5,63 1,80
7,43 5,63 1,80
7,57 9,25 1,68
Pour interpréter ces résultats, nous croyons nécessaire de reproduire la table 4
adaptée de Geert Hofs tede ci-après . Table qui dresse un portrait de divers pays en
fonction de caractéristiques culturell es que sont la di stance au pOUVOir, le droit à la
di fférence, la masculinité, l' individualisme et l'orientation à long terme. Ces

81
caractéristiques peuvent éventuellement apporter un éclairage intéressant sur les écarts
de jugement entre les experts canadiens et chinois.
Table 4 : Caractéristiques culturelles définies par Geert Hofstede
Droit à la Academyof Distance au différence Orientation à Management pouvoir (Power (Uncertainty Individual isme Masculinité L T (Long term Executive, 2003 distance) avoidance) (Individualism) (Masculinity) orientation)
Chine 80 60 20 50 118
Finlande 33 59 63 26 Etats-Unis /Canada 40 46 91 62 29 Hong-Kong 68 29 25 57 96 Médiane 53 pays 62 70 38 50
En analysant la table 3, on peut constater qu'il existe une différence marquée sur
les facteurs 12 (Mauvaise prise en considération des attentes des usagers )et 13 (Manque
d'implication adéquate des utilisateurs dans le projet). Cette différence est d 'autant plus
importante que ces deux facteurs occupent les deux premières places d'importance dans
le classement car1adien. Nous pouvons peut-être avancer que cette différence est due à la
• conjonction des caractéristiques Distance au pouvoir et Individualisme de la société
canadienne.
Dans le même ordre d'idées, on peut aussi constater qu ' il existe une différence
marquée sur les facteurs 28 (Mauvaise gestion d 'équipe (ex: Confusion des rôles entre
les membres de l'équipe, plusieurs rôles tenus par la même personne))et 25 (On ne gèle

82
pas assez les besoins du client qui peuvent ainsi déraper avec le temps). Cette différence
est d ' autant plus importante que ces deux facteurs occupent des places prépondérantes
dans le classement chinois. Pour le facteur 28, nous pouvons peut-être avancer que cette
différence est due à la conjonction des caractéristiques Distance au pouvoir et
Individualisme de la société chinoise. Nous n' avons pas d 'explication pour le facteur 25 .
Finalement, ce qui est le plus surprenant dans cette étude est sans aucun doute que
nous avons pu démontrer que les facteurs de risque à prendre en considération diffèrent
selon les pays et varient dans le temps. Ceci vient un peu en opposition avec les
approches classiques du PMI ou du SEI qui se veulent anhistorique et non dépendante
d'une culture en particulier.
Conclusion
Dans cet article, nous avons rappelé que des statistiques récentes, sur le taux de
succès des projets informatiques, publiées par le Standish Group en 2004 présentaient
encore des résultats très mitigés . Parmi les problèmes auxquels cette industrie est
confrontée, nous avons retenu la gestion des risques et plus précisément la phase
d' identification des risques. Ce choix s'expliquait par le caractère historique et
83
parcellaire de certaines études antérieures et par la caractéristique idiosyncrasique des
modèles proposés.
Après avoir réalisé cette étude par le biais d' une méthode Delphi auprès d 'expelis
canadiens et chinois, nous pouvons conclure que les facteurs de risque ont une certaine
persistance dans le temps. Nous retrouvons ainsi dans notre étude la plupart des facteurs
de risque déjà énumérés dans les études antérieures. Toutefois, nous avons découvert de
nouveaux facteurs de risque. Nous pouvons aussi mentionner que l' importance relative
de ces facteurs varient selon une dimension culturelle. Toutefois, il nous semble
essentiel d'être prudent quant à la lecture que nous pouvons faire de ces caractéristiques
culturelles. On peut néanmoins dire que les méthodes de gestion des risques qui veulent
imposer le « one best way » (comme le PMI) doivent être prises avec beaucoup de
précaution. Nous sommes aussi conscients que cette étude a certaines limites comme
celle due aux panels d' experts retenus et celle due au nombre de pays retenus. Toutefois,
nous pensons que cette étude peut être fort utile pour les gérants de projets qui sont
amenés à gérer les risques dans les projets de développement de système d' information.