Embed Size (px)
Citation preview
May 11, 2015
PHILIPPINE STOCK EXCHANGE, INC. 3rd FLOOR, PSE PLAZA, Ayala Triangle Ayala Avenue, Makati City. Attention: JANET A. ENCARNACION Head, Disclosures Department
Re: SEC Form 17-C Dear Ms. Encarnacion: Attached is the copy of the Amended Current Report SEC Form 17-C Re: Cash Dividend Declaration submitted to Securities and Exchange Commission. Thank you. Very truly yours, PHILIPPINE SEVEN CORPORATION By: ATTY. EVELYN S. ENRIQUEZ Corporate Secretary

COCOCOCOVER SHEETVER SHEETVER SHEETVER SHEET
P H I L I P P I N E
S E V E N
C O R P O R A T I O N
(Company’s full Name)
7 t h F l r . T h e C o l u m b i a T o w e r
O r t i g a s A v e. M a n d a l u y o n g C i t y (Business Address: No. Street City / Town / Province)
Company Telephone Number
Contact Person
1 2 3 1 1 7 . C 0 7 3rd Thursday Month Day FORM TYPE Month Day Fiscal Year Annual Meeting
AMENDED 17-C RE: CASH DIVIDEND DECLARATION
Secondary License Type, if Applicable
Dept. Requiring this Doc. Amended Articles Number/Section
Total Amount of Borrowings
Total No. of Stockholders Domestic Foreign
------------------------------------------------------------------------------------------------------------------------------------------
To be accomplished by SEC personnel concerned
File Number LCU
Document I.D. Cashier
STAMPS
Remarks = pls. use black ink for scanning purposes
0 0 0 0 1 0 8 4 7 6
S.E.C Registration Number
Atty. Evelyn S. Enriquez
Corporate Secretary
724-44-41 to 51


SECURITIES AND EXCHANGE COMMISSION
SEC FORM 17-C
CURRENT REPORT UNDER SECTION 17 OF THE SECURITIES REGULATION CODE
AND SRC RULE 17.2 (c) THEREUNDER 1. Date of Report : May 11, 2015 2. SEC Identification Number : 108476 3. BIR Tax Identification No. : 000-390-189-000 4. Exact Name of Issuer as specified in its charter : Philippine Seven Corporation 5. Province, Country or other jurisdiction : PHILIPPINES 6. Industry Classification Code: (SEC Use only) 7. Address of principal office : 7th Floor, The Columbia Tower
Ortigas Avenue, Mandaluyong City 1550
8. Issuer’s Telephone number, including area code : (632) 724-4441 to 51 9. Former name of former address, if changed since
last report : n / a 10. Securities Registered pursuant to Sections 8 and 12 of the SRC or Sections 4 and
8 of the RSA Title of Each Class Number of Shares of Common Stock Outstanding and Amount of Debt Outstanding Shares Outstanding – Common 458,435,323 Units – Warrants 0 11. Indicate the item number reported herein :
Item 9. Other Events

1
Item 9. Other Events
The Board of Directors of PHILIPPINE SEVEN CORPORATION, in its Meeting of April 23, 2015 held at the Sampaguita Function Room, Ground Floor, EDSA Shangri-La Hotel, Ortigas Centre, Mandaluyong City, there being a quorum, the Board of Directors during said meeting has approved a Cash dividend declaration of Forty Centavos (Php0.40) per share on the outstanding capital stock of the Corporation of 458,435,323 shares or equivalent to Php 183,374,129.00. The record date for entitlement to said cash dividend shall be on May 08, 2015 and the payment date shall be on May 22, 2015. In compliance with the requirements of the Commission, attached herewith are the following documents: 1. Certification by the Corporate Secretary on the board resolution approving the cash
dividend declaration; 2. Certification by the Corporate Secretary on the Total Outstanding Capital Stock of the
Corporation as of record date, and Total Amount of Cash Dividend for Distribution; and
3. Copy of the Audited Financial Statements as of the last year, stamped received by SEC and BIR and used as basis for the cash dividend declaration (with reconciliation of retained earnings).
SIGNATURE Pursuant to the requirement of the Securities Regulation Code, the registrant has duly caused this report to be signed on its behalf by the undersigned duly authorized for the purpose. PHILIPPINE SEVEN CORPORATION By: EVELYN S. ENRIQUEZ Corporate Secretary


COVER SHEET for
AUDITED FINANCIAL STATEMENTS
SEC Registration Number
1 0 8 4 7 6
Company Name
P H I L I P P I N E S E V E N C O R P O R A T I O N
A N D S U B S I D I A R I E S
Principal Office (No./Street/Barangay/City/Town/Province)
7 T H F L O O R , T H E C O L U M B I A T O W E R ,
O R T I G A S A V E N U E , M A N D A L U Y O N G
C I T Y
Form Type Department requiring the report Secondary License Type, If Applicable
A C F S N /A
COMPANY INFORMATION
Company’s Email Address Company’s Telephone Number/s Mobile Number
705-5200 (0922) 879 2134
No. of Stockholders
Annual Meeting Month/Day
Fiscal Year Month/Day
640 07/17 12/31
CONTACT PERSON INFORMATION The designated contact person MUST be an Officer of the Corporation
Name of Contact Person Email Address Telephone Number/s Mobile Number
Steve Chen [email protected] 705-5241
Contact Person’s Address
7th Floor, The Columbia Tower, Ortigas Avenue, Mandaluyong City
Note: In case of death, resignation or cessation of office of the officer designated as contact person, such incident shall be reported to the Commission within thirty (30) calendar days from the occurrence thereof with information and complete contact details of the new contact person designated.
1
SyCip Gorres Velayo & Co. 6760 Ayala Avenue 1226 Makati City Philippines
Tel: (632) 891 0307 Fax: (632) 819 0872 ey.com/ph
BOA/PRC Reg. No. 0001, December 28, 2012, valid until December 31, 2015 SEC Accreditation No. 0012-FR-3 (Group A), November 15, 2012, valid until November 16, 2015
INDEPENDENT AUDITORS’ REPORT ON SUPPLEMENTARY SCHEDULES The Stockholders and the Board of Directors Philippine Seven Corporation 7th Floor, The Columbia Tower Ortigas Avenue, Mandaluyong City We have audited in accordance with Philippine Standards on Auditing, the consolidated financial statements of Philippine Seven Corporation and Subsidiaries (the Group) as at December 31, 2014 and 2013 and for each of the three years in the period ended December 31, 2014, included in this Form 17-A, and have issued our report thereon dated February 17, 2015. Our audits were made for the purpose of forming an opinion on the basic financial statements taken as a whole. The schedules listed in the Index to the Consolidated Financial Statements and Supplementary Schedules are the responsibility of the Group’s management. These schedules are presented for purposes of complying with Securities Regulation Code Rule 68, As Amended (2011), and are not part of the basic financial statements. These schedules have been subjected to the auditing procedures applied in the audit of the basic financial statements and, in our opinion, fairly state, in all material respects, the information required to be set forth therein in relation to the basic financial statements taken as a whole. SYCIP GORRES VELAYO & CO. Belinda T. Beng Hui Partner CPA Certificate No. 88823 SEC Accreditation No. 0923-AR-1 (Group A), March 25, 2013, valid until March 24, 2016 Tax Identification No. 153-978-243 BIR Accreditation No. 08-001998-78-2012, June 19, 2012, valid until June 18, 2015 PTR No. 4751259, January 5, 2015, Makati City February 17, 2015
A member firm of Ernst & Young Global Limited

2
SyCip Gorres Velayo & Co. 6760 Ayala Avenue 1226 Makati City Philippines
Tel: (632) 891 0307 Fax: (632) 819 0872 ey.com/ph
BOA/PRC Reg. No. 0001, December 28, 2012, valid until December 31, 2015 SEC Accreditation No. 0012-FR-3 (Group A), November 15, 2012, valid until November 16, 2015
INDEPENDENT AUDITORS’ REPORT The Stockholders and the Board of Directors Philippine Seven Corporation 7th Floor, The Columbia Tower Ortigas Avenue, Mandaluyong City We have audited the accompanying consolidated financial statements of Philippine Seven Corporation and Subsidiaries, which comprise the consolidated balance sheets as at December 31, 2014 and 2013, and the consolidated statements of comprehensive income, statements of changes in equity and statements of cash flows for each of the three years in the period ended December 31, 2014, and a summary of significant accounting policies and other explanatory information.
Management’s Responsibility for the Consolidated Financial Statements
Management is responsible for the preparation and fair presentation of these consolidated financial statements in accordance with Philippine Financial Reporting Standards, and for such internal control as management determines is necessary to enable the preparation of consolidated financial statements that are free from material misstatement, whether due to fraud or error.
Auditors’ Responsibility
Our responsibility is to express an opinion on these consolidated financial statements based on our audits. We conducted our audits in accordance with Philippine Standards on Auditing. Those standards require that we comply with ethical requirements and plan and perform the audit to obtain reasonable assurance about whether the consolidated financial statements are free from material misstatement.
An audit involves performing procedures to obtain audit evidence about the amounts and disclosures in the consolidated financial statements. The procedures selected depend on the auditor’s judgment, including the assessment of the risks of material misstatement of the consolidated financial statements, whether due to fraud or error. In making those risk assessments, the auditor considers internal control relevant to the entity’s preparation and fair presentation of the consolidated financial statements in order to design audit procedures that are appropriate in the circumstances, but not for the purpose of expressing an opinion on the effectiveness of the entity’s internal control. An audit also includes evaluating the appropriateness of accounting policies used and the reasonableness of accounting estimates made by management, as well as evaluating the overall presentation of the consolidated financial statements.
We believe that the audit evidence we have obtained is sufficient and appropriate to provide a basis for our audit opinion.
A member firm of Ernst & Young Global Limited
3
- 2 -
Opinion
In our opinion, the consolidated financial statements present fairly, in all material respects,the financial position of Philippine Seven Corporation and Subsidiaries as at December 31, 2014 and 2013, and their financial performance and their cash flows for each of the three years in the period ended December 31, 2014 in accordance with Philippine Financial Reporting Standards. SYCIP GORRES VELAYO & CO. Belinda T. Beng Hui Partner CPA Certificate No. 88823 SEC Accreditation No. 0923-AR-1 (Group A), March 25, 2013, valid until March 24, 2016 Tax Identification No. 153-978-243 BIR Accreditation No. 08-001998-78-2012, June 19, 2012, valid until June 18, 2015 PTR No. 4751259, January 5, 2015, Makati City February 17, 2015
A member firm of Ernst & Young Global Limited

4
INDEPENDENT AUDITORS’ REPORT The Stockholders and the Board of Directors Philippine Seven Corporation We have audited the accompanying consolidated financial statements of Philippine Seven Corporation and Subsidiaries, which comprise the consolidated balance sheets as at December 31, 2014 and 2013, and the consolidated statements of comprehensive income, statements of changes in equity and statements of cash flows for each of the three years in the period ended December 31, 2014, and a summary of significant accounting policies and other explanatory information.
Management’s Responsibility for the Consolidated Financial Statements
Management is responsible for the preparation and fair presentation of these consolidated financial statements in accordance with Philippine Financial Reporting Standards, and for such internal control as management determines is necessary to enable the preparation of consolidated financial statements that are free from material misstatement, whether due to fraud or error.
Auditors’ Responsibility
Our responsibility is to express an opinion on these consolidated financial statements based on our audits. We conducted our audits in accordance with Philippine Standards on Auditing. Those standards require that we comply with ethical requirements and plan and perform the audit to obtain reasonable assurance about whether the consolidated financial statements are free from material misstatement.
An audit involves performing procedures to obtain audit evidence about the amounts and disclosures in the consolidated financial statements. The procedures selected depend on the auditor’s judgment, including the assessment of the risks of material misstatement of the consolidated financial statements, whether due to fraud or error. In making those risk assessments, the auditor considers internal control relevant to the entity’s preparation and fair presentation of the consolidated financial statements in order to design audit procedures that are appropriate in the circumstances, but not for the purpose of expressing an opinion on the effectiveness of the entity’s internal control. An audit also includes evaluating the appropriateness of accounting policies used and the reasonableness of accounting estimates made by management, as well as evaluating the overall presentation of the consolidated financial statements.
We believe that the audit evidence we have obtained is sufficient and appropriate to provide a basis for our audit opinion.
SyCip Gorres Velayo & Co. 6760 Ayala Avenue 1226 Makati City Philippines
Tel: (632) 891 0307 Fax: (632) 819 0872 ey.com/ph
BOA/PRC Reg. No. 0001, December 28, 2012, valid until December 31, 2015 SEC Accreditation No. 0012-FR-3 (Group A), November 15, 2012, valid until November 16, 2015

5
- 2 - Opinion
In our opinion, the consolidated financial statements present fairly, in all material respects,the financial position of Philippine Seven Corporation and Subsidiaries as at December 31, 2014 and 2013, and their financial performance and their cash flows for each of the three years in the period ended December 31, 2014 in accordance with Philippine Financial Reporting Standards. SYCIP GORRES VELAYO & CO. Belinda T. Beng Hui Partner CPA Certificate No. 88823 SEC Accreditation No. 0923-AR-1 (Group A), March 25, 2013, valid until March 24, 2016 Tax Identification No. 153-978-243 BIR Accreditation No. 08-001998-78-2012, June 19, 2012, valid until June 18, 2015 PTR No. 4751259, January 5, 2015, Makati City February 17, 2015
A member firm of Ernst & Young Global Limited

6
PHILIPPINE SEVEN CORPORATION AND SUBSIDIARIES CONSOLIDATED BALANCE SHEETS December 31 2014 2013
ASSETS
Current Assets Cash and cash equivalents (Notes 4, 29 and 30) P=1,241,685,743 P=973,002,633 Short-term investment (Notes 4, 29 and 30) 10,884,130 10,810,229 Receivables (Notes 5, 29 and 30) 589,387,141 468,845,049 Inventories (Note 6) 1,165,094,076 900,849,891 Prepayments and other current assets (Note 7) 358,396,530 270,748,698 Total Current Assets 3,365,447,620 2,624,256,500
Noncurrent Assets Property and equipment (Note 8) 3,558,089,998 2,746,672,621 Deposits (Notes 9, 29 and 30) 460,528,797 313,888,467 Deferred income tax assets - net (Note 27) 79,238,167 63,203,127 Goodwill and other noncurrent assets (Notes 10, 29 and 30) 419,000,444 276,692,257 Total Noncurrent Assets 4,516,857,406 3,400,456,472
TOTAL ASSETS P=7,882,305,026 P=6,024,712,972
LIABILITIES AND EQUITY
Current Liabilities
Bank loans (Notes 11, 29 and 30) P=750,000,000 P=560,000,000 Accounts payable and accrued expenses
(Notes12, 29 and 30) 2,445,160,713 1,872,703,489 Income tax payable 176,425,816 109,792,774 Other current liabilities (Notes 13 and 25) 853,722,638 634,006,329 Total Current Liabilities 4,225,309,167 3,176,502,592
Noncurrent Liabilities Deposits payable (Note 14) 234,502,609 202,888,935 Net retirement obligations (Note 24) 100,404,074 96,481,142
Cumulative redeemable preferred shares (Note 15) 6,000,000 6,000,000
Deferred revenue - net of current portion (Note 16) 26,552,651 1,607,183
Total Noncurrent Liabilities 367,459,334 306,977,260 Total Liabilities P=4,592,768,501 P=3,483,479,852
(Forward)

7
- 2 -
December 31 2014 2013
Equity
Common stock (Notes 17 and 31) - P=1 par value
Authorized -600,000,000 shares Issued - 459,121,573 shares P=459,121,573 P=459,121,573 Additional paid-in capital (Note 31) 293,525,037 293,525,037
Retained earnings (Notes 17 and 31) 2,546,335,563 1,810,521,305 Other comprehensive income (loss): Remeasurements loss on net retirement obligations- net of
deferred income tax asset (Notes 24 and 27) (25,041,697) (22,241,444) Revaluation increment on land -net of deferred income tax
liability (Notes 8and 27) 18,519,295 3,229,895
3,292,459,771 2,544,156,366
Cost of 686,250 shares held in treasury (Note 17) (2,923,246) (2,923,246)
Total Equity 3,289,536,525 2,541,233,120
TOTAL LIABILITIES AND EQUITY P=7,882,305,026 P=6,024,712,972
See accompanying Notes to Consolidated Financial Statements.
8
PHILIPPINE SEVEN CORPORATION AND SUBSIDIARIES CONSOLIDATED STATEMENTS OF COMPREHENSIVE INCOME Years Ended December 31
2014 2013 2012
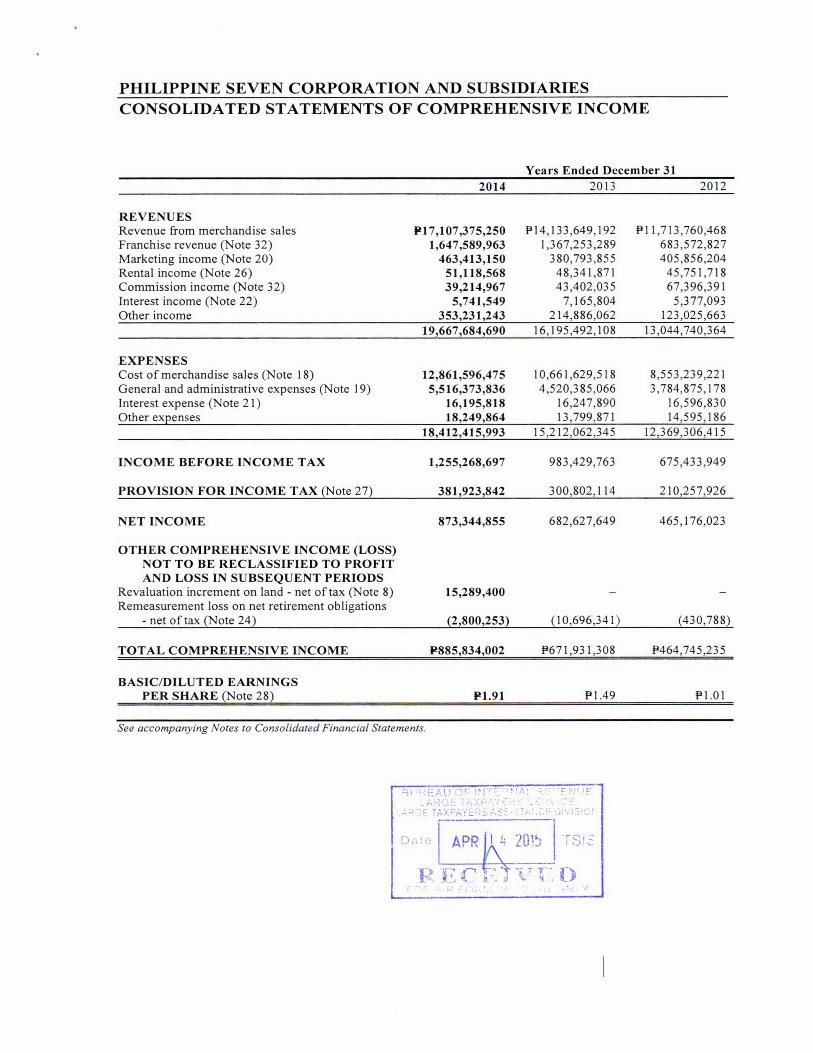
REVENUES Revenue from merchandise sales P=17,107,375,250 P=14,133,649,192 P=11,713,760,468 Franchise revenue (Note32) 1,647,589,963 1,367,253,289 683,572,827 Marketing income (Note 20) 463,413,150 380,793,855 405,856,204 Rental income (Note 26) 51,118,568 48,341,871 45,751,718 Commission income (Note 32) 39,214,967 43,402,035 67,396,391 Interest income (Note22) 5,741,549 7,165,804 5,377,093 Other income 353,231,243 214,886,062 123,025,663 19,667,684,690 16,195,492,108 13,044,740,364
EXPENSES Cost of merchandise sales (Note 18) 12,861,596,475 10,661,629,518 8,553,239,221 General and administrative expenses (Note 19) 5,516,373,836 4,520,385,066 3,784,875,178 Interest expense (Note 21) 16,195,818 16,247,890 16,596,830 Other expenses 18,249,864 13,799,871 14,595,186 18,412,415,993 15,212,062,345 12,369,306,415
INCOME BEFORE INCOME TAX 1,255,268,697 983,429,763 675,433,949
PROVISION FOR INCOME TAX (Note 27) 381,923,842 300,802,114 210,257,926
NET INCOME 873,344,855 682,627,649 465,176,023
OTHER COMPREHENSIVE INCOME (LOSS) NOT TO BE RECLASSIFIED TO PROFIT AND LOSS IN SUBSEQUENT PERIODS
Revaluation increment on land-net of tax (Note 8) 15,289,400 – – Remeasurement loss on net retirement obligations
- net of tax (Note 24) (2,800,253) (10,696,341) (430,788)
TOTAL COMPREHENSIVE INCOME P=885,834,002 P=671,931,308 P=464,745,235
BASIC/DILUTED EARNINGS PER SHARE (Note 28) P=1.91 P=1.49 P=1.01
See accompanying Notes to Consolidated Financial Statements.

*SGVFS010389* 9
PHILIPPINE SEVEN CORPORATION AND SUBSIDIARIES CONSOLIDATED STATEMENTS OF CHANGES IN EQUITY FOR THE YEARS ENDED DECEMBER 31, 2014, 2013 and 2012 Other Comprehensive Income (Loss)
Common Stock
(Note 17) Additional
Paid-in Capital
Retained Earnings (Note 17)
Remeasurement Loss on Net Retirement
Obligations- Net of Tax
Revaluation Increment on Land -
Net of Tax Total
Treasury Stock
(Note 17) Total
Balances at January 1, 2014 P=459,121,573 P=293,525,037 P=1,810,521,305 (P=22,241,444) P=3,229,895 P=2,544,156,366 (P=2,923,246) P=2,541,233,120 Net income – – 873,344,855 – – 873,344,855 – 873,344,855 Revaluation increment on land (Note 8) – – – – 15,289,400 15,289,400 – 15,289,400 Remeasurement loss on net retirement obligations – – – (2,800,253) – (2,800,253) – (2,800,253) Total comprehensive income – – 873,344,855 (2,800,253) 15,289,400 885,834,002 – 885,834,002 Cash dividends (Note 17) – – (137,530,597) – – (137,530,597) – (137,530,597) Balances at December 31, 2014 P=459,121,573 P=293,525,037 P=2,546,335,563 (P=25,041,697) P=18,519,295 P=3,292,459,771 (P=2,923,246) P=3,289,536,525
Balances at January 1, 2013 P=399,325,661 P=293,525,037 P=1,227,553,509 (P=11,545,103) P=3,229,895 P=1,912,088,999 (P=2,923,246) P=1,909,165,753 Net income during the year – – 682,627,649 – – 682,627,649 – 682,627,649 Remeasurement loss on net retirement obligations – – – (10,696,341) – (10,696,341) – (10,696,341) Total comprehensive income – – 682,627,649 (10,696,341) – 671,931,308 – 671,931,308 Stock dividends (Note 17) 59,795,912 – (59,795,912) – – – – – Cash dividends (Note 17) – – (39,863,941) – – (39,863,941) – (39,863,941) Balances at December 31, 2013 P=459,121,573 P=293,525,037 P=1,810,521,305 (P=22,241,444) P=3,229,895 P=2,544,156,366 (P=2,923,246) P=2,541,233,120
Balances at January 1, 2012 P=347,329,216 P=293,525,037 P=849,038,228 (P=11,114,315) P=3,229,895 P=1,482,008,061 (P=2,923,246) P=1,479,084,815 Net income during the year – – 465,176,023 – – 465,176,023 – 465,176,023 Remeasurement loss on net retirement obligations – – – (430,788) – (430,788) – (430,788) Total comprehensive income – – 465,176,023 (430,788) – 464,745,235 – 464,745,235 Stock dividends (Note 17) 51,996,445 – (51,996,445) – – – – – Cash dividends (Note 17) – – (34,664,297) – – (34,664,297) – (34,664,297) Balances at December 31, 2012 P=399,325,661 P=293,525,037 P=1,227,553,509 (P=11,545,103) P=3,229,895 P=1,912,088,999 (P=2,923,246) P=1,909,165,753
See accompanying Notes to Consolidated Financial Statements.

*SGVFS010389* 10
PHILIPPINE SEVEN CORPORATION AND SUBSIDIARIES CONSOLIDATED STATEMENTS OF CASH FLOWS Years Ended December 31 2014 2013 2012
CASH FLOWS FROM OPERATING ACTIVITIES Income before income tax P=1,255,268,697 P=983,429,763 P=675,433,949
Adjustments for:
Depreciation and amortization(Notes 8 and 19) 862,759,509 709,518,959 527,786,925 Amortization of: Deferred revenue on exclusivity contract
(Notes 16 and 32) (25,446,429) (818,452) (1,934,524)
Deferred lease (Notes 10 and 26) 2,277,636 2,410,613 2,485,728 Software and other program costs
(Notes 10 and 19) 655,605 1,316,561 1,490,475 Deferred revenue on finance lease
(Notes 16 and 26) (589,567) (589,567) (589,567)
Net retirement benefits cost (Notes 23 and 24) 19,867,370 16,858,692 15,420,495 Interest expense (Note21) 16,195,818 16,247,890 16,596,830
Interest income (Note22) (5,741,549) (7,165,804) (5,377,093)
Noncash donation expense 297,731 – –
Unrealized foreign exchange loss (gain) (24,209) 296,601 439,728
Operating income before working capital changes 2,125,520,612 1,721,505,256 1,231,752,946
Increase in:
Receivables (120,327,092) (94,042,512) (130,841,872)
Inventories (264,244,185) (173,863,328) (207,727,627) Prepayments and other current assets (87,665,635) (11,740,811) (97,485,749)
Increase in:
Accounts payable and accrued expenses 573,804,626 610,988,026 17,353,481
Other current liabilities 184,520,376 89,054,748 244,555,664
Deposits payable 31,613,674 20,987,697 10,443,405
Deferred revenue 86,177,397 3,442,212 – Retirement benefits contributions (Note 24) (19,944,800) (21,670,730) (20,279,212)
Cash generated from operations 2,509,454,973 2,144,660,558 1,047,771,036
Income taxes paid (336,660,528) (304,294,983) (181,147,036)
Interest received 2,693,092 4,350,085 2,866,833
Net cash provided by operating activities 2,175,487,537 1,844,715,660 869,490,833
CASH FLOWS FROM INVESTING ACTIVITIES
Additions to:
Property and equipment (Note 8) (1,653,573,106) (1,179,270,533) (858,674,993)
Software and other program costs (Note 10) (1,247,000) (3,019,195) (190,000)
Increase in: Deposits (143,591,873) (61,940,757) (35,553,176)
Goodwill and other noncurrent assets (143,994,428) (68,910,637) (7,405,740)
Short-term investment (73,901) (178,114) (222,208)
Collection of lease receivable (Note 26) – – 1,591,280
Proceeds from sale of property and equipment 131,360 – –
Net cash used in investing activities (1,942,348,948) (1,313,319,236) (900,454,837)
(Forward)

11
- 2 -
Years Ended December 31 2014 2013 2012
CASH FLOWS FROM FINANCING ACTIVITIES
Availments of bank loans (Note 11) P=950,000,000 P=550,000,000 P=210,000,000
Payments of bank loans (Note 11) (760,000,000) (467,777,778) (106,888,889)
Interest paid (16,949,091) (15,822,416) (16,597,779) Cash dividends paid (Note 17) (137,530,597) (39,863,941) (34,664,297)
Net cash provided byfinancing activities 35,520,312 26,535,865 51,849,035
EFFECT OF EXCHANGE RATE CHANGES ON CASH AND CASH EQUIVALENTS 24,209 (215,225) (296,211)
NET INCREASE IN CASH AND CASH EQUIVALENTS 268,683,110 557,717,064 20,588,820
CASH AND CASH EQUIVALENTS AT BEGINNING OF YEAR (Note 4) 973,002,633 415,285,569 394,696,749
CASH AND CASH EQUIVALENTS AT END OF YEAR (Note 4) P=1,241,685,743 P=973,002,633 P=415,285,569
See accompanying Notes to Consolidated Financial Statements.

*SGVFS010389*
PHILIPPINE SEVEN CORPORATION AND SUBSIDIARIES NOTES TO CONSOLIDATED FINANCIAL STATEMENTS 1. Corporate Information and Authorizationfor Issuance of the Consolidated Financial Statements
Corporate Information Philippine Seven Corporation (the Company or PSC) was incorporated in the Philippines and registered with the Philippine Securities and Exchange Commission (SEC) on November 24, 1982. The Company and its subsidiaries (collectively referred to as the “Group”), are primarily engaged in the business of retailing, merchandising, buying, selling, marketing, importing, exporting, franchising, acquiring, holding, distributing, warehousing, trading, exchanging or otherwise dealing in all kinds of grocery items, dry goods, food or foodstuff, beverages, drinks and all kinds of consumer needs or requirements and in connection therewith, operating or maintaining warehouses, storages, delivery vehicles and similar or incidental facilities. The Group is also engaged in the management, development, sale, exchange, and holding for investment or otherwise of real estate of all kinds, including buildings, houses and apartments and other structures.
The Company is controlled by President Chain Store (Labuan) Holdings, Ltd., an investment holding company incorporated in Malaysia, which owns 51.56% of the Company’s outstanding shares. The remaining 48.44% of the shares are widely held. The ultimate parent of the Company is President Chain Store Corporation (PCSC), which is incorporated in Taiwan, Republic of China.
The Company has its primary listing on the Philippine Stock Exchange. As at December 31, 2014 and 2013, the Company has640 and650 equity holders, respectively.
The registered business address of the Company is 7th Floor, The Columbia Tower, Ortigas Avenue, Mandaluyong City.
Authorization for Issuance of the Consolidated Financial Statements The consolidated financial statements were authorized for issue by the Board of Directors (BOD) on February 17, 2015.
2. Summary of Significant Accounting Policiesand Financial Reporting Practices
Basis of Preparation The consolidated financial statements are prepared under the historical cost basis, except for parcels of land, which arecarried at revalued amount. The consolidated financial statements are presented in Philippine Peso (Peso), which is the Group’s functional currency and all amounts are rounded to the nearest Peso except whenotherwise indicated. Statement of Compliance The consolidated financial statementsare prepared in compliance with Philippine Financial Reporting Standards (PFRS).

- 2 -
*SGVFS010389*
Changes in Accounting Policies The accounting policies adopted are consistent with those of the previous financial year except for the following new and amended PFRS which became effective on January 1, 2014. The nature and the impact of each new standard and amendment are described below:
• Investment Entities (Amendments to PFRS 10, Consolidated Financial Statements, PFRS 12, Disclosure of Interests in Other Entities, and Philippine Accounting Standards (PAS) 27, Separate Financial Statements) These amendments provide an exception to the consolidation requirement for entities that meet the definition of an investment entity under PFRS 10. The exception to consolidation requires investment entities to account for subsidiaries at fair value through profit or loss. The amendments must be applied retrospectively, subject to certain transition relief. These amendments have no impact to the Group, since none of the entities within the Group qualifies to be an investment entity under PFRS 10.
• PAS 32,Financial Instruments: Presentation - Offsetting Financial Assets and Financial
Liabilities(Amendments) These amendments clarify the meaning of ‘currently has a legally enforceable right to set-off’ and the criteria for non-simultaneous settlement mechanisms of clearing houses to qualify for offsetting and are applied retrospectively. These amendments affect presentation only and have no impact on the Group’s financial position or performance.
• PAS 36, Recoverable Amount Disclosures for Non-Financial Assets(Amendments) These amendments remove the unintended consequences of PFRS 13,Fair Value Measurement, on the disclosures required under PAS 36. In addition, these amendments require disclosure of the recoverable amounts for assets or cash-generating units (CGUs) for which impairment loss has been recognized or reversed during the period.The application of these amendments has no material impact on the disclosure in the Group’s consolidated financial statements.
• PAS 39, Financial Instruments: Recognition and Measurement -Novation of Derivatives and Continuation of Hedge Accounting(Amendments) These amendments provide relief from discontinuing hedge accounting when novation of a derivative designated as a hedging instrument meets certain criteria and retrospective application is required. These amendments have no impact on the Group’s consolidated financial statements.
• Philippine Interpretation International Financial Reporting Interpretations Committee (IFRIC) 21, Levies IFRIC 21 clarifies that an entity recognizes a liability for a levy when the activity that triggers payment, as identified by the relevant legislation, occurs. For a levy that is triggered upon reaching a minimum threshold, the interpretation clarifies that no liability should be anticipated before the specified minimum threshold is reached. Retrospective application is required for IFRIC 21.This interpretation has no impact on the Group as it has applied the recognition principles under PAS 37, Provisions, Contingent Liabilities and Contingent Assets, consistent with the requirements of IFRIC 21 in prior years.
• Annual Improvements to PFRSs (2010-2012 cycle) In the 2010-2012 annual improvements cycle, seven amendments to six standards were issued, which included an amendment to PFRS 13.The amendment to PFRS 13 is effective immediately and it clarifies that short-term receivables and payables with no stated interest

- 3 -
*SGVFS010389*
rates can be measured at invoice amounts when the effect of discounting is immaterial. These amendments have no significant impact on the Group’s consolidated financial statements.
• Annual Improvements to PFRSs (2011-2013 cycle)
In the 2011-2013 annual improvements cycle, four amendments to four standards were issued, which included an amendment to PFRS 1, First-time Adoption of Philippine Financial Reporting Standards. The amendment to PFRS 1 is effective immediately. It clarifies that an entity may choose to apply either a current standard or a new standard that is not yet mandatory, but permits early application, provided either standard is applied consistently throughout the periods presented in the entity’s first PFRS financial statements. This amendment has no impact on the Group as it is not a first time PFRS adopter.
New Accounting Standards, Interpretations, and Amendments to Existing Standards Effective Subsequent to December 31, 2014 The Group will adopt the following standards, interpretations and amendments to existing standards enumerated below when these become effective. Except as otherwise indicated, the Group does not expect the adoption of these new and amended standards and interpretations to have a significant impact on the Group’s consolidated financial statements:
Standards issued but not yet effective • PFRS 9, Financial Instruments - Classification and Measurement (2010 version)
PFRS 9 (2010 version) reflects the first phase on the replacement of PAS 39 and applies to the classification and measurement of financial assets and liabilities as defined in PAS 39. PFRS 9 requires all financial assets to be measured at fair value at initial recognition. A debt financial asset may, if the fair value option (FVO) is not invoked, be subsequently measured at amortized cost if it is held within a business model that has the objective to hold the assets to collect the contractual cash flows and its contractual terms give rise, on specified dates, to cash flows that are solely payments of principal and interest on the principal outstanding. All other debt instruments are subsequently measured at fair value through profit or loss. All equity financial assets are measured at fair value either through other comprehensive income (OCI) or profit or loss. Equity financial assets held for trading must be measured at fair value through profit or loss. For FVO liabilities, the amount of change in the fair value of a liability that is attributable to changes in credit risk must be presented in OCI. The remainder of the change in fair value is presented in profit or loss, unless presentation of the fair value change in respect of the liability’s credit risk in OCI would create or enlarge an accounting mismatch in profit or loss. All other PAS 39 classification and measurement requirements for financial liabilities have been carried forward into PFRS 9, including the embedded derivative separation rules and the criteria for using the FVO. The adoption of the first phase of PFRS 9 will have an effect on the classification and measurement of the Group’s financial assets, but will potentially have no impact on the classification and measurement of financial liabilities. PFRS 9 (2010 version) is effective for annual periods beginning on or after January 1, 2015. This mandatory adoption date was moved to January 1, 2018 when the final version of PFRS 9 was adopted by the Financial Reporting Standards Council (FRSC). Such adoption, however, is still for approval by the Board of Accountancy (BOA).
• Philippine Interpretation IFRIC 15, Agreements for the Construction of Real Estate This interpretation covers accounting for revenue and associated expenses by entities that undertake the construction of real estate directly or through subcontractors. The SEC and the FRSC have deferred the effectivity of this interpretation until the final Revenue standard is issued by the International Accounting Standards Board (IASB) and an evaluation of the requirements of the final Revenue standard against the practices of the Philippine real estate industry is completed. Adoption of the interpretation will not have any impact on the financial statements of the Group.

- 4 -
*SGVFS010389*
The following new standards and amendments issued by the IASB were already adopted by the FRSC but are still for approval by BOA.
Effective in 2015 • PAS 19, Employee Benefits - Defined Benefit Plans: Employee Contributions(Amendments)
PAS 19 requires an entity to consider contributions from employees or third parties when accounting for defined benefit plans. Where the contributions are linked to service, they should be attributed to periods of service as a negative benefit. These amendments clarify that, if the amount of the contributions is independent of the number of years of service, an entity is permitted to recognize such contributions as a reduction in the service cost in the period in which the service is rendered, instead of allocating the contributions to the periods of service. This amendment is effective for annual periods beginning on or after January 1, 2015. It is not expected that this amendment would be relevant since the Group has no defined benefit plans with contributions from employees or third parties.
Annual Improvements to PFRS (2010-2012 cycle) The Annual Improvements to PFRSs (2010-2012 cycle) are effective for annual periods beginning on or after January 1, 2015 and are not expected to have a material impact on the Group’s consolidated financial statements. They include: • PFRS 2, Share-based Payment - Definition of Vesting Condition
This improvement is applied prospectively and clarifies various issues relating to the definitions of performance and service conditions which are vesting conditions, including: a. A performance condition must contain a service condition b. A performance target must be met while the counterparty is rendering service c. A performance target may relate to the operations or activities of an entity, or to those of
another entity in the same group d. A performance condition may be a market or non-market condition e. If the counterparty, regardless of the reason, ceases to provide service during the vesting
period, the service condition is not satisfied.
• PFRS 3, Business Combinations - Accounting for Contingent Consideration in a Business Combination The amendment is applied prospectively for business combinations for which the acquisition date is on or after July 1, 2014. It clarifies that a contingent consideration that is not classified as equity is subsequently measured at fair value through profit or loss whether or not it falls within the scope of PAS 39 (or PFRS 9, if early adopted). The Group shall consider this amendment for future business combinations.
• PFRS 8, Operating Segments - Aggregation of Operating Segments and Reconciliation of the
Total of the Reportable Segments’ Assets to the Entity’s Assets The amendments are applied retrospectively and clarify that: a. An entity must disclose the judgments made by management in applying the aggregation
criteria in the standard, including a brief description of operating segments that have been aggregated and the economic characteristics (e.g., sales and gross margins) used to assess whether the segments are ‘similar’.
b. The reconciliation of segment assets to total assets is only required to be disclosed if the reconciliation is reported to the chief operating decision maker, similar to the required disclosure for segment liabilities.

- 5 -
*SGVFS010389*
• PAS 16, Property, Plant and Equipmentand PAS 38, Intangible Assets - Revaluation Method - Proportionate Restatement of Accumulated Depreciation and Amortization The amendment is applied retrospectively and clarifies in PAS 16 and PAS 38 that the asset may be revalued by reference to the observable data on either the gross or the net carrying amount. In addition, the accumulated depreciation or amortization is the difference between the gross and carrying amounts of the asset.
• PAS 24, Related Party Disclosures - Key Management Personnel
The amendment is applied retrospectively and clarifies that a management entity, which is an entity that provides key management personnel services, is a related party subject to the related party disclosures. In addition, an entity that uses a management entity is required to disclose the expenses incurred for management services.
Annual Improvements to PFRS (2011-2013 cycle) The Annual Improvements to PFRSs (2011-2013 cycle) are effective for annual periods beginning on or after January 1, 2015 and are not expected to have a material impact on the Group’s consolidated financial statements. They include:
• PFRS 3, Business Combinations - Scope Exceptions for Joint Arrangements
The amendment is applied prospectively and clarifies the following regarding the scope exceptions within PFRS 3: a. Joint arrangements, not just joint ventures, are outside the scope of PFRS 3. b. This scope exception applies only to the accounting in the financial statements of the joint
arrangement itself.
• PFRS 13, Fair Value Measurement - Portfolio Exception The amendment is applied prospectively and clarifies that the portfolio exception in PFRS 13 can be applied not only to financial assets and financial liabilities, but also to other contracts within the scope of PAS 39.
• PAS 40, Investment Property
The amendment is applied prospectively and clarifies that PFRS 3, and not the description of ancillary services in PAS 40, is used to determine if the transaction is the purchase of an asset or business combination. The description of ancillary services in PAS 40 only differentiates between investment property and owner-occupied property (i.e., property, plant and equipment).
Effective in 2016 • PFRS 10, Consolidated Financial Statements and PAS 28, Investments in Associates and Joint
Ventures - Sale or Contribution of Assets between an Investor and its Associate or Joint Venture(Amendments) These amendments address an acknowledged inconsistency between the requirements in PFRS 10 and those in PAS 28 (2011) in dealing with the sale or contribution of assets between an investor and its associate or joint venture. The amendments require that a full gain or loss is recognized when a transaction involves a business (whether it is housed in a subsidiary or not). A partial gain or loss is recognized when a transaction involves assets that do not constitute a business, even if these assets are housed in a subsidiary. These amendments are effective from annual periods beginning on or after January 1, 2016.These amendments will not have any impact on the Group’s consolidated financial statements.
• PFRS 11, Joint Arrangements - Accounting for Acquisitions of Interests in Joint Operations
(Amendments)

- 6 -
*SGVFS010389*
The amendments to PFRS 11 require that a joint operator accounting for the acquisition of an interest in a joint operation, in which the activity of the joint operation constitutes a business must apply the relevant PFRS 3 principles for business combinations accounting. The amendments also clarify that a previously held interest in a joint operation is not remeasured on the acquisition of an additional interest in the same joint operation while joint control is retained. In addition, a scope exclusion has been added to PFRS 11 to specify that the amendments do not apply when the parties sharing joint control, including the reporting entity, are under common control of the same ultimate controlling party. The amendments apply to both the acquisition of the initial interest in a joint operation and the acquisition of any additional interests in the same joint operation and are prospectively effective for annual periods beginning on or after January 1, 2016, with early adoption permitted. These amendments are not expected to have any impact to the Group.
• PFRS 14, Regulatory Deferral Accounts PFRS 14 is an optional standard that allows an entity, whose activities are subject to rate-regulation, to continue applying most of its existing accounting policies for regulatory deferral account balances upon its first-time adoption of PFRS. Entities that adopt PFRS 14 must present the regulatory deferral accounts as separate line items on the balance sheet and present movements in these account balances as separate line items in the statement of comprehensive income. The standard requires disclosures on the nature of, and risks associated with, the entity’s rate-regulation and the effects of that rate-regulation on its financial statements. PFRS 14 is effective for annual periods beginning on or after January 1, 2016. Since the Group is an existing PFRS preparer, this standard would not apply.
• PAS 16, Property, Plant and Equipment,and PAS 38, Intangible Assets - Clarification of Acceptable Methods of Depreciation and Amortization (Amendments) The amendments clarify the principle in PAS 16 and PAS 38 that revenue reflects a pattern of economic benefits that are generated from operating a business (of which the asset is part) rather than the economic benefits that are consumed through use of the asset. As a result, a revenue-based method cannot be used to depreciate property, plant and equipment and may only be used in very limited circumstances to amortize intangible assets. The amendments are effective prospectively for annual periods beginning on or after January 1, 2016, with early adoption permitted. These amendments are not expected to have any impact to the Group given that the Group has not used a revenue-based method to depreciate its noncurrent assets.
• PAS 16, Property, Plant and Equipment, and PAS 41, Agriculture - Bearer Plants
(Amendments) The amendments change the accounting requirements for biological assets that meet the definition of bearer plants. Under the amendments, biological assets that meet the definition of bearer plants will no longer be within the scope of PAS 41. Instead, PAS 16 will apply. After initial recognition, bearer plants will be measured under PAS 16 at accumulated cost (before maturity) and using either the cost model or revaluation model (after maturity). The amendments also require that produce that grows on bearer plants will remain in the scope of PAS 41 measured at fair value less costs to sell. For government grants related to bearer plants, PAS 20, Accounting for Government Grants and Disclosure of Government Assistance, will apply. The amendments are retrospectively effective for annual periods beginning on or after January 1, 2016, with early adoption permitted. These amendments are not expected to have any impact to the Group as it does not have any bearer plants.
• PAS 27, Separate Financial Statements - Equity Method in Separate Financial Statements
(Amendments)

- 7 -
*SGVFS010389*
The amendments will allow entities to use the equity method to account for investments in subsidiaries, joint ventures and associates in their separate financial statements. Entities already applying PFRS and electing to change to the equity method in its separate financial statements will have to apply that change retrospectively. For first-time adopters of PFRS electing to use the equity method in its separate financial statements, they will be required to apply this method from the date of transition to PFRS. The amendments are effective for annual periods beginning on or after January 1, 2016, with early adoption permitted. These amendments will not have any impact on the Group’s consolidated financial statements.
Annual Improvements to PFRSs (2012-2014 cycle) The Annual Improvements to PFRSs (2012-2014 cycle) are effective for annual periods beginning on or after January 1, 2016 and are not expected to have a material impact on the Group’s consolidated financial statements. They include:
• PFRS 5, Non-current Assets Held for Sale and Discontinued Operations - Changes in
Methods of Disposal The amendment is applied prospectively and clarifies that changing from a disposal through sale to a disposal through distribution to owners and vice-versa should not be considered to be a new plan of disposal, rather it is a continuation of the original plan. There is, therefore, no interruption of the application of the requirements in PFRS 5. The amendment also clarifies that changing the disposal method does not change the date of classification.
• PFRS 7, Financial Instruments: Disclosures - Servicing Contracts PFRS 7 requires an entity to provide disclosures for any continuing involvement in a transferred asset that is derecognized in its entirety. The amendment clarifies that a servicing contract that includes a fee can constitute continuing involvement in a financial asset. An entity must assess the nature of the fee and arrangement against the guidance in PFRS 7 in order to assess whether the disclosures are required. The amendment is to be applied such that the assessment of which servicing contracts constitute continuing involvement will need to be done retrospectively. However, comparative disclosures are not required to be providedfor any period beginning before the annual period in which the entity first applies the amendments.
• PFRS 7 - Applicability of the Amendments to PFRS 7 to Condensed Interim Financial
Statements This amendment is applied retrospectively and clarifies that the disclosures on offsetting of financial assets and financial liabilities are not required in the condensed interim financial report unless they provide a significant update to the information reported in the most recent annual report.
• PAS 19, Employee Benefits - Regional Market Issue Regarding Discount Rate This amendment is applied prospectively and clarifies that market depth of high quality corporate bonds is assessed based on the currency in which the obligation is denominated, rather than the country where the obligation is located. When there is no deep market for high quality corporate bonds in that currency, government bond rates must be used.
• PAS 34, Interim Financial Reporting - Disclosure of Information ‘Elsewhere in the Interim Financial Report’ The amendment is applied retrospectively and clarifies that the required interim disclosures must either be in the interim financial statements or incorporated by cross-reference between the interim financial statements and wherever they are included within the greater interim financial report (e.g., in the management commentary or risk report).

- 8 -
*SGVFS010389*
Effective in 2018 • PFRS 9, Financial Instruments- Hedge Accounting and amendments to PFRS 9, PFRS 7 and
PAS 39 (2013 version) PFRS 9 (2013 version) already includes the third phase of the project to replace PAS 39 which pertains to hedge accounting. This version of PFRS 9 replaces the rules-based hedge accounting model of PAS 39 with a more principles-based approach. Changes include replacing the rules-based hedge effectiveness test with an objectives-based test that focuses on the economic relationship between the hedged item and the hedging instrument, and the effect of credit risk on that economic relationship; allowing risk components to be designated as the hedged item, not only for financial items but also for non-financial items, provided that the risk component is separately identifiable and reliably measurable; and allowing the time value of an option, the forward element of a forward contract and any foreign currency basis spread to be excluded from the designation of a derivative instrument as the hedging instrument and accounted for as costs of hedging. PFRS 9 also requires more extensive disclosures for hedge accounting.
PFRS 9 (2013 version) has no mandatory effective date. The mandatory effective date of January 1, 2018 was eventually set when the final version of PFRS 9 was adopted by the FRSC. The adoption of the final version of PFRS 9, however, is still for approval by BOA.
• PFRS 9, Financial Instruments(2014 or final version)
In July 2014, the final version of PFRS 9 was issued. PFRS 9 reflects all phases of the financial instruments project and replaces PAS 39 and all previous versions of PFRS 9. The standard introduces new requirements for classification and measurement, impairment, and hedge accounting. PFRS 9 is effective for annual periods beginning on or after January 1, 2018, with early application permitted. Retrospective application is required, but comparative information is not compulsory. Early application of previous versions of PFRS 9 is permitted if the date of initial application is before February 1, 2015.
The following new standard issued by the IASB has not yet been adopted by the FRSC:
• International Financial Reporting Standard (IFRS) 15, Revenue from Contracts with Customers IFRS 15 was issued in May 2014 and establishes a new five-step model that will apply to revenue arising from contracts with customers. Under IFRS 15 revenue is recognized at an amount that reflects the consideration to which an entity expects to be entitled in exchange for transferring goods or services to a customer. The principles in IFRS 15 provide a more structured approach to measuring and recognizing revenue. The new revenue standard is applicable to all entities and will supersede all current revenue recognition requirements under IFRS. Either a full or modified retrospective application is required for annual periods beginning on or after January 1, 2017 with early adoption permitted.
The Group continues to assess the impact of the above new and amended accounting standards and interpretations effective subsequent to the December 31, 2014 consolidated financial statements. Additional disclosures required by these amendments will be included in the consolidated financial statements when these amendments are adopted.
Basis of Consolidation The consolidated financial statements comprise the financial statements of the Company and its subsidiaries.Control is achieved when the Groupis exposed, or has rights, to variable returns from its involvement with the investee and has the ability to affect those returns through its power over the investee. Specifically, the Groupcontrols an investee if and only if the Group has:

- 9 -
*SGVFS010389*
• Power over the investee (i.e. existing rights that give it the current ability to direct the relevant activities of the investee);
• Exposure, or rights, to variable returns from its involvement with the investee; and • The ability to use its power over the investee to affect its returns. When the Group has less than a majority of the voting or similar rights of an investee, the Group considers all relevant facts and circumstances in assessing whether it has power over an investee, including: • The contractual arrangement with the other vote holders of the investee • Rights arising from other contractual arrangements • The Group’s voting rights and potential voting rights
The Group reassesses whether or not it controls an investee if facts and circumstances indicate that there are changes to one or more of the three elements of control. Consolidation of a subsidiary begins when the Group obtains control over the subsidiary and ceases when the Grouploses control of the subsidiary. Assets, liabilities, income and expenses of a subsidiary acquired or disposed of during the year are included in the consolidated financial statements from the date the Group gains control until the date the Groupceases to control the subsidiary.
When necessary, adjustments are made to the financial statements of subsidiaries to bring their accounting policies into line with the Group’s accounting policies. All intra-group assets and liabilities, equity, income, expenses and cash flows relating to transactions between members of the Group are eliminated in full on consolidation. A change in the ownership interest of a subsidiary, without a loss of control, is accounted for as an equity transaction. If the Company loses control over a subsidiary, it: • Derecognizes the assets (including goodwill) and liabilities of the subsidiary • Derecognizes the carrying amount of any non-controlling interests • Derecognizes the cumulative translation differences recorded in equity • Recognizes the fair value of the consideration received • Recognizes the fair value of any investment retained • Recognizes any surplus or deficit in profit or loss • Reclassifies the Company’s share of components previously recognized in OCI to profit or
loss or retained earnings, as appropriate, as would be required if the Company had directly disposed of the related assets or liabilities
The consolidated financial statements include the accounts of the Company and the following whollyowned subsidiaries:
Country of
Incorporation Principal Activity
Percentage of Ownership
Convenience Distribution, Inc. (CDI) Philippines Warehousing and
Distribution 100 Store Sites Holding, Inc. (SSHI) Philippines Holding 100
SSHI’s capital stock, which is divided into 40% common shares and 60% preferred shares are owned by the Company and by Philippine Seven Corporation-Employees Retirement Plan (PSC-ERP) through its trustee, Bank of the Philippines Islands-Asset Management and Trust Group (BPI-AMTG), respectively. These preferred shares which accrue and pay guaranteed

- 10 -
*SGVFS010389*
preferred dividends and are redeemable at the option of the holder are recognized as a financial liability in accordance with PFRS (see Note 15). The Company owns 100% of SSHI’s common shares, which, together with common key management, gives the Company control over SSHI.
The financial statements of the subsidiaries are prepared for the same financial reporting period as the Company, using uniform accounting policies. Intercompany transactions, balances and unrealized gains and losses are eliminated in full.
Cash and Cash Equivalents Cash includes cash on hand and in banks. Cash equivalents are short-term, highly liquid investments that are readily convertible to known amounts of cash with original maturities of three months or less from the date of acquisition and that are subject to an insignificant risk of change in value.
Financial Instruments The Group recognizes a financial asset or a financial liability in the consolidated balance sheet when it becomes a party to the contractual provisions of the instrument.
Initial Recognition and Measurement Financial assets and financial liabilities are recognized initially at fair value. Transaction costs are included in the initial measurement of all financial assets and financial liabilities, except for financial instruments measured at fair value through profit or loss (FVPL).
All regular way purchases and sales of financial assets are recognized on the trade date, i.e., the date the Group commits to purchase or sell the financial asset. Regular way purchases or sales of financial assets require delivery of assets within the time frame generally established by regulation in the market place.
The Group classifies its financial assets as financial assets at FVPL, held-to-maturity (HTM) investments, available-for-sale (AFS) financial assets or loans and receivables. Financial liabilities, on the other hand, are classified as either financial liabilities at FVPL or other financial liabilities. The classification depends on the purpose for which the financial assets and financial liabilities were acquired. Management determines the classification at initial recognition and, where allowed and appropriate, re-evaluates classification at every balance sheet date.
As at December 31, 2014 and 2013, the Group’s financial instruments include loans and receivables and other financial liabilities.
Loans and Receivables Loans and receivables are non-derivative financial assets with fixed or determinable payments that are not quoted in an active market. They are not entered into with the intention of immediate or short-term resale and are not classified as financial assets at FVPL, HTM investments or AFS financial assets. After initial measurement, loans and receivables are subsequently measured at amortized cost using the effective interest method, less impairment. The amortization is included as part of interest income in the consolidated statement of comprehensive income. Losses arising from impairment are recognized in the consolidated statement of comprehensive income. Loans and receivables are classified as current assets if maturity is within 12 months from balance sheet date. Otherwise, these are classified as noncurrent assets.
The Group’s loans and receivables consists of cash and cash equivalents, short-term investment, receivables and deposits (excluding rent deposits) as at December 31, 2014 and 2013 (see Notes4,5,9 and 10).
- 11 -
*SGVFS010389*
Other Financial Liabilities This category pertains to financial liabilities that are neither held-for-trading nor designated as at FVPL upon the inception of the liability. Other financial liabilities are subsequently carried at amortized cost, taking into account the impact of applying the effective interest rate method of amortization (or accretion) for any related premium, discount and any directly attributable transaction costs.
Other financial liabilities are classified as current liabilities if maturity is within the normal operating cycle of the Company and it does not have unconditional right to defer settlement of the liability for at least 12 months from balance sheet date. Otherwise, these are classified as noncurrent liabilities.
The Group’s other financial liabilities consist of bank loans, accounts payable and accrued expenses, other current liabilities (excluding statutory liabilities), and cumulative redeemable preferred shares as at December 31, 2014 and 2013 (see Notes11, 12, 13 and 15). Classification of Financial Instruments Between Liability and Equity A financial instrument is classified as liability if it provides for a contractual obligation to:
• deliver cash or another financial asset to another entity; or • exchange financial assets or financial liabilities with another entity under conditions that are
potentially unfavorable to the Group; or • satisfy the obligation other than by the exchange of a fixed amount of cash or another
financial asset for a fixed number of own equity shares.
If the Group does not have an unconditional right to avoid delivering cash or another financial asset to settle its contractual obligation, the obligation meets the definition of a financial liability. The components of issued financial instruments that contain both liability and equity elements are accounted for separately, with the equity component being assigned the residual amount after deducting from the instrument as a whole the amount separately determined as the fair value of the liability component on the date of issue.
Determination of Fair Value Fair value is the price that would be received to sell an asset or paid to transfer a liability in an orderly transaction between market participants at the measurement date. The fair value measurement is based on the presumption that the transaction to sell the asset or transfer the liability takes place either: • In the principal market for the asset or liability, or • In the absence of a principal market, in the most advantageous market for the asset or liability
The principal or the most advantageous market must be accessible to by the Group. The fair value of an asset or a liability is measured using the assumptions that market participants would use when pricing the asset or liability, assuming that market participants act in their economic best interest. A fair value measurement of a non-financial asset takes into account a market participant’s ability to generate economic benefits by using the asset in its highest and best use or by selling it to another market participant that would use the asset in its highest and best use.
- 12 -
*SGVFS010389*
All assets and liabilities for which fair value is measured or disclosed in the financial statements are categorized within the fair value hierarchy, described, as follows, based on lowest level of input that is significant to the fair value measurement as a whole: • Level 1 - quoted (unadjusted) prices in active markets for identical assets or liabilities • Level 2 - valuation techniques for which the lowest level input that is significant to the fair
value measurement is directly or indirectly observable • Level 3 - valuation techniques for which the lowest level input that is significant to the fair
value measurement is unobservable “Day1”Difference Where the transaction price in a non-active market is different from the fair value from other observable current market transactions in the same instrument or based on a valuation technique whose variables include only data from observable market, the Group recognizes the difference between the transaction price and fair value (a “Day 1”difference) in profit or loss unless it qualifies for recognition as some other type of asset. In cases where use is made of data which is not observable, the difference between the transaction price and model value is only recognized in profit or loss when the inputs become observable or when the instrument is derecognized. For each transaction, the Group determines the appropriate method of recognizing the “Day 1”difference.
Offsetting Financial Instruments Financial assets and financial liabilities are offset and the net amount is reported in the consolidated balance sheet if, and only if, there is a currently enforceable legal right to offset the recognized amounts and there is an intention to settle on a net basis, or to realize the asset and settle the liability simultaneously. Impairment of Financial Assets The Group assesses at each balance sheet date whether a financial asset or a group of financial assets is impaired.
Financial Assets Carried at Amortized Cost The Group first assesses whether objective evidence of impairment exists for financial assets that are individually significant and collectively for financial assets that are not individually significant. Objective evidence includes observable data that comes to the attention of the Group about loss events such as but not limited to significant financial difficulty of the counterparty, a breach of contract, such as a default or delinquency in interest or principal payments, probability that the borrower will enter bankruptcy or other financial reorganization. If it is determined that no objective evidence of impairment exists for an individually or collectively assessed financial asset, whether significant or not, the asset is included in the group of financial assets with similar credit risk characteristics and that group of financial assets is collectively assessed for impairment. Assets that are individually assessed for impairment and for which an impairment loss is or continue to be recognized are not included in a collective assessment of impairment. The impairment assessment is performed at each balance sheet date. For the purpose of a collective evaluation of impairment, financial assets are grouped on the basis of such credit risk characteristics such as customer type, payment history, past-due status and term. If there is objective evidence that an impairment loss on loans and receivables has been incurred, the amount of impairment loss is measured as the difference between the financial asset’s carrying amount and the present value of estimated future cash flows (excluding future expected credit losses that have not been incurred) discounted at the financial asset’s original effective interest rate (i.e., the effective interest rate computed at initial recognition). The carrying amount of the asset is reduced by the impairment loss, which is recognized in profit or loss.
- 13 -
*SGVFS010389*
Loans and receivables, together with the related allowance, are written off when there is no realistic prospect of future recovery and all collateral has been realized. If, in a subsequent period, the amount of the impairment loss decreases and the decrease can be related objectively to an event occurring after the impairment was recognized, the previously recognized impairment loss is reversed. Any subsequent reversal of an impairment loss is recognized in profit or loss, to the extent that the carrying value of the asset does not exceed its amortized cost at the reversal date. Derecognition of Financial Assets and Liabilities Financial Assets A financial asset (or, where applicable, a part of a financial asset or a part of a group of similar financial assets) is derecognized when:
• the right to receive cash flows from the asset has expired; • the Group retains the right to receive cash flows from the asset, but has assumed an obligation
to pay them in full without material delay to a third party under a pass-through arrangement; or
• the Group has transferred its right to receive cash flows from the asset and either (a) has transferred substantially all the risks and rewards of the asset, or (b) has neither transferred nor retained substantially all risks and rewards of the asset, but has transferred control of the asset.
Where the Group has transferred its rights to receive cash flows from an asset and has neither transferred nor retained substantially all the risks and rewards of the asset nor transferred control of the asset, the asset is recognized to the extent of the Group’s continuing involvement in the asset. Continuing involvement that takes the form of a guarantee over the transferred asset is measured at the lower of the original carrying amount of the asset and the maximum amount of consideration that the Group could be required to repay.
Financial Liabilities A financial liability is derecognized when the obligation under the liability is discharged, cancelled or has expired.
Where an existing financial liability is replaced by another from the same lender on substantially different terms, or the terms of an existing liability are substantially modified, such an exchange or modification is treated as a derecognition of the original liability and the recognition of a new liability, and the difference in the respective carrying amounts is recognized in profit or loss.
Inventories Inventories are stated at the lower of cost and net realizable value (NRV). Cost of inventories is determined using the first-in, first-out method. NRV is the selling price in the ordinary course of business, less the estimated cost of marketing and distribution.
Prepayments and Other Current Assets Prepayments and other current assets are primarily comprised of advances to suppliers, deferred input value-added tax (VAT), prepaid rent and prepaid store expenses. Prepayments and other current assets that are expected to be realized for no more than 12 months after the balance sheet date are classified as current assets; otherwise, these are classified as other noncurrent assets. These are recorded as assets and expensed when utilized or expired.
Advances to suppliers are downpayments for acquisitions of property and equipment not yet received. Once the property and equipment are received, the asset is recognized together with the corresponding liability. These are stated at cost less any impairment in value.
Property and Equipment Property and equipment, except for land, are carried at cost less accumulated depreciation and amortization, and any impairment in value.

- 14 -
*SGVFS010389*
The initial cost of property and equipment consists of its purchase price and any directly attributable costs of bringing the asset to its working condition and location for its intended use. Expenditures incurred after the assets have been put into operation, such as repairs and maintenance and overhaul costs, are recognized in profit or loss in the period in which the costs are incurred. In situations where it can be clearly demonstrated that the expenditures have resulted in an increase in the future economic benefits expected to be obtained from the use of an item of property and equipment beyond its originally assessed standard of performance, the expenditures are capitalized as an additional cost of the assets.
Construction in-progress includes cost of construction and other direct costs and is stated at cost less any impairment in value. Construction in-progress is not depreciated until such time the relevant assets are completed and put into operational use.
Depreciation and amortization commence once the assets are available for use. It ceases at the earlier of the date that it is classified as noncurrent asset held-for-sale and the date the asset is derecognized.
Depreciation is computed on a straight-line method over the estimated useful lives of the assets as follows:
Years Buildings and improvements 10 to 12 Store furniture and equipment 5 to 10 Office furniture and equipment 3 to 5 Transportation equipment 3 to 5 Computer equipment 3
Leasehold improvements are amortized over the estimated useful life of the improvements, ranging from five to ten years, or the term of the lease, whichever is shorter.
The assets’ estimated useful lives and depreciation and amortization method are reviewed periodically to ensure that the period and method of depreciation and amortization are consistent with the expected pattern of economic benefits from the items of property and equipment. When assets are retired or otherwise disposed of, the cost or revalued amount and the related accumulated depreciation and amortization and any impairment in value are removed from the accounts and any resulting gain or loss is recognized in profit or loss. The revaluation increment in equity relating to the revalued asset sold is transferred to retained earnings.
Fully depreciated assets are retained in the books until disposed.
Land is carried at revalued amount less any impairment in value. Revaluations shall be made with sufficient regularity to ensure that the carrying amount does not differ materially from that which would be determined using fair value at the end of the financial reporting period. When the fair value of a revalued land differs materially from its carrying amount, a further revaluation is required.
A revaluation surplus is recorded in OCI and credited to the “Revaluation increment on land - net of deferred income tax liability” account in equity. However, to the extent that the Group reverses a revaluation deficit of the same asset previously recognized in profit or loss, the increase is recognized in profit or loss. A revaluation deficit is recognized in the profit or loss, except to the extent that it offsets an existing surplus on the same asset recognized in “Revaluation increment on land -net of deferred income tax liability” account in equity.
Deposits Deposits are amounts paid as guarantee in relation to noncancelable lease agreements entered into by the Group. These deposits are recognized at cost and can be refunded or applied to future billings.

- 15 -
*SGVFS010389*
Intangible Assets Intangible assets acquired separately are measured on initial recognition at cost. Following initial recognition, intangible assets are carried at cost less accumulated amortization and any accumulated impairment loss, if any. Internally-generated intangible assets, if any, excluding capitalized development costs, are not capitalized and expenditure is reflected in profit or loss in which the expenditure is incurred.
The useful lives of intangible assets are assessed to be either finite or indefinite. Intangible assets with finite lives are amortized over the useful economic life and assessed for impairment whenever there is an indication that the intangible asset may be impaired. The amortization period and amortization method for an intangible asset with a finite useful life is reviewed at least at each balance sheet date. Changes in the expected useful life or the expected pattern of consumption of future economic benefits embodied in the asset is accounted for by changing the amortizationperiod or method, as appropriate, and treated as changes in accounting estimates. The amortization expense on intangible assets with finite lives is recognized in profit or loss in theexpense category consistent with the function of the intangible asset. Intangible assets with indefinite useful lives are tested for impairment annually at the CGU level and are not amortized. The useful life of an intangible asset with an indefinite life is reviewed annually to determine whether indefinite useful life assessment continues to be supportable. If not, the change in the useful life assessment from indefinite to finite is made on a prospective basis. Gains or losses arising from derecognition of an intangible asset are measured as the difference between the net disposal proceeds, if any, and the carrying amount of the asset and are recognized in profit or loss when the asset is derecognized.
Software and Program Cost Software and program cost, which are not specifically identifiable and integral to a specific computer hardware, are shown under “Goodwill and other noncurrent assets” in the consolidated balance sheet. These are carried at cost, less accumulated amortization and any impairment in value. Amortization is computed on a straight-line method over their estimated useful life of five years.
Goodwill Goodwill, included in “Goodwill and other noncurrent assets” account in the consolidated balance sheet, represents the excess of the cost of an acquisition over the fair value of the businesses acquired. Following initial recognition, goodwill is measured at cost less any accumulated impairment losses.
Impairment ofNon-financial Assets The Group assesses at each balance sheet date whether there is an indication that its non-financial assets such as property and equipment, rent deposits and intangible assets may be impaired. If any such indication exists, or when annual impairment testing for an asset is required, the Group makes an estimate of the asset’s recoverable amount. An asset’s recoverable amount is the higher of an asset’s or CGU’s fair value less costs to sell and its value-in-use and is determined for an individual asset, unless the asset does not generate cash inflows that are largely independent of those from other assets or groups of assets. For land, the asset’s recoverable amount is the higher of the land’s net selling price, which may be obtained from its sale in an arm’s-length transaction, and its value-in-use. For goodwill, the asset’s recoverable amount is its value-in-use. Where the carrying amount of an asset exceeds its recoverable amount, the asset is considered impaired and is written down to its recoverable amount. In assessing value-in-use, the estimated future cash flows are discounted to their present value, using a pre-tax discount rate that reflects current market assessments of the time value of money and risks specific to the asset. Impairment losses, if any, are recognized in profit or loss, except for revalued land when revaluation was taken to OCI. In this case, the impairment is also recognized in OCI up to the amount of any previous revaluation.

- 16 -
*SGVFS010389*
For non-financial assets, excluding goodwill, an assessment is made at each balance sheet date as to whether there is any indication that previously recognized impairment losses may no longer exist or may have decreased. If such indication exists, the recoverable amount is estimated. A previously recognized impairment loss is reversed only if there has been a change in the estimates used to determine the asset’s recoverable amount since the last impairment loss was recognized. If that is the case, the carrying amount of the asset is increased to its recoverable amount. That increased amount cannot exceed the carrying amount that would have been determined, net of depreciation and amortization, had no impairment loss been recognized for the asset in previous years. Such reversal is recognized in profit or loss, unless the asset is carried at revalued amount, in which case, the reversal is treated as a revaluation increase. After such reversal, the depreciation charge is adjusted in the future periods to allocate the asset’s revised carrying amount, less any residual value, on a systematic basis over its remaining useful life.
Goodwill is reviewed for impairment, annually or more frequently if event or changes in circumstances indicate that the carrying value may be impaired. Impairment is determined for goodwill by assessing the recoverable amount of the CGU or group of CGUs to which the goodwill relates. Where the recoverable amount of the CGU or group of CGUs is less than the carrying amount of the CGU or group of CGUs to which goodwill has been allocated, an impairment loss is recognized. Impairment losses relating to goodwill cannot be reversed in future periods.
Deposits Payable Deposits payable are amounts received from franchisees, store operators and sublessees as guarantee in relation to various agreements entered into by the Group. These deposits are recognized at cost and payable or applied to future billings.
Cumulative Redeemable Preferred Shares Cumulative redeemable preferred shares that exhibit characteristics of a liability is recognized as a financial liability in the consolidated balance sheet, net of transaction cost. The corresponding dividends on those shares are charged as interest expense in profit or loss.
Deferred Revenue Deferred revenue is recognized for cash received for income not yet earned. Deferred revenue is recognized as revenue over the life of the revenue contract or upon delivery of goods or services.
Equity Common Stock Common stock is measured at par value for all shares issued and outstanding.
Additional Paid-in Capital When the shares are sold at premium, the difference between the proceeds and the par value is credited to the “Additional paid-in capital” account. When shares are issued for a consideration other than cash, the proceeds are measured by the fair value of the consideration received. In casethe shares are issued to extinguish or settle the liability of the Group, the shares shall be measured either at the fair value of the shares issued or fair value of the liability settled, whichever is more reliably determinable.
Retained Earnings Retained earnings represent the cumulative balance of periodic net income or loss and changes in accounting policy. When the retained earnings account has a debit balance, it is called “deficit.” A deficit is not an asset but a deduction from equity.
Stock Dividends Stock dividends are distribution of the earnings in the form of own shares. When stock dividends are declared, the amount of stock dividends is transferred from retained earnings to capital stock.

- 17 -
*SGVFS010389*
Treasury Stock Treasury stock is stated at acquisition cost and is deducted from equity. No gain or loss is recognized in profit or loss on the purchase, sale, issuance or cancellation of the Group’s own equity instruments. OCI OCI comprises of items of income and expenses that are not recognized in profit or loss as required or permitted by other PFRS. The Group’s OCI pertains to actuarial gains and losses from pension benefits and revaluation increment on land which are recognized in full in the period in which they occur.
Revenue Recognition Revenue is recognized to the extent that it is probable that the economic benefits will flow to the Group and the amount of revenue can be measured reliably. The Group has assessed its revenue arrangements against the criteria enumerated under PAS 18, Revenue Recognition, and concluded that it is acting as principal in all arrangements, except for its sale of consigned goods. The following specific recognition criteria must also be met before revenue is recognized:
Merchandise Sales Revenue from merchandise sales is recognized when the significant risks and rewards of ownership of the goods have passed to the buyer. Revenue is measured at the fair value of the consideration received, excluding discounts, returns, rebates and sales taxes.
The Group operates a customer loyalty programme, Every Day! Rewards, which allows customers to accumulate points when they purchase products in the stores. The points can be redeemed for free products, subject to a minimum number of points being obtained.
Consideration received is allocated between the products sold and the points issued, with the consideration allocated to the points equal to their fair value. Fair value of the points is equal to the retail value of the products that can be redeemed multiplied by the redemption rate. The fair value of the points issued is deferred (included as part of “Other current liabilities” account in the consolidated balance sheet) and recognized as revenue when the points are redeemed.
Franchise Franchise fee is recognized upon execution of the franchise agreement and performance of initial services required under the franchise agreement. Franchise revenue is recognized in the period earned.
Marketing Marketing income is recognized when service is rendered. In case of marketing support funds, revenue is recognized upon start of promotional activity for the suppliers.
Rental Rental income is accounted for on a straight-line basis over the term of the lease.
Commission Commission income is recognized upon the sale of consigned goods.
Interest Interest income is recognized as it accrues based on the effective interest rate method.
Other Income Other income is recognized when there are incidental economic benefits, other than the usual business operations, that will flow to the Group and can be measured reliably.
- 18 -
*SGVFS010389*
Costs and Expenses Recognition Costs of merchandise sold are recognized in profit or loss at the point of sale. Expenses are recognized in profit or loss upon utilization of the services or when they are incurred.
Retirement Benefits The net defined benefit liability or asset is the aggregate of the present value of the defined benefit obligation at the end of the financial reporting period reduced by the fair value of plan assets (if any), adjusted for any effect of limiting a net defined benefit asset to the asset ceiling. The asset ceiling is the present value of any economic benefits available in the form of refunds from the plan or reductions in future contributions to the plan.
The cost of providing benefits under the defined benefit plans is actuarially determined using the projected unit credit method.
Net retirement benefits cost comprises the following: • Service cost • Net interest on the net defined benefit liability or asset • Remeasurements of net defined benefit liability or asset
Service costs which include current service costs, past service costs and gains or losses on non-routine settlements are recognized as expense in profit or loss. Past service costs are recognized when plan amendment or curtailment occurs. These amounts are calculated periodically by independent qualified actuaries.
Net interest on the net defined benefit liability or asset is the change during the period in the net defined benefit liability or asset that arises from the passage of time which is determined by applying the discount rate based on government bonds to the net defined benefit liability or asset. Net interest on the net defined benefit liability or asset is recognized as expense or income in profit or loss.
Remeasurements comprising actuarial gains and losses, return on plan assets and any change in the effect of the asset ceiling (excluding net interest on defined benefit liability) are recognized immediately in OCI in the period in which they arise. Remeasurements are not reclassified to profit or loss in subsequent periods.
Plan assets are assets that are held by a long-term employee benefit fund or qualifying insurance policies. Plan assets are not available to the creditors of the Group, nor can they be paid directly to the Group. Fair value of plan assets is based on market price information. When no market price is available, the fair value of plan assets is estimated by discounting expected future cash flows using a discount rate that reflects both the risk associated with the plan assets and the maturity or expected disposal date of those assets (or, if they have no maturity, the expected period until the settlement of the related obligations). If the fair value of the plan assets is higher than the present value of the defined benefit obligation, the measurement of the resulting defined benefit asset is limited to the present value of economic benefits available in the form of refunds from the plan or reductions in future contributions to the plan.The Group’s right to be reimbursed of some or all of the expenditure required to settle a defined benefit obligation is recognized as a separate asset at fair value when and only when reimbursement is virtually certain.
Termination Benefit Termination benefits are employee benefits provided in exchange for the termination of an employee’s employment as a result of either an entity’s decision to terminate an employee’s employment before the normal retirement date or an employee’s decision to accept an offer of benefits in exchange for the termination of employment.
A liability and expense for a termination benefit is recognized at the earlier of when the entity can no longer withdraw the offer of those benefits and when the entity recognizes related restructuring

- 19 -
*SGVFS010389*
costs. Initial recognition and subsequent changes to termination benefits are measured in accordance with the nature of the employee benefit, as either post-employment benefits, short-term employee benefits, or other long-term employee benefits.
Employee Leave Entitlement
Employee entitlements to annual leave are recognized as a liability when they are accrued to the employees. The undiscounted liability for leave expected to be settled wholly before twelve months after the end of the annual reporting period is recognized for services rendered by employees up to the end of the reporting period.
Leases Finance leases, which transfer to the lessee substantially all the risks and rewards of ownership of the asset, are capitalized at the inception of the lease at the fair value of the leased property or, if lower, at the present value of the minimum lease payments. Lease payments are apportioned between the interest income and reduction of the lease receivable so as to achieve a constant rate of interest on the remaining balance of the receivable. Interest income is recognized directly in profit or loss.
Leases where the lessor retains substantially all the risks and rewards of ownership of the asset are classified as operating leases. Operating leases are recognized as an expense in profit or loss on a straight-line basis over the lease term.
The determination of whether an arrangement is, or contains a lease is based on the substance of the arrangement and requires an assessment of whether the fulfillment of the arrangement is dependent on the use of a specific asset or assets and the arrangement conveys a right to use the asset. A reassessment is made after inception of the lease only if one of the following applies: a. there is a change in contractual terms, other than a renewal or extension of the arrangement; or b. a renewal option is exercised or extension is granted, unless the term of the renewal or
extension was initially included in the lease term; or c. there is a change in the determination of whether fulfillment is dependent on a specified asset;
or d. there is a substantial change to the asset. Where a reassessment is made, lease accounting shall commence or cease from the date when the change in circumstance gave rise to the reassessment for scenarios (a), (c) or (d) above, and the date of renewal or extension for scenario (b). Borrowing Costs Borrowing costs directly attributable to the acquisition, construction or production of an asset that necessarily takes a substantial period of time to get ready for its intended use or sale are capitalized as part of the cost of the respective assets. All other borrowing costs are expensed in the period they occur. Borrowing costs consist of interest and other costs that an entity incurs in connection with the borrowing of funds.
Foreign Currency-denominated Transactions The consolidated financial statements are presented in Philippine Peso, which is the Parent Company’s functional and presentation currency. All subsidiaries evaluate their primary economic and operating environment and determine their functional currency. Transactions in foreign currency are initially recorded at the exchange rate at the date of transaction. Outstanding foreign currency-denominated monetary assets and liabilities are translated using the applicable exchange rate at balance sheet date. Exchange differences arising from translation of foreign currency monetary items at rates different from those at which they were originally recorded are recognized in profit or loss.

- 20 -
*SGVFS010389*
Taxes Current Income Tax Current income tax assets and liabilities for the current and prior periods are measured at the amount expected to be recovered from or paid to the taxation authorities. The tax rates and tax laws used to compute the amount are those that have been enacted or substantively enacted at the balance sheet date.
Deferred Income Tax Deferred income tax is recognized for all temporary differences at the balance sheet date between the tax bases of assets and liabilities and their carrying amounts for financial reporting purposes.
Deferred income tax liabilities are recognized for all taxable temporary differences. Deferred income tax assets are recognized for all deductible temporary differences to the extent that it is probable that sufficient future taxable profits will be available against which the deductible temporary differences can be utilized.
Deferred income tax relating to items recognized outside profit or loss is recognized outside profit or loss. Deferred income tax items are recognized in correlation to the underlying transaction either in OCI or directly in equity.
The carrying amount of deferred income tax assets is reviewed at each balance sheet date and reduced to the extent that it is no longer probable that sufficient future taxable profits will be available to allow all or part of the deferred income tax assets to be utilized. Unrecognizeddeferred income tax assets are reassessed at each balance sheet date and are recognized to the extent that it has become probable that sufficient future taxable profits will allow the deferred income tax assets to be recovered.
Deferred income tax assets and liabilities are measured at the tax rates that are expected to apply to the period when the asset is realized or the liability is settled, based on tax rates and tax laws that have been enacted or substantively enacted at the balance sheet date.
Deferred income tax assets and liabilities are offset, if a legally enforceable right exists to set off currenttax assets against currenttax liabilities and the deferred income taxes relate to the same taxable entity and the same taxation authority.
VAT Input VAT is the 12% indirect tax paid by the Group in the course of the Group’s trade or business on local purchase of goods or services, including lease or use of property, from a VAT-registered entity. For acquisition of capital goods over P=1,000,000, the related input taxes are deferred and amortized over the useful life of the asset or 60 months, whichever is shorter, commencing on the date of acquisition. Deferred input VAT which is expected to be utilized for more than 12 months after the balance sheet date is included under “Goodwill and other noncurrent assets” account in the consolidated balance sheet.
Output VAT pertains to the 12% tax due on the sale of merchandise and lease or exchange of taxable goods or properties or services by the Group.
If at the end of any taxable month the output VAT exceeds the input VAT, the excess shall be paid by the Group. Any outstanding balance is included under “Other current liabilities” account in the consolidated balance sheet. If the input VAT exceeds the output VAT, the excess shall be carried over to the succeeding month or months. Excess input VAT is included under “Prepayments and other current assets” account in the consolidated balance sheet. Input VAT on capital goods may, at the option of the Group, be refunded or credited against other internal revenue taxes, subject to certain tax laws.
- 21 -
*SGVFS010389*
Revenue, expenses and assets are recognized net of the amount of VAT.
Earnings Per Share Basic earnings per share is calculated by dividing the net income or for the year attributable to common shareholders by the weighted average number of shares outstanding during the year, excluding treasury shares.
Diluted earnings per share is calculated by dividing the net income for the year attributable to common shareholders by the weighted average number of shares outstanding during the year, excluding treasury shares and adjusted for the effects of all potential dilutive common shares, if any.
In determining both the basic and diluted earnings per share, the effect of stock dividends, if any, is accounted for retrospectively.
Segment Reporting Operating segments are components of an entity for which separate financial information is available and evaluated regularly by management in deciding how to allocate resources and assessing performance. The Group considers the store operation as its primary activity and its only business segment. Franchising, renting of properties and commissioning on bills payment services are considered an integral part of the store operations.
Provisions Provisions are recognized when: (a) the Group has a present obligation (legal or constructive) as a result of a past event; (b) it is probable that an outflow of resources embodying economic benefits will be required to settle the obligation; and (c) a reliable estimate can be made of the amount of the obligation. If the effect of the time value of money is material, provisions are determined by discounting the expected future cash flows at a pre-tax rate that reflects current market assessments of the time value of money and, where appropriate, the risks specific to the liability. Where discounting is used, the increase in the provision due to the passage of time is recognized as interest expense. When the Group expects a provision or loss to be reimbursed, the reimbursement is recognized as a separate asset only when the reimbursement is virtually certain and its amount is estimable. The expense relating to any provision is presented in profit or loss, net of any reimbursement.
Contingencies Contingent liabilities are not recognized in the consolidated financial statements. They are disclosed unless the possibility of an outflow of resources embodying economic benefits is remote. Contingent assets are not recognized in the consolidated financial statements but disclosed when an inflow of economic benefit is probable. Contingent assets are assessed continually to ensure that developments are appropriately reflected in the consolidated financial statements. If it has become virtually certain that an inflow of economic benefits will arise, the asset and the related income are recognized in the consolidated financial statements.
Events after the Balance Sheet Date Post year-end events that provide additional information about the Group’s position at the balance sheet date (adjusting events) are reflected in the consolidated financial statements. Post year-end events that are non-adjusting events are disclosed in the notes to the consolidated financial statements when material.

- 22 -
*SGVFS010389*
3. Use of Significant Accounting Judgments, Estimates and Assumptions
The preparation of the consolidated financial statements in accordance with PFRS requires management to make judgments, estimates and assumptions that affect the amounts reported in the consolidated financial statements and notes. The judgments, estimates and assumptions used in the consolidated financial statements are based upon management’s evaluation of relevant facts and circumstances as at balance sheet date. Future events may occur which can cause the assumptions used in arriving at those judgments, estimates and assumptions to change. The effects of any changes will be reflected in the consolidated financial statements of the Group as they become reasonably determinable.
Judgments In the process of applying the Group’s accounting policies, management has made the following judgments, apart from those involving estimations, which have the most significant effect on amounts recognized in the consolidated financial statements:
Determination of Functional Currency Based on the economic substance of the underlying circumstances relevant to the Group, the functional currency of the Group has been determined to be the Philippine Peso. The Philippine Peso is the currency of the primary economic environment in which the Group operates. It is the currency that mainly influences the revenue, costs and expenses of the Group.
Classification of Financial Instruments The Group classifies a financial instrument, or its components, on initial recognition as a financial asset, liability or equity instrument in accordance with the substance of the contractual arrangement and the definitions of a financial asset, liability or equity instrument. The substance of a financial instrument, rather than its legal form, governs its classification in the consolidated balance sheet.
Financial assets are classified as financial assets at FVPL, HTM investments, AFS financial assets and loans and receivables. Financial liabilities, on the other hand, are classified as financial liabilities at FVPL and other financial liabilities.
The Group classifies the cumulative redeemable preferred shares as liability in accordance with the redemption features contained in the shareholders agreement (see Note 15). The cumulative redeemable preferred shares are redeemable at the option of the holder.
The Group determines the classification at initial recognition and, where allowed and appropriate, re-evaluates this classification at every balance sheet date.
The Group’s financial instruments consist of loans and receivables and other financial liabilities (see Note 29).
Classification of Leases a. Finance lease as lessor
The Group entered into a sale and leaseback transaction with an armored car service provider where it has determined that the risks and rewards related to the armored vehicles leased out will be transferred to the lessee at the end of the lease term. As such, the lease agreement was accounted for as a finance lease (see Note 26).
b. Operating lease as lessee The Group entered into various property leases, where it has determined that the risks and rewards related to the properties are retained with the lessors. As such, the lease agreements were accounted for as operating leases (see Note 26).

- 23 -
*SGVFS010389*
c. Operating lease as lessor The Company entered into property subleases on its leased properties. The Company determined that it retains all the significant risks and rewards of these properties which are leased out on operating leases (see Note 26).
Estimates The key assumptions concerning the future and other key sources of estimation uncertainty at the balance sheet date that have a significant risk of causing a material adjustment to the carrying amounts of assets and liabilities follow:
Determination of Fair Values The fair value for financial instruments traded in active markets at the balance sheet date is based on their quoted market price or dealer price quotations (bid price for long positions and ask price for short positions), without any deduction for transaction costs. When current bid and ask prices are not available, the price of the most recent transaction provides evidence of the current fair value as long as there has not been a significant change in economic circumstances since the time of the transaction.
For all other financial instruments not listed in an active market, the fair value is determined by using appropriate valuation techniques. Valuation techniques include net present value techniques, comparison to similar instruments for which observable market prices exist, options pricing models, and other relevant valuation models.
Note 29 presents the fair values of the financial instruments and the methods and assumptions used in estimating their fair values.
Impairment of Loans and Receivables The Group reviews its loans and receivables at each balance sheet date to assess whether a provision for impairment should be recognized in profit or loss or loans and receivables balance should be written off. In particular, judgment by management is required in the estimation of the amount and timing of future cash flows when determining the level of allowance required. Such estimates are based on assumptions about a number of factors and actual results may differ, resulting in future changes to the allowance. Moreover, management evaluates the presence of objective evidence of impairment which includes observable data that comes to the attention of the Group about loss events such as but not limited to significant financial difficulty of the counterparty, a breach of contract, such as a default or delinquency in interest or principal payments, probability that the borrower will enter bankruptcy or other financial re-organization.
In addition to specific allowances against individually significant loans and receivables, the Group also makes a collective impairment allowance against exposures which, although not specifically identified as requiring a specific allowance, have a greater risk of default than when originally granted. This takes into consideration the credit risk characteristics such as customer type, payment history, past due status and term.
The carrying value of loans and receivables amounted to P=2,026,522,005 and P=1,579,848,392as at December 31, 2014 and 2013, respectively (see Notes 4, 5, 9, 10 and 30). Allowance for impairment on loans and receivables amounted to P=18,960,182as at December 31, 2014 and 2013 (see Note 5). Provision for impairment amounted to nil, P=12,671,486 and P=788,778in 2014, 2013 and2012, respectively (see Note19).
Decline in Inventory Value Provisions are made for inventories whose NRV are lower than their carrying cost. This entails determination of replacement costs and costs necessary to make the sale. The estimates are based on a number of factors, such as but not limited to the age, status and recoverability of inventories.

- 24 -
*SGVFS010389*
The carrying value of inventories amounted to P=1,165,094,076 and P=900,849,891as at December 31, 2014 and 2013, respectively (see Note 6). No provisions for decline in inventory value were recognized in 2014, 2013 and 2012.
Impairment of Non-financial Assets Other than Goodwill The Group assesses whether there are any indicators of impairment for all non-financial assets, other than goodwill, at each balance sheet date. These non-financial assets (property and equipment, rent deposits, and software and program cost) are tested for impairment when there are indicators that the carrying amounts may not be recoverable.
The factors that the Group considers important which could trigger an impairment review include the following:
• significant underperformance relative to expected historical or projected future operating results;
• significant changes in the manner of use of the acquired assets or the strategy for overall business;
• significant negative industry or economic trends; and • decline in appraised value.
As at December 31, 2014 and 2013, the Group has not identified any indicators or circumstances that would indicate that the Group’s property and equipment, rent deposits and software and program cost are impaired. Thus, no impairment losses on these non-financial assets were recognized for the years ended December 31, 2014, 2013 and 2012. The carrying values of these non-financial assets are as follows:
2014 2013
Property and equipment (Note 8) P=3,558,089,998 P=2,746,672,621
Rent deposits (Note 9) 324,638,850 232,020,464
Software and program cost (Note 10) 3,477,680 2,886,285
Estimation of Useful Lives of Property and Equipment and Software and Program Cost The Group estimates the useful lives of its property and equipment and software and program cost based on a period over which the assets are expected to be available for use and on collective assessment of industry practices, internal evaluation and experience with similar arrangement. The estimated useful lives of property and equipment and software and program cost are revisited at the end of each financial reporting period and updated if expectations differ materially from previous estimates.
Property and equipment, net of accumulated depreciation and amortization, amounted to P=3,558,089,998 and P=2,746,672,621as at December 31, 2014 and 2013, respectively (see Note 8). The carrying amount of software and program cost amounted to P=3,477,680 and P=2,886,285 at December 31, 2014 and 2013, respectively (see Note10).
Revaluation of Land The Group’s parcels of land are carried at revalued amounts, which approximate its fair values at the date of the revaluation, less any subsequent accumulated impairment losses. The valuations of land are performed by independent appraisers. Revaluations are made every three to five years or more frequently as necessary, to ensure that the carrying amounts do not differ materially from those which would be determined using fair values at balance sheet date.
The last appraisal made on the Group’s parcels of land was in June 2014, where it resulted to an additional appraisal increase of P=15,289,400, net of P=6,552,600deferred income tax liability. The

- 25 -
*SGVFS010389*
carrying amount of land amounted to P=66,323,000 and P=44,481,000as at December 31, 2014 and 2013, respectively.
Impairment of Goodwill The Group determines whether goodwill is impaired at least on an annual basis. This requires an estimation of the value-in-use of the CGUs to which the goodwill is allocated. Estimating the value-in-use amount requires management to make an estimate of the expected future cash flows from the CGUs and also to choose a suitable discount rate in order to calculate the present value of those cash flows.
Based on the assessment made by the Group, there is no impairment of goodwill as the recoverable amount of the CGUs exceeds the carrying amount of the unit, including goodwill as at December 31, 2014 and 2013.The carrying value of goodwill amounted to P=65,567,524 as at December 31, 2014 and 2013 (see Note 10). No impairment losses were recognized in 2014, 2013 and 2012.
Estimation of Retirement Benefits The net retirement benefits cost and the present value of retirement obligations are determined using actuarial valuations. The actuarial valuation involves making various assumptions. These include the determination of the discount rates, future salary increases, mortality rates and future pension increases. Due to the complexity of the valuation, the underlying assumptions and its long-term nature, defined benefit obligations are highly sensitive to changes in these assumptions. All assumptions are reviewed at each financial reporting date.
In determining the appropriate discount rate, management considers the interest rates of government bonds that are denominated in the currency in which the benefits will be paid, with extrapolated maturities corresponding to the expected duration of the defined benefit obligation.
The mortality rate is based on publicly available mortality tables for the specific country. Future salary increases and pension increases are based on expected future inflation rates for the specific country.
The Group’s net retirement obligations amounted to P=100,404,074 and P=96,481,142as at December 31, 2014 and 2013, respectively (see Note 24). Retirement benefits cost amounted to P=19,867,370, P=16,858,692 andP=15,420,495in 2014, 2013 and 2012, respectively (see Notes 23 and 24).
Provisions and Contingencies The Group has pending legal cases. The Group’s estimate of the probable costs for the resolution of these legal cases has been developed in consultation with in-house and outside legal counsels and is based upon the analysis of the potential outcomes. It is possible, however, that future results of operations could be affected by changes in the estimates or in the effectiveness of strategies relating to these proceedings.
As at December 31, 2014 and 2013, the Group has provisions amounting to P=8,718,853 and P=13,420,068, respectively and is reported as part of “Others” under “Accounts payable and accrued expenses” in the consolidated balance sheets (see Note 12). Provisions and contingencies are further explained in Note 34.
Realizability of Deferred Income Tax Assets Deferred income tax assets are recognized for all temporary deductible differences to the extent that it is probable that sufficient future taxable profits will be available against which the deductible temporary differences can be utilized. Management has determined based on business forecast of succeeding years that there is enough taxable profits against which the recognized deferred income tax assets will be realized.

- 26 -
*SGVFS010389*
The Group’s recognized deferred income tax assets amounted to P=95,008,691 and P=69,131,632as at December 31, 2014 and 2013, respectively (see Note 27).
4. Cash and Cash Equivalents and Short-Term Investment
2014 2013 Cash on hand and in banks P=1,241,685,743 P=922,422,571 Cash equivalents – 50,580,062 P=1,241,685,743 P=973,002,633
Cash in banks earn interest at the respective bank deposit rates. Cash equivalents are made for varying periods up to three months depending on the immediate cash requirements of the Group and earn interest at the respective cash equivalent rates.
As at December 31, 2014 and 2013, short-term investment amounting to P=10,884,130 and P=10,810,229, respectively, pertains to time deposit which has a maturity date of more than 90 days.
Interest income from savings and deposits accounts and short-term investment amounted to P=2,545,822, P=4,298,717and P=2,749,430in 2014, 2013 and 2012, respectively (see Note 22).
5. Receivables
2014 2013 Franchisees (Note 32) P=403,074,403 P=397,720,727 Suppliers 159,162,156 48,657,689 Employees 17,206,304 14,936,783 Store operators 12,048,431 12,547,006 Rent 5,363,909 4,760,464 Due from PhilSeven Foundation, Inc. (PFI)
(Note 25) 3,525,452 3,118,978 Current portion of lease receivable - net of unearned
interest income amounting to P=5,773 and P=96,445 as at December 31, 2014 and 2013, respectively (Notes 10 and 26) 3,742,000 3,086,114
Notes receivable 990,917 1,033,914 Insurance receivable 1,155,417 585,057 Others 2,078,334 1,358,499 608,347,323 487,805,231 Less allowance for impairment 18,960,182 18,960,182 P=589,387,141 P=468,845,049
The classes of receivables of the Group are as follows:
• Franchisees - pertains to receivables for the inventory loans obtained by the franchisees at the start of their store operations, cash deposits and deposits still in transit, negative balance on franchisees’ holding account and inventory variation noted during monthly store audits.
• Suppliers - pertains to receivables from the Group’s suppliers for display allowances, annual volume discount and commission income from different service providers.
• Employees - includes car loans, salary loans and cash shortages from stores which are charged to employees. Interest earned on receivable from employees amounted toP=13,660, P=17,037 and nil in 2014, 2013 and 2012, respectively (see Note 22).
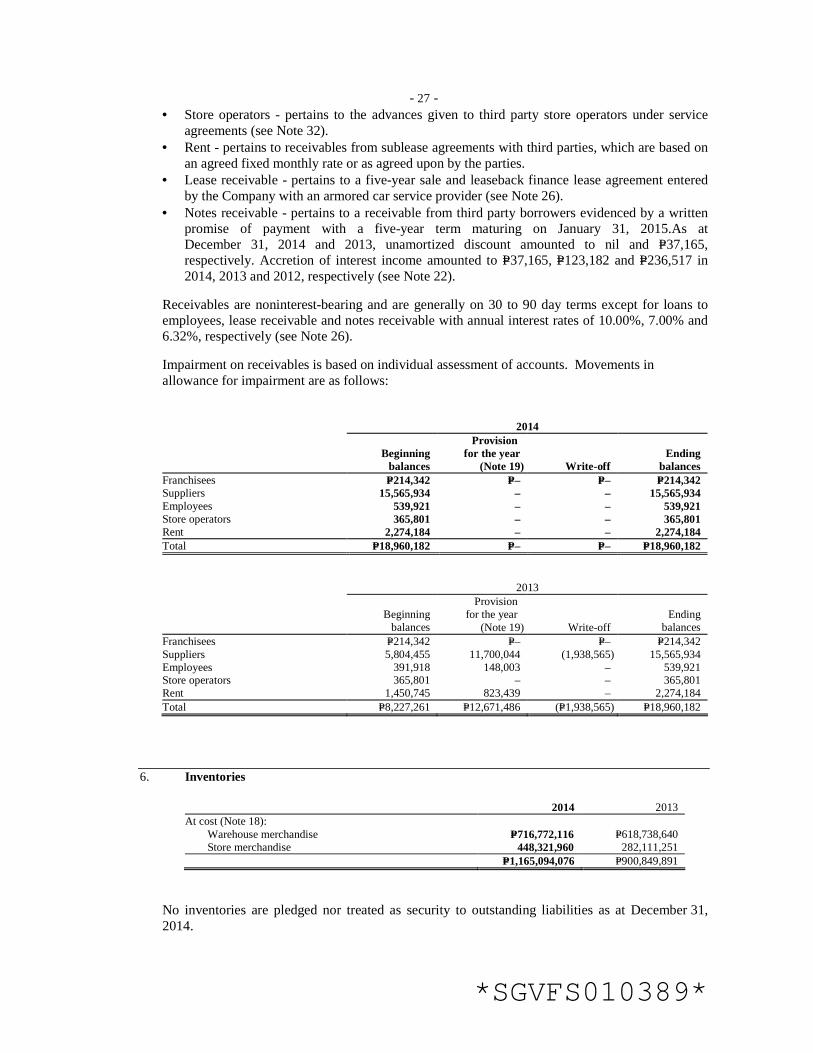
- 27 -
*SGVFS010389*
• Store operators - pertains to the advances given to third party store operators under service agreements (see Note 32).
• Rent - pertains to receivables from sublease agreements with third parties, which are based on an agreed fixed monthly rate or as agreed upon by the parties.
• Lease receivable - pertains to a five-year sale and leaseback finance lease agreement entered by the Company with an armored car service provider (see Note 26).
• Notes receivable - pertains to a receivable from third party borrowers evidenced by a written promise of payment with a five-year term maturing on January 31, 2015.As at December 31, 2014 and 2013, unamortized discount amounted to nil and P=37,165, respectively. Accretion of interest income amounted to P=37,165, P=123,182 and P=236,517 in 2014, 2013 and 2012, respectively (see Note 22).
Receivables are noninterest-bearing and are generally on 30 to 90 day terms except for loans to employees, lease receivable and notes receivable with annual interest rates of 10.00%, 7.00% and 6.32%, respectively (see Note 26). Impairment on receivables is based on individual assessment of accounts. Movements in allowance for impairment are as follows: 2014
Beginning
balances
Provision for the year
(Note 19) Write-off Ending
balances Franchisees P=214,342 P=– P=– P=214,342 Suppliers 15,565,934 – – 15,565,934 Employees 539,921 – – 539,921 Store operators 365,801 – – 365,801 Rent 2,274,184 – – 2,274,184 Total P=18,960,182 P=– P=– P=18,960,182
2013
Beginning
balances
Provision for the year
(Note 19) Write-off Ending
balances Franchisees P=214,342 P=– P=– P=214,342 Suppliers 5,804,455 11,700,044 (1,938,565) 15,565,934 Employees 391,918 148,003 – 539,921 Store operators 365,801 – – 365,801 Rent 1,450,745 823,439 – 2,274,184 Total P=8,227,261 P=12,671,486 (P=1,938,565) P=18,960,182
6. Inventories
2014 2013 At cost (Note 18): Warehouse merchandise P=716,772,116 P=618,738,640 Store merchandise 448,321,960 282,111,251 P=1,165,094,076 P=900,849,891
No inventories are pledged nor treated as security to outstanding liabilities as at December 31, 2014.

- 28 -
*SGVFS010389*
7. Prepayments and Other Current Assets
2014 2013 Current portion of: Deferred input VAT P=99,572,933 P=78,364,535 Deferred lease (Notes 10 and 26) 3,554,358 1,421,460 Prepaid: Rent (Note 10) 133,107,466 63,373,604 Store expenses 33,469,093 34,455,780 Taxes 7,548,088 4,765,253 Uniform 1,531,177 6,066,259 Repairs and maintenance 46,294 1,218,655 Advances to suppliers P=33,409,032 P=55,761,777 Advances for expenses 25,820,535 13,788,613 Supplies 5,810,873 3,528,830 Dues and subscription 706,584 571,651 Others 13,820,097 7,432,281 P=358,396,530 P=270,748,698
Deferred input VAT pertains to the input VAT on the acquisition of capital goods over P=1,000,000 which are being amortized over the useful life or 60 months, whichever is shorter, commencing on the date of acquisition.
8. Property and Equipment
Movements in property and equipment are as follows: 2014 At Cost Land- Store Office at Revalued Buildings and Furniture and Furniture and Transportation Computer Leasehold Construction Amount Improvements Equipment Equipment Equipment Equipment Improvements In-Progress Total Cost/Revalued Amount Beginning balances P=44,481,000 P=118,154,849 P=2,200,106,026 P=763,055,302 P=45,130,103 P=244,985,364 P=1,421,900,034 P=95,198,923 P=4,933,011,601 Additions – 9,397,840 746,231,018 265,953,317 10,688,290 66,548,549 222,127,663 332,626,429 1,653,573,106 Retirements – – (48,699,654) (72,902,381) (3,470,814) (13,346,315) (144,419,280) – (282,838,444)Reclassifications – 28,773,655 – – – – 213,928,133 (242,701,788) – Revaluation increment 21,842,000 – – – – – – – 21,842,000 Ending balances 66,323,000 156,326,344 2,897,637,390 956,106,238 52,347,579 298,187,598 1,713,536,550 185,123,564 6,325,588,263 Accumulated Depreciation
and Amortization Beginning balances – 74,124,862 978,021,331 358,827,296 19,367,872 165,369,417 590,628,202 – 2,186,338,980 Depreciation and amortization
(Note 19) – 4,058,141 449,334,458 150,730,603 10,103,916 35,087,298 213,445,093 – 862,759,509 Retirements – – (48,699,654) (72,771,021) (2,363,954) (13,346,315) (144,419,280) – (281,600,224)Reclassifications – 2,041,196 – – – – (2,041,196) – – Ending balances – 80,224,199 1,378,656,135 436,786,878 27,107,834 187,110,400 657,612,819 – 2,767,498,265 Net Book Values P=66,323,000 P=76,102,145 P=1,518,981,255 P=519,319,360 P=25,239,745 P=111,077,198 P=1,055,923,731 P=185,123,564P=3,558,089,998
2013 At Cost Land- Store Office at revalued Buildings and Furniture and Furniture and Transportation Computer Leasehold Construction Amount Improvements Equipment Equipment Equipment Equipment Improvements In-Progress Total Cost/Revalued Amount Beginning balances P=44,481,000 P=118,154,849 P=1,740,413,143 P=57,9371,098 P=43,646,176 P=211,556,349 P=1,201,609,870 P=67,369,298 P=4,006,601,783Additions – – 525,981,492 207,878,659 10,587,673 33,864,213 205,469,305 195,489,191 1,179,270,533Retirements – – (66,288,609) (24,194,455) (9,103,746) (435,198) (152,838,707) – (252,860,715)Reclassifications – – – – – – 167,659,566 (167,659,566) –Ending balances 44,481,000 118,154,849 2,200,106,026 763,055,302 45,130,103 244,985,364 1,421,900,034 95,198,923 4,933,011,601Accumulated Depreciation
and Amortization Beginning balances – 70,181,591 677,113,640 270,477,867 20,199,135 134,639,263 557,069,243 – 1,729,680,739Depreciation and amortization
(Note 19) – 3,943,271 367,196,300 112,543,884 8,272,483 31,165,352 186,397,669 – 709,518,959Retirements – – (66,288,609) (24,194,455) (9,103,746) (435,198) (152,838,710) – (252,860,718)Ending balances – 74,124,862 978,021,331 358,827,296 19,367,872 165,369,417 590,628,202 – 2,186,338,980Net Book Values P=44,481,000 P=44,029,987 P=1,222,084,695 P=404,228,006 P=25,762,231 P=79,615,947 P=831,271,832 P=95,198,923 P=2,746,672,621

- 29 -
*SGVFS010389*
Construction in-progress pertains to costs of constructing new stores and renovation of old stores. Completion of construction and renovation is expected within three months to one year from construction date. The costs of constructed stores are accumulated until such time the relevant assets are completed and put into operational use. In June 2014, the Group revalued its land with cost amounting to P=39,866,864 at appraised value of P=66,323,000, as determined by a professionally qualified independent appraiser. The additional appraisal increase of P=15,289,400, net of P=6,552,600 deferred income tax liability (see Note 27), resulting from the revaluation was credited to “Revaluation increment on land - net of deferred income tax liability” account under equity section of the consolidated balance sheets. The appraised value was determined using the market data approach, wherein the value of the land is based on sales and listings of comparable properties registered within the vicinity. Land is categorized under level 3 in the fair value hierarchy.
The cost of fully depreciated property and equipment that are still being used in operations amounted to P=642,631,189 and P=428,587,084 as at December 31, 2014 and 2013, respectively. No property and equipment are pledged nor treated as security for the outstanding liabilities as at December 31, 2014 and 2013.
9. Deposits
2014 2013
Rent P=324,638,850 P=232,020,464 Refundable (Notes 29 and 30) 75,964,346 34,871,384 Utilities (Notes 29 and 30) 53,374,427 42,509,396 Others (Notes 29 and 30) 6,551,174 4,487,223 P=460,528,797 P=313,888,467
Refundable Refundable deposits on rent are computed at amortized cost as follows:
2014 2013 Face value of security deposits P=52,776,018 P=46,053,889 Additions 59,908,303 7,446,475 Refunded (7,785,736) – Unamortized discount (28,934,239) (18,628,980) P=75,964,346 P=34,871,384
Movements in unamortized discount are as follows:
2014 2013 Beginning balance P=18,628,980 P=20,210,218 Additions 13,353,716 948,411 Accretion (Note 22) (3,048,457) (2,529,649) Ending balance P=28,934,239 P=18,628,980
10. Goodwill and Other Noncurrent Assets
2014 2013 Noncurrent portion of: Deferred input VAT P=204,816,161 P=143,808,850 Prepaid rent 64,581,202 – Due from franchisees (Note 32) 48,675,044 44,763,037 Deferred lease (Note 26) 21,762,365 12,819,183 Lease receivable - net of unearned interest income
amounting to nil and P=5,773 as at December 31, 2014 and 2013, respectively (Notes 26, 29 and 30) – 559,441

- 30 -
*SGVFS010389*
Intangible assets: Goodwill P=65,567,524 P=65,567,524
Software and program cost 3,477,680 2,886,285 Garnished accounts (Note 34) 7,945,958 4,876,522 Others 2,174,510 1,411,415 P=419,000,444 P=276,692,257
Deferred Lease Deferred lease pertains to “Day 1”lossrecognized on refundable deposits on rent, which is amortized on a straight-line basis over the term of the related leases.
Movements in deferred lease are as follows:
2014 2013 Beginning balance P=14,240,643 P=15,702,845 Additions 13,353,716 948,411 Less amortization (Note 26) (2,277,636) (2,410,613) Ending balance 25,316,723 14,240,643 Less current portion (Note 7) 3,554,358 1,421,460 Noncurrent portion P=21,762,365 P=12,819,183
Goodwill On March 22, 2004, the Group purchased the leasehold rights and store assets of Jollimart Philippines Corporation (Jollimart) for a total consideration of P=130,000,000. The excess of the acquisition cost over the fair value of the assets acquired was recorded as goodwill amounting to P=70,178,892. In 2008, the Group recognized an impairment loss in goodwill amounting to P=4,611,368.
The recoverable amount of the goodwill was estimated based on the value-in-use calculation using cash flow projections from financial budgets approved by senior management covering a five year period. The pre-tax discount rate applied to cash flow projections is12.70%in 2014 and 8.27% in 2013. The cash flows beyond the five-year period are extrapolated using a 3.00% growth rate in 2014 and 2013 which is the same as the long-term average growth rate for the retail industry.
No store acquired from Jollimart was closed in 2014 and 2013. In 2011, the Group has closed one store out of the 25 remaining stores it purchased from Jollimart. No impairment loss was recognized in 2014, 2013 and 2012.
Goodwill is allocated to the group of CGU which comprises the working capital and property and equipment of all the purchased stores’ assets.
Key assumptions used in value-in-use calculations in 2014 and 2013 follow: a. Sales and Cost Ratio
Sales and cost ratio are based on average values achieved in the three years preceding the start of the budget period. These are increased over the budget period for anticipated efficiency improvements. Sales are projected to increase by 2.00% per annum while the cost ratio is set at 69.30% - 70.30% of sales per annum.
b. Discount Rates Discount rates reflect management’s estimates of the risks specific to the CGU. Management computed for its weighted average cost of capital (WACC). In computing for its WACC, the following items were considered:

- 31 -
*SGVFS010389*
• Average high and low range of average bank lending rates as of year-end • Yield on a 10-year Philippine zero coupon bond as of valuation date • Market risk premium • Company relevered beta • Alpharisk
c. Growth Rate Estimates Rates are based on average historical growth rate which is consistent with the expected average growth rate for the industry. Annual inflation and rate of possible reduction in transaction count were also considered in determining growth rates used.
Management recognized that unfavorable conditions could materially affect the assumptions used in the determination of value-in-use. An increase of 26.25% and 6.84% in the discount rates, or a reduction of growth rates by 13.00% and 12.90%, would give a value-in-use equal to the carrying amount of the CGUin 2014 and 2013, respectively.
Software and Program Cost Movements in software and program cost are as follows:
2014 2013 Cost: Beginning balance P=17,871,180 P=14,851,985 Additions 1,247,000 3,019,195 Ending balance 19,118,180 17,871,180 Accumulated amortization: Beginning balance 14,984,895 13,668,334 Amortization (Note 19) 655,605 1,316,561 Ending balance 15,640,500 14,984,895 Net book value P=3,477,680 P=2,886,285
Garnished Accounts Garnished accounts pertain to the amount set aside by the Group, as required by the courts, in order to answer for litigation claims should the results be unfavorable to the Group (see Note 34).
11. Bank Loans
Bank loans in 2014 and 2013 represent unsecured Philippine Peso-denominated short-term borrowings from various local banks, payable in lump-sum in 2015 and 2014, respectively, with annual interest rates ranging from 2.00% to 2.50%,2.50% to 3.30%, and 3.30% to 3.75%in 2014, 2013 and 2012, respectively, which are repriced monthly based on market conditions. The proceeds of these loans were used for the operations of the Group.
Movements in bank loans are as follows:
2014 2013 Beginning balance P=560,000,000 P=477,777,778 Availments 950,000,000 550,000,000 Payments (760,000,000) (467,777,778) Ending balance P=750,000,000 P=560,000,000

- 32 -
*SGVFS010389*
Interest expense from these bank loans amounted toP=16,060,038, P=16,033,270andP=16,338,080 in 2014, 2013 and 2012, respectively (see Note 21). Interest payable amounted toP=800,000 and P=1,689,053 as at December 31, 2014 and 2013, respectively (see Note 12).
12. Accounts Payable and Accrued Expenses
2014 2013 Trade payable P=2,031,839,981 P=1,575,446,279 Utilities 90,223,127 71,354,276 Employee benefits 71,421,033 39,622,810 Rent (Note 26) 65,729,071 58,097,685 Advertising and promotion 41,339,695 37,844,609 Outsourced services 41,302,057 24,844,921 Bank charges 14,254,500 13,487,060 Security services 9,112,687 3,375,831 Interest (Notes 11 and 15) 1,058,750 1,947,803 Others (Note 34) 78,879,812 46,682,215 P=2,445,160,713 P=1,872,703,489
The trade suppliers generally provide 15 or 30-day credit terms to the Group. Prompt payment discounts ranging from 0.5% to 5.0% are given by a number of trade suppliers. All other payables are due within 3 months. Others include provisions and accruals of various expenses incurred in the stores’ operations.
13. Other Current Liabilities
2014 2013 Non-trade accounts payable P=441,307,059 P=362,508,354 Due to franchisees 128,356,232 62,939,640 Retention payable 81,784,397 48,466,743 Output VAT 74,165,095 61,134,099 Withholding taxes 43,688,935 33,462,627 Current portion of deferred revenue on: Exclusivity contract (Notes 16 and 32) 25,000,000 446,429 Customer loyalty programme 18,173,684 7,040,017 Finance lease (Notes 16 and 26) 98,264 589,567 Royalty (Note 32) 19,330,605 16,305,559 Service fees payable 8,012,505 10,381,467 Others (Notes 25 and 34) 13,805,862 30,731,827 P=853,722,638 P=634,006,329
Non-trade accounts payable pertains to payable to suppliers of goods or services that forms part of general and administrative expenses. These are noninterest-bearing and are due within one year.
Retention payable pertains to the 10% of progress billings related to the construction of stores to be paid upon satisfactory completion of the construction.
Service fees payable pertains to management fee to store operators of service agreement stores computed based on a graduated percentage multiplied to stores’ gross profit (GP) and is payable the following month.

- 33 -
*SGVFS010389*
14. Deposits Payable
2014 2013 Franchisees (Note 32) P=124,767,926 P=99,370,298 Service agreements (Note 32) 95,268,832 89,707,363 Rent 14,465,851 13,811,274 P=234,502,609 P=202,888,935
15. Cumulative Redeemable Preferred Shares
Cumulative redeemable preferred shares, which are redeemable at the option of the holder, represent the share of PSC-ERP through its trustee, BPI-AMTG, in SSHI’s net assets pertaining to preferred shares. PSC-ERP is entitled to an annual “Guaranteed Preferred Dividend” in the earnings of SSHI starting April 5, 2002, the date when the 25% of the subscription on preferred shares have been paid, in accordance with the Corporation Code.
The guaranteed annual dividends shall be calculated and paid in accordance with the Shareholder’s Agreement dated November 16, 2000 which provides that the dividend shall be determined by the BOD of SSHI using the prevailing market conditions and other relevant factors. Further, the preferred shareholder shall not participate in the earnings of SSHI except to the extent of guaranteed dividends and whatever is left of the retained earnings will be declared as dividends in favor of common shareholders. Guaranteed preferred dividends included under “Interest expense” in the consolidated statements of comprehensive income amounted to P=135,780, P=214,620, and P=258,750 in 2014, 2013 and 2012, respectively (see Note 21). Interest payable amounted to P=258,750 as at December 31, 2014 and 2013(see Note 12).
16. Deferred Revenue
2014 2013 Noncurrent portion of deferred revenue on: Exclusivity contracts(Note 32) P=25,000,000 P=– Finance lease (Note 26) – 98,264 Others 1,552,651 1,508,919 P=26,552,651 P=1,607,183
Deferred Revenue on Finance Lease Movements in deferred revenue on finance lease are as follows:
2014 2013 Beginning balance P=687,831 P=1,277,398 Less amortization (Note 26) 589,567 589,567 Ending balance (Note 26) 98,264 687,831 Less current portion (Notes 13 and 26) 98,264 589,567 Noncurrent portion(Note 26) P=– P=98,264

- 34 -
*SGVFS010389*
Deferred Revenue on Exclusivity Contracts Movements in deferred revenue on exclusivity contracts are as follows:
2014 2013 Beginning balance P=446,429 P=1,264,881 Addition 75,000,000 – Less amortization (Notes 20 and 32) 25,446,229 818,452 Ending balance (Note 32) 50,000,000 446,429 Less current portion (Note 13) 25,000,000 446,429 Noncurrent portion P=25,000,000 P=–
17. Equity
Common Stock The Company was listed with the Philippine Stock Exchange on February 4, 1998 with total listed shares of 71,382,000 common shares consisting of 47,000,000 shares for public offering and 24,382,000 shares for private placement. The Group offered the share at a price of P=4.40. Below is the Company’s track record of the registration of securities:
Date of SEC order rendered effective or permit to sell/ Date of SEC approval Event
Authorized Capital Stock Issued shares
Issue price/ Par value
January 9, 1998 Outstanding common shares 400,000,000 166,556,250
P=1.00
February 4, 1998 Listed shares: Public offering
400,000,000 47,000,000
4.40
Private placement 400,000,000 24,382,000 4.40 August 15, 2008 10% stock dividends 400,000,000 23,725,200 1.00 August 4, 2009 10% stock dividends 400,000,000 26,097,720 1.00 August 27, 2010 5% stock dividends 400,000,000 14,353,746 1.00 August 19, 2011 15% stock dividends 400,000,000 45,214,300 1.00 November 15, 2012 15% stock dividends 600,000,000 51,996,445 1.00 August 15, 2013 15% stock dividends 600,000,000 59,795,912 1.00 As at December 31, 2014 459,121,573
As at December 31, 2014 and 2013, the Company has a total of 640 and 650 shareholders on record.
On July 24, 2012, the BOD and at least 2/3 of the Company’s stockholders approved the increase of the Company’s authorized common stock from P=400,000,000, divided into 400,000,000 common shares with par value of P=1 per share, to P=600,000,000, divided into 600,000,000 common shares with a par value of P=1 per share.
The Philippine SEC approved the Company’s application for the increase in its authorized capital stock on October 19, 2012. Retained Earnings The Group’s retained earnings is restricted to the extent of P=107,463,213 and P=83,238,361as at December 31, 2014 and 2013, respectively, for the undistributed earnings of subsidiaries and P=2,923,246 as at December 31, 2014 and 2013 for the cost of treasury shares.
Stock Dividends There was no stock dividend declaration in 2014. Details of the Group’s stock dividend declaration for the years ended December 31, 2013 and 2012 are as follows:

- 35 -
*SGVFS010389*
Declaration date Record date Stock
dividend %
Outstanding no. of common shares as at
declaration date Total stock
dividend issued July 18, 2013 August 15, 2013 15% 398,639,411 59,795,912 July 24, 2012 November 15, 2012 15% 346,642,966 51,996,445
The Group’s BOD and at least 2/3 of the Group’s stockholders approved all the aforementioned stock dividend declarations.
Cash Dividends Details of the Group’s cash dividend declaration for the years ended December 31, 2014, 2013 and 2012 are shown below:
Declaration date Record date Payment date Dividend per share
Outstanding no. of common shares as of declaration date
Total cash dividends
April 24, 2014 May 23, 2014 June 18, 2014 P=0.30 458,435,323 P=137,530,597 July 18, 2013 August 15, 2013 September 9, 2013 0.10 398,639,411 39,863,941 July 24, 2012 August 22, 2012 September 14,2012 0.10 346,642,966 34,664,297
The Group’s BOD approved all the cash dividends presented above.
Treasury Shares There are 686,250 shares that are in treasury amounting to P=2,923,246 as at December 31, 2014 and 2013. There is no movement in the Group’s treasury shares in 2014 and 2013.
18. Cost of Merchandise Sales
2014 2013 2012 Merchandise inventory, beginning
(Note 6) P=900,849,891 P=726,986,563 P=519,258,936 Net purchases 13,125,840,660 10,835,492,846 8,760,966,848 14,026,690,551 11,562,479,409 9,280,225,784 Less merchandise inventory, ending (Note 6) 1,165,094,076 900,849,891 726,986,563 P=12,861,596,475 P=10,661,629,518 P=8,553,239,221
19. General and Administrative Expenses
2014 2013 2012 Communication, light and water P=1,111,566,076 P=908,791,566 P=822,136,123 Depreciation and amortization
(Note 8) 862,759,509 709,518,959 527,786,925 Outside services (Note 32) 787,035,907 668,604,676 663,221,838 Rent (Note 26) 716,894,020 553,791,399 488,292,500 Personnel costs (Note23) 365,590,415 342,606,112 269,182,182 Trucking services 293,246,442 218,412,580 171,676,338 Advertising and promotion 281,258,513 246,559,168 139,445,376 Royalties (Note 32) 204,755,907 171,714,747 133,085,007 Warehousing services 199,368,536 141,077,370 95,052,873 Supplies 149,834,763 113,159,695 119,944,818
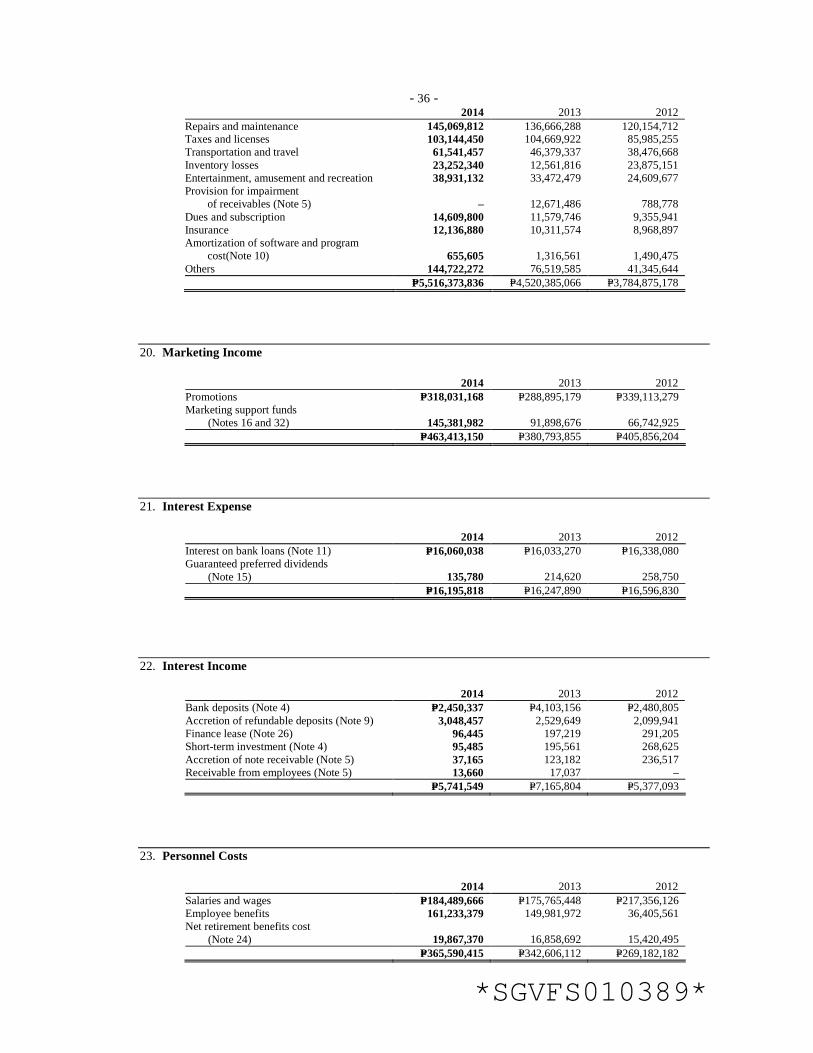
- 36 -
*SGVFS010389*
2014 2013 2012 Repairs and maintenance 145,069,812 136,666,288 120,154,712 Taxes and licenses 103,144,450 104,669,922 85,985,255 Transportation and travel 61,541,457 46,379,337 38,476,668 Inventory losses 23,252,340 12,561,816 23,875,151 Entertainment, amusement and recreation 38,931,132 33,472,479 24,609,677 Provision for impairment
of receivables (Note 5) – 12,671,486 788,778 Dues and subscription 14,609,800 11,579,746 9,355,941 Insurance 12,136,880 10,311,574 8,968,897 Amortization of software and program
cost(Note 10) 655,605 1,316,561 1,490,475 Others 144,722,272 76,519,585 41,345,644 P=5,516,373,836 P=4,520,385,066 P=3,784,875,178
20. Marketing Income
2014 2013 2012 Promotions P=318,031,168 P=288,895,179 P=339,113,279 Marketing support funds
(Notes 16 and 32) 145,381,982 91,898,676 66,742,925 P=463,413,150 P=380,793,855 P=405,856,204
21. Interest Expense
2014 2013 2012 Interest on bank loans (Note 11) P=16,060,038 P=16,033,270 P=16,338,080 Guaranteed preferred dividends
(Note 15) 135,780 214,620 258,750 P=16,195,818 P=16,247,890 P=16,596,830
22. Interest Income
2014 2013 2012 Bank deposits (Note 4) P=2,450,337 P=4,103,156 P=2,480,805 Accretion of refundable deposits (Note 9) 3,048,457 2,529,649 2,099,941 Finance lease (Note 26) 96,445 197,219 291,205 Short-term investment (Note 4) 95,485 195,561 268,625 Accretion of note receivable (Note 5) 37,165 123,182 236,517 Receivable from employees (Note 5) 13,660 17,037 – P=5,741,549 P=7,165,804 P=5,377,093
23. Personnel Costs
2014 2013 2012 Salaries and wages P=184,489,666 P=175,765,448 P=217,356,126 Employee benefits 161,233,379 149,981,972 36,405,561 Net retirement benefits cost
(Note 24) 19,867,370 16,858,692 15,420,495 P=365,590,415 P=342,606,112 P=269,182,182

- 37 -
*SGVFS010389*
24. Retirement Benefits
The Group maintains a trusteed, non-contributory defined benefit retirement plan covering all qualified employees administered by a trustee bank under the supervision of the Board of Trustees of the plan. The Board of Trustees is responsible for investment of the assets. It defines the investment strategy as often as necessary, at least annually, especially in the case of significant market developments or changes to the structure of the plan participants. When defining the investment strategy, it takes account of the plans’ objectives, benefit obligations and risk capacity. The investment strategy is defined in the form of a long-term target structure (investment policy). The Board of Trustees delegates the implementation of the investment policy in accordance with the investment strategy as well as various principles and objectives to an Investment Committee, which also consists of members of the Board of Trustees, a Director and a Controller. The Controller of the fund is the one who oversees the entire investment process.
Under the existing regulatory framework, Republic Act 7641 requires a provision for retirement pay to qualified private sector employees in the absence of any retirement plan in the entity, provided however that the employee’s retirement benefits under any collective bargaining and other agreements shall not be less than those provided under the law. The law does not require minimum funding of the plan.

- 38 -
*SGVFS010389*
Changes in net defined benefit liability of funded funds in 2014 are as follows:
Net retirement benefits cost in consolidated statement
of comprehensive income Remeasurements in other comprehensive income
January 1,2014 Current
service cost Net interest Subtotal Benefits
paid Remeasurement
on plan assets
Actuarial changes arising from changes in
financial assumptions
Experience adjustments Subtotal
Contribution by employer December 31,2014
Present value of theretirement obligations
PSC (P=138,054,970) (P=14,826,166) (P=6,322,918) (P=21,149,084) P=2,176,317 P=– P=742,576 (P=2,612,499) (P=1,869,923) P=– (P=158,897,660) CDI (8,206,463) (641,611) (353,699) (995,310) – – 199,383 (546,175) (346,792) – (9,548,565) (146,261,433) (15,467,777) (6,676,617) (22,144,394) 2,176,317 – 941,959 (3,158,674) (2,216,715) – (168,446,225) Fair value of plan assets PSC 48,701,153 – 2,230,513 2,230,513 (2,176,317) (1,737,143) – – (1,737,143) 18,444,800 65,463,006 CDI 1,079,138 – 46,511 46,511 – (46,504) – – (46,504) 1,500,000 2,579,145 49,780,291 – 2,277,024 2,277,024 (2,176,317) (1,783,647) – – (1,783,647) 19,944,800 68,042,151 Net retirement obligations (P=96,481,142) (P=15,467,777) (P=4,399,593) (P=19,867,370) P=– (P=1,783,647) P=941,959 (P=3,158,674) (P=4,000,362) P=19,944,800 (P=100,404,074)
Changes in net defined benefit liability of funded funds in 2013 are as follows:
Net retirement benefits cost in consolidated statement
of comprehensive income Remeasurements in other comprehensive income
January 1,2013 Current
service cost Net interest Subtotal Benefits
paid Remeasurement
on plan assets
Actuarial changes arising from
changes in financial
assumptions Experience adjustments Subtotal
Contribution by employer December 31,2013
Present value of the retirement obligations PSC (P=109,977,260) (P=11,184,138) (P=5,806,799) (P=16,990,937) P=4,021,523 P=– (P=14,261,393) (P=846,903) (P=15,108,296) P=– (P=138,054,970) CDI (6,625,244) (1,145,926) (334,575) (1,480,501) – – (451,957) 351,239 (100,718) – (8,206,463) (116,602,504) (12,330,064) (6,141,374) (18,471,438) 4,021,523 – (14,713,350) (495,664) (15,209,014) – (146,261,433) Fair value of plan assets PSC 29,548,266 – 1,560,148 1,560,148 (4,021,523) (56,468) – – (56,468) 21,670,730 48,701,153 CDI 1,041,545 – 52,598 52,598 – (15,005) – – (15,005) – 1,079,138 30,589,811 – 1,612,746 1,612,746 (4,021,523) (71,473) – – (71,473) 21,670,730 49,780,291 Net retirement obligations (P=86,012,693) (P=12,330,064) (P=4,528,628) (P=16,858,692) P=– (P=71,473) (P=14,713,350) (P=495,664) (P=15,280,487) P=21,670,730 (P=96,481,142)

- 39 -
*SGVFS010389*
Changes in net defined benefit liability of funded funds in 2012 are as follows:
Net retirement benefits cost in consolidated statement
of comprehensive income Remeasurements in other comprehensive income
January 1,
2012 Current
service cost Net interest Subtotal Benefits
paid Remeasurement
on plan assets
Actuarial changes arising from
changes in financial
assumptions Experience adjustments Subtotal
Contribution by employer December 31, 2012
Present value of the retirement obligations PSC (P=96,296,328) (P=9,655,975) (P=5,585,187) (P=15,241,162) P=4,686,898 P=– (P=8,858,149) P=5,731,481 (P=3,126,668) P=– (P=109,977,260) CDI (6,764,360) (545,788) (374,746) (920,534) 1,245,962 – (225,804) 39,492 (186,312) – (6,625,244) (103,060,688) (10,201,763) (5,959,933) (16,161,696) 5,932,860 – (9,083,953) 5,770,973 (3,312,980) – (116,602,504) Fair value of plan assets PSC 12,239,143 – 709,870 709,870 (4,686,898) 2,687,354 – – 2,687,354 18,598,797 29,548,266 CDI 565,547 – 31,331 31,331 (1,245,962) 10,214 – – 10,214 1,680,415 1,041,545 12,804,690 – 741,201 741,201 (5,932,860) 2,697,568 – – 2,697,568 20,279,212 30,589,811 Net retirement obligations (P=90,255,998) (P=10,201,763) (P=5,218,732) (P=15,420,495) P=– P=2,697,568 (P=9,083,953) P=5,770,973 (P=615,412) P=20,279,212 (P=86,012,693)

- 40 -
*SGVFS010389*
The fair value of plan assets by each class as at the end of each balance sheet date are as follows:
PSC CDI December31,2014 December 31,2013 December31,2014 December 31,2013
BPI short term fund: Unit investment trust fund P=55,493,618 P=38,677,625 P=2,067,114 P=1,079,138 BPI ALFM mutual fund – – 512,031 –
Investments in equity securities: PSC - listed shares - 40,848 as at December 31, 2014 and 2013 3,969,388 4,023,528 – – SSHI - unlisted shares 6,000,000 6,000,000 – –
Fair value of plan assets P=65,463,006 P=48,701,153 P=2,579,145 P=1,079,138
The trustee exercises voting rights over the PSC and SSHI shares held by the retirement fund.
The retirement benefits cost and the present value of the retirement are determined using actuarial valuations. The actuarial valuation involves making various assumptions. The principal assumptions used in determining the net retirement obligations are shown below: PSC CDI 2014 2013 2014 2013 Discount rates 4.61% 5.28% 4.63% 5.05% Salary increase rates 5.50% 5.50% 5.50% 5.50% Turnover rates: Age 17-24 5.00% 5.00% 5.00% 5.00%
25-29 3.00% 3.00% 3.00% 3.00% 30-49 1.00% 1.00% 1.00% 1.00% 50-59 0.00% 0.00% 0.00% 0.00%
The sensitivity analysis below has been determined based on reasonably possible changes of each significant assumption on the defined benefit obligation as at December 31, 2014, assuming if all other assumptions were held constant:
Increase
(Decrease) PSC CDI Discount rates +0.5% (P=11,714,458) (P=288,081) -0.5% 13,054,484 317,083 Turnover rate +1% 26,665,679 649,259 -1% (21,860,805) (534,339) Average remaining years of service +3 years 4,015,070 12,104 -3 years (492,444) 161,053
The Group expects to contributeP=18,018,753 andP=1,112,050to the defined benefit retirement plans of PSC and CDI, respectively, in 2015.

- 41 -
*SGVFS010389*
Shown below is the maturity analysis and weighted average duration of the retirement benefits obligations:
Benefits Payments PSC CDI Not exceeding 1 year P=5,938,805 P=4,957,725 More than 1 year to 5 years 5,590,580 290,012 More than 5 to 10 years 33,969,262 1,953,798 More than 10 to 15 years 133,779,302 3,835,523 More than 15 years to 20 years 307,334,651 5,340,767 More than 20 years 1,932,543,485 41,404,367
25. Related Party Disclosures
Related party relationships exist when one party has the ability to control, directly or indirectly through one or more intermediaries, the other party or exercise significant influence over the other party in making financial and operating decisions. Such relationships also exist between and/or among entities which are under common control with the reporting enterprise, or between and/or among the reporting enterprises and their key management personnel, directors or its stockholders.
Transactions with related parties consist of:
a. PSC and CDI have transactions with PFI, a foundation with common key management of the Group, consisting of donations and noninterest-bearing advances pertaining primarily to salaries, taxes and other operating expenses initially paid by PSC for PFI. Donations payable to PFI is presented under “Others” in the “Other current liabilities” in the consolidated balance sheets (see Note 13).
Balances arising from the foregoing transactions with related parties are as follows:
Related
Nature of Terms and Transactions for the
Year Ended December 31 Outstanding Balance
as at December 31 Parties Relationship Transactions Conditions 2014 2013 2014 2013 Receivables PFI (Note 5)
Under common
control
Noninterest-
bearing advances
Unsecured, no
impairment in 2014 and 2013. Amounts are due and demandable. P=406,473 P=1,481,066 P=3,525,452 P=3,118,978
Other current liabilities
PFI Under common
control Donations 0.5% of earnings
before income tax from PSC and P=720,000 annual donation from CDI.Payable within 30 days. P=7,203,333 P=3,387,500 P=2,894,337 P=–
b. As at December 31, 2014 and 2013, the Group’s defined benefit retirement fund has
investments in shares of stock of the Parent Company with a cost of P=122,417. The retirement benefit fund’s incurred a loss arising from changes in market prices amounting to P=54,140 in 2014 and earned a gain of P=755,688in 2013.

- 42 -
*SGVFS010389*
2. Compensation of key management personnel are as follows:
2014 2013 2012
Short-term employee benefits P=44,638,652 P=35,130,247 P=34,979,611 Post-employment benefits 2,699,447 2,855,806 430,000 Other long-term benefits – 776,964 376,073 P=47,338,099 P=38,763,017 P=35,785,684
26. Leases
Finance Lease as Lessor In March 2007, PSC entered into a five-year sale and leaseback finance lease agreement with an armored car service provider. The lease has no terms of renewal and no escalation clauses. Unguaranteed residual values accruing to the Company amounted to P=300,000.
In March 2010, the Company amended its agreement with the armored car service provider extending the lease term for another five years from March 1, 2010 to February 1, 2015, imposing 7% interest per annum on the restructured loan obligation and reducing its monthly rental payments. The unguaranteed residual values accruing to the Company was retained.
a. Lease Receivable (Notes 5 and 10) Future minimum lease receivables under this lease as at December 31 are as follows:
2014 2013 Within one year P=3,747,773 P=3,182,560 After one year but not more than five years – 565,213 Total minimum lease payments receivable 3,747,773 3,747,773 Less unearned interest income 5,773 102,218 Present value of future minimum lease
payments receivable 3,742,000 3,645,555 Less current portion (Note 5) 3,742,000 3,086,114 Noncurrent portion (Note 10) P=– P=559,441
There were no collections of lease receivable in 2014 and 2013.
Present value of lease receivable as at December 31 is as follows:
2014 2013 Within one year P=3,742,000 P=3,086,114 After one year but not more than five years – 559,441 Total minimum lease payments receivable 3,742,000 3,645,555 Less current portion 3,742,000 3,086,114 P=– P=559,441
Unearned interest income as at December 31, 2014 and 2013 amounted to P=5,773 and P=102,218, respectively. Related interest income amounted to P=96,445, P=197,219 and P=291,205 in 2014, 2013 and 2012, respectively (see Note 22).
b. Deferred Revenue on Finance Lease
Difference between the original lease agreement’s present value of minimum lease payments at the date of lease inception against the carrying value of the finance lease asset resulted in a deferred revenue on finance lease amounting to P=6,550,753, which is to be amortized on a

- 43 -
*SGVFS010389*
straight-line basis over the lease term. The related deferred revenue amounted to P=98,264 and P=687,831as at December 31, 2014 and 2013, respectively, with current portion amounting toP=98,264 and P=589,567 as at December31, 2014 and 2013, respectively(see Notes 13 and 16). Noncurrent portion amounted to nil and P=98,264 as at December 31, 2014 and 2013, respectively. Amortization of deferred revenue on finance lease amounted to P=589,567 in 2014, 2013 and 2012 (see Note 16).
Operating Lease as Lessee a. PSC has various lease agreements with third parties relating to its store operations. Certain
agreements provide for the payment of rentals based on various schemes such as an agreed percentage of net sales for the month and fixed monthly rate.
Rent expense related to these lease agreements amounted toP=673,566,162,P=515,939,520 andP=449,915,799in 2014, 2013 and 2012, respectively (see Note 19). Of the total rent expense, P=5,654,193, P=2,658,415 andP=2,573,518 in 2014, 2013 and2012, respectively, pertains to contingent rent of some stores based on percentage ranging from 1.5% to 3.0% of merchandise sales. Amortization of deferred lease amounted to P=545,297, P=627,081 and P=719,536in 2014, 2013 and 2012, respectively (see Note 10).
In 2014, PSC entered into various long-term operating lease contracts for its warehouses in Pasig, Cebu, Iloilo and Pampanga. Rent expense for warehouse leases amounted to P=27,334,418 and P=20,351,496 and nil in 2014, 2013 and 2012, respectively (see Note 19). Amortization of deferred lease amounted to P=1,717,475, P=1,090,500 and nil in 2014, 2013 and 2012, respectively (see Note 10).
The approximate annual future minimum rental payments of the PSC under its existing lease agreements as at December 31 are as follows:
2014 2013 Within one year P=93,555,952 P=77,013,775 After one year but not more than five years 325,588,151 183,063,024 More than five years 256,080,754 74,506,720 P=675,224,857 P=334,583,519
b. In2012, CDI entered into a 2-year lease contract for the lease of a warehouse in Cebu
commencing in April 2012 until April 2014. The lease has a renewal option and is subject to an annual escalation rate of 5%. Upon expiration in April 2014, CDI renewed the lease contract for another eight months from May to December 2014. On January 1, 2015, CDI again renewed the lease contract for one year from January to December 2015.
In 2011, CDI entered into a 10-year lease contract for the lease of its warehouse extension effective March 2011. The lease is subject to an annual escalation rate of 4.0% starting on the second year of the lease. The lease contract was transferred to PSC on January 1, 2014 and rent expenses for this lease agreement were recorded by PSC. In 2005, CDI entered into a 15-year operating lease contract for the lease of its warehouse effective November 1, 2005. On June 30, 2007, PSC has assumed the lease agreement for the warehouse and subleased the warehouse back to CDI. The lease has a renewal option and is subject to an escalation rate of 7.0% every after two years starting on the third year of the lease. In February 2013, CDI transferred the lease contract to PSC and the sublease was terminated. Rent expense related to the lease agreement was recorded by PSC.
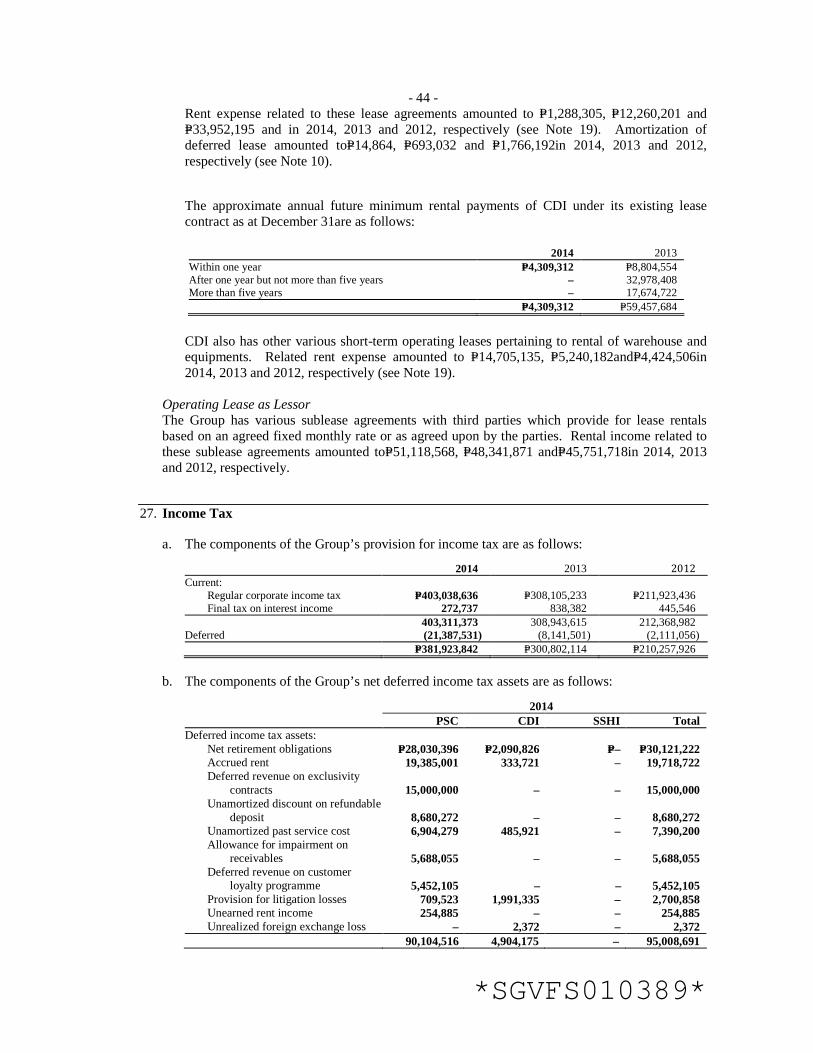
- 44 -
*SGVFS010389*
Rent expense related to these lease agreements amounted to P=1,288,305, P=12,260,201 and P=33,952,195 and in 2014, 2013 and 2012, respectively (see Note 19). Amortization of deferred lease amounted toP=14,864, P=693,032 and P=1,766,192in 2014, 2013 and 2012, respectively (see Note 10). The approximate annual future minimum rental payments of CDI under its existing lease contract as at December 31are as follows:
2014 2013 Within one year P=4,309,312 P=8,804,554 After one year but not more than five years – 32,978,408 More than five years – 17,674,722 P=4,309,312 P=59,457,684
CDI also has other various short-term operating leases pertaining to rental of warehouse and equipments. Related rent expense amounted to P=14,705,135, P=5,240,182andP=4,424,506in 2014, 2013 and 2012, respectively (see Note 19).
Operating Lease as Lessor The Group has various sublease agreements with third parties which provide for lease rentals based on an agreed fixed monthly rate or as agreed upon by the parties. Rental income related to these sublease agreements amounted toP=51,118,568, P=48,341,871 andP=45,751,718in 2014, 2013 and 2012, respectively.
27. Income Tax
a. The components of the Group’s provision for income tax are as follows:
2014 2013 2012
Current: Regular corporate income tax P=403,038,636 P=308,105,233 P=211,923,436 Final tax on interest income 272,737 838,382 445,546 403,311,373 308,943,615 212,368,982 Deferred (21,387,531) (8,141,501) (2,111,056) P=381,923,842 P=300,802,114 P=210,257,926
b. The components of the Group’s net deferred income tax assets are as follows:
2014 PSC CDI SSHI Total Deferred income tax assets: Net retirement obligations P=28,030,396 P=2,090,826 P=– P=30,121,222 Accrued rent 19,385,001 333,721 – 19,718,722 Deferred revenue on exclusivity
contracts 15,000,000 – – 15,000,000 Unamortized discount on refundable
deposit 8,680,272 – – 8,680,272 Unamortized past service cost 6,904,279 485,921 – 7,390,200 Allowance for impairment on
receivables 5,688,055 – – 5,688,055 Deferred revenue on customer
loyalty programme 5,452,105 – – 5,452,105 Provision for litigation losses 709,523 1,991,335 – 2,700,858 Unearned rent income 254,885 – – 254,885 Unrealized foreign exchange loss – 2,372 – 2,372 90,104,516 4,904,175 – 95,008,691

- 45 -
*SGVFS010389*
Deferred income tax liabilities: Deferred lease expense 7,595,017 – – 7,595,017 Unamortized discount on purchase
of refundable deposit 229,032 – – 229,032 Revaluation increment on land – – 7,936,841 7,936,841 Unrealized foreign exchange gain 9,634 – – 9,634 7,833,683 – 7,936,841 15,770,524 Net deferred income tax assets (liability) P=82,270,833 P=4,904,175 (P=7,936,841) P=79,238,167 2013 PSC CDI SSHI Total Deferred income tax assets: Net retirement obligations P=26,806,145 P=2,138,198 P=– P=28,944,343 Accrued rent 16,833,945 595,361 – 17,429,306 Unamortized discount on refundable
deposit 4,031,977 1,556,717 – 5,588,694 Allowance for impairment on
receivables 6,269,624 – – 6,269,624 Provision for litigation losses 2,119,887 1,991,335 – 4,111,222 Unamortized past service cost 6,193,281 294,794 – 6,488,075 Deferred revenue on exclusivity
contracts 133,929 – – 133,929 Unearned rent income 95,040 – – 95,040 Unamortized discount on receivable 11,820 – – 11,820 Unrealized foreign exchange loss 59,579 – – 59,579 62,555,227 6,576,405 – 69,131,632 Deferred income tax liabilities: Deferred lease expense 2,858,206 1,413,987 – 4,272,193 Unamortized discount on purchase of
refundable deposit 267,083 – – 267,083 Revaluation increment on land – – 1,384,241 1,384,241 Unrealized foreign exchange gain – 4,988 – 4,988 3,125,289 1,418,975 1,384,241 5,928,505 Net deferred income tax assets (liability) P=59,429,938 P=5,157,430 (P=1,384,241) P=63,203,127
c. The reconciliation of the provision for income tax computed at the statutory income tax rate to
provision for income tax shown in the consolidated statements of comprehensive income follow:
2014 2013 2012 Provision for income tax
computed at statutory income tax rate P=376,580,609 P=295,028,929 P=202,630,185
Adjustments for: Nondeductible expenses: Inventory losses 4,608,692 3,768,545 7,162,545 Interest expense and others 1,263,705 2,446,834 867,483 Tax effect of rate difference
between final tax and statutory tax rate on bank interest income (491,010) (404,040) (364,133)
Nontaxable other income (38,154) (38,154) (38,154) P=381,923,842 P=300,802,114 P=210,257,926
d. Republic Act No. 9504, effective on July 7, 2008, allows availment of optional standard
deductions (OSD). Corporations, except for nonresident foreign corporations, may now elect to claim standard deduction in an amount not exceeding 40% of their gross income. The Group did not avail of the OSD for the computation of its taxable income in 2014, 2013 and 2012.

- 46 -
*SGVFS010389*
28. Basic/Diluted Earnings Per Share
2014 2013 2012
a. Net income P=873,344,855 P=682,627,649 P=465,176,023
b. Weighted average number of shares issued 459,121,573 459,121,573 459,121,573
c. Less weighted average number of shares held in treasury 686,250 686,250 686,250
d. Weighted average number of shares outstanding (b-c) 458,435,323 458,435,323 458,435,323
e. Basic/diluted earnings per share (a/d) P=1.91 P=1.49 P=1.01
The Group does not have potentially dilutive common shares as at December 31, 2014, 2013 and 2012. Thus, the basic earnings per share is equal to the diluted earnings per share as at those dates.
29. Financial Instruments
The comparison of the carrying value and fair value of all of the Group’s financial instruments (those with carrying amounts that are not equal to their fair values) as at December 31 are as follows:
2014 2013 Carrying Value Fair Value Carrying Value Fair Value Financial Assets Loans and Receivables Receivables- Lease receivable P=3,742,000 P=3,742,000 P=3,645,555 P=3,691,723 Deposits- Refundable 75,964,346 80,515,547 34,871,384 41,815,472
P=79,706,346 P=84,257,547 P=38,516,939 P=45,507,195
Lease receivable and refundable deposits are categorized under level 3 in the fair value hierarchy.
Fair Value Information Current Financial Assets and Financial Liabilities The fair value of lease receivable as at December 31, 2014 approximates its carrying value. Due to the short-term nature of the related transactions, the fair values of cash and cash equivalents, short-term investment, receivables(except for lease receivables), accounts payable and accrued expenses and other current liabilities approximates their carrying values as at balance sheet date.
Lease Receivable The fair value of lease receivable as at December 31, 2014 approximates its carrying value. The fair value of lease receivable as at December 31, 2013 is determined by discounting the sum of future cash flows using the prevailing market rates for instruments with similar maturities as at December 31, 2013 which is 2.73%.
Utility and Other Deposits The fair value of utility and other deposits approximates its carrying value as it earns interest based on repriced market conditions.
Refundable Deposits

- 47 -
*SGVFS010389*
The fair value of refundable deposits is determined by discounting the sum of future cash flows using the prevailing market rates for instruments with similar maturities as at December 31, 2014 and 2013ranging from 2.55% to 4.76% and 0.50% to 4.35%, respectively.
Bank Loans The carrying value approximates fair value because of recent and monthly repricing of related interest based on market conditions.
Cumulative Redeemable Preferred Shares The carrying value approximates fair value because corresponding dividends on these shares that are charged as interest expense in profit or loss are based on recent treasury bill rates repriced annually at yearend. Fair Value Hierarchy As at December 31, 2014 and 2013, the Group has no financial instruments measured at fair value.
30. Financial Risk Management Objectives and Policies
The main risks arising from the Group’s financial instruments are credit risk, liquidity risk, interest rate risk and foreign exchange risk. The BOD reviews and approves policies for managing each of these risks. The BOD also created a separate board-level entity, which is the Audit Committee, with explicit authority and responsibility in managing and monitoring risks. The Audit Committee, which ensures the integrity of internal control activities throughout the Group, develops, oversees, checks and pre-approves financial management functions and systems in the areas of credit, market, liquidity, operational, legal and other risks of the Group, and crisis management. The Internal Audit Department and the External Auditor directly report to the Audit Committee regarding the direction, scope and coordination of audit and any related activities.
Listed below are the summarized risk identified by the BOD.
Credit Risk Credit risk is the risk that one party to a financial instrument will cause a financial loss to the other party by failing to discharge an obligation. The receivable balances are monitored on an ongoing basis with the result that the Group’s exposure to impairment is managed to a not significant level. The Group deals only with counterparty duly approved by the BOD. The following tables provide information regarding the maximum credit risk exposure of the Group as at December 31:
2014 2013Cash and cash equivalents (excluding cash on hand) Cash in bank P=1,067,252,100 P=734,552,645 Cash equivalents – 50,580,062 1,067,252,100 785,132,707Short-term investment 10,884,130 10,810,229Receivables Franchisees 402,860,061 397,506,385 Suppliers 143,596,222 33,091,755 Employees 16,666,383 14,396,862 Store operators 11,682,630 12,181,205 Rent 3,089,725 2,486,280 Due from PFI 3,525,452 3,118,978 Current portion of: Lease receivable P=3,742,000 P=3,086,114 Notes receivable 990,917 1,033,914

- 48 -
*SGVFS010389*
Insurance receivable 1,155,417 585,057 Others 2,078,334 1,358,499 589,387,141 468,845,049Deposits Refundable 75,964,346 34,871,384 Utilities 53,374,427 42,509,396 Others 6,551,174 4,487,223 135,889,947 81,868,003Other noncurrent assets Noncurrent portion of: Due from franchisees 48,675,044 44,763,037 Lease receivable – 559,441 48,675,044 45,322,478 P=1,852,088,362 P=1,391,978,466
The following tables provide information regarding the credit risk exposure of the Group by classifying assets according to the Group’s credit ratings of debtors: 2014 Neither Past Due nor Impaired Standard Past Due High Grade Grade Or Impaired Total Cash and cash equivalents Cash in bank P=1,067,252,100 P=– P=– P=1,067,252,100 Cash equivalents – – – – 1,067,252,100 – – 1,067,252,100 Short-term investment 10,884,130 – – 10,884,130 Receivables Franchisees – 402,860,061 214,342 403,074,403 Suppliers – 120,628,776 38,533,380 159,162,156 Employees – 16,666,383 539,921 17,206,304 Store operators – 11,682,630 365,801 12,048,431 Rent – 3,089,725 2,274,184 5,363,909 Due from PFI – 3,525,452 – 3,525,452 Current portion of: Lease receivable – 3,742,000 – 3,742,000 Notes receivable – 990,917 – 990,917 Insurance receivable – 1,155,417 – 1,155,417 Others – 2,078,334 – 2,078,334 – 566,419,695 41,927,628 608,347,323 Deposits Utilities – 53,374,427 – 53,374,427 Refundable – 75,964,346 – 75,964,346 Others – 6,551,174 – 6,551,174 – 135,889,947 – 135,889,947 Other noncurrent asset Noncurrent portion of receivable
from franchisees – 48,675,044 – 48,675,044 – 48,675,044 – 48,675,044 P=1,078,136,230 P=750,984,686 P=41,927,628 P=1,871,048,544
2013 Neither Past Due nor Impaired Standard Past Due High Grade Grade Or Impaired Total Cash and cash equivalents Cash in bank P=734,552,645 P=– P=– P=734,552,645 Cash equivalents 50,580,062 – – 50,580,062 785,132,707 – – 785,132,707 Short-term investment 10,810,229 – – 10,810,229 Receivables
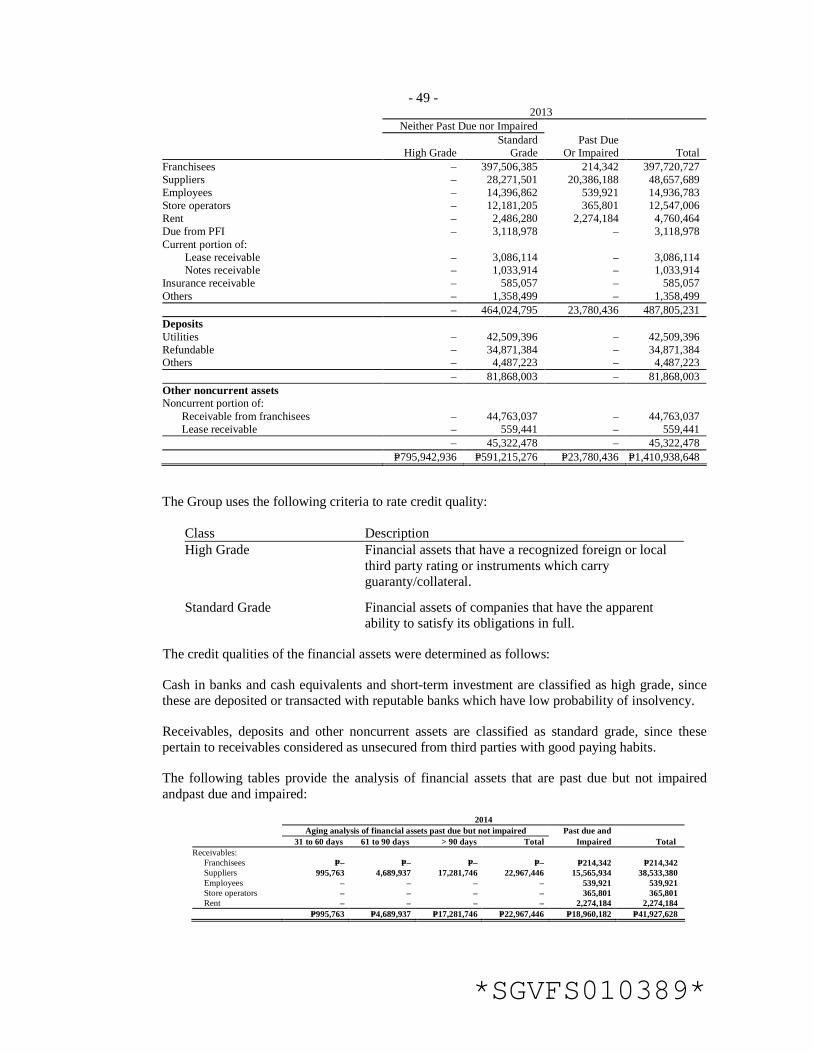
- 49 -
*SGVFS010389*
2013 Neither Past Due nor Impaired Standard Past Due High Grade Grade Or Impaired Total Franchisees – 397,506,385 214,342 397,720,727 Suppliers – 28,271,501 20,386,188 48,657,689 Employees – 14,396,862 539,921 14,936,783 Store operators – 12,181,205 365,801 12,547,006 Rent – 2,486,280 2,274,184 4,760,464 Due from PFI – 3,118,978 – 3,118,978 Current portion of: Lease receivable – 3,086,114 – 3,086,114 Notes receivable – 1,033,914 – 1,033,914 Insurance receivable – 585,057 – 585,057 Others – 1,358,499 – 1,358,499 – 464,024,795 23,780,436 487,805,231 Deposits Utilities – 42,509,396 – 42,509,396 Refundable – 34,871,384 – 34,871,384 Others – 4,487,223 – 4,487,223 – 81,868,003 – 81,868,003 Other noncurrent assets Noncurrent portion of: Receivable from franchisees – 44,763,037 – 44,763,037 Lease receivable – 559,441 – 559,441 – 45,322,478 – 45,322,478 P=795,942,936 P=591,215,276 P=23,780,436 P=1,410,938,648
The Group uses the following criteria to rate credit quality:
Class Description High Grade Financial assets that have a recognized foreign or local
third party rating or instruments which carry guaranty/collateral.
Standard Grade Financial assets of companies that have the apparent ability to satisfy its obligations in full.
The credit qualities of the financial assets were determined as follows:
Cash in banks and cash equivalents and short-term investment are classified as high grade, since these are deposited or transacted with reputable banks which have low probability of insolvency.
Receivables, deposits and other noncurrent assets are classified as standard grade, since these pertain to receivables considered as unsecured from third parties with good paying habits.
The following tables provide the analysis of financial assets that are past due but not impaired andpast due and impaired:
2014 Aging analysis of financial assets past due but not impaired Past due and 31 to 60 days 61 to 90 days > 90 days Total Impaired Total Receivables: Franchisees P=– P=– P=– P=– P=214,342 P=214,342 Suppliers 995,763 4,689,937 17,281,746 22,967,446 15,565,934 38,533,380 Employees – – – – 539,921 539,921 Store operators – – – – 365,801 365,801 Rent – – – – 2,274,184 2,274,184 P=995,763 P=4,689,937 P=17,281,746 P=22,967,446 P=18,960,182 P=41,927,628

- 50 -
*SGVFS010389*
2013 Aging analysis of financial assets past due but not impaired Past due and 31 to 60 days 61 to 90 days > 90 days Total Impaired Total Receivables: Franchisees P=– P=– P=– P=– P=214,342 P=214,342 Suppliers 1,601,652 868,379 2,350,223 4,820,254 15,565,934 20,386,188 Employees – – – – 539,921 539,921 Store operators – – – – 365,801 365,801 Rent – – – – 2,274,184 2,274,184 P=1,601,652 P=868,379 P=2,350,223 P=4,820,254 P=18,960,182 P=23,780,436
Receivables from suppliers are noninterest-bearing and are generally on 30 to 90 day terms.
There are no significant concentrations of credit risk within the Group.
Liquidity Risk Liquidity risk is the risk that an entity will encounter difficulty in meeting obligations associated with financial instruments. The Group seeks to manage its liquidity profile to be able to finance its capital expenditures and service its maturing debts. To cover for its financing requirements, the Group intends to use internally generated funds and sales of certain assets.
As part of its liquidity risk management program, the Group regularly evaluates projected and actual cash flow information and continuously assesses conditions in the financial markets for opportunities to pursue fund raising initiatives. The Group uses historical figures and experiences and forecasts of collections and disbursements. These initiatives may include drawing of loans from the approved credit line intended for working capital and capital expenditures purposes and equity market issues.
The tables below summarize the maturity profile of the financial assets of the Group:
2014
Three months More than
three months More than
one year More than or less to one year to five years five years Total Cash and cash equivalents Cash on hand and in banks P=1,241,685,743 P=– P=– P=– 1,241,685,743 Short-term investment 10,884,130 – – – 10,884,130 Receivables Franchisees 402,860,061 – – – 402,860,061 Suppliers 120,628,776 22,967,446 – – 143,596,222 Employees 16,666,383 – – – 16,666,383 Store operators 11,682,630 – – – 11,682,630 Rent 3,089,725 – – – 3,089,725 Due from PFI 3,525,452 – – – 3,525,452 Current portion of: Lease receivable 3,442,000 300,000 – – 3,742,000 Notes receivable P=990,917 P=– P=– P=– P=990,917 Insurance receivable – 1,155,417 – – 1,155,417 Others 2,078,334 – – – 2,078,334 564,964,278 24,422,863 – – 589,387,141 Deposits Utilities – – 53,374,427 – 53,374,427 Refundable – – 10,395,653 65,568,693 75,964,346 Others – – 6,551,174 – 6,551,174 – – 70,321,254 65,568,693 135,889,947 Other noncurrent asset Noncurrent portion of: Receivable from franchisee – – 48,675,044 – 48,675,044 Lease receivable – – – – – – – 48,675,044 – 48,675,044 P=1,817,534,151 P=24,422,863 P=118,996,298 P=65,568,693 P=2,026,522,005

- 51 -
*SGVFS010389*
2013
Three months More than
three months More than
one year More than or less to one year to five years five years Total Cash and cash equivalents Cash on hand and in banks P=922,422,571 P=– P=– P=– P=922,422,571 Cash equivalents 50,580,062 – – – 50,580,062 973,002,633 – – – 973,002,633 Short-term investment 10,810,229 – – – 10,810,229 Receivables Franchisees 397,506,385 – – – 397,506,385 Suppliers 28,271,501 4,820,254 – – 33,091,755 Employees 14,396,862 – – – 14,396,862 Store operators 12,181,205 – – – 12,181,205 Rent 2,486,280 – – – 2,486,280 Due from PFI 3,118,978 – – – 3,118,978 Current portion of: Lease receivable 1,955,265 1,130,849 – – 3,086,114 Notes receivable 1,033,914 – – – 1,033,914 Insurance receivable – 585,057 – – 585,057 Others 1,358,499 – – – 1,358,499 462,308,889 6,536,160 – – 468,845,049 Deposits Utilities – – 42,509,396 – 42,509,396 Refundable – – 26,697,286 8,174,098 34,871,384 Others – – 4,487,223 – 4,487,223 – – 73,693,905 8,174,098 81,868,003 Other noncurrent assets Noncurrent portion of: Receivable from franchisees – – 44,763,037 – 44,763,037 Lease receivable – – 559,441 – 559,441 – – 45,322,478 – 45,322,478 P=1,446,121,751 P=6,536,160 P=119,016,383 P=8,174,098 P=1,579,848,392
The tables below summarize the maturity profile of the financial liabilities of the Group based on remaining undiscounted contractual obligations:
2014
Three months
More than three
months More than or less to one year one year Total Bank loans P=650,000,000 P=100,000,000 P=– P=750,000,000 Accounts payable and accrued expenses Trade payable 2,031,839,981 – – 2,031,839,981 Utilities 90,223,127 – – 90,223,127 Rent 65,719,071 – – 65,729,071 Employee benefits 71,421,033 – – 71,421,033 Advertising and promotion 41,339,695 – – 41,339,695 Outsourced services 41,302,057 – – 41,302,057 Bank charges 14,254,500 – – 14,254,500 Security services 9,112,687 – – 9,112,687 Interest 1,058,750 – – 1,058,750 Others 78,879,812 – – 78,879,812 2,445,160,713 – – 2,445,160,713 Other current liabilities – – Non-trade accounts payable 41,686,571 399,620,488 441,307,059 Due to franchisees 128,356,232 – – 128,356,232 Retention payable – 81,784,397 – 81,784,397 Royalty 19,330,605 – – 19,330,605 Service fees payable – 8,012,505 – 8,012,505 Others – 13,805,862 – 13,805,862 189,373,408 503,223,252 – 692,596,660 Cumulative redeemable preferred shares 6,000,000 – – 6,000,000 P=3,290,534,121 P=603,223,252 P=– P=3,893,757,373

- 52 -
*SGVFS010389*
2013
Three months More than
three months More than or less to one year one year Total Bank loans P=350,000,000 P=210,000,000 P=– P=560,000,000 Accounts payable and accrued expenses Trade payable 1,575,446,279 – – 1,575,446,279 Utilities 71,354,276 – – 71,354,276 Rent 58,097,685 – – 58,097,685 Employee benefits 39,622,810 – – 39,622,810 Advertising and promotion 37,844,609 – – 37,844,609 Outsourced services 24,844,921 – – 24,844,921 Bank charges 13,487,060 – – 13,487,060 Security services 3,375,831 – – 3,375,831 Interest 1,947,803 – – 1,947,803 Others 46,682,215 – – 46,682,215 1,872,703,489 – – 1,872,703,489 Other current liabilities Non-trade accounts payable 43,501,002 319,007,352 – 362,508,354 Due to franchisees 62,939,640 – – 62,939,640 Retention payable – 48,466,743 – 48,466,743 Royalty 16,305,559 – – 16,305,559 Service fees payable – 10,381,467 – 10,381,467 Others 27,210,000 3,521,826 – 30,731,826 149,956,201 381,377,388 – 531,333,589 Cumulative redeemable preferred shares 6,000,000 – 6,000,000 P=2,378,659,690 P=591,377,388 P=– P=2,970,037,078
Interest Rate Risk Interest rate risk is the risk that the fair value or future cash flows of a financial instrument will fluctuate because of changes in market interest rates. The Group’s fair value and cash flows interest rate risk mainly arise from bank loans with floating interest rates. The Group is expecting to substantially reduce the level of bank loans over time. Internally generated funds coming from its cash generating units and from its franchising business will be used to pay off outstanding debts and consequently reduce the interest rate exposure. The maturity profile of financial instruments that are exposed to interest rate risk are as follows:
2014 2013 Due in less than one year P=756,000,000 P=566,000,000 Rate 2.0%-2.5% 2.5%-3.6%
Interest of financial instruments classified as floating rate is repriced at intervals of 30 days. The other financial instruments of the Group that are not included in the above tables are noninterest-bearing and are therefore not subject to interest rate risk.
The following table demonstrates the sensitivity to a reasonably possible change in interest rates, with all other variables held constant, of the Group’s income before income tax (through the impact on floating rate borrowings):

- 53 -
*SGVFS010389*
2014 2013
Increase/ Decrease in Basis Points
Effect on Income Before
Income Tax
Increase/ Decrease in Basis Points
Effect on Income Before
Income Tax Bank loans - floating interest rate +100 (P=7,500,000) +100 (P=5,600,000) -100 7,500,000 -100 5,600,000 Cumulative redeemable preferred shares - floating interest rate +100 (60,000) +100 (60,000) -100 60,000 -100 60,000
There is no other impact on the Group’s equity other than those already affectingprofit or loss.
Foreign Exchange Risk Foreign exchange risk is the risk to earnings or capital arising from changes in foreign exchange rates. The Group’s foreign exchange exposure arises from holding foreign currency denominated rates, cash and cash equivalents and loans and receivables. In order to balance this exposure, the Group maintains a foreign currency accounts in a reputable commercial bank. The Group does not enter into derivatives to hedge the exposure. The Group’s cash and receivables denominated in foreign currency and converted into Peso using the closing exchange rates at each balance sheet date are summarized below.
2014 2013 Dollar Peso Dollar Peso Cash in banks $59,635 P=2,666,877 $94,533 P=4,197,265
As at December 31, 2014 and 2013, the closing functional currency exchange rate is P=44.72 and P=44.40 to US$1, respectively.
The following table represents the impact on the Group’s income before income tax brought about by reasonably possible changes in Peso to Dollar exchange rate (holding all other variables constant) as at December 31, 2014 and 2013 until its next financial reporting date:
Change in Peso to Dollar
Exchange Rate Effect on Income
before Income Tax 2014 Increase by 0.72% (P=19,202) Decrease by 0.72% 19,202
2013 Increase by 8.16% (P=342,497) Decrease by 8.16% 342,497
There is no other effect on the Group’s equity other than those already affecting profit or loss. 31. Capital Management
The primary objective of the Group’s capital management is to ensure that it maintains a strong credit rating and healthy capital ratios in order to support its business and maximize shareholder value.
In the light of changes in economic conditions, the Group manages dividend payments to shareholders, pay-off existing debts, return capital to shareholders or issue new shares. The Group mainly uses financing from local banks. The Group considers equity attributable to shareholders as capital. The Group manages its capital structure by keeping a net worth of between 30% to 50%

- 54 -
*SGVFS010389*
in relation to its total assets. The Group’s net worth ratio is 42% as at December 31, 2014 and 2013. No changes were made in the objectives, policies and processes during the year.
2014 2013 Common stock P=459,121,573 P=459,121,573 Additional paid-in capital 293,525,037 293,525,037 Retained earnings 2,546,335,563 1,810,521,305 3,298,982,173 2,563,167,915 Less cost of shares held in treasury 2,923,246 2,923,246 P=3,296,058,927 P=2,560,244,669
Total assets P=7,882,305,026 P=6,024,712,972
Net worth 42% 42%
As at December 31, 2014 and 2013, the Group was able to meet its objective. 32. Significant Agreements
a. Franchise Agreements TheGroup has various store franchise agreements with third parties for the operation of certain stores. The agreement includes a one-time franchise fee payment and an annual 7-Eleven charge for the franchisee, which is equal to a certain percentage of the franchised store’s gross profit. Details follow: 2014 2013 2012 Share in gross profit of franchisees P=1,534,585,425 P=1,265,753,174 P=602,379,025 Franchise fee 113,004,538 101,500,115 81,193,802 P=1,647,589,963 P=1,367,253,289 P=683,572,827
Receivable from franchisees as at December 31, 2014 and 2013 amounted to P=451,535,105and P=442,264,422, respectively (see Notes 5, 10, 29, and 30). Due to franchisees as at December 31, 2014 and 2013 amounted to P=128,356,232 and P=62,939,640, respectively (see Note 13).The Company also has outstanding deposits payable to franchisees amounting to P=124,767,926 and P=99,370,298 as at December 31, 2014 and 2013, respectively (see Note 14).
b. Service Agreements The Group has service agreements with third parties for the management and operation of certain stores. In consideration thereof, the store operator is entitled to a service fee based on a certain percentage of the store’s gross profit and operating expenses as stipulated in the service agreement. Service fees included under outside services shown as part of “Outside services” in “General and administrative expenses” account amounted toP=103,989,092 in 2014, P=140,848,888 in 2013and P=231,622,046 in 2012(see Note 19).The Group also has outstanding deposits payable to third parties in relation to service agreements amounting to P=95,268,832 and P=89,707,363 as at December 31, 2014 and 2013, respectively (see Note 14).

- 55 -
*SGVFS010389*
c. Commission Income The Group has entered into agreements with a phone card supplier and various third parties. Under the arrangements, the Group earns commission on the sale of phone cards and collection of bills payments based on a certain percentage of net sales and collections for the month and a fixed monthly rate. Commission income amounted toP=39,214,967,P=43,402,035 andP=67,396,391in 2014, 2013 and 2012, respectively.
d. 2014 Exclusivity Contract In 2014, the Group has entered into a 3-year exclusivity contract with a third party ice cream distributor in the Philippines effective January 2014 to December 2016. The contract indicates that the third party ice cream distributor will exclusively supply all ice cream products of 7-Eleven stores. The Group received a one-time signing bonus amounting to P=75,000,000 upon the effectivity of the exclusivity supply contract amortized over three years. Income from exclusivity contract included as part of “Marketing support funds” under “Marketing income” in profit or loss amounted to P=25,000,000 in 2014 (see Note 20). Deferred revenue as at December 31, 2014 amounted to P=50,000,000 (see Notes 13 and 16).
e. 2010 Exclusivity Contract The Group has entered into a 3-year exclusivity contract with a third party soda manufacturer in the Philippines effective April 2010 to March 2013. The contract indicates the third party soda manufacturer will exclusively supply all slurpee products of 7-Eleven. The Group received a one-time signing bonus amounting to P=4,464,286 upon the effectivity of the exclusivity supply contract amortized over three years. Income from exclusivity contract included as part of “Marketing support funds” under “Marketing income” in profit or loss amounted toP=372,023 and P=1,488,095 in 2013 and 2012, respectively (see Note 20). Deferred revenue as at December 31, 2014 and 2013 amounted to nil.
f. 2010 Signing Bonus In 2010, the Group collected a signing bonus amounting to P=2,232,143 from one of the Group’s food suppliers for awarding half of the Group’s existing Hotdog Stock Keeping Units (SKUs) to the food supplier for the next five years starting January 1, 2010. Income from exclusivity contract included as part of “Marketing support funds” under “Marketing income” in profit or loss amounted to P=446,429 both in 2014, 2013 and 2012 (see Note 20). Deferred revenue as at December 31, 2014 and 2013 amounted to nil and P=446,429, respectively (see Notes 13 and 16).
g. Memorandum of Agreement (MOA) with Chevron Philippines, Inc.
The Group has entered into MOA with Chevron Philippines, Inc. (CPI) on August 6, 2009, wherein CPI has granted the Group as authorized co-locator for a full term of three-years to establish operate and/or franchise its 7-Eleven stores in CPI service stations. Both parties have identified 22 CPI service stations, wherein the Group will give the Retailers of these service stations a Letter Offer to Franchise (LOF) 7-Eleven stores. Upon acceptance of the Retailers of the LOF, the Retailers will sign a Store Franchise Agreement (SFA) with the Group. If LOF is not accepted by one of the 22 original service stations identified, that service station will be replaced with another mutually acceptable service station site. Upon signing of the MOA, CPI executed a Caltex Retail Agreement with each of the 22 service station Retailers, which shall have a full term of three years and which will be co-terminus with the SFA.

- 56 -
*SGVFS010389*
As at December 31, 2014 and 2013, the Group has already opened 35 and 32 franchised serviced stations, respectively.
h. Licensing Agreement with Seven Eleven, Inc. (SEI)
The Group executed a licensing agreement with SEI, a stockholder organized in Texas, U.S.A. This grants the Group the exclusive right to use the 7-Eleven System in the Philippines. In accordance with the agreement, the Group pays, among others, royalty fee to SEI based on a certain percentage of monthly gross sales, net of gross receipts tax. Royalty fee amounted to P=204,755,907,P=171,714,747 and P=133,085,007 in 2014, 2013 and 2012, respectively (see Note 19). As at December 31, 2014 and 2013, royalty payable amounted to P=19,330,605 and P=16,305,559, respectively (see Note 13).
33. Segment Reporting
The Group considers the store operations as its only business segment based on its primary business activity. Franchising, renting of properties and commissioning on bills payment services are considered an integral part of the store operations. The Group’s identified operating segments below are consistent with the segments reported to the BOD, which is the Chief Operating Decision Maker of the Group. The products and services from which the store operations derive its revenues from are as follows:
• Merchandise sales • Franchise revenue • Marketing income • Rental income • Commission income • Interest income
The aforementioned revenues are all revenues from external customers.
The segment’s relevant financial information is as follows:
2014 2013 2012 Revenue Revenue from merchandise sales P=17,107,375,250 P=14,133,649,192 P=11,713,760,468 Franchise revenue 1,647,589,963 1,367,253,289 683,572,827 Marketing income 463,413,150 380,793,855 405,856,204 Rental income 51,118,568 48,341,871 45,751,718 Commission income 39,214,967 43,402,035 67,396,391 Interest income 5,741,549 7,165,804 5,377,093 Other income 353,231,243 214,886,062 123,025,663 P=19,667,684,690 P=16,195,492,108 P=13,044,740,364
Expenses Cost of merchandise sales P=12,861,596,475 P=10,661,629,518 P=8,553,239,221 General and administrative expenses: Depreciation and amortization 862,759,509 709,518,959 527,786,925 Others 4,653,614,327 3,810,866,107 3,257,088,253 Interest expense 16,195,818 16,247,890 16,596,830 Other expenses 18,249,864 13,799,871 14,595,186 18,412,415,993 15,212,062,345 12,369,306,415 Income before income tax 1,255,268,697 983,429,763 675,433,949 Provision for income tax 381,923,842 300,802,114 210,257,926

- 57 -
*SGVFS010389*
Segment Profit P=873,344,855 P=682,627,649 P=465,176,023
Segment Assets P=7,882,305,026 P= 6,024,712,972 P=4,571,816,164
Segment Liabilities P= 4,592,768,501 P= 3,483,479,852 P=2,662,650,411
Capital Expenditure for the Year P=1,653,573,106 P=1,179,270,533 P=858,674,993
34. Provisions and Contingencies
The Group is a party to various litigations and claims. All cases are in the normal course of business and are not deemed to be considered as material legal proceedings. Further, the cases are either pending in courts or under protest, the outcome of which are not presently determinable. Management and its legal counsel believe that the liability, if any, that may result from the outcome of these litigations and claims will not materially affect their financial position or financial performance.

- 58 -
*SGVFS010389*
As at December 31, 2014 and 2013, the Group has provisions amounting to P=8,718,853and P=13,704,073, respectively, and is reported as part of “Others” under “Accounts payable and accrued expenses” account in the consolidated balance sheets (see Note 12).
35. Note to Consolidated Statements of Cash Flows
The principal non-cash transaction of the Group under financing activities pertains to the issuance of stock dividends (see Note 17).
36. Reclassification of Accounts
The Group made reclassification of certain consolidated balance sheet and consolidated statement of comprehensive income accounts in its 2013 consolidated financial statements to conform with the 2014 consolidated financial statement presentation. The reclassifications have no impact on the 2013 profit or loss as well as the December 31, 2013 equity of the Group. A third statement of financial position as at the beginning of the preceding period is not presented because the reclassifications do not have a material impact on the consolidated balance sheets as at December 31, 2013 and January 1, 2013.
The consolidated balance sheet as at December 31, 2013 was restated to effect the reclassification of due to franchisees amounting to P=62,939,640 which was previously offset from “Receivables” account to “Other current liabilities” account, and noncurrent portion of due from franchisees amounting to P=44,763,037 from “Receivables” account to “Goodwill and other noncurrent assets” account. The consolidated statements of comprehensive income for the years ended December 31, 2013 and 2012 were restated to effect the reclassification of the marketing support funds amounting to P=34,657,908 in 2013 and P=30,087,947 in 2012 which were previously offset from the “Cost of merchandise sales” account to “Marketing income” account.

Philippine Seven Corporation Schedule of Receivables
2014 2013 Franchisees (Note 32) P=403,074,403 P=397,720,727 Suppliers 159,162,156 48,657,689 Employees 17,206,304 14,936,783 Store operators 12,048,431 12,547,006 Rent 5,363,909 4,760,464 Due from PhilSeven Foundation, Inc. (PFI)
(Note 25) 3,525,452 3,118,978 Current portion of lease receivable - net of unearned
interest income amounting to P=5,773 and P=96,445 as at December 31, 2014 and 2013, respectively (Notes 10 and 26) 3,742,000 3,086,114
Notes receivable 990,917 1,033,914 Insurance receivable 1,155,417 585,057 Others 2,078,334 1,358,499 608,347,323 487,805,231 Less allowance for impairment 18,960,182 18,960,182 P=589,387,141 P=468,845,049
The classes of receivables of the Group are as follows:
• Franchisees - pertains to receivables for the inventory loans obtained by the franchisees at the start of their store operations, cash deposits and deposits still in transit, negative balance on franchisees’ holding account and inventory variation noted during monthly store audits.
• Suppliers - pertains to receivables from the Group’s suppliers for display allowances, annual volume discount and commission income from different service providers.
• Employees - includes car loans, salary loans and cash shortages from stores which are charged to employees. Interest earned on receivable from employees amounted toP=13,660, P=17,037 and nil in 2014, 2013 and 2012, respectively (see Note 22).
• Store operators - pertains to the advances given to third party store operators under service agreements (see Note 32).
• Rent - pertains to receivables from sublease agreements with third parties, which are based on an agreed fixed monthly rate or as agreed upon by the parties.
• Lease receivable - pertains to a five-year sale and leaseback finance lease agreement entered by the Company with an armored car service provider (see Note 26).
• Notes receivable - pertains to a receivable from third party borrowers evidenced by a written promise of payment with a five-year term maturing on January 31, 2015.As at December 31, 2014 and 2013, unamortized discount amounted to nil and P=37,165, respectively. Accretion of interest income amounted to P=37,165, P=123,182 and P=236,517 in 2014, 2013 and 2012, respectively (see Note 22).
Receivables are noninterest-bearing and are generally on 30 to 90 day terms except for loans to employees, lease receivable and notes receivable with annual interest rates of 10.00%, 7.00% and 6.32%, respectively (see Note 26).
ANNEX 1
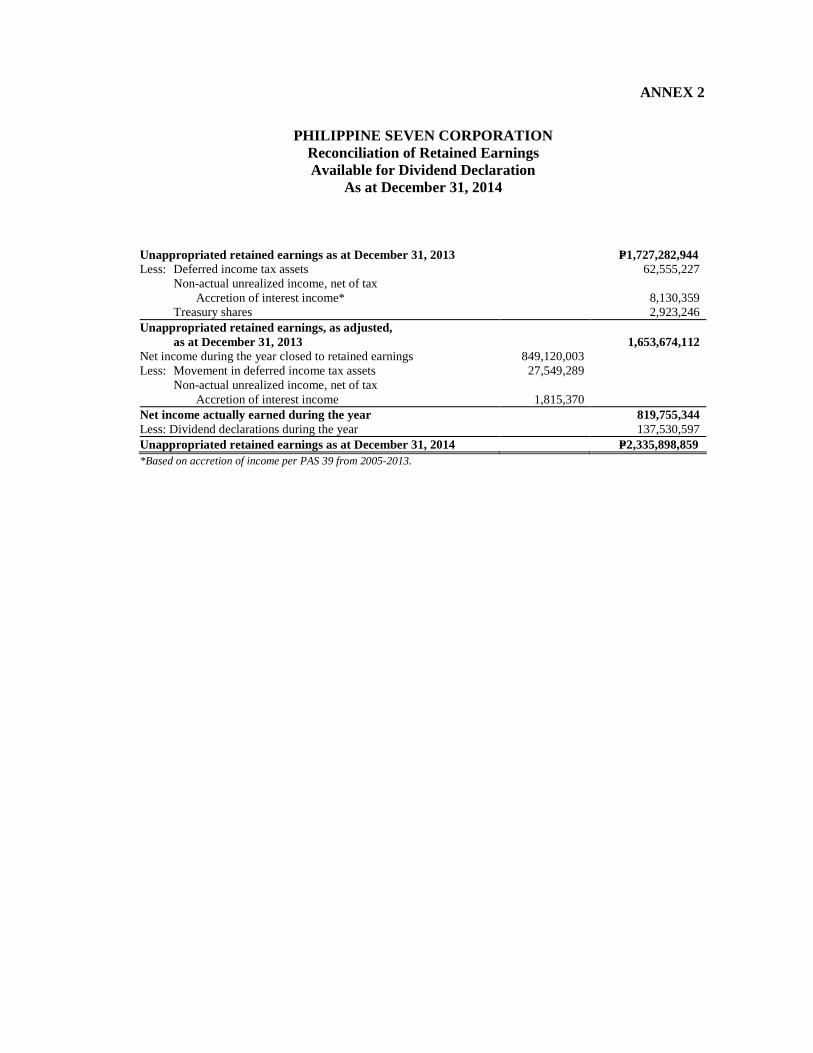
PHILIPPINE SEVEN CORPORATION Reconciliation of Retained Earnings Available for Dividend Declaration
As at December 31, 2014 Unappropriated retained earnings as at December 31, 2013 P=1,727,282,944 Less: Deferred income tax assets 62,555,227 Non-actual unrealized income, net of tax Accretion of interest income* 8,130,359 Treasury shares 2,923,246 Unappropriated retained earnings, as adjusted, as at December 31, 2013 1,653,674,112 Net income during the year closed to retained earnings 849,120,003 Less: Movement in deferred income tax assets 27,549,289 Non-actual unrealized income, net of tax Accretion of interest income 1,815,370 Net income actually earned during the year 819,755,344 Less: Dividend declarations during the year 137,530,597 Unappropriated retained earnings as at December 31, 2014 P=2,335,898,859 *Based on accretion of income per PAS 39 from 2005-2013.
ANNEX 2
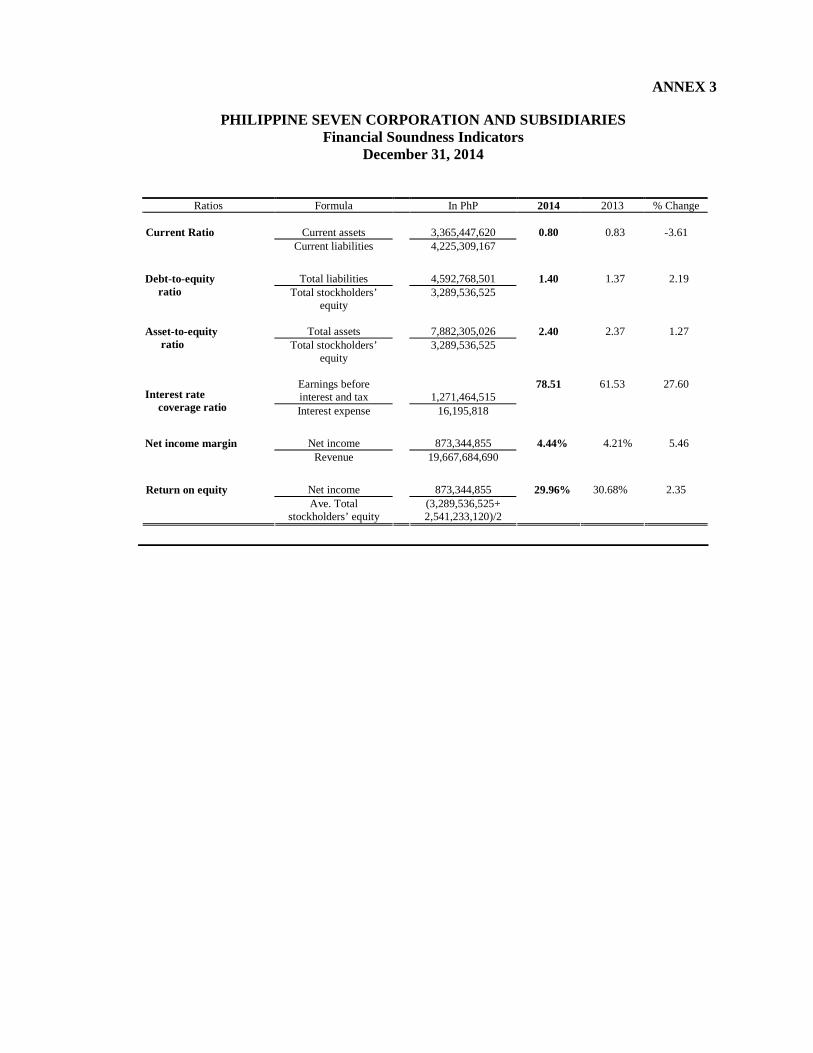
PHILIPPINE SEVEN CORPORATION AND SUBSIDIARIES
Financial Soundness Indicators December 31, 2014
Ratios Formula In PhP 2014 2013 % Change
Current assets
3,365,447,620 Current Ratio
Current liabilities 4,225,309,167
0.80
0.83
-3.61
Total liabilities
4,592,768,501
Debt-to-equity
ratio Total stockholders’ equity
3,289,536,525
1.40
1.37
2.19
Total assets
7,882,305,026
Asset-to-equity
ratio Total stockholders’ equity
3,289,536,525
2.40
2.37
1.27
Earnings before interest and tax
1,271,464,515 Interest rate
coverage ratio Interest expense 16,195,818
78.51
61.53
27.60
Net income
873,344,855
Net income margin
Revenue 19,667,684,690
4.44%
4.21%
5.46
Net income
873,344,855
Return on equity
Ave. Total stockholders’ equity
(3,289,536,525+ 2,541,233,120)/2
29.96%
30.68%
2.35
ANNEX 3

PHILIPPINE SEVEN CORPORATION AND SUBSIDIARIES
Map of the Relationship of the Companies within the Group December 31, 2014
Ultimate Parent Company
President Chain Store Corporation (100.00%)
Intermediate Parent Company
President Chain (BVI) Holdings, Limited (100.00%)
Immediate Parent Company
President Chain Store (Labuan) Holdings, Limited (51.56%)
Reporting Company
Philippine Seven Corporation (100.00%)
Subsidiary Convenience Distribution, Inc.
Subsidiary Store Sites Holding, Inc.
ANNEX 4

PHILIPPINE SEVEN CORPORATION AND SUBSIDIARIES List of Philippine Financial Reporting Standards (PFRSs) and
Interpretations Effective as at December 31, 2014 PHILIPPINE FINANCIAL REPORTING STANDARDS AND INTERPRETATIONS Effective as at December 31, 2014
Adopted Not
Adopted Not
Applicable
Framework for the Preparation and Presentation of Financial Statements Conceptual Framework Phase A: Objectives and qualitative characteristics
✔
PFRSs Practice Statement Management Commentary ✔
Philippine Financial Reporting Standards
First-time Adoption of Philippine Financial Reporting Standards
✔
Amendments to PFRS 1 and PAS 27: Cost of an Investment in a Subsidiary, Jointly Controlled Entity or Associate
✔
Amendments to PFRS 1: Additional Exemptions for First-time Adopters
✔
Amendment to PFRS 1: Limited Exemption from Comparative PFRS 7 Disclosures for First-time Adopters
✔
Amendments to PFRS 1: Severe Hyperinflation and Removal of Fixed Date for First-time Adopters
✔
Amendments to PFRS 1: Government Loans ✔
Amendments to PFRS 1: Borrowing Costs ✔
PFRS 1 (Revised)
Amendment to PFRS 1: Meaning of Effective PFRSs ✔
Share-based Payment ✔
Amendments to PFRS 2: Vesting Conditions and Cancellations
✔
Amendments to PFRS 2: Group Cash-settled Share-based Payment Transactions
✔
PFRS 2
Amendment to PFRS 2: Definition of Vesting Condition**
Not Early Adopted
Business Combinations ✔
Amendment to PFRS 3: Accounting for Contingent Consideration in a Business Combination**
Not Early Adopted
PFRS 3 (Revised)
Amendment to PFRS 3: Scope Exceptions for Joint Arrangements**
Not Early Adopted
Insurance Contracts ✔ PFRS 4
Amendments to PAS 39 and PFRS 4: Financial Guarantee Contracts
✔
ANNEX 5

PHILIPPINE FINANCIAL REPORTING STANDARDS AND INTERPRETATIONS Effective as at December 31, 2014
Adopted Not
Adopted
Not Applicable
PFRS 5 Non-current Assets Held for Sale and Discontinued Operations
✔
Amendments to PFRS 5: Changes in Methods of Disposals**
Not Early Adopted
PFRS 6 Exploration for and Evaluation of Mineral Resources ✔
Financial Instruments: Disclosures ✔
Amendments to PAS 39 and PFRS 7: Reclassification of Financial Assets
✔
Amendments to PAS 39 and PFRS 7: Reclassification of Financial Assets - Effective Date and Transition
✔
Amendments to PFRS 7: Improving Disclosures about Financial Instruments
✔
Amendments to PFRS 7: Disclosures - Transfers of Financial Assets
✔
Amendments to PFRS 7: Disclosures - Offsetting Financial Assets and Financial Liabilities
✔
Amendments to PFRS 7: Mandatory Effective Date of PFRS 9 and Transition Disclosures
✔
Amendments to PFRS 7: Disclosures - Servicing Contracts**
Not Early Adopted
PFRS 7
Amendments to PFRS 7: Applicability of the Amendments to PFRS 7 to Condensed Interim Financial Statements**
Not Early Adopted
Operating Segments ✔ PFRS 8
Amendments to PFRS 8: Aggregation of Operating Segments and Reconciliation of the Total of the Reportable Segments’ Assets to the Entity’s Assets**
Not Early Adopted
Financial Instruments* Not Early Adopted
Amendments to PFRS 9: Mandatory Effective Date of PFRS 9 and Transition Disclosures*
Not early Adopted
Amendments to PFRS 9: Hedge accounting and amendments to PFRS 9and PAS 39 (2013 version)**
Not Early Adopted
Financial Instruments (2014 or final version)** Not Early Adopted
PFRS 9
Financial Instruments (2010 version)* Not Early Adopted
Consolidated Financial Statements ✔
Amendments to PFRS 10: Investment Entities ✔
PFRS 10
Amendments to PFRS 10 and PAS 28: Sale or Contribution of Assets between an Investor and its Associate or Joint Venture**
Not Early Adopted
Joint Arrangements ✔ PFRS 11
Amendments to PFRS 11: Accounting for Acquisitions of Interests in Joint Operations**
Not Early Adopted
ANNEX 5
ANNEX 5

PHILIPPINE FINANCIAL REPORTING STANDARDS AND INTERPRETATIONS Effective as at December 31, 2014
Adopted Not
Adopted Not
Applicable
Disclosure of Interests in Other Entities ✔ PFRS 12
Amendments to PFRS 12: Investment Entities ✔
Fair Value Measurement ✔
Amendment to PFRS 13: Short-term Receivables and Payables
✔
PFRS 13
Amendment to PFRS 13: Portfolio Exception** Not Early Adopted
PFRS 14 Regulatory Deferral Accounts** Not Early Adopted
Philippine Accounting Standards
Presentation of Financial Statements ✔
Amendment to PAS 1: Capital Disclosures ✔
Amendments to PAS 32 and PAS 1: Puttable Financial Instruments and Obligations Arising on Liquidation
✔
Amendments to PAS 1: Presentation of Items of Other Comprehensive Income
✔
PAS 1 (Revised)
Amendments to PAS 1: Clarification of the requirements for comparative information
✔
PAS 2 Inventories ✔
PAS 7 Statement of Cash Flows ✔
PAS 8 Accounting Policies, Changes in Accounting Estimates and Errors
✔
PAS 10 Events after the Reporting Period ✔
PAS 11 Construction Contracts ✔
Income Taxes ✔ PAS 12
Amendment to PAS 12 - Deferred Tax: Recovery of Underlying Assets
✔
Property, Plant and Equipment ✔
Amendments to PAS 16: Classification of servicing equipment
✔
Amendments to PAS 16: Revaluation Method -Proportionate Restatement of Accumulated Depreciation/Amortization**
Not Early Adopted
Amendments to PAS 16 and PAS 38: Clarification of Acceptable Methods of Depreciation and Amortization**
Not Early Adopted
PAS 16
Amendment to PAS 16 and PAS 41: Bearer Plants** Not Early Adopted
PAS 17 Leases ✔
PAS 18 Revenue ✔
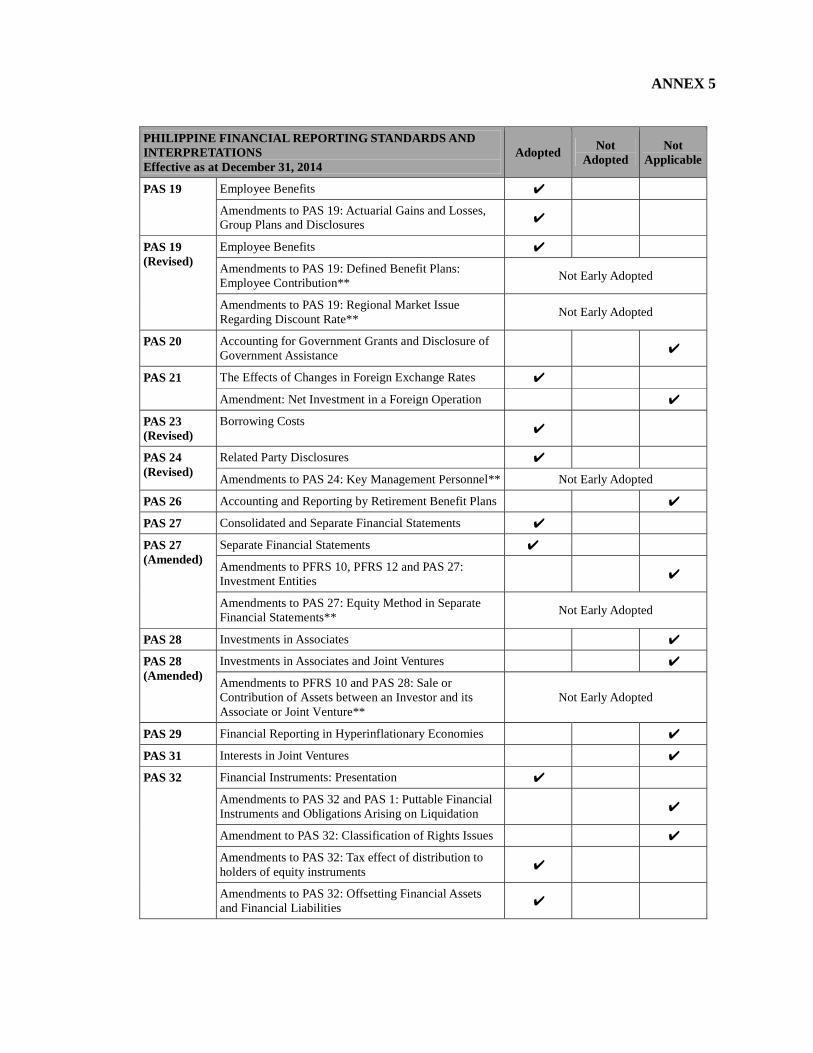
PHILIPPINE FINANCIAL REPORTING STANDARDS AND INTERPRETATIONS Effective as at December 31, 2014
Adopted Not
Adopted Not
Applicable
Employee Benefits ✔ PAS 19
Amendments to PAS 19: Actuarial Gains and Losses, Group Plans and Disclosures
✔
Employee Benefits ✔
Amendments to PAS 19: Defined Benefit Plans: Employee Contribution**
Not Early Adopted
PAS 19 (Revised)
Amendments to PAS 19: Regional Market Issue Regarding Discount Rate**
Not Early Adopted
PAS 20 Accounting for Government Grants and Disclosure of Government Assistance
✔
The Effects of Changes in Foreign Exchange Rates ✔ PAS 21
Amendment: Net Investment in a Foreign Operation ✔
PAS 23 (Revised)
Borrowing Costs ✔
Related Party Disclosures ✔ PAS 24 (Revised)
Amendments to PAS 24: Key Management Personnel** Not Early Adopted
PAS 26 Accounting and Reporting by Retirement Benefit Plans ✔
PAS 27 Consolidated and Separate Financial Statements ✔
Separate Financial Statements ✔
Amendments to PFRS 10, PFRS 12 and PAS 27: Investment Entities
✔
PAS 27 (Amended)
Amendments to PAS 27: Equity Method in Separate Financial Statements**
Not Early Adopted
PAS 28 Investments in Associates ✔
Investments in Associates and Joint Ventures ✔ PAS 28 (Amended)
Amendments to PFRS 10 and PAS 28: Sale or Contribution of Assets between an Investor and its Associate or Joint Venture**
Not Early Adopted
PAS 29 Financial Reporting in Hyperinflationary Economies ✔
PAS 31 Interests in Joint Ventures ✔
Financial Instruments: Presentation ✔
Amendments to PAS 32 and PAS 1: Puttable Financial Instruments and Obligations Arising on Liquidation
✔
Amendment to PAS 32: Classification of Rights Issues ✔
Amendments to PAS 32: Tax effect of distribution to holders of equity instruments
✔
PAS 32
Amendments to PAS 32: Offsetting Financial Assets and Financial Liabilities
✔
ANNEX 5

PHILIPPINE FINANCIAL REPORTING STANDARDS AND INTERPRETATIONS Effective as at December 31, 2014
Adopted Not
Adopted Not
Applicable
PAS 33 Earnings per Share ✔
Interim Financial Reporting ✔
Amendments to PAS 34: Interim financial reporting and segment information for total assets and liabilities
✔
PAS 34
Amendments to PAS 34: Disclosure of Information ‘Elsewhere in the Interim Financial Report’**
Not Early Adopted
Impairment of Assets ✔ PAS 36
Amendments to PAS 36: Recoverable Amount Disclosures for Non-Financial Assets
✔
PAS 37 Provisions, Contingent Liabilities and Contingent Assets
✔
Intangible Assets ✔
Amendments to PAS 16 and PAS 38: Revaluation Method - Proportionate Restatement of Accumulated Depreciation/Amortization**
Not Early Adopted
PAS 38
Amendment to PAS 16 and PAS 38: Clarification of Acceptable Methods of Depreciation and Amortization**
Not Early Adopted
Financial Instruments: Recognition and Measurement ✔
Amendments to PAS 39: Transition and Initial Recognition of Financial Assets and Financial Liabilities
✔
Amendments to PAS 39: Cash Flow Hedge Accounting of Forecast Intragroup Transactions
✔
Amendments to PAS 39: The Fair Value Option ✔
Amendments to PAS 39 and PFRS 4: Financial Guarantee Contracts
✔
Amendments to PAS 39 and PFRS 7: Reclassification of Financial Assets
✔
Amendments to PAS 39 and PFRS 7: Reclassification of Financial Assets - Effective Date and Transition
✔
Amendments to Philippine Interpretation IFRIC - 9 and PAS 39: Embedded Derivatives
✔
Amendment to PAS 39: Eligible Hedged Items ✔
PAS 39
Amendments to PAS 39: Novation of Derivatives and Continuation of Hedge Accounting
✔
Investment Property ✔ PAS 40
Amendments to PAS 40: Clarifying the Interrelationship between PFRS 3 and PAS 40 when Classifying Property as Investment Property or Owner-Occupied Property**
Not Early Adopted
ANNEX 5

PHILIPPINE FINANCIAL REPORTING STANDARDS AND INTERPRETATIONS Effective as at December 31, 2014
Adopted Not
Adopted Not
Applicable
Agriculture ✔ PAS 41
Amendment to PAS 16 and PAS 41: Bearer Plants** Not Early Adopted
Philippine Interpretations
IFRIC 1 Changes in Existing Decommissioning, Restoration and Similar Liabilities
✔
IFRIC 2 Members’ Share in Co-operative Entities and Similar Instruments
✔
IFRIC 4 Determining Whether an Arrangement Contains a Lease
✔
IFRIC 5 Rights to Interests arising from Decommissioning, Restoration and Environmental Rehabilitation Funds
✔
IFRIC 6 Liabilities arising from Participating in a Specific Market - Waste Electrical and Electronic Equipment
✔
IFRIC 7 Applying the Restatement Approach under PAS 29 Financial Reporting in Hyperinflationary Economies
✔
IFRIC 8 Scope of PFRS 2 ✔
IFRIC 9 Reassessment of Embedded Derivatives ✔
Amendments to Philippine Interpretation IFRIC - 9 and PAS 39,Embedded Derivatives
✔
IFRIC 10 Interim Financial Reporting and Impairment ✔
IFRIC 11 PFRS 2- Group and Treasury Share Transactions ✔
IFRIC 12 Service Concession Arrangements ✔
IFRIC 13 Customer Loyalty Programmes ✔
IFRIC 14 The Limit on a Defined Benefit Asset, Minimum Funding Requirements and their Interaction
✔
Amendments to Philippine Interpretations IFRIC- 14, Prepayments of a Minimum Funding Requirement
✔
IFRIC 15 Agreements for the Construction of Real Estate* Not Early Adopted
IFRIC 16 Hedges of a Net Investment in a Foreign Operation ✔
IFRIC 17 Distributions of Non-cash Assets to Owners ✔
IFRIC 18 Transfers of Assets from Customers ✔
IFRIC 19 Extinguishing Financial Liabilities with Equity Instruments
✔
IFRIC 20 Stripping Costs in the Production Phase of a Surface Mine
✔
IFRIC 21 Levies ✔
SIC-7 Introduction of the Euro ✔
SIC-10 Government Assistance - No Specific Relation to Operating Activities
✔
SIC-15 Operating Leases - Incentives ✔
ANNEX 5

PHILIPPINE FINANCIAL REPORTING STANDARDS AND INTERPRETATIONS Effective as at December 31, 2014
Adopted Not
Adopted Not
Applicable
SIC-25 Income Taxes - Changes in the Tax Status of an Entity or its Shareholders
✔
SIC-27 Evaluating the Substance of Transactions Involving the Legal Form of a Lease
✔
SIC-29 Service Concession Arrangements: Disclosures ✔
SIC-31 Revenue - Barter Transactions Involving Advertising Services
✔
SIC-32 Intangible Assets - Web Site Costs ✔
* Standards and interpretations which will become effective subsequent to December 31, 2014 ** Standards and amendments already approved by the Financial Reporting Standards Council (FRSC) but still for approval by the Board of Accountancy Note: Standards and interpretations tagged as “Not Applicable” are those standards and interpretations which
were adopted but the entity has no significant covered transaction as at and for the year ended December 31, 2014.
ANNEX 5
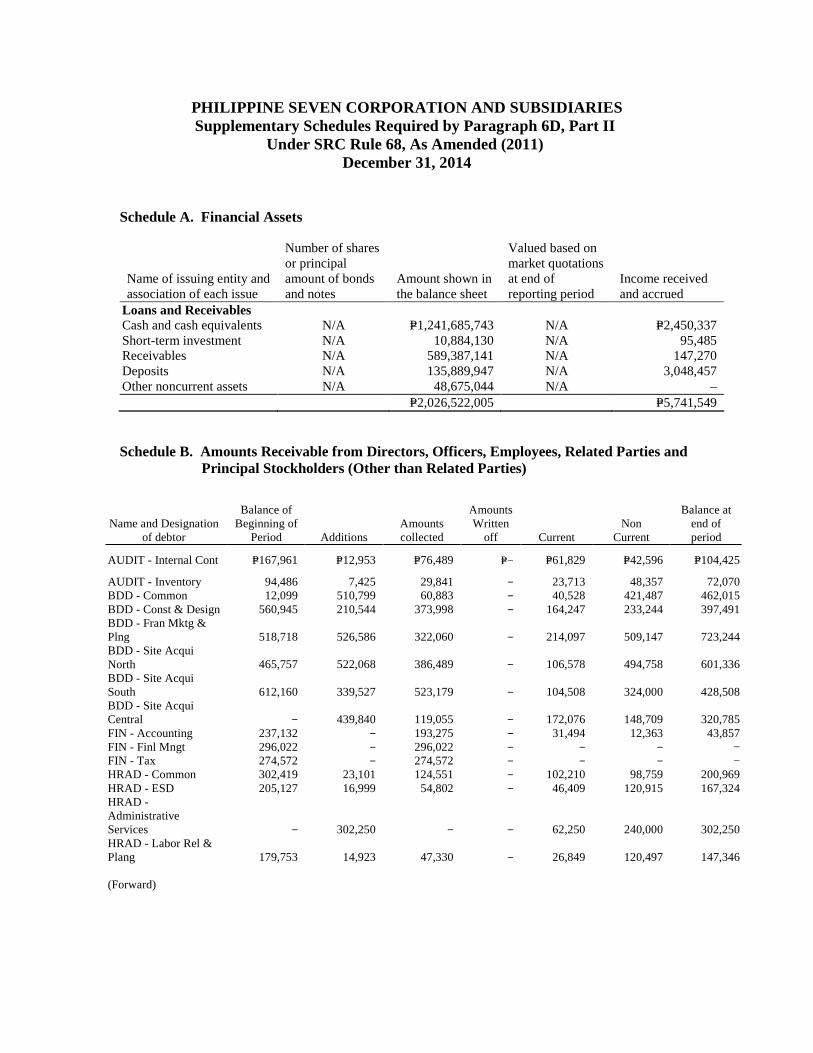
PHILIPPINE SEVEN CORPORATION AND SUBSIDIARIES Supplementary Schedules Required by Paragraph 6D, Part II
Under SRC Rule 68, As Amended (2011) December 31, 2014
Schedule A. Financial Assets
Name of issuing entity and association of each issue
Number of shares or principal amount of bonds and notes
Amount shown in the balance sheet
Valued based on market quotations at end of reporting period
Income received and accrued
Loans and Receivables
Cash and cash equivalents N/A P=1,241,685,743 N/A P=2,450,337 Short-term investment N/A 10,884,130 N/A 95,485 Receivables N/A 589,387,141 N/A 147,270 Deposits N/A 135,889,947 N/A 3,048,457 Other noncurrent assets N/A 48,675,044 N/A – P=2,026,522,005 P=5,741,549 Schedule B. Amounts Receivable from Directors, Officers, Employees, Related Parties and
Principal Stockholders (Other than Related Parties)
Name and Designation of debtor
Balance of Beginning of
Period Additions Amounts collected
Amounts Written
off Current Non
Current
Balance at end of period
AUDIT - Internal Cont P=167,961 P=12,953 P=76,489 P=− P=61,829 P=42,596 P=104,425
AUDIT - Inventory 94,486 7,425 29,841 − 23,713 48,357 72,070 BDD - Common 12,099 510,799 60,883 − 40,528 421,487 462,015 BDD - Const & Design 560,945 210,544 373,998 − 164,247 233,244 397,491 BDD - Fran Mktg & Plng 518,718 526,586 322,060 − 214,097 509,147 723,244 BDD - Site Acqui North 465,757 522,068 386,489 − 106,578 494,758 601,336 BDD - Site Acqui South 612,160 339,527 523,179 − 104,508 324,000 428,508 BDD - Site Acqui Central − 439,840 119,055 − 172,076 148,709 320,785 FIN - Accounting 237,132 − 193,275 − 31,494 12,363 43,857 FIN - Finl Mngt 296,022 − 296,022 − − − − FIN - Tax 274,572 − 274,572 − − − − HRAD - Common 302,419 23,101 124,551 − 102,210 98,759 200,969 HRAD - ESD 205,127 16,999 54,802 − 46,409 120,915 167,324 HRAD - Administrative Services − 302,250 − − 62,250 240,000 302,250 HRAD - Labor Rel & Plang 179,753 14,923 47,330 − 26,849 120,497 147,346 (Forward)
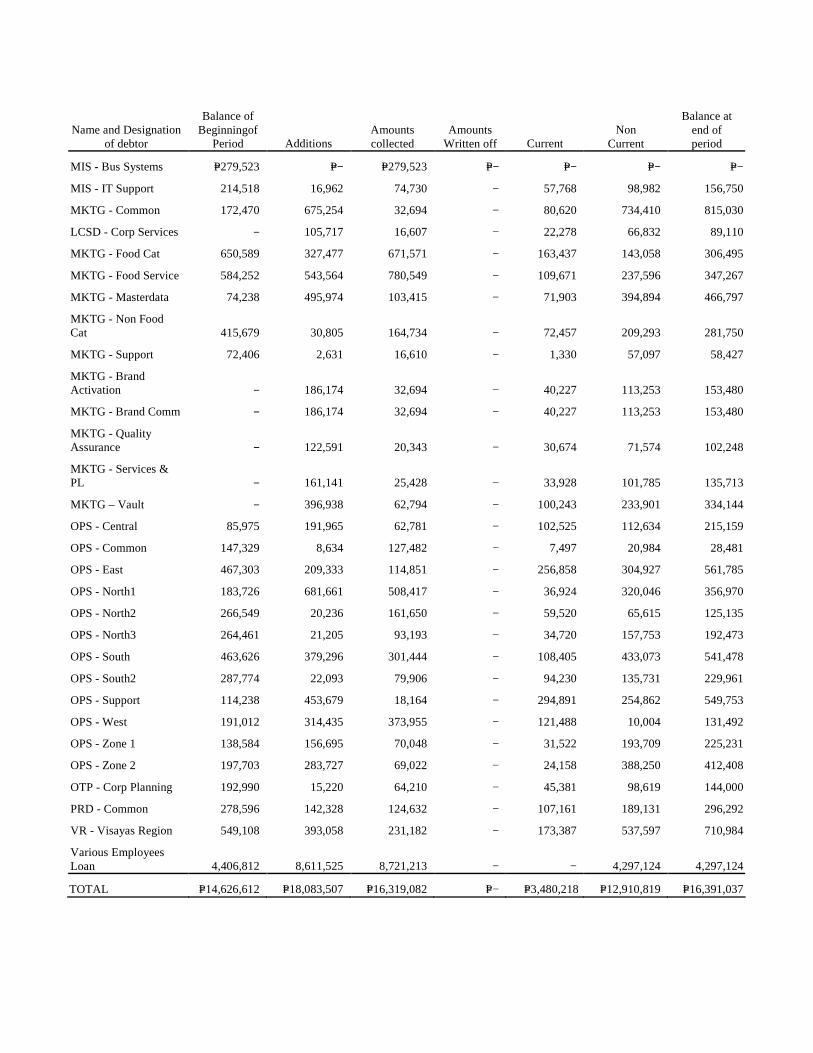
Name and Designation of debtor
Balance of Beginningof
Period Additions Amounts collected
Amounts Written off Current
Non Current
Balance at end of period
MIS - Bus Systems P=279,523 P=− P=279,523 P=− P=− P=− P=−
MIS - IT Support 214,518 16,962 74,730 − 57,768 98,982 156,750
MKTG - Common 172,470 675,254 32,694 − 80,620 734,410 815,030
LCSD - Corp Services − 105,717 16,607 − 22,278 66,832 89,110
MKTG - Food Cat 650,589 327,477 671,571 − 163,437 143,058 306,495
MKTG - Food Service 584,252 543,564 780,549 − 109,671 237,596 347,267
MKTG - Masterdata 74,238 495,974 103,415 − 71,903 394,894 466,797
MKTG - Non Food Cat 415,679 30,805 164,734 − 72,457 209,293 281,750
MKTG - Support 72,406 2,631 16,610 − 1,330 57,097 58,427
MKTG - Brand Activation − 186,174 32,694 − 40,227 113,253 153,480
MKTG - Brand Comm − 186,174 32,694 − 40,227 113,253 153,480
MKTG - Quality Assurance − 122,591 20,343 − 30,674 71,574 102,248
MKTG - Services & PL − 161,141 25,428 − 33,928 101,785 135,713
MKTG – Vault − 396,938 62,794 − 100,243 233,901 334,144
OPS - Central 85,975 191,965 62,781 − 102,525 112,634 215,159
OPS - Common 147,329 8,634 127,482 − 7,497 20,984 28,481
OPS - East 467,303 209,333 114,851 − 256,858 304,927 561,785
OPS - North1 183,726 681,661 508,417 − 36,924 320,046 356,970
OPS - North2 266,549 20,236 161,650 − 59,520 65,615 125,135
OPS - North3 264,461 21,205 93,193 − 34,720 157,753 192,473
OPS - South 463,626 379,296 301,444 − 108,405 433,073 541,478
OPS - South2 287,774 22,093 79,906 − 94,230 135,731 229,961
OPS - Support 114,238 453,679 18,164 − 294,891 254,862 549,753
OPS - West 191,012 314,435 373,955 − 121,488 10,004 131,492
OPS - Zone 1 138,584 156,695 70,048 − 31,522 193,709 225,231
OPS - Zone 2 197,703 283,727 69,022 − 24,158 388,250 412,408
OTP - Corp Planning 192,990 15,220 64,210 − 45,381 98,619 144,000
PRD - Common 278,596 142,328 124,632 − 107,161 189,131 296,292
VR - Visayas Region 549,108 393,058 231,182 − 173,387 537,597 710,984
Various Employees Loan 4,406,812 8,611,525 8,721,213 − − 4,297,124 4,297,124
TOTAL P=14,626,612 P=18,083,507 P=16,319,082 P=− P=3,480,218 P=12,910,819 P=16,391,037

Schedule C. Amounts Receivable from Related Parties which are eliminated during the consolidation of financial statements
Name and
Designation of Debtor
Balance of Beginning of Period Additions
Amounts collected
Amounts Written
off Current Non
Current
Balance at end of period
CONVENIENCE DISTRIBUTION,INC.-Subsidiary
P=3,667,288 P=3,262,290 P=− P=− P=6,929,578 P=− P=6,929,578
STORE SITES HOLDINGS,INC.-Subsidiary
376,086 1,172,795 1,035,518 − 513,363 − 513,363
Schedule D. Intangible Assets - Other Assets
Description Beginning
balance Additions at
cost
Charged to cost and
expenses
Charged to other
accounts
Other Charges
additions (deductions)
Ending balance
Software & Program Cost
P=2,886,285 P=1,247,000 P=655,605 P=– P=– P=3,477,680
Goodwill 65,567,524 – – – – 65,567,524
Schedule E. Long Term Debt
Title of Issue and type of obligation
Amount authorized by indenture
Amount shown under caption "Current portion
of long-term debt" in related balance sheet
Amount shown under caption " Long Term
Debt" in related balance sheet"
NONE – – –
Schedule F. Indebtedness to Related Parties (Long-Term Loans from Related Companies)
Balance at beginning of period Balance at end of period
NONE – –
Schedule G. Guarantees of Securities of Other Issuers
Name of issuing entity of securities guaranteed by the
company for which this statement is
filed
Title of issue of each class of
securities guaranteed
Total amount guaranteed and
outstanding
Amount owned by person for which statement is filed
Nature of Guarantee
NONE – – – –

Schedule H. Capital Stock
Title of Issue
Number of Shares
authorized
Number of shares issued
and outstanding
as shown under related balance sheet
caption
Number of shares
reserved for options,
warrants, conversion
and other rights
Number of shares held by related
parties
Directors, officers and employees Others
COMMON STOCK
600,000,000 458,435,323 – 236,376,070 12,954,811 209,104,442