Embed Size (px)
Citation preview

Zendesk Shareholder Letter Q1 2018 - 1
Shareholder Letter Q1 2018
May 1, 2018

Zendesk Shareholder Letter Q1 2018 - 2
Mikkel Svane CEO
Elena Gomez CFO
Marc CabiStrategy & IR
Q1 2018 Revenue
Q1 Y/Y Revenue Growth
Paid Customer Accounts
IntroductionWe achieved a major milestone during the first quarter by surpassing a
$500 million annual revenue run rate, making Zendesk the fastest-growing
dedicated customer service and engagement platform. How did we get
there? By staying true to our origins while also growing entirely new areas
of our business. We have extended our reach with small and midsized
organizations, while also building our enterprise business—focused on larger
companies—which represents a significant part of our revenue today.
We believe that our success in both areas is a reflection of the broad appeal
of our products. Over the four years since our IPO, our annual revenue run
rate has grown at a compounded annual growth rate of 50% from the $100
million that we reported in May 2014 to more than $500 million today. We
now have more than 125,000 paid customer accounts that are using Zendesk
to offer service and support in more than 30 languages.
$129.8M
38%
125,000
Note: All results and guidance in this letter are based on the new revenue recognition standard ASC 606.

Zendesk Shareholder Letter Q1 2018 - 3
First Quarter of 2018 (in thousands, except per share data)
Three months ended March 31,
GAAP results 2018 2017 *As adjusted
Revenue $ 129,791 $ 93,888
Gross profit 90,735 65,781
Gross margin 69.9% 70.1%
Operating loss $ (33,615) $ (25,261)
Operating margin -25.9% -26.9%
Net loss $ (29,325) $ (25,081)
Net loss per share, basic and diluted $ (0.28) $ (0.26)
Non-GAAP results
Non-GAAP gross profit $ 95,067 $ 69,314
Non-GAAP gross margin 73.2% 73.8%
Non-GAAP operating loss $ (2,994) $ (3,441)
Non-GAAP operating margin -2.3% -3.7%
Non-GAAP net income (loss) $ 2,016 $ (3,261)
Non-GAAP net income (loss) per share, basic and diluted $ 0.02 $ (0.03)
In the first quarter of 2018, we delivered $129.8 million in revenue, an
increase of 38% year over year. Our paid customer account growth in the
first quarter was healthy at 23% year over year, and the dollar-based net
expansion rate for existing customers was 120%. Our growth was strong
across both enterprise customers and small and midsized customers.
We expect continued growth in both areas throughout the year thanks
to our focus on accelerating our push upmarket and further maturing our
omnichannel offering. We are expanding our portfolio of products designed
for larger organizations, while improving the effectiveness of our enterprise
sales teams and go-to-market efforts. In April, we introduced Zendesk Guide
Enterprise—our artificial intelligence-powered self-service product for larger
companies—and saw momentum both in attracting new enterprise customers
and in growing the size of deals with larger customers. We view Zendesk
Support MRR coming from customers with 100 or more Support agents as a
proxy of our growth upmarket, and that metric ended the first quarter at 38%
compared to 34% a year ago.
Our omnichannel product development also advanced during the quarter.
We integrated more channels in our Embeddables offering, and we saw more
customers of all sizes using multiple products. MRR from customers with two
or more products grew more than 80% year over year. We believe we have
a particularly large opportunity to sell our omnichannel offering to small and
midsized organizations that are seeking to better connect and manage all of
their customer conversations.
*Adjusted to reflect the adoption of ASC 606.

Zendesk Shareholder Letter Q1 2018 - 4
Enterprise Momentum We continue to accelerate our push upmarket with investments in
broadening our go-to-market capabilities and evolving our products for
more complex use cases. Given our solid growth in revenue during the first
quarter and a healthy portfolio of larger customer opportunities, we believe
we are off to a strong start for 2018.
A big part of our go-to-market investments remains focused on hiring sales
expertise to pursue new opportunities with larger enterprises. In addition,
we already serve a large population of enterprise companies in which we
can expand into new use cases. With a new SVP of worldwide sales in
place and a focus on sales team stability as we grow, we have seen positive
results both in sales execution and productivity.
Supporting our efforts to increase success with enterprise customers, we
have further expanded our capabilities in both pre-sales technical consulting
as well as a broader set of professional services. During the first quarter of
2018, our revenue from professional services continued to grow at a faster
rate than overall revenue growth, although professional services revenue
remains less than 5% of our total revenue.
Founded in 1966, Peet’s Coffee has more than 400
retail locations and sells its specialty coffee and tea
products in more than 15,000 grocery stores in the
United States. A Zendesk customer for three years,
Peet’s uses Zendesk for several internal teams—
including IT, sales operations, and accounting—and
manages its online customer interactions with
Zendesk Support and Chat. In 2017, customer
service and internal teams solved almost 100,000
tickets in Support. Thanks to Zendesk’s ease of use,
Peet’s can easily roll out Zendesk to new teams to
be administered and managed by business users,
without burdening its IT team.
Products Used

Zendesk Shareholder Letter Q1 2018 - 5
Zendesk Guide and Artificial Intelligence (AI)
As part of our enterprise expansion initiatives, we have focused on enhancing our family of products
with capabilities and features aimed at larger organizations and complex use cases. In April, we
launched our third enterprise-focused product in the past nine months: Guide Enterprise, which joins
Chat Enterprise and Talk Enterprise. Guide Enterprise helps our largest customers identify knowledge
gaps in customer service content and collaborate more easily across their extended teams.
With Guide Enterprise, we released our newest AI-powered feature: Content Cues, which works
in conjunction with Answer Bot to help businesses create robust self-service experiences. While
Answer Bot automates responses to customers, the Content Cues algorithm reviews questions from
customers and existing help center articles to suggest topics that are missing or need improvement.
With this guidance, content teams can be more proactive and efficient in optimizing the quality and
comprehensiveness of their help center content.
Guide Enterprise’s advanced workflow and approvals feature, called Team Publishing, makes it
easy for large organizations to collaborate on knowledge base content by getting their agents and
team members more involved in the process. Customers found that Team Publishing increased the
percentage of support agents who contribute to their organization’s knowledge base by approximately
three times.

Zendesk Shareholder Letter Q1 2018 - 6
Stanley Black & Decker is a Fortune 500 company and
leading provider of tools and storage, commercial
electronic security solutions, and engineered
fastening systems. Within three weeks of signing off
on a multiproduct deployment that includes Zendesk
Support, Guide, Chat, and Talk, the globally distributed
Stanley Black & Decker support teams were up and
running on all channels after only a single day of
training, thanks to help from the Zendesk Professional
Services team. Agents support customers in English,
Spanish, Portuguese, and Turkish, and the company
plans to add additional language support in the coming
months. The company has integrated more than 50
Facebook pages into Support and implemented the
Web Widget on its support pages.
Implementation Time3 weeks
CSAT90%
Products Used
Omnichannel UpdateDelivering true omnichannel capabilities to our small and midsized customers
is a priority in 2018. Our expanded omnichannel approach delivers additional
value to our customers, promotes higher engagement across our product
portfolio, and is expected to improve our customer retention and expansion.
As part of our goal to mature our omnichannel offering, we introduced
additional features in the first quarter that integrate more channels into the
customer experience and provide greater visibility into performance metrics
across channels.
Part of our Embeddables offering, the Web Widget delivers support directly
within any web page. We added Zendesk Talk to the widget with the limited
availability feature Request a Callback, so customers can click to receive a
phone call from an agent. When the feature becomes generally available,
our customers using our Support, Talk, Chat, and Guide products will be
able to integrate email, phone, live chat, and self-service support all in the
same online experience for their customers. Additionally, we launched a
beta application called Omnichannel Dashboard that provides consolidated
access to real-time performance monitoring across channels.
Zendesk Shareholder Letter Q1 2018 - 7
Timeline
Paid customer accounts
Employee count
Timeline not to scale.

Zendesk Shareholder Letter Q1 2018 - 8
Infrastructure InvestmentsOur transition from co-located data centers to cloud infrastructure is
progressing as planned. Throughout 2017, we made investments to ensure
each of our customers has a successful outcome as they are transitioned
to cloud infrastructure. As of the end of the first quarter of 2018, we have
moved nearly 75% of our customers to Amazon Web Services. We anticipate
completing the full transition by the end of the fourth quarter of this year.
Our investments in cloud services-based infrastructure ensure Zendesk
maintains flexibility and agility as it scales to meet the requirements of our
largest customers.
GDPR
As we prepare for the EU General Data Protection Regulation (GDPR) to take
effect on May 25, 2018, we have continued to reap the benefits of our earlier
data privacy investments, including the approval of our binding corporate
rules for data processors and data controllers and the certification of compli-
ance with the EU-U.S. and Swiss-U.S. Privacy Shield Frameworks. In prepa-
ration for the GDPR, we have built upon these investments by increasing our
efforts to ensure that our products have the functionality necessary to allow
our customers to comply with the GDPR. Additionally, we have delivered
regional webinars for our customers, provided a detailed EU Data Protec-
tion microsite to explain the product features with which our customers can
support their GDPR compliance programs, and developed extensive internal
and external resources. Following the effective date of the GDPR, we look
forward to the continued opportunity to ensure that our customer base has
the tools necessary within our products to serve their global end users.
Established in 1954, Relais & Châteaux is an
association of more than 560 landmark hotels and
restaurants operated by independent innkeepers,
chefs, and owners, who share a passion for their
businesses and a desire for authenticity in their
relationships with their clientele. Last year, they
sought a new partner to optimize their customer
service and operations. “We have a luxury image,
and we absolutely wanted to improve the quality
of service of our call centers and to monitor each
request with a real, personalized answer,” explains
Arnaud Wielgus, Chief Commercial and Marketing
Officer. “Zendesk will align us with the new digital
standards of the industry.”
Products Used
Zendesk Shareholder Letter Q1 2018 - 9
CustomersAmong the customers to join us or expand with us recently include:
Breuninger
A German department store selling clothing and premium household goods
Euro Car Parts
A car parts and accessories distributor with 200+ U.K. and Ireland locations
Glovo
An on-demand delivery service with couriers in Central and South America
and Europe
Grab
A Singapore-based ride sharing and logistics services company
Huobi
A digital currency trading platform and exchange based in Beijing
N Brown Group Plc
An online retailer offering clothing, footwear, and homewares
Peet’s Coffee
A California-based specialty coffee roaster and retailer
Relais & Châteaux
A global association of individually owned and operated luxury hotels and
restaurants
Stanley Black & Decker
A manufacturer of tools and hardware, and provider of security products
Trivago
One of the world’s largest hotel price comparison sites
Vorwerk
A German-based distributor of household products and appliances

Zendesk Shareholder Letter Q1 2018 - 10
% of total quarter-ending Support MRR from paid customer accounts with 100+ Support agents
38%100+ agentsQ1 2018
Operating MetricsA key metric we use to gauge our penetration
within larger organizations is represented by
the percentage of Support MRR generated by
customers with 100 or more Support agents. That
percentage remained strong at 38% at the end of
the first quarter of 2018, compared to 38% at the
end of the fourth quarter of 2017 and 34% at the
end of the first quarter of 2017.
As a proxy of our success with upmarket
opportunities, we measure our number of
contracts signed with an annual value of $50,000
or greater. In the first quarter of 2018, the number
of these contracts we closed was over 60%
greater than in the first quarter of 2017, while the
average size of those transactions was larger as
compared to the same period last year.
Our dollar-based net expansion rate, which we
use to quantify our annual expansion within
existing customers, increased by one percentage
point to end the first quarter at 120%, compared
to 119% at the end of the fourth quarter of 2017.
Our dollar-based net expansion rate was 115%
at the end of the first quarter of 2017. Consistent
with expectations in prior quarters, we expect our
dollar-based net expansion rate to remain in the
110% - 120% range over the next several quarters.

Zendesk Shareholder Letter Q1 2018 - 11
Corporate Social ResponsibiltyCorporate social responsibility (CSR) has long been an
important part of Zendesk’s culture and brand, and we believe
it is gaining even more significance to our business. We view
CSR as a critical way to build greater empathy among our
employees and increase their engagement both with our
community and their work.
We previously shared results of a study we sponsored with
Drexel University, which found that our customer advocates
who volunteered at least once every two months were three
times more likely to be rated in the top third of the company
for empathy. We believe this result is significant because of
the growing importance of empathy in business generally. As
automation increases across industries, it is leading to an even
bigger expectation from customers that the companies they do
business with act more human than ever before. Meeting this
expectation requires empathetic employees who are engaged
with one another and their work.
Within our own company, we continue to see strong interest in
volunteerism among our employees and believe it helps both
engage and retain current employees while attracting new
talent. In the first quarter of 2018 alone, Zendesk employees
invested more than 3,100 hours in community engagement and
volunteering through Zendesk programs.

Zendesk Shareholder Letter Q1 2018 - 12
Select Financial Measures (in millions, except per share data)
Three months ended
March 31, 2018December 31, 2017
*As adjusted
March 31, 2017 *As adjusted
Comments
GAAP results
Revenue $ 129.8 $ 121.9 $93.9 Up 6.5% q/q and 38.2% y/y largely due to a strong dollar-based net expansion rate and growth in paid customer accounts
Gross margin 69.9% 71.3% 70.1%
Declined 140 basis points (bps) q/q and 20 bps y/y largely due to additional costs to migrate customers from co-located data centers to cloud infrastructure We expect to incur up to approximately 100 bps of additional depreciation and related costs in each quarter until all customers have been transitioned
Operating loss $ (33.6) $ (26.9) $ (25.3)
Operating margin -25.9% -22.0% -26.9%
Declined 390 bps q/q largely due to higher headcount and additonal costs to migrate customers from co-located data centers to cloud infrastructure Improved 100 bps y/y largely due to scale as revenue growth outpaced operating expenses growth
Non-GAAP results
Non-GAAP gross margin 73.2% 74.2% 73.8%
Declined 100 bps q/q and 60 bps y/y largely due to additional costs to migrate customers from co-located data centers to cloud infrastructure We expect to incur up to approximately 100 bps of additional depreciation and related costs in each quarter until all customers have been transitioned
Non-GAAP operating loss $ (3.0) $ (0.9) $ (3.4)
Non-GAAP operating margin -2.3% -0.7% -3.7%
Declined 160 bps q/q largely due to higher headcount and additonal costs to migrate customers from co-located data centers to cloud infrastructure Improved 140 bps y/y largely due to scale as revenue growth outpaced operating expenses growth
Other financial measures
Net cash provided by operating activities $ 16.2 $ 17.3 $ 7.3
Free cash flow (non-GAAP) $ 7.1 $ 12.0 $ 0.6 Net cash provided by operating activities, less purchases of property and equipment and internal-use software development costs
Cash and cash equivalents $ 609.2 $ 109.4 $ 109.3 Increased largely due to issuance of $575 million in convertible senior notes, offset by the cost of the capped call and issuance costs
Marketable securities $ 250.5 $ 235.0 $ 206.8
Non-GAAP results exclude the following
Share-based compensation and related expenses $ 29.2 $ 24.5 $ 20.9 Increased q/q and y/y largely due to higher headcount, higher share price, and timing of awards
Amortization of purchased intangibles $ 0.7 $ 0.7 $ 0.9
Acquisition-related expenses $ 0.7 $ 0.7 —
*Adjusted to reflect the adoption of ASC 606. *Quarter-over-quarter comparisons (q/q) are for the three months ended March 31, 2018, compared to the three months ended December 31, 2017. *Year-over-year comparisons (y/y) are for the three months ended March 31, 2018, compared to the three months ended March 31, 2017.

Zendesk Shareholder Letter Q1 2018 - 13
GuidanceFor the quarter ending June 30, 2018, we expect to report:
• Revenue in the range of $136.0 - 138.0 million
• GAAP operating income (loss) in the range of $(34.0) - (32.0) million, which includes share-based compensation and related expenses of approximately $30.7 million, amortization of purchased intangibles of approximately $0.7 million, and acquisition-related expenses of approximately $0.6 million
• Non-GAAP operating income (loss) in the range of $(2.0) - 0.0 million, which excludes share-based compensation and related expenses of approximately $30.7 million, amortization of purchased intangibles of approximately $0.7 million, and acquisition-related expenses of approximately $0.6 million
• Approximately 105.2 million weighted average shares outstanding (basic)
• Approximately 109.9 million weighted average shares outstanding (diluted)
For the full year 2018, we expect to report:
• Revenue in the range of $565.0 - 572.0 million
• GAAP operating income (loss) in the range of $(132.0) - (127.0) million, which includes share-based compensation and related expenses of approximately $126.8 million, amortization of purchased intangibles of approximately $2.7 million, and acquisition-related expenses of approximately $2.5 million
• Non-GAAP operating income (loss) in the range of $0.0 - 5.0 million, which excludes share-based compensation and related expenses of approximately $126.8 million, amortization of purchased intangibles of approximately $2.7 million, and acquisition-related expenses of approximately $2.5 million
• Approximately 106.0 million weighted average shares outstanding (basic)
• Approximately 111.8 million weighted average shares outstanding (diluted)
• Free cash flow in the range of $25.0 - 30.0 million
We have not reconciled free cash flow guidance to net cash from operating
activities for the full year of 2018 because we do not provide guidance on
the reconciling items between net cash from operating activities and free
cash flow as a result of the uncertainty regarding, and the potential variability
of, these items. The actual amount of such reconciling items will have a
significant impact on our free cash flow and, accordingly, a reconciliation of
net cash from operating activities to free cash flow for the full year of 2018 is
not available without unreasonable effort.
Zendesk’s estimates of share-based compensation and related expenses,
amortization of purchased intangibles, and acquisition-related expenses in
future periods assume, among other things, the occurrence of no additional
acquisitions, investments or restructurings, and no further revisions to share-
based compensation and related expenses.

Zendesk Shareholder Letter Q1 2018 - 14
Condensed consolidated statements of operations(In thousands, except per share data; unaudited)
Three months ended March 31,
20182017
*As adjusted
Revenue $129,791 $93,888
Cost of revenue 39,056 28,107
Gross profit 90,735 65,781
Operating expenses:
Research and development 37,085 26,456
Sales and marketing 65,058 46,269
General and administrative 22,207 18,317
Total operating expenses 124,350 91,042
Operating loss (33,615) (25,261)
Other income, net 1,000 218
Loss before provision for (benefit from) income taxes (32,615) (25,043)
Provision for (benefit from) income taxes (3,290) 38
Net loss $(29,325) $(25,081)
Net loss per share, basic and diluted $(0.28) $(0.26)
Weighted-average shares used to compute net loss per share, basic and diluted 103,692 97,475
*Adjusted to reflect the adoption of ASC 606.

Zendesk Shareholder Letter Q1 2018 - 15
Condensed consolidated balance sheets(In thousands, except par value; unaudited)
March 31, 2018 December 31, 2017
Assets *As adjusted
Current assets:
Cash and cash equivalents $609,229 $109,370
Marketable securities 128,751 137,576
Accounts receivable, net of allowance for doubtful accounts of $1,445 and $1,252 as of March 31, 2018 and December 31, 2017, respectively
52,738 57,096
Deferred costs 17,010 15,771
Prepaid expenses and other current assets 29,412 24,165
Total current assets 837,140 343,978
Marketable securities, noncurrent 121,754 97,447
Property and equipment, net 61,000 59,157
Deferred costs, noncurrent 16,851 15,395
Goodwill and intangible assets, net 66,316 67,034
Other assets 9,462 8,359
Total assets $1,112,523 $591,370
Liabilities and stockholders’ equity
Current liabilities:
Accounts payable $6,586 $5,307
Accrued liabilities 37,633 21,876
Accrued compensation and related benefits 33,142 29,017
Deferred revenue 183,936 173,147
Total current liabilities 261,297 229,347
Convertible senior notes, net 439,953 —
Deferred revenue, noncurrent 1,334 1,213
Other liabilities 9,286 6,626
Total liabilities 711,870 237,186
Stockholders’ equity
Preferred stock, par value $0.01 per share — —
Common stock, par value $0.01 per share 1,042 1,031
Additional paid-in capital 830,741 753,568
Accumulated other comprehensive loss (3,762) (2,372)
Accumulated deficit (427,368) (398,043)
Total stockholders’ equity 400,653 354,184
Total liabilities and stockholders’ equity $1,112,523 $591,370 *Adjusted to reflect the adoption of ASC 606.
Zendesk Shareholder Letter Q1 2018 - 16
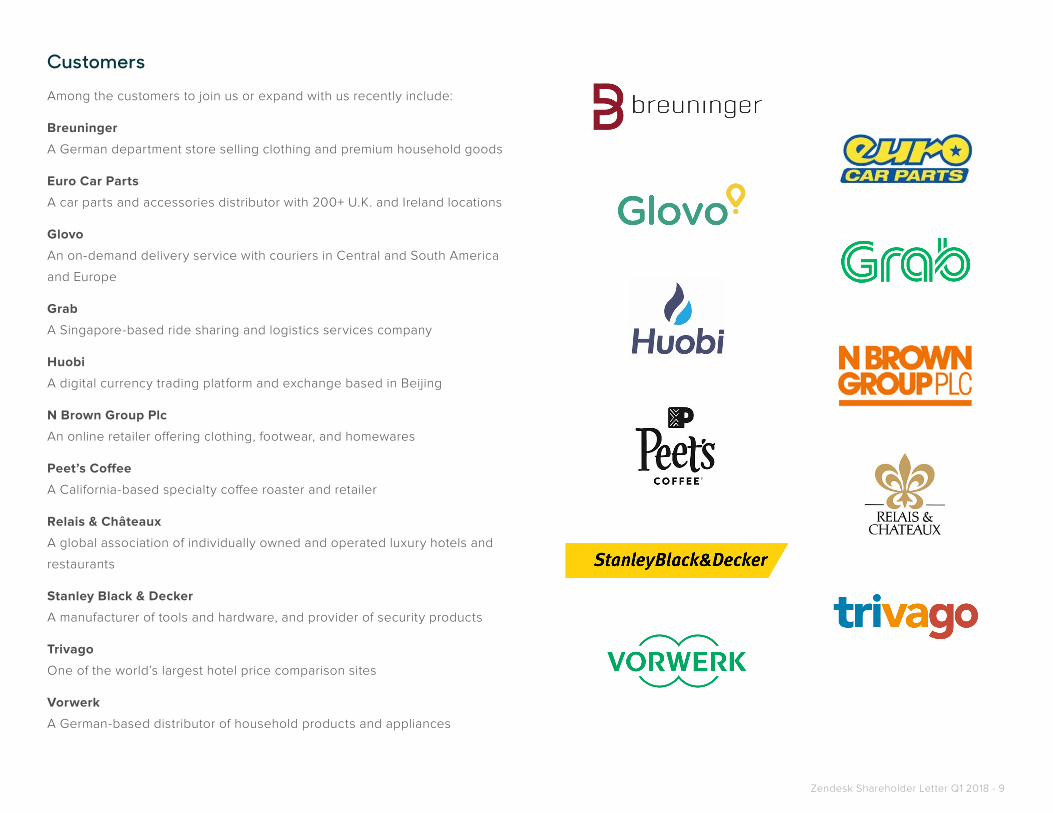
Condensed consolidated statements of cash flows(In thousands; unaudited)
Three months ended March 31,
20182017
*As adjusted
Cash flows from operating activities
Net loss $(29,325) $(25,081)
Adjustments to reconcile net loss to net cash provided by operating activities:
Depreciation and amortization 9,865 7,923
Share-based compensation 26,988 19,104
Amortization of deferred costs 4,510 3,179
Amortization of debt discount and issuance costs 720 —
Other 250 697
Changes in operating assets and liabilities:
Accounts receivable 3,691 (2,316)
Prepaid expenses and other current assets (3,364) (380)
Deferred costs (7,043) (4,102)
Other assets and liabilities (12,027) (332)
Accounts payable 1,052 1,958
Accrued liabilities 10,986 2,524 Accrued compensation and related benefits (971) (2,596)
Deferred revenue 10,910 6,704
Net cash provided by operating activities 16,242 7,282
Cash flows from investing activities
Purchases of property and equipment (6,808) (4,791)
Internal-use software development costs (2,344) (1,852)
Purchases of marketable securities (78,321) (40,758)
Proceeds from maturities of marketable securities 55,263 31,654
Proceeds from sales of marketable securities 6,982 8,602
Net cash used in investing activities (25,228) (7,145)
Cash flows from financing activities
Proceeds from issuance of convertible senior notes, net of issuance costs paid of $12,937 562,063 —
Purchase of capped call related to convertible senior notes (63,940) —
Proceeds from exercises of employee stock options 6,193 11,689
Proceeds from employee stock purchase plan 5,096 3,844
Taxes paid related to net share settlement of share-based awards (734) (154)
Net cash provided by financing activities 508,678 15,379
Effect of exchange rate changes on cash, cash equivalents and restricted cash (35) 198
Net increase in cash, cash equivalents and restricted cash 499,657 15,714
Cash, cash equivalents and restricted cash at beginning of period 110,888 95,062
Cash, cash equivalents and restricted cash at end of period $610,545 $110,776
*Adjusted to reflect the adoption of ASC 606 and ASU 2016-18.

Zendesk Shareholder Letter Q1 2018 - 17
Non-GAAP results(In thousands, except per share data)
The following table shows Zendesk’s GAAP results reconciled to non-GAAP results included in this letter.
Three months ended March 31,
20182017
*As adjusted
Reconciliation of gross profit and gross margin
GAAP gross profit $90,735 $65,781
Plus: Share-based compensation 3,098 2,104
Plus: Employer tax related to employee stock transactions 260 169
Plus: Amortization of purchased intangibles 612 830
Plus: Amortization of share-based compensation capitalized in internal-use software 362 430
Non-GAAP gross profit $95,067 $69,314
GAAP gross margin 70% 70%
Non-GAAP adjustments 3% 4%
Non-GAAP gross margin 73% 74%
Reconciliation of operating expenses
GAAP research and development $37,085 $26,456
Less: Share-based compensation (10,231) (6,914)
Less: Employer tax related to employee stock transactions (742) (548)
Less: Acquisition-related expenses (384) —
Non-GAAP research and development $25,728 $18,994
GAAP research and development as percentage of revenue 29% 28%
Non-GAAP research and development as percentage of revenue 20% 20%
GAAP sales and marketing $65,058 $46,269
Less: Share-based compensation (8,007) (5,524)
Less: Employer tax related to employee stock transactions (575) (367)
Less: Amortization of purchased intangibles (110) (102)
Less: Acquisition-related expenses (281) —
Non-GAAP sales and marketing $56,085 $40,276
GAAP sales and marketing as percentage of revenue 50% 49%
Non-GAAP sales and marketing as percentage of revenue 43% 43%
*Adjusted to reflect the adoption of ASC 606.
Zendesk Shareholder Letter Q1 2018 - 18
(continued...)
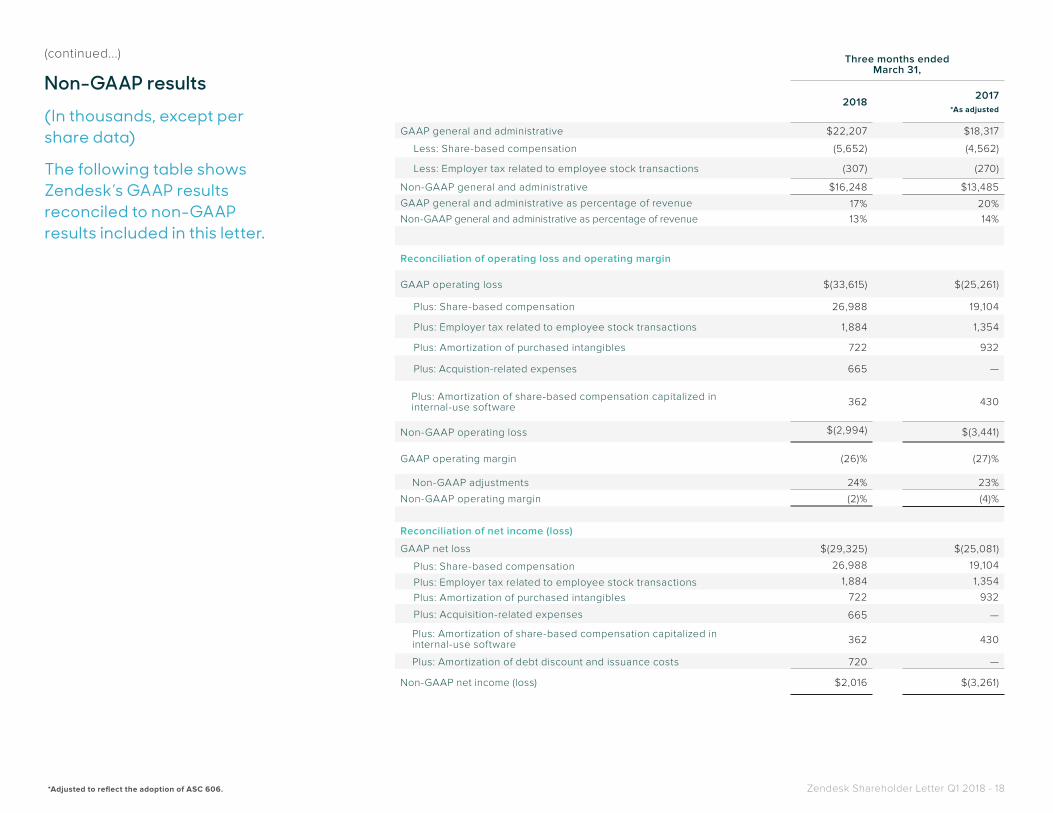
Non-GAAP results(In thousands, except per share data)
The following table shows Zendesk’s GAAP results reconciled to non-GAAP results included in this letter.
Three months ended March 31,
20182017
*As adjusted
GAAP general and administrative $22,207 $18,317
Less: Share-based compensation (5,652) (4,562)
Less: Employer tax related to employee stock transactions (307) (270)
Non-GAAP general and administrative $16,248 $13,485
GAAP general and administrative as percentage of revenue 17% 20%Non-GAAP general and administrative as percentage of revenue 13% 14%
Reconciliation of operating loss and operating margin
GAAP operating loss $(33,615) $(25,261)
Plus: Share-based compensation 26,988 19,104
Plus: Employer tax related to employee stock transactions 1,884 1,354
Plus: Amortization of purchased intangibles 722 932
Plus: Acquistion-related expenses 665 —
Plus: Amortization of share-based compensation capitalized in internal-use software 362 430
Non-GAAP operating loss $(2,994) $(3,441)
GAAP operating margin (26)% (27)%
Non-GAAP adjustments 24% 23%
Non-GAAP operating margin (2)% (4)%
Reconciliation of net income (loss)
GAAP net loss $(29,325) $(25,081)
Plus: Share-based compensation 26,988 19,104
Plus: Employer tax related to employee stock transactions 1,884 1,354
Plus: Amortization of purchased intangibles 722 932
Plus: Acquisition-related expenses 665 —
Plus: Amortization of share-based compensation capitalized in internal-use software 362 430
Plus: Amortization of debt discount and issuance costs 720 —
Non-GAAP net income (loss) $2,016 $(3,261)
*Adjusted to reflect the adoption of ASC 606.

Zendesk Shareholder Letter Q1 2018 - 19
Three months ended March 31,
20182017
*As adjusted
Reconciliation of net income (loss) per share, basic
GAAP net loss per share, basic $(0.28) $(0.26)
Non-GAAP adjustments to net loss 0.30 0.23
Non-GAAP net income (loss) per share, basic $0.02 $(0.03)
Reconciliation of net income (loss) per share, diluted
GAAP net loss per share, diluted $(0.28) $(0.26)
Non-GAAP adjustments to net loss 0.30 0.23
Non-GAAP net income (loss) per share, diluted $0.02 $(0.03)
Weighted-average shares used in GAAP per share calculation, basic and diluted 103,692 97,475
Weighted-average shares used in non-GAAP per share calculation
Basic 103,692 97,475
Diluted 108,923 97,475
Computation of free cash flow
Net cash provided by operating activities $16,242 $7,282
Less: purchases of property and equipment (6,808) (4,791)
Less: internal-use software development costs (2,344) (1,852)
Free cash flow $7,090 $639
(continued...)
Non-GAAP results(In thousands, except per share data)
The following table shows Zendesk’s GAAP results reconciled to non-GAAP results included in this letter.
*Adjusted to reflect the adoption of ASC 606.

Zendesk Shareholder Letter Q1 2018 - 20
About ZendeskThe best customer experiences are built with Zendesk. Zendesk’s powerful and flexible customer service and engagement platform scales to meet the needs of any business, from startups and small businesses to growth companies and enterprises. Zendesk serves businesses across a multitude of industries, with more than 100,000 paid customer accounts offering service and support in more than 30 languages. Headquartered in San Francisco, Zendesk operates worldwide with 15 offices in North America, Europe, Asia, Australia, and South America. Learn more at www.zendesk.com. Forward-Looking Statements
This press release contains forward-looking statements, including, among other things, statements regarding Zendesk’s future financial performance, its continued investment to grow its business, and progress towards its long-term financial objectives. The words such as “may,” “should,” “will,” “believe,” “expect,” “anticipate,” “target,” “project,” and similar phrases that denote future expectation or intent regarding Zendesk’s financial results, operations, and other matters are intended to identify forward-looking statements. You should not rely upon forward-looking statements as predictions of future events.
The outcome of the events described in these forward-looking statements is subject to known and unknown risks, uncertainties, and other factors that may cause Zendesk’s actual results, performance, or achievements to differ materially, including (i) adverse changes in general economic or market conditions; (ii) Zendesk’s ability to adapt its products to chang-ing market dynamics and customer preferences or achieve increased market acceptance of its products; (iii) Zendesk’s ability to effectively expand its sales capabilities, (iv) Zendesk’s ability to effectively market and sell its products to larger enterprises, (v) Zendesk’s expec-tation that the future growth rate of its revenues will decline, and that, as its costs increase, Zendesk may not be able to generate sufficient revenues to achieve or sustain profitability; (vi) the market in which Zendesk operates is intensely competitive, and Zendesk may not compete effectively; (vii) the development of the market for software as a service business software applications; (viii) Zendesk’s ability to introduce and market new products and to support its products on a shared services platform; (ix) Zendesk’s ability to integrate acquired businesses and technologies successfully or achieve the expected benefits of such acqui-sitions; (x) Zendesk’s ability to effectively manage its growth and organizational change; (xi) breaches in Zendesk’s security measures or unauthorized access to its customers’ data; (xii) service interruptions or performance problems associated with Zendesk’s technology and in-frastructure; (xiii) real or perceived errors, failures, or bugs in its products; and (xiv) Zendesk’s substantial reliance on its customers renewing their subscriptions and purchasing additional subscriptions.
The forward-looking statements contained in this press release are also subject to additional risks, uncertainties, and factors, including those more fully described in Zendesk’s filings with the Securities and Exchange Commission, including its Annual Report on Form 10-K for the year ended December 31, 2017. Further information on potential risks that could affect actual results will be included in the subsequent periodic and current reports and other filings that Zendesk makes with the Securities and Exchange Commission from time to time, including its Quarterly Report on Form 10-Q for the quarter ended March 31, 2018.
Forward-looking statements represent Zendesk’s management’s beliefs and assumptions only as of the date such statements are made. Zendesk undertakes no obligation to update any forward-looking statements made in this press release to reflect events or circumstances after the date of this press release or to reflect new information or the occurrence of unantici-pated events, except as required by law.
About Non-GAAP Financial Measures
To provide investors and others with additional information regarding Zendesk’s results, the following non-GAAP financial measures were disclosed: non-GAAP gross profit and gross margin, non-GAAP operating expenses, non-GAAP operating income (loss) and operating margin, non-GAAP net income (loss), non-GAAP net income (loss) per share, basic and diluted, and free cash flow.
Specifically, Zendesk excludes the following from its historical and prospective non-GAAP financial measures, as applicable:
Share-based Compensation and Amortization of Share-based Compensation Capitalized in Internal-use Software: Zendesk utilizes share-based compensation to attract and retain employees. It is principally aimed at aligning their interests with those of its stockholders and at long-term retention, rather than to address operational performance for any particular period. As a result, share-based compensation expenses vary for reasons that are generally unrelated to financial and operational performance in any particular period.
Employer Tax Related to Employee Stock Transactions: Zendesk views the amount of employer taxes related to its employee stock transactions as an expense that is dependent on its stock price, employee exercise and other award disposition activity, and other factors that are beyond Zendesk’s control. As a result, employer taxes related to its employee stock transactions vary for reasons that are generally unrelated to financial and operational perfor-mance in any particular period.
Amortization of Purchased Intangibles: Zendesk views amortization of purchased intangible assets, including the amortization of the cost associated with an acquired entity’s developed technology, as items arising from pre-acquisition activities determined at the time of an acquisition. While these intangible assets are evaluated for impairment regularly, amortization of the cost of purchased intangibles is an expense that is not typically affected by operations during any particular period.
Acquisition-Related Expenses: Zendesk views acquisition-related expenses, such as transac-tion costs, integration costs, restructuring costs, and acquisition-related retention payments, including amortization of acquisition-related retention payments capitalized in internal-use software, as events that are not necessarily reflective of operational performance during a period. In particular, Zendesk believes the consideration of measures that exclude such expenses can assist in the comparison of operational performance in different periods which may or may not include such expenses.
Amortization of Debt Discount and Issuance Costs: In March 2018, Zendesk issued $575 million of convertible senior notes due in 2023, which bear interest at an annual fixed rate of 0.25%. The imputed interest rate of the convertible senior notes was approximately 5.26%. This is a result of the debt discount recorded for the conversion feature that is required to be separately accounted for as equity, and debt issuance costs, which reduce the carrying value of the convertible debt instrument. The debt discount is amortized as interest expense together with the issuance costs of the debt. The expense for the amortization of debt discount and debt issuance costs is a non-cash item, and we believe the exclusion of this interest expense will provide for a more useful comparison of our operational performance in different periods.
Zendesk provides disclosures regarding its free cash flow, which is defined as net cash from operating activities, less purchases of property and equipment and internal-use software development costs. Zendesk uses free cash flow, among other measures, to evaluate the ability of its operations to generate cash that is available for purposes other than capital expenditures and capitalized software development costs. Zendesk believes that informa-tion regarding free cash flow provides investors with an important perspective on the cash available to fund ongoing operations.
Zendesk Shareholder Letter Q1 2018 - 21
Zendesk has not reconciled free cash flow guidance to net cash from operating activities for the year ending December 31, 2018 because Zendesk does not provide guidance on the reconciling items between net cash from operating activities and free cash flow, as a result of the uncertainty regarding, and the potential variability of, these items. The actual amount of such reconciling items will have a significant impact on Zendesk’s free cash flow and, accordingly, a reconciliation of net cash from operating activities to free cash flow for the year ending December 31, 2018 is not available without unreasonable effort.
Zendesk’s disclosures regarding its expectations for its non-GAAP operating margin include adjustments to its expectations for its GAAP operating margin that exclude the expected share-based compensation and related expenses, amortization of purchased intangibles, and acquisition-related expenses excluded from its expectations for non-GAAP operating income (loss) as compared to its expectation for GAAP operating income (loss) for the same period.
Zendesk does not provide a reconciliation of its non-GAAP operating margin guidance to GAAP operating margin for future periods beyond the current fiscal year because Zendesk does not provide guidance on the reconciling items between GAAP operating margin and non-GAAP operating margin for such periods, as a result of the uncertainty regarding, and the potential variability of, these items. The actual amount of such reconciling items will have a significant impact on Zendesk’s non-GAAP operating margin and, accordingly, a reconcili-ation of GAAP operating margin to non-GAAP operating margin guidance for such periods is not available without unreasonable effort.
Zendesk’s disclosures regarding its expectations for its non-GAAP gross margin include adjustments to its expectations for its GAAP gross margin that exclude share-based com-pensation and related expenses in Zendesk’s cost of revenue and amortization of purchased intangibles related to developed technology. The share-based compensation and related expenses excluded due to such adjustments are primarily comprised of the share-based compensation and related expenses for employees associated with Zendesk’s infrastructure and customer experience organization.
Zendesk does not provide a reconciliation of its non-GAAP gross margin guidance to GAAP gross margin for future periods because Zendesk does not provide guidance on the rec-onciling items between GAAP gross margin and non-GAAP gross margin, as a result of the uncertainty regarding, and the potential variability of, these items. The actual amount of such reconciling items will have a significant impact on Zendesk’s non-GAAP gross margin and, accordingly, a reconciliation of GAAP gross margin to non-GAAP gross margin guidance for the period is not available without unreasonable effort.
Zendesk uses non-GAAP financial information to evaluate its ongoing operations and for internal planning and forecasting purposes. Zendesk’s management does not itself, nor does it suggest that investors should, consider such non-GAAP financial measures in isolation from, or as a substitute for, financial information prepared in accordance with GAAP. Zendesk presents such non-GAAP financial measures in reporting its financial results to provide inves-tors with an additional tool to evaluate Zendesk’s operating results. Zendesk believes these non-GAAP financial measures are useful because they allow for greater transparency with respect to key metrics used by management in its financial and operational decision-making. This allows investors and others to better understand and evaluate Zendesk’s operating results and future prospects in the same manner as management.
Zendesk’s management believes it is useful for itself and investors to review, as applicable, both GAAP information that may include items such as share-based compensation and relat-ed expenses, amortization of purchased intangibles, and acquisition-related expenses, and the non-GAAP measures that exclude such information in order to assess the performance of Zendesk’s business and for planning and forecasting in subsequent periods. When Zendesk uses such a non-GAAP financial measure with respect to historical periods, it
provides a reconciliation of the non-GAAP financial measure to the most closely compara-ble GAAP financial measure. When Zendesk uses such a non-GAAP financial measure in a forward-looking manner for future periods, and a reconciliation is not determinable without unreasonable effort, Zendesk provides the reconciling information that is determinable without unreasonable effort and identifies the information that would need to be added or subtracted from the non-GAAP measure to arrive at the most directly comparable GAAP measure. Investors are encouraged to review the related GAAP financial measures and the reconciliation of these non-GAAP financial measures to their most directly comparable GAAP financial measure as detailed above.
Non-GAAP gross margin for the fourth quarter of 2017 excludes $2.9 million in share-based compensation and related expenses (including $0.1 million of employer tax related to em-ployee stock transactions and $0.4 million of amortization of share-based compensation capitalized in internal-use software), and $0.6 million of amortization of purchased intangi-bles. Non-GAAP operating loss and non-GAAP operating margin for the fourth quarter of 2017 excludes $24.5 million in share-based compensation and related expenses (including $2.0 million of employer tax related to employee stock transactions and $0.4 million of amor-tization of share-based compensation capitalized in internal-use software), $0.7 million of acquisition-related expenses, and $0.7 million of amortization of purchased intangibles. Free cash flow for the fourth quarter of 2017 includes cash used for purchases of property and equipment of $3.1 million and internal-use software development costs of $2.3 million.
About Operating Metrics Zendesk reviews a number of operating metrics to evaluate its business, measure per-formance, identify trends, formulate business plans, and make strategic decisions. These include the number of paid customer accounts on Zendesk Support, Zendesk Chat, and its other products, dollar-based net expansion rate, monthly recurring revenue represented by its churned customers, and the percentage of its monthly recurring revenue from Support originating from customers with 100 or more agents on Support.
Zendesk defines the number of paid customer accounts at the end of any particular period as the sum of (i) the number of accounts on Support, exclusive of its legacy Starter plan, free trials, or other free services, (ii) the number of accounts using Chat, exclusive of free trials or other free services, and (iii) the number of accounts on all of its other products, exclusive of free trials and other free services, each as of the end of the period and as identified by a unique account identifier. Use of Support, Chat, and Zendesk’s other products requires separate subscriptions and each of these accounts are treated as a separate paid custom-er account. Existing customers may also expand their utilization of Zendesk’s products by adding new accounts and a single consolidated organization or customer may have multiple accounts across each of Zendesk’s products to service separate subsidiaries, divisions, or work processes. Each of these accounts is also treated as a separate paid customer account.
Zendesk’s dollar-based net expansion rate provides a measurement of its ability to increase revenue across its existing customer base through expansion of authorized agents asso-ciated with a paid customer account, upgrades in subscription plans, and the purchase of additional products as offset by churn, contraction in authorized agents associated with a paid customer account, and downgrades in subscription plans. Zendesk’s dollar-based net expansion rate is based upon monthly recurring revenue for a set of paid customer accounts on its products. Monthly recurring revenue for a paid customer account is a legal and con-tractual determination made by assessing the contractual terms of each paid customer ac-count, as of the date of determination, as to the revenue Zendesk expects to generate in the next monthly period for that paid customer account, assuming no changes to the subscrip-tion and without taking into account any one-time discounts or any platform usage above the subscription base, if any, that may be applicable to such subscription. Monthly recurring revenue is not determined by reference to historical revenue, deferred revenue, or any other GAAP financial measure over any period. It is forward-looking and contractually derived as of the date of determination.

Zendesk Shareholder Letter Q1 2018 - 22
Zendesk calculates its dollar-based net expansion rate by dividing the retained revenue net of contraction and churn by Zendesk’s base revenue. Zendesk defines its base revenue as the aggregate monthly recurring revenue across its products for customers with paid customer accounts on Support or Chat as of the date one year prior to the date of calcula-tion. Zendesk defines the retained revenue net of contraction and churn as the aggregate monthly recurring revenue across its products for the same customer base included in the measure of base revenue at the end of the annual period being measured. The dollar-based net expansion rate is also adjusted to eliminate the effect of certain activities that Zendesk identifies involving the transfer of agents between paid customer accounts, consolidation of customer accounts, or the split of a single paid customer account into multiple paid customer accounts. In addition, the dollar-based net expansion rate is adjusted to include paid cus-tomer accounts in the customer base used to determine retained revenue net of contraction and churn that share common corporate information with customers in the customer base that are used to determine the base revenue. Giving effect to this consolidation results in Zendesk’s dollar-based net expansion rate being calculated across approximately 95,800 customers, as compared to the approximately 125,500 total paid customer accounts as of March 31, 2018.
To the extent that Zendesk can determine that the underlying customers do not share com-mon corporate information, Zendesk does not aggregate paid customer accounts associated with reseller and other similar channel arrangements for the purposes of determining its dollar-based net expansion rate. While not material, Zendesk believes the failure to account for these activities would otherwise skew the dollar-based net expansion metrics associated with customers that maintain multiple paid customer accounts across its products and paid customer accounts associated with reseller and other similar channel arrangements.
Zendesk does not currently incorporate operating metrics associated with its analytics prod-uct or its Outbound product into its measurement of dollar-based net expansion rate.
For a more detailed description of how Zendesk calculates its dollar-based net expansion rate, please refer to Zendesk’s periodic reports filed with the Securities and Exchange Com-mission.
Zendesk’s percentage of monthly recurring revenue from Support that is generated by cus-tomers with 100 or more agents on Support is determined by dividing the monthly recurring revenue from Support for paid customer accounts with 100 or more agents on Support as of the measurement date by the monthly recurring revenue from Support for all paid customer accounts on Support as of the measurement date. Zendesk determines the customers with 100 or more agents on Support as of the measurement date based on the number of activat-ed agents on Support at the measurement date and includes adjustments to aggregate paid customer accounts that share common corporate information.
Zendesk determines the annualized value of a contract by annualizing the monthly recurring revenue for such contract.
Zendesk does not currently incorporate operating metrics associated with products other than Support into its measurement of the percentage of monthly recurring revenue from Support that is generated by customers with 100 or more agents on Support.
March 31, 2017
June 30, 2017
September 30, 2017
December 31, 2017
March 31, 2018
Paid customer accounts on Zendesk Support (approx.) 54,900 57,800 61,200 64,100 67,800
+ Paid customer accounts on Zendesk Chat (approx.) 44,000 45,300 46,600 47,000 47,700
+ Paid customer accounts on other Zendesk products (approx.) 2,900 4,300 6,100 7,800 10,000
= Approximate number of paid customer accounts 101,800 107,400 113,900 118,900 125,500
Source: Zendesk, Inc.
Contact:
Investor Contact
Marc Cabi, +1 415-852-3877
Media Contact
Tian Lee, +1 415-231-0847
Customer Metrics
Geographic Information
United States
EMEA
Other
Q1’18
52.7%
29.2%
18.1%
Revenue by geography: