Embed Size (px)
Citation preview

10
Maximum Power Point Tracker Applied in Batteries Charging with Photovoltaic Panels
José António Barros Vieira1 and Alexandre Manuel Mota2 1Instituto Politecnico de Castelo Branco, Escola Superior de Tecnologia de Castelo Branco,
Departamento de Engenharia Electrotécnica 2Universidade de Aveiro, Departamento de Electrónica Telecomunicações e Informática,
Instituto de Engenharia Electrónica e Telemática de Aveiro Portugal
1. Introduction
Recently, the concern for environmental issue has been rising in the world such as global
warming by exhausting carbon dioxide (CO2) and breaking of ozone layer by freon gas. On
December 1997, during the Kyoto Conference on Climate Change (COP3), it was agreed that
by the year 2012 the developed countries would reduce at least 5% of the green house gases
compared with year 1990 (Riza et al., 2003). Moreover, the global energy shortage and the
need for sustainable energy systems enforce the development of power supply structures
that are based mainly on renewable resources.
Photovoltaic (PV) system is gaining increased importance as a renewable source due to
advantages such as the absence of fuel cost, little maintenance and no noise and wear due to
the absence of moving parts. But there are still two principal barriers to the use of
photovoltaic systems: the high installation cost and the low energy conversion efficiency.
A PV panel is a non-linear power source, i.e. its output current and voltage (power) depends
on the terminal operating point. The maximum power generated by the PV panel changes
with the intensity of the solar radiation and the operating temperature. To increase the ratio
output power/cost of the installation it is important that PV panel operates in the maximum
output power point (MPP).
This chapter describes a lead acid battery charger using a PV panel with high efficiency. It
starts by introducing the PV panel characteristics and describing the DC/DC converter need
to implement the MPPT algorithm. This is the most important part of this work and shows
how to charge and discharge correctly a lead acid battery.
The developed prototype uses the perturbation and observation (P&O) MPPT algorithm
with the objective to maximize energy storage in the battery. The MPPT algorithm is
integrated in one of the main stages of charge of lead-acid batteries making an autonomous
and intelligent system that can be used to feed any remote load or small application. It is
very important to respect the correct battery charge curves because it will prolong its correct
operation and live (Vieira and Mota, 2009).
The P&O MPPT algorithm is used to control the maximum transfer power from a PV panel
to the battery. This algorithm is executed by a microcontroller using the PV voltage and
www.intechopen.com

Solar Collectors and Panels, Theory and Applications
212
current measurements to define the duty cycle of a pulse width modulation signal applied
to the DC/DC converter. The schematic and design of the DC/DC converter are explained.
The DC/DC converter used is of the SEPIC topology because it easily adapts any PV output
voltage to any battery input voltage.
One of the most frequently used MPPT methods is the perturbation and observation
algorithm, although this algorithm has some converging problems with rapidly insolation
changes. This problem can be solved using the solution presented in (Sera et al., 2006). In
this work, PV voltage and current are measured in the middle of the sampling interval,
making possible to determine if the verified changes are due to perturbation algorithm or to
shadows that cover the PV panel. Another popular MPPT algorithm is the incremental
conductance method (IncCond) (Hussein et al., 1995). The authors developed the
incremental conductance MPPT algorithm avoiding the drawbacks of the P&O MPPT
algorithm. It is based on the fact that the derivative of the output power P with respect to
the panel voltage V is equal to zero at the MPP. The solar panel's P-V characteristics
presented in figure 2 show further that the derivative is greater than zero to the left of the
MPP and less than zero to the right of the MPP. This algorithm shows that enough
information is gathered to determine the relative location of the MPP by measuring only the
incremental and instantaneous panel conductance’s dI/dV and I/V, respectively.
In this work, perturbation and observation MPPT algorithm was chosen, due to its
simplicity and to its low computational power needs (Knop, 1999).
To implement a correct charger for a lead-acid battery, the correct charge curves are
presented and the four charging stages are described. This work also explains that if the
correct charge curves are respected in the charge periods the correct operation period of
time of the lead acid battery will be longer. In the developed system only two of the four
charging stages are implemented. The first stage is avoided by the discharge supervisor
implemented algorithm and the fourth stage is made extending the third stage. The
discharge supervision algorithm simply monitors the battery voltage and if it goes bellow a
minimum value the load is disconnected waiting for a new charge.
Finally, experimental results of the performance of the designed P&O MPPT algorithm,
corresponding to the 2º stage of lead acid battery charge, are presented and compared with
the results achieved with the direct connection of the PV panel to the battery.
The remainder of this chapter is organized as follows: section 2 presents the photovoltaic
panel characteristics, section 3 presents the DC/DC SEPIC schematic and design, section 4
shows the perturbation and observation maximum power point tracking algorithm. Section
5 presents the algorithm proposed to the different stages of the lead-acid battery charging
process, section 6 shows the implemented prototype board, section 7 discuss the
experimental results of charging with the P&O MPPT algorithm and with out it, ending
with the conclusions presented in section 8.
2. Solar array characteristics
The maximum power point of a solar panel changes in accordance with changes in the solar
irradiance intensity, angle and panel temperature. The typical characteristic curves of
current versus voltage, power versus voltage at different levels of solar irradiation and
power versus voltage at different temperatures, are illustrated in figure 1, figure 2 and
figure 3 respectively.
www.intechopen.com
Maximum Power Point Tracker Applied in Batteries Charging with Photovoltaic Panels
213
Figure 1 illustrates the operating characteristic of the panel under several given solar insolations. It consists of two regions: one is the current source region, and the other is the voltage source region. In the voltage source region, the internal impedance of the panel is low. That region is the right side of the current-voltage curve. The current source region, in which the internal impedance of the panel is high, is at the left side of the current-voltage curve. The MPP of the panel is located at the knee of the current-voltage curve. According to the maximum power transfer theory, the power delivered to the load is maximum when the source internal impedance matches the load impedance. Thus, the impedance seen from the converter input side (can be adjusted by PWM control signal) needs to match the internal impedance of the panel if the system is required to operate at or near the MPP of the solar array. If the system operates on the voltage source region (namely low impedance region) of panel characteristic curve, the panel terminal voltage will collapse (Hua & Lin, 2003).
Fig. 1. I-V characteristics of a photovoltaic panel for different values of irradiance S at a temperature of 25 ºC.
From figure 2 and Figure 3, it can be observed that each curve has a maximum power point, which is the optimal point for the efficient use of the panel. This point depends of the values of irradiance and working temperature. The main function of a MPPT is to adjust the panel output voltage to a value which the panel supplies the maximum energy to the load (Torres, 1998). Thus, a DC/DC converter will be used to match the source internal impedance with the load impedance achieving the MPP. The applied MPPT algorithm will be explained in detailed in section 4.
3. DC/DC SEPIC converter
To implement the P&O MPPT algorithm a SEPIC (Single-Ended Primary Inductance Converter) is used. This DC/DC type of converter is an increasingly popular topology,
www.intechopen.com

Solar Collectors and Panels, Theory and Applications
214
Fig. 2. P-V characteristics of a photovoltaic panel for different values of irradiance S at a temperature of 25 ºC.
Fig. 3. P-V characteristics of a photovoltaic panel for different values of temperature T at irradiance of 1000W/m2.
www.intechopen.com

Maximum Power Point Tracker Applied in Batteries Charging with Photovoltaic Panels
215
particularly in battery powered applications, because the input voltage can be higher or lower than the output voltage. This topology presents obvious design and working advantages. In this work, for the implementation of the maximum power point tracker the SEPIC, working in continuous conduction mode, is used as the power-processing unit. The PWM is controlled with a switching frequency of 125 kHz that actuates the Mosfet switch M1. The power flow is controlled by adjusting the on/off duty-cycle. Figure 4 shows the schematic of the DC/DC converter implemented. It has one Mosfet, one diode, two inductances and tree capacitors.
IN OUT
C2
L1
L2 C3
C1
D1
M1
Fig. 4. SEPIC DC/DC converter circuit.
Using a PV panel with the following characteristics: maximum power Pmax=9.31 W, maximum voltage Vmp=17.4 V, maximum current Imp=0.54 A, open circuit voltage Voc = 21.2 V, short-circuit current Icc=0.66 A, the DC/DC converter design starts with the selection of the two separate inductors L1 and L2. For a general working point with:
Input voltage (Vin) 12V – 16V
Output (Vout & Iout) 12V, 0.6A
Switching frequency (Fs) 125kHz
Expected efficiency 90%
First it is need to calculate the duty cycle; D = Vout/(Vout + Vin); The worst case condition for inductor ripple current is at maximum input voltage so; D = 12/(12 + 16) = 0.429; Calculating the value of L2:
V = L di/dt (1)
Where V is the voltage applied to the inductor, L in the inductance, di is the inductor peak to peak ripple current and dt is the duration the voltage applied. Hence:
L = V.dt/di (2)
dt = 1/Fs x D (3)
dt = 1/(125 x 103) x 0.428 = 3.42 µs (4)
V = Vin during the switch ON time so:
L2 = 16 x (3.42 x 10-6/0.4) (5)
L2 = 136.8 µH (6)
www.intechopen.com

Solar Collectors and Panels, Theory and Applications
216
Using the nearest preferred value would lead to the selection of a 150 µH inductor. It is common practice to select the same value for both input and output inductors in SEPIC designs although when two separate parts are being used it is not essential. Having selected the inductance value we now need to calculate the required RMS and peak current ratings for both inductors. For input inductor L1:
Irms = (Vout x Iout)/(Vin (min) * efficiency) (7)
Irms = (12 x 0.6)/(12 x 0.9) = 0.667A (8)
Ipeak = Irms + (0.5 x Iripple) (9)
Although worst case ripple current is at maximum input voltage the peak current is normally highest at the minimum input voltage.
Iripple = (V.dt)/L (10)
Iripple = (12 x 3.42 x 10-6)/ 150 x 10-6= 0.27A (11)
Ipeak = 0.667 + 0.135 =0.804A (12)
So a 150µH, 0.667Arms and 0.804Apk rated inductor is required. For the output inductor L2:
Irms = Iout = 0.6A (13)
Iripple = (16 x 3.42 x 10-6)/ 150 x 10-6= 0.365A (14)
Ipeak = 0.6 + 0.182 = 0.782A (15)
So a 150µH, 0.6Arms and 0.782Apk rated inductor is required. Finally, the SEPIC components used are:
L1 = 150µH and L2 = 150µHwith Isat = 4.0A because if Vin = 6V Irms
will be near to the double of the calculated current for Vin = 12V
C1 = 47 µF, C2 = 47µF ,C3 = 47µF with Vmax = 40V
M1 of Imax = 4.0A switching Mosfet at 125kHz
D1 of Imax 4.0A Schotkky Diode
4. The P&O maximum power point tracker algorithm
The P&O MPPT is one of the so called ‘hill-climbing’ methods, which are based on the fact
that in case of the V-P characteristic, on the left of the MPP the variation of the power
against voltage dP/dV > 0, while at the right, dP/dV < 0 (Weidong & Dunford, 2004).
In Figure 2, if the operating voltage of the PV panel is perturbed in a given direction and
dP/dV > 0, it is known that the perturbation moved the panel's operating point toward the
MPP. The P&O algorithm would then continue to perturb the PV panel voltage in the same
direction. If dP/dV < 0, then the change in operating point moved the PV panel away from
the MPP, and the P&O algorithm reverses the direction of the perturbation (Hohm & Ropp,
2000).
www.intechopen.com

Maximum Power Point Tracker Applied in Batteries Charging with Photovoltaic Panels
217
The main advantage of the P&O method is its implementation simplicity and its low computational demand. However it shows some limitations, like oscillations around the MPP in steady state operation, slow response speed, and tracking in wrong way under rapidly changing atmospheric conditions (Hohm & Ropp, 2000), (Femia et al., 2004), (Brambilla et al., 1999). To reduce the presented limitations it will be useful to use a small sampling rate. In this work it was used a sampling rate of 100 ms. Using a SEPIC with current and voltage resistance sensors illustrated in Figure 5, the P&O MPPT algorithm was implemented. The algorithm needs only the PV voltage and current information to work correctly, the battery voltage and current information will be used to control the battery charging stages and supervise its discharge.
PV BatteryR
0
R1
R2
R5
R3
R4
SEPIC
DCDC
CONVERTER
Fig. 5. Voltage and current resistive sensors for MPPT and battery charging algorithm.
R0=R5=0.01Ω for current measurements and R1=R3=910kΩ and R2=R4=150kΩ for voltage measurements. The flow chart of the P&O MPPT implemented algorithm is illustrated in figure 6. The parameter K is the step given to the PWM signal. This parameter can vary depending of the working point of the DC/DC converter. To get a faster convergence we need big K values and to avoid big oscillations near to the MPPT working point we need small K values. The P&O MPPT control algorithm is implemented in a microcontroller (ATTINY861V) that
has ten 10-bits analogue-to-digital (A/D) converters and two fast PWM mode signals with
10-bits of resolution. The control circuit compares the PV output power before and after a
change in the duty-cycle of the DC/DC converter control signal and acts in conformity. It is
expected that the algorithm shows a small constant oscillation in the MPP working point
inherent to the is working principle. The PWM_old is the sample of the PWM signal in the
previous iteration of the algorithm and ΔPPV is the variation of the delivered power to the
battery.
5. Battery charging algorithm
The complete battery charging demands a complex control strategy, in which it would be
possible to charge the battery, between its limits, in the faster possible way because the daily
period of energy generation of the PV panel is limited (Galdino & Ribeiro, 1994).
To achieve a fast, safe and complete battery lead-acid charge, some of the manufacturers
recommend dividing the charging process in four stages that are designated by: (i) trickle
charge, (ii) bulk charge, (iii) over charge and (iv) float charge (Hesse, 1997) and (Rosemback,
2004). Figure 7 show the curves of current and voltage applied to the battery during a
correct charging cycle.
www.intechopen.com

Solar Collectors and Panels, Theory and Applications
218
Start P&O
Read VPV and IPV
PPV
=VPV
*IPV
∆PWM>=0
PWM=
PWM_old-K
return
yesnonoyes
∆PWM>=0
∆PPV>=0
PWM=
PWM_old+K
PWM=
PWM_old-K
yes no
∆PPV
=PPV
-PPV_old
∆PWM=PWM-
PWM_old
PWM=
PWM_old+K
Fig. 6. P&O MPPT algorithm.
Fig. 7. Current and voltage curves in the four stages of battery charge.
www.intechopen.com

Maximum Power Point Tracker Applied in Batteries Charging with Photovoltaic Panels
219
5.1 Trickle charge - 1º stage (from T0 to T1)
This first stage is active when the battery voltage is below the value VCHGENB. This voltage value, specified for the manufacturers, shows that the battery arrives at its critical discharge capacity. In this condition the battery should receive a small charge current defined by ITC that has a typical value of C/100 where C is the normal battery capacity with a 10 hours charging process. This small current ITC is applied until the battery voltage reaches the value of VCHGENB. This stage also avoids that some accident could happens in the case of the one battery element is in curt circuit, therefore if this really happens the battery voltage will not grow and then the battery charging process does not pass to the next stage.
5.2 Bulk charge - 2º stage (from T1 to T2)
After the battery voltage reaches the value VCHGENB it should be applied to the battery a constant current IBULK. The IBULK is the maximum charge current that battery supports without a big water losing, and its value is specified by the manufacturers. This current is applied until the battery voltage reaches the maximum value of over charge voltage, defined by VOC, and also specified by the manufacturers. In this stage the prototype implemented board will run the P&O MPPT algorithm but the IBULK is never exceeded. The maximum power of the PV panel should be correctly chosen.
5.3 Over charge - 3º stage (from T2 to T3)
During this stage the control algorithm should regulate the battery voltage VOC until the complete charge has been reached. When the charging current fall down to a pre-established value IOTC and the voltage stays in the value VOC, the charge process should go to the next, and final, stage. The value of IOCT is around 10% of the IBULK.
5.4 Float charge - 4º stage (from T3 until the end)
In this stage the control algorithm will apply to the battery a constant voltage VFLOAT which is specified by the battery manufacturers. This voltage is applied to the battery with the objective of avoiding its auto-discharge. During the discharging process the battery voltage will fall down and when it reaches 0.9 VFLOAT the control algorithm will execute again the 2º stage providing the IBULK current. The control algorithm only returns to the 2º stage if the PV panel is capable of delivering energy. If it is not the case the battery will continue the discharge process. If the voltage goes below the value VCHGENB the control algorithm should restart the charging process in 1º stage as soon as the PV panel is capable of delivering energy. In this work some simplifications have been introduced in the implementation of the four
different charging stages of a lead-acid battery. The 1º stage was not implemented because
the discharge batteries voltage, with this prototype board, does not go below VFLOAT. The
possible applied load is disconnected from the battery by the control algorithm avoiding
reaching the critical discharge.
The 4º stage was not implemented but the 3º stage is continued until the charge current reach ISTEADY and finally the charging process is ended. When the PV panel has energy to delivery and the battery voltage is below the VOC, the control algorithm executes the 2º stage. The battery charging algorithm can be seen in figure 8. Values Vb and Ib are the battery voltage an delivered current and Tb is the battery temperature. The maximum value of the VOC
www.intechopen.com

Solar Collectors and Panels, Theory and Applications
220
depends of the battery temperature. The temperature of the battery Tb is measured using a NTC temperature sensor and its linearisation is made in software using a conversion table. From figure 8 it is clear that only the 2º and the 3º stages are implemented from the four stages proposed in (Hesse, 1997) and (Rosemback, 2004).
Start BCH
Read V b, Ib and Tb
PWM= PWM-K
return
no
no
yes
Ib<=IBULK
Vb>=VOC(Tb)
PWM=0
yes no
Execute MPPT
P&O algorithm
PWM= PWM_old-K
yes
PWM= PWM_old-K
Ib<=I
STEADY
Fig. 8. Battery charging algorithm with two main stages.
6. Implemented prototype board
The implemented prototype board is illustrated in figure 9. It can be seen the PV panel connection in the right side of the photo (IN) and the connection to the battery (B) and to the possible load (L) both in the left side. The described charging process of lead-acid batteries is executed with the P&O MPPT
algorithm integrated to make an autonomous system that can be used to feed any
autonomous load application. This board is also prepared to feed led light autonomous
signalisation systems and could be used in any other remote small application.
The board also monitors the discharge of the battery. There is a minimum battery voltage,
depending of the battery temperature, that shouldn’t be over crossed. If that happens the
system disconnects the load until a new charge.
www.intechopen.com

Maximum Power Point Tracker Applied in Batteries Charging with Photovoltaic Panels
221
Fig. 9. Photo of the MPPT and battery charger prototype board.
7. P&O MPPT experimental results
The experimental results of battery charging using the P&O MPPT algorithm are divided in
two separated tests each one divided in two phases. In the first phase the Photo Voltaic
panel is directly connected to the battery element (first 85 samples) and in the second phase
the panel is connected to the battery element using the developed board running the P&O
MPPT algorithm (from samples 85 to the end).
In the first test a PV panel with a Pmax = 9.31 W (Vmp = 17.4 V, Imp = 0.54 A) connects to
one lead-acid battery of V = 12 V (Imax = 7.5 Ah). In the second test the same PV panel is
connected to a bank of four lead-acid batteries of V = 6 V (Imax = 1.8 Ah) connected in
parallel. The tests results are illustrated in figures 10 and 11.
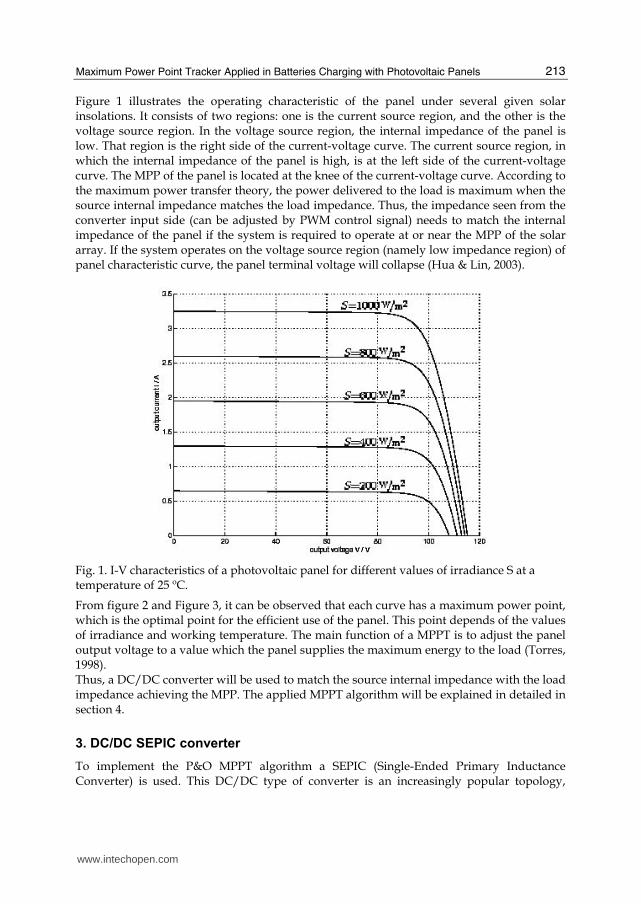
From first test it can be seen that charging the 12V battery with the direct connection of the
PV panel to the battery, the absorbed power from the PV panel is around 7W and with the
P&O MPPT algorithm the absorbed power from the PV panel is around 8W. The MPPT
algorithm presents small oscillations around the maximum power point as expected. The
algorithm takes about 60 samples to go from zero to the maximum power point.
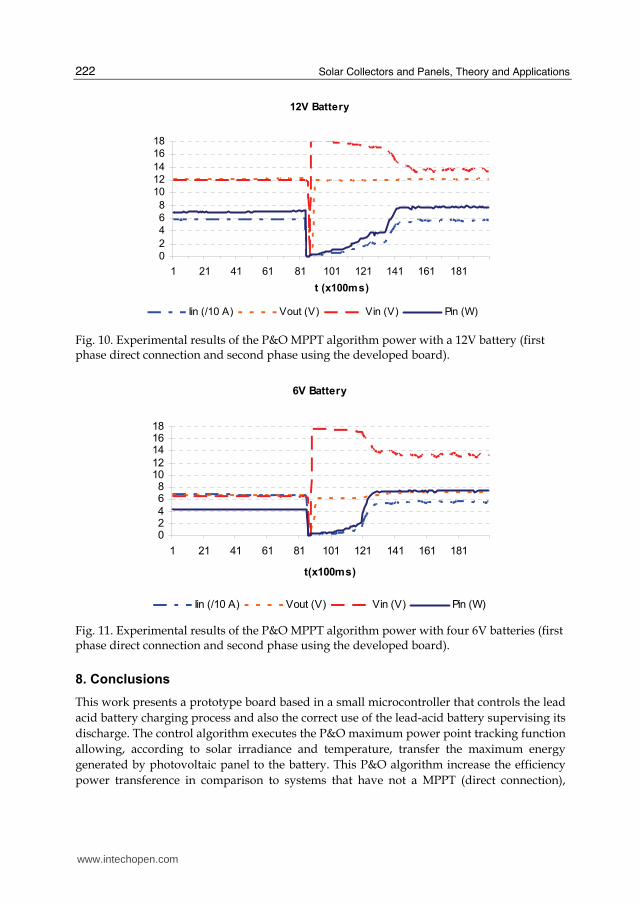
From the second test results it can be seen that with the direct connection of the PV panel to
the bank of four batteries the absorbed power from the PV panel is around 4.5W and
charging the batteries with the P&O MPPT algorithm, corresponding to the second charge
stage, the absorbed power from the PV panel is around 7.5W. The algorithm takes about 40
samples from zero to the maximum power point.
The experimental setup using the P&O MPPT always gives more delivered energy to the
battery than the direct connection. The P&O MPPT has increased the PV panel capacity of
supply energy in 12.5% using a 12V battery and 40% using four 6V batteries connected in
parallel.
www.intechopen.com
Solar Collectors and Panels, Theory and Applications
222
12V Battery
0
2
4
6
8
10
12
14
16
18
1 21 41 61 81 101 121 141 161 181
t (x100ms)
Iin (/10 A) Vout (V) Vin (V) Pin (W)
Fig. 10. Experimental results of the P&O MPPT algorithm power with a 12V battery (first phase direct connection and second phase using the developed board).
6V Battery
024
68
1012
141618
1 21 41 61 81 101 121 141 161 181
t(x100ms)
Iin (/10 A) Vout (V) Vin (V) Pin (W)
Fig. 11. Experimental results of the P&O MPPT algorithm power with four 6V batteries (first phase direct connection and second phase using the developed board).
8. Conclusions
This work presents a prototype board based in a small microcontroller that controls the lead
acid battery charging process and also the correct use of the lead-acid battery supervising its
discharge. The control algorithm executes the P&O maximum power point tracking function
allowing, according to solar irradiance and temperature, transfer the maximum energy
generated by photovoltaic panel to the battery. This P&O algorithm increase the efficiency
power transference in comparison to systems that have not a MPPT (direct connection),
www.intechopen.com

Maximum Power Point Tracker Applied in Batteries Charging with Photovoltaic Panels
223
reducing the size and the cost of the PV panel. The use of a SEPIC converter has some
advantages because it easily adapts any PV output voltage to any input battery voltage as
showed in the presented experiments.
This board enables the fast, safe and complete battery lead-acid charging process and also monitor its discharge. For future work the complete charging process should be analysed to compare with another system working with out P&O MPPT algorithm. From these results it is expect that the charging process using the MPPT algorithm will be faster and more efficient. These results will prolong for more time the correct operation of the lead acid battery. For future work, it would be interesting to apply the P&O MPPT algorithm to a thermal solar panels to absorb the maximum thermal power from the irradiated solar energy. The thermal energy could be transferred to water tanks for future utilizations for domestic or industrial use. To implement this system we will need the measurement of the water flow and increase of the temperature of the water (output subtracted to input temperatures of the water of the thermal solar panel) to calculate the water thermal power that is the product of the two referred measurements. Finally, with the control of the water flow it should be possible to impose the MPP in a solar thermal system optimizing the efficiency of the thermal energy transference.
9. References
Brambilla A., Gambarara M., Garutti A. and Ronchi F.(1999). New Approach to Photovoltaic Arrays Maximum Power Point Tracking. Proceedings of Power Electronics Specialists Conference, PESC 99, vol. 2, pp 632–637, 27 June-1 July 1999.
Femia N., Petrone G., Spagnuolo G. and Vitelli M. (2004). Optimizing Sampling Rate Of P&O MPPT Technique, Proceedings of Power Electronics Specialists Conference, PESC04, vol. 3, pp 1945-1949, 20-25 June 2004.
Galdino M. A. E., Ribeiro C. M. (1994). An Intelligent Battery Charge Controller for Small Scale PV Panel, Proceedings of 12th European Photovoltaic Solar Energy Conference and Exhibition, 1994.
Hesse K. (1997). An Off-Line Lead -Acid Charger Based on the UC3909, Technical report, Unitrode Company, 1997.
Hohm D.P, Ropp M. E. (2000). Comparative Study of Maximum Power Point Tracking Algorithms Using an Experimental, Programmable, Maximum Power Point Tracking Test Bed, Proceedings of Photovoltaic Specialists Conference, Conference Record of the Twenty-Eighth IEEE, pp 1699 – 1702, 15-22 Septembre 2000.
Hua C. and Lin J. (2003). An On-Line MPPT Algorithm for Rapidly Changing Illuminations of Solar Arrays, Proceedings of Renewable Energy, vol. 28, pp 1129–1142, 2003.
Hussein K. H., Muta I., Hoshino T. and Osakada M. (1995). Maximum Photo- Voltaic Power Tracking: an Algorithm for Rapidly Changing Atmospheric Conditions, In IEE Proceedings Generation, Transmission and Distribution, vol. 142(1), pp 59-64, IEE Steven age, Herts, U.K., January, 1995.
Knop H. (1999). Analysis, Simulation, and Evaluation Of Maximum Power Point Tracking (MPPT) Methods for a Solar Powered Vehicle, Mater of Science Thesis in Electrical and Computer Engineering, Portland State University, 1999.
www.intechopen.com
Solar Collectors and Panels, Theory and Applications
224
Riza M., et al. (2003). A Maximum Power Point Tracking For Photovoltaic-Spe System Using A Maximum Current Controller, Proceedings of Solar Energy Materials & Solar Cells, vol.75 , pp 697–706, 2003.
Rosemback R. H. (2004). Conversor Cc-Cc Bidirecional Buck-Boost Atuando Como Controlador De Carga De Baterias Em Um Sistema Fotovoltaico, Mater of Science Thesis in Electrical Engineering, University Federal de Juiz de Fora, 2004.
Sera D., Kerekes T., Teodorescu R., and Aalborg F. Blaabjerg (2006). Improved MPPT Method For Rapidly Changing Environmental Conditions, IEEE International Symposium on Industrial Electronics, vol. 2, pp 1420 – 1425, 9-13 July, 2006.
Torres A. M. (1998). Aproveitamento Fotovoltaico Controlado por Redes Neurais Artificiais Interligado ao Sistema Elétrico, MSc Thesis, GPEC – DEE – UFC, Septembre, 1998.
Weidong X., Dunford W.G. (2004). A Modified Adaptive Hill Climbing MPPT Method For Photovoltaic Power Systems, Proceedings of Power Electronics Specialists Conference PESC 04, vol. 3, 20-25, pp 1957–1963, June 2004.
Vieira J. A., Mota A. M. (2009). Maximum Power Point Tracker Applied in Batteries Charging with Thermoelectric Generator Using the Waste Energy from a Gas Water Heater, Proceedings of the Conference on Control Applications, St. Petersburg, Russia, vol. 1, pp. 1477-1482, July 2009.
www.intechopen.com

Solar Collectors and Panels, Theory and ApplicationsEdited by Dr. Reccab Manyala
ISBN 978-953-307-142-8Hard cover, 444 pagesPublisher SciyoPublished online 05, October, 2010Published in print edition October, 2010
InTech EuropeUniversity Campus STeP Ri Slavka Krautzeka 83/A 51000 Rijeka, Croatia Phone: +385 (51) 770 447 Fax: +385 (51) 686 166www.intechopen.com
InTech ChinaUnit 405, Office Block, Hotel Equatorial Shanghai No.65, Yan An Road (West), Shanghai, 200040, China
Phone: +86-21-62489820 Fax: +86-21-62489821
This book provides a quick read for experts, researchers as well as novices in the field of solar collectors andpanels research, technology, applications, theory and trends in research. It covers the use of solar panelsapplications in detail, ranging from lighting to use in solar vehicles.
How to referenceIn order to correctly reference this scholarly work, feel free to copy and paste the following:
Alexandre Mota and José Vieira (2010). Maximum Power Point Tracker Applied to Charging Batteries with PVPanels, Solar Collectors and Panels, Theory and Applications, Dr. Reccab Manyala (Ed.), ISBN: 978-953-307-142-8, InTech, Available from: http://www.intechopen.com/books/solar-collectors-and-panels--theory-and-applications/maximum-power-point-tracker-applied-to-charging-batteries-with-pv-panels

© 2010 The Author(s). Licensee IntechOpen. This chapter is distributedunder the terms of the Creative Commons Attribution-NonCommercial-ShareAlike-3.0 License, which permits use, distribution and reproduction fornon-commercial purposes, provided the original is properly cited andderivative works building on this content are distributed under the samelicense.