Embed Size (px)
Citation preview

Maximum Intensity Projection Weighted by Statistical Cues
Peter Mindek∗
Supervised by: Ing. Peter Kapec†
Faculty of Informatics and Information TechnologiesSlovak University of Technology in Bratislava
Bratislava / Slovakia
Abstract
Volumetric visualization of medical data is a specific task,as doctors and radiology technicians are not well trainedin the field of computer graphics; therefore, algorithms forvisualization of medical data must be as intuitive as pos-sible, so that visualization tools employing them wouldbe helpful in medical environment. Visualization of vol-umetric data acquired by medical imaging could not beeffectively used without defining a proper transfer func-tion, which transforms measured intensities to colours andopacity values. Many visualization methods use com-plex means for designing transfer functions, which couldlead to decreased usability of said methods. We proposea modification of MIP, a common volumetric visualizationmethod that uses a simple one-dimensional transfer func-tion for classifying different materials. The goal of ourmethod is to visualize individual tissues from the medicaldata, present them with minimal effort and enable users toobserve areas of interest.
Keywords: Medical Data, Volumetric Visualization,Classification, Maximum Intensity Projection, StandardDeviation
1 Introduction
Volumetric visualization plays important role in medicalimaging. Data acquired by CT (Computed Tomography)or MRI (Magnetic Resonance Imaging) scanners can bevisualized using two-dimensional cross-sections and ex-amined by moving these cross-sections through the dataset. Another way is to visualize the data set as a whole bymeans of volumetric visualization. This approach has theadvantage of displaying the data in their original contextand it is better suited for some tasks.
Direct volume rendering (alpha blending accumulationof sampled values in front-to-back or back-to-front order)is a commonly used method for volumetric visualization.It is usually implemented using the volumteric ray cast-ing algorithm. One of the disadvantages of this methodis that it is rather slow (however, it can be accelerated by
∗[email protected]†[email protected]
precalculation of gradients used for lighting) and it needsa proper transfer function, which is essential for the al-gorithm. It has to be properly designed so that it will cor-rectly classify individual organs, tissues or materials repre-sented by the volumetric data set. Designing such functionis not a trivial task and it is often time consuming whendone manually; consequently, it is not uncommon to usesimpler methods of transforming intensities sampled fromvolume data along the viewing ray into pixel colour.
One possible solution is to visualize an iso-surface ex-tracted from the visualized data set. 1 Major drawback ofthis rendering method is that only a small part of the datacan be examined at once. Users do not see through theiso-surface, nor do they see anything above the renderedsurface; therefore, this method is not suitable for visualiz-ing complicated biological structures or tissues of humanbody, as they usually do not consist of voxels of the sameintensity. However, it can be used to visualize bones in CTscans, or parts of objects scanned by industrial CT scan-ners.
In medicine, it is often necessary to display struc-tures composed of materials with different intensity val-ues. Where the direct volume rendering or the iso-surfaceextraction is not an option, simple visualization methodsbased on processing every sampled value along the rayscan be used. A common way is to use some statisticalproperty of the one-dimensional data sampled along theray. This could be for instance standard deviation, meanvalue, or maximum value. Using the maximum value is awidespread method called Maximum intensity projection(MIP) [12]. These methods are non-photorealistic, as theirgoal is not to necessarily mimic real appearance of the vi-sualized objects but rather provide adequate insight intothe volumetric data.
Since these methods generally do not use any shadingof sampled voxels, their advantage over direct volume ren-dering is in their speed. The speed enables these methodsto be implemented in real time. This is important for us-ability of the rendering method, as dynamically changingview or other properties of the visualization is crucial forthe medical imaging applications.
1This could be done without ray casting as well; algorithms such asMarching cubes could be employed to extract the iso-surface and gen-erate a polygon mesh that would be rendered using standard renderingcapabilities.
Proceedings of CESCG 2011: The 15th Central European Seminar on Computer Graphics (non-peer-reviewed)

Another major advantage of the MIP algorithm and sim-ilar methods is their simplicity. Very easy set-up of simpletransfer functions or similar classification methods usuallyresults in satisfactory images.
On the other hand, using only the statistical proper-ties of the sampled data or an order independent-operators(such as a maximum operator used in the MIP rendering)has a drawback of discarding depth information of the vi-sualized objects. Many different algorithms have been de-veloped in order to maximize displayed information usingthese simple rendering methods [4, 11, 10, 1].
Additionally, single statistical property may not providesatisfactory representation of data of interest. For instance,the projection of maximum intensity is useful only whenhigher intensities are those of interest. This may be thecase in the CT scans when the bones are to be visual-ized (bones have generally higher intensity than surround-ing tissue), or in scans with application of contrast agents.However, areas of interest are often occluded by structuresof higher intensity values in the MRI scans without con-trast; therefore, MIP is not applicable in this case.
Sometimes the volumetric visualization algorithms useclassification to enhance the final image [9]. The classi-fication assigns colours, opacity values, or both (dependson the rendering method) to individual tissues or materi-als to help the user to easily distinguish them. One of thesimplest and most intuitive methods of the classificationis a one-dimensional transfer function. It is able to filterout some of the structures and reveal the areas of inter-est within the volumetric data set. However, blurrynessand other factors cause this classification method to fail onsome of the data sets when using MIP or similar visualiza-tion algorithms.
2 Related work
As one of the most commonly used volumetric visualiza-tion methods, the MIP rendering algorihtm (introducedin [12]) has been subject to many improvements. Its ad-vantages make this method interesting, even though morecomplex visualization methods exist. Several enhance-ments that eliminate various disadvantages of MIP havebeen proposed.
Use of depth weighting has been proposed in [4]. Inten-sity values are weighted by a value dependant on a distancefrom the origin (position of virtual camera). This is essen-tially a fog effect applied to the MIP rendering. It results inimages with distinguishable depth of individual visualizedobjects. However, in some cases it may partially occludethe areas of interest.
Another modification of the MIP method was proposedin [11]. Instead of using the global maximum of the valuesalong the viewing ray, a first local maximum higher than apre-selected threshold value is used. If no value is higherthan the threshold, the global maximum is projected. Animprovement of this method has been proposed in [10].
A method that combines advantages of MIP and directvolume rendering has been introduced in [1]. This methodupdates an opacity profile based on difference between thesampled value and a current maximum value.
Numerous volumetric visualization methods that pro-vide additional information about visualized data havebeen introduced as well. The goal of these methods isto show as much information as possible without diffi-cult transfer function design. The use of weighted distancetransfrom has been proposed to enhance various featuresin rendered images of anatomical structures and to pro-vide contextual information about selected body parts [5].The gradient based rendering technique of objects bound-aries was introduced in [2]. Additionally, visualization en-hancement by level lines has been proposed in the paper.Probabilistic classification of different materials using sev-eral one-dimensional transfer functions has been proposedin [8].
Even though the classification methods using the one-dimensional transfer functions are widely used, volumetricrendering methods with multidimensional transfer func-tions are being examined as well. The problem of de-signing the multidimensional transfer functions has beenalso addressed [7]. Semi-automatic generation of trans-fer functions for direct volume rendering of boundariesbetween different materials within data set has been pro-posed in [6].
Statistical transfer function space has been introducedin [3] and addresses the problem of overlapping of inten-sity distributions of different materials that are to be clas-sified. The method extracts statistical properties from thedata and uses them to classify different materials. De-scribed method uses adaptive growing approach to esti-mate statistical properties of each sample point. Estima-tion is based on neighbouring values. Extracted propertiesare also utilized to improve visual quality of volume shad-ing by noise reduction.
3 Weighting by statistical cues
Our proposed approach is an enhancement of the standardMIP rendering with the distance weighting using the volu-metric ray casting algorithm. The goal was to enhance theMIP rendering technique in such manner that it could beemployed in rendering of CT or MRI scans with differentareas of interest.
The algorithm uses a one-dimensional transfer functionfor material classification, which is designed by the userby placing and moving control points of a cubic spline.The transfer function assigns opacity values to individualvoxels according to their intensity, which is used as an in-put for the transfer function. It could be used to suppressvarious ranges of intensities in the data set to reveal areasof interest.
Figure 1 shows the inability of a one-dimensional trans-fer function to classify a MRI scan in order to reveal the
Proceedings of CESCG 2011: The 15th Central European Seminar on Computer Graphics (non-peer-reviewed)

brain in the MIP rendered image. The goal was to re-move the skull (assign it a zero opacity), which the one-dimensional transfer function failed to accomplish, as thevoxels forming the outlines of the skull have the same in-tensity values as the brain tissue. Thin layers of voxels atthe surface of the head after classification have the same orhigher intensities than the brain tissue. MIP projects thesevoxels instead of the area of interest, which is the brain inthis case.
(a) Cross-section without classifica-tion
(b) Cross-section with classification
(c) MIP without classification (d) MIP with classification
Figure 1: Cross-section through an MRI scan of a humanhead without classification (1a) and with classification bya 1D transfer function (1b). Brain is occluded in the MIPrendering (1c), as well as in the MIP rendering with clas-sification by the 1D transfer function (1d). In both render-ings, higher intensity voxels of the skull occlude the brain.
Our algorithm tries to override this problem by usingstandard deviation of voxels along the projection ray tocalculate the weight of the sampled values. These valuesare then treated as in the standard MIP rendering – themaximum of the weighted values is projected into the finalimage.
The standard deviation is calculated from n previouslysampled values. These values form a window, whose sizeis constant during the rendering process. The size of thewindow should be as big as possible; however, voxel in-tensities should not be affected by voxels representing dif-ferent materials. Bigger window size therefore requiresuse of a smaller step size for the ray traversing.
The algorithm uses parameter τ , which is adjustablealong with the transfer function by the user. Weights of
the sampled values are calculated by formula 1.
wi = |2σ − τ| (1)
σ is the standard deviation of the window of i-th samplepoint, wi is the weight. The sampled value is multipliedby the weight and finally, the maximum of the resultingweighted values along the ray is projected into the image.
The τ parameter can be adjusted by the user to furtherspecify the area of interest. It serves as a parameter of asimple V-shaped transfer function for the standard devia-tion used to weight the sampled intensities from the dataset. Appropriate value of the τ parameter can be found bytrial and error by continually changing it while observingthe final rendering.
Our algorithm also uses the distance weighting imme-diately after sampling the value from the data set, as pro-posed in [4]. The depth of rendered objects is more per-ceptible this way. Figure 2 demonstrates the ability of ourmethod to efficiently employ a 1D transfer function formaterial classification.
3.1 Implementation
The proposed method is based on the volumetric ray cast-ing algorithm and processes one ray at the time. Coloursof individual pixels in rendered image could be calculatedindependently; therefore, rendering could be parallelized.Implementation on state-of-the-art graphic hardware maytake advantage of its massive parallelism and may result ininteractive real time rendering.
We have implemented the method as a GLSL ver-tex/fragment shader pair using OpenGL library. The im-age is rendered as a single quadrilateral covering the wholescreen while the vertex/fragment shader pair is in use. Thevertex shader does not transform positions of rendered ver-tices with the model view matrix, but it uses this transfor-mation to calculate the direction and position of the vir-tual camera. This design enables the use of the standardOpenGL matrix transformation commands to control thevirtual camera of the shader.
The volume ray casting algorithm is implemented asa fragment shader described bellow. The fragment shaderprocesses rays, as fragment colour is dependant only onthe evaluation of its respective ray. Number of steps istaken in order to evaluate each ray. Every step consistsof sampling two values along the ray. First value is sam-pled at the sampling position, which gradually move alongthe ray in constant intervals away from the camera posi-tion. Second value is sampled at the position n steps back.The steps, or the sampled values between these two posi-tions are referred to as a window. The two sampled values(which are transformed by the transfer function, stored as a1D texture) are used to calculate the standard deviation ofthe window. Standard deviation is calculated by followingformula:
Proceedings of CESCG 2011: The 15th Central European Seminar on Computer Graphics (non-peer-reviewed)

(a) Boundaries (b) Volumes
Figure 2: Comparison of a visualization of object boundaries and volumes by using our method with different transferfunctions (x-axis of the transfer function represents sampled intensity, y-axis represents output opacity)
; τ = 0 for both images.
σ =
√√√√√n(n∑
i=1x2
i )− (n∑
i=1xi)2
n(n−1)(2)
x1...xn are sampled intensities of the current window. Theare calculated by trilinear interpolation of voxel values sur-rounding the sampling point.
To calculate the standard deviation in O(1) time for the
window of every sampling point, values ofn∑
i=1xi and
n∑
i=1x2
i
are being accumulated as the shader marches along the ray.In every step, value sampled at the end of the window (far-ther from the camera) and its square are added to respec-tive accumulators, while value at the begining of the win-dow (closest to the camera) and its square are subtractedfrom the accumulators. This way, the formula 2 could beused to calculate the standard deviation for every windowin constant time, as the accumulators would always con-tain the sum of the sampled values and the sum of theirsquares. Consequently, the window would not be centredat the current sampling point.
The volumetric data is enclosed in a bounding box inorder to speed up the rendering. At the beginning of theevaluation of a ray, two intersections of the ray with thebounding box are calculated (in case the ray hits a vertexof the bounding box, these two intersections are equal).The sampling occurs only between these two positions inspace. As the values are sampled from positions with uni-form distances between each other, the number of steps foreach ray vary. This helps to reduce the rendering time.
The volumetric data are stored as a 3D texture in thememory of the graphic card. This way, sub-voxel values
(values from intermediate space between voxels) can besampled from the data set. Using OpenGL commands,graphic card could be instructed to use the trilinear filter-ing for the sampling. The trilinear interpolation of val-ues of neighbouring voxels significantly improves the ren-dering quality, even though it could introduce some minorartefacts to the visualized data. Listing 1 shows a fragmentof the shader program implementing out method.
Listing 1: Part of the MIPWSC fragment shader; p0 and p1are positions on the ray, i0 and i1 are step numbers on thebegining and the end of the window, t is the τ parameter.
vox0 = da taRead ( p0 ) ∗ ( 1 . 0 − f l o a t ( i 0 ) /fogLen ) ;
vox1 = da taRead ( p1 ) ∗ ( 1 . 0 − f l o a t ( i 1 ) /fogLen ) ;
p r o j 1 += vox0 ;p r o j S q r += vox0 ∗ vox0 ;p r o j 1 −= vox1 ;p r o j S q r −= vox1 ∗ vox1 ;c o u n t e r = f l o a t ( i 0 − i 1 ) ;
s = pow ( ( c o u n t e r ∗ p r o j S q r − p r o j 1 ∗ p r o j 1) / ( c o u n t e r ∗ ( c o u n t e r − 1 . 0 ) ) , 0 . 5 ) ;
vox0 = vox0 ∗ abs ( s ∗ 2 . 0 − t ) ;i f ( vox0 > p r o j ) {
p r o j = vox0 ;}
The listed fragment calculates the standard deviation ofthe window and weights the actual sampled value. The
Proceedings of CESCG 2011: The 15th Central European Seminar on Computer Graphics (non-peer-reviewed)

(a) MIP (b) Iso-surface
(c) AIP (d) SDP
(e) DVR (f) MIPWSC
Figure 3: An MRI scan of a female head rendered withdifferent volume visualization techniques using 1D trans-fer function for classification.
conditional branching at the end of the listing serves as amaximum operator for weighted values.
4 Results
As mentioned in Section 3, out method uses a one-dimensional transfer function for transforming intensitiesof voxels, window with adjustable length, and the τ pa-rameter adjustable by users; consequently, great varietyof result images could be achieved from a single data set.The transfer function and the τ parameter can be dynami-cally modified and are applied on the final rendering in realtime. This enables users to find the ideal transfer functionand the value of τ by trial and error.
Figure 3 compares several volumetric visualizationmethods with our proposed method. Drawbacks of indi-
(a) τ = 0.6 (b) τ = 0.3
(c) τ = 0.3 (d) τ = 0.2
(e) τ = 0.2 (f) τ = 0
Figure 4: An MRI scan of a female head rendered usingour method with different settings.
vidual rendering techniques are demonstrated: maximumintensity projection (3a) and iso-surface rendering (3b) areunable to efficiently use the transfer function classificationto reveal the brain tissue. Average intensity projection (3c)and standard deviation projection (3d) can reveal brain oc-cluded by skull, but the final images are blurry and do notshow too much detail. Direct volume rendering (3e) is ableto show the brain tissue in higher detail using a simple 1Dtransfer function, but the rendering quality is decreased bysevere artefacts. Maximum intensity projection weightedby statistical cues (3f) is able to reveal brain in high de-tail; therefore, it is demonstrated that our method overridessome of the drawbacks of other commonly used visualiza-tion methods.
Figure 4 shows several images rendered using our visu-alization method as a demonstration of variability, whichenables users to classify data in required fashion. One-dimensional transfer function and τ parameter are used to
Proceedings of CESCG 2011: The 15th Central European Seminar on Computer Graphics (non-peer-reviewed)
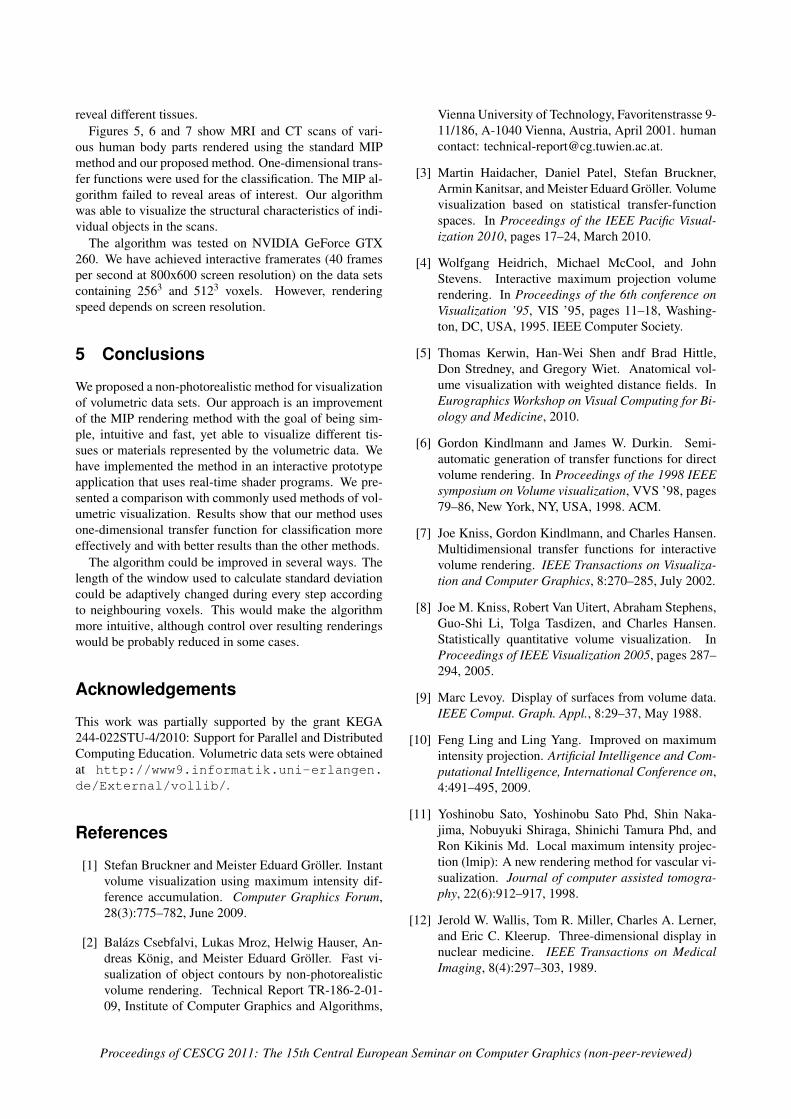
reveal different tissues.Figures 5, 6 and 7 show MRI and CT scans of vari-
ous human body parts rendered using the standard MIPmethod and our proposed method. One-dimensional trans-fer functions were used for the classification. The MIP al-gorithm failed to reveal areas of interest. Our algorithmwas able to visualize the structural characteristics of indi-vidual objects in the scans.
The algorithm was tested on NVIDIA GeForce GTX260. We have achieved interactive framerates (40 framesper second at 800x600 screen resolution) on the data setscontaining 2563 and 5123 voxels. However, renderingspeed depends on screen resolution.
5 Conclusions
We proposed a non-photorealistic method for visualizationof volumetric data sets. Our approach is an improvementof the MIP rendering method with the goal of being sim-ple, intuitive and fast, yet able to visualize different tis-sues or materials represented by the volumetric data. Wehave implemented the method in an interactive prototypeapplication that uses real-time shader programs. We pre-sented a comparison with commonly used methods of vol-umetric visualization. Results show that our method usesone-dimensional transfer function for classification moreeffectively and with better results than the other methods.
The algorithm could be improved in several ways. Thelength of the window used to calculate standard deviationcould be adaptively changed during every step accordingto neighbouring voxels. This would make the algorithmmore intuitive, although control over resulting renderingswould be probably reduced in some cases.
Acknowledgements
This work was partially supported by the grant KEGA244-022STU-4/2010: Support for Parallel and DistributedComputing Education. Volumetric data sets were obtainedat http://www9.informatik.uni-erlangen.de/External/vollib/.
References
[1] Stefan Bruckner and Meister Eduard Groller. Instantvolume visualization using maximum intensity dif-ference accumulation. Computer Graphics Forum,28(3):775–782, June 2009.
[2] Balazs Csebfalvi, Lukas Mroz, Helwig Hauser, An-dreas Konig, and Meister Eduard Groller. Fast vi-sualization of object contours by non-photorealisticvolume rendering. Technical Report TR-186-2-01-09, Institute of Computer Graphics and Algorithms,
Vienna University of Technology, Favoritenstrasse 9-11/186, A-1040 Vienna, Austria, April 2001. humancontact: [email protected].
[3] Martin Haidacher, Daniel Patel, Stefan Bruckner,Armin Kanitsar, and Meister Eduard Groller. Volumevisualization based on statistical transfer-functionspaces. In Proceedings of the IEEE Pacific Visual-ization 2010, pages 17–24, March 2010.
[4] Wolfgang Heidrich, Michael McCool, and JohnStevens. Interactive maximum projection volumerendering. In Proceedings of the 6th conference onVisualization ’95, VIS ’95, pages 11–18, Washing-ton, DC, USA, 1995. IEEE Computer Society.
[5] Thomas Kerwin, Han-Wei Shen andf Brad Hittle,Don Stredney, and Gregory Wiet. Anatomical vol-ume visualization with weighted distance fields. InEurographics Workshop on Visual Computing for Bi-ology and Medicine, 2010.
[6] Gordon Kindlmann and James W. Durkin. Semi-automatic generation of transfer functions for directvolume rendering. In Proceedings of the 1998 IEEEsymposium on Volume visualization, VVS ’98, pages79–86, New York, NY, USA, 1998. ACM.
[7] Joe Kniss, Gordon Kindlmann, and Charles Hansen.Multidimensional transfer functions for interactivevolume rendering. IEEE Transactions on Visualiza-tion and Computer Graphics, 8:270–285, July 2002.
[8] Joe M. Kniss, Robert Van Uitert, Abraham Stephens,Guo-Shi Li, Tolga Tasdizen, and Charles Hansen.Statistically quantitative volume visualization. InProceedings of IEEE Visualization 2005, pages 287–294, 2005.
[9] Marc Levoy. Display of surfaces from volume data.IEEE Comput. Graph. Appl., 8:29–37, May 1988.
[10] Feng Ling and Ling Yang. Improved on maximumintensity projection. Artificial Intelligence and Com-putational Intelligence, International Conference on,4:491–495, 2009.
[11] Yoshinobu Sato, Yoshinobu Sato Phd, Shin Naka-jima, Nobuyuki Shiraga, Shinichi Tamura Phd, andRon Kikinis Md. Local maximum intensity projec-tion (lmip): A new rendering method for vascular vi-sualization. Journal of computer assisted tomogra-phy, 22(6):912–917, 1998.
[12] Jerold W. Wallis, Tom R. Miller, Charles A. Lerner,and Eric C. Kleerup. Three-dimensional display innuclear medicine. IEEE Transactions on MedicalImaging, 8(4):297–303, 1989.
Proceedings of CESCG 2011: The 15th Central European Seminar on Computer Graphics (non-peer-reviewed)

(a) MIP (b) MIPWSC, τ = 0.6
Figure 5: A comparison of MIP and MIP weighted by statistical cues rendering of an MRI scan of a male head.
(a) MIP (b) MIPWSC, τ = 0.25
Figure 6: A comparison of MIP and MIP weighted by statistical cues rendering of a CT scan of a knee.
(a) MIP (b) MIPWSC, τ = 0.34
Figure 7: A comparison of MIP and MIP weighted by statistical cues rendering of a CT scan of a chest.
Proceedings of CESCG 2011: The 15th Central European Seminar on Computer Graphics (non-peer-reviewed)