Embed Size (px)
Citation preview
Maximizing Success on Integrated Projects:An Owner’s Guide
An Overview of the Research and Owner’s Guide

• Greg Gidez (co-chair), Hensel Phelps Construction Co.• Mark Konchar (co-chair), Balfour Beatty Construction• Howard W. Ashcraft, Esq., Hanson Bridgett LLP• Spencer Brott, Trammell Crow Real Estate Services, Inc.• Bill Dean, M.C. Dean, Inc.• Tom Dyze, Walbridge• Matthew Ellis, US Army Corps of Engineers• Behzad Esmaeili, University of Nebraska-Lincoln• Bryan Franz, University of Florida• Diana Hoag, Xcelsi Group, LLC
• Mike Kenig, Holder Construction • Robert Leicht, Penn State University• Russell Manning, Department of Defense• John Messner, Penn State University• John Miller, Barchan Foundation, Inc. • Keith Molenaar, Univ. of Colorado• Brendan Robinson, U.S. Architect of the Capitol• Victor Sanvido, Southland Industries• Ronald Smith, Kaiser Permanente• David P. Thorman, Former California State Architect
Maximizing Success on Integrated Projects:An Owner’s Guide
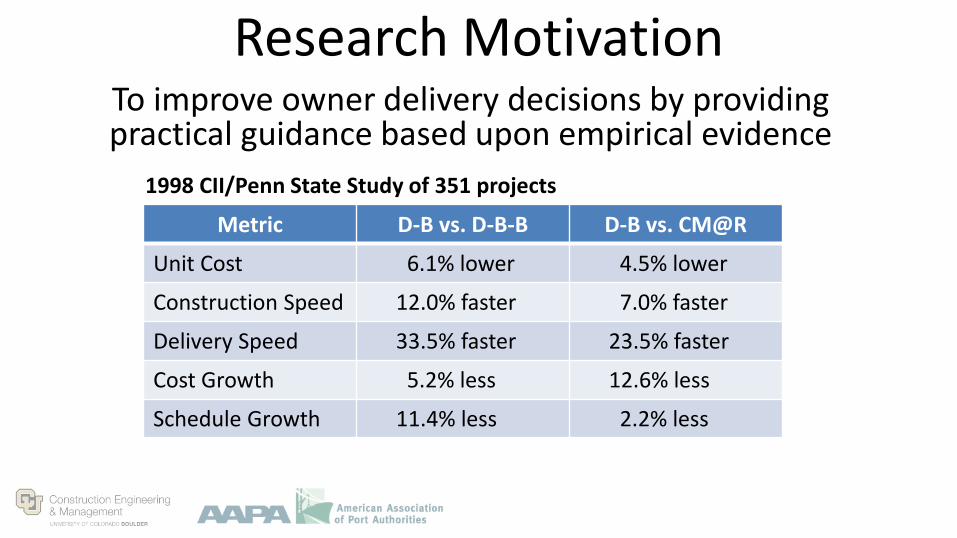
Metric D-B vs. D-B-B D-B vs. CM@R
Unit Cost 6.1% lower 4.5% lower
Construction Speed 12.0% faster 7.0% faster
Delivery Speed 33.5% faster 23.5% faster
Cost Growth 5.2% less 12.6% less
Schedule Growth 11.4% less 2.2% less
1998 CII/Penn State Study of 351 projects
Research MotivationTo improve owner delivery decisions by providing practical guidance based upon empirical evidence

Research MotivationTo improve owner delivery decisions by providing practical guidance based upon empirical evidence
1998 CII RT 133 2015 CPF-CII
Question How do project delivery methods impact performance?
How does the level of integration impact project delivery success?
Scope Delivery – DBB, CMR and DB Delivery, procurement, contracting, behaviors and environment
Findings DB was faster than DBB and CMR
Cost and schedule growth were
highest for DBB
Combined contracts were faster than
split contracts
Cost and quality were driven by
procurement and contracting
Best performing delivery strategies maximize
1. Early involvement of the core team
2. Qualification-based team selection
3. Transparency in cost accounting
Summary of Findings

Project Data Characteristics
Completed: 2008 - 2013
Public: 127 (62%)
Private: 77 (38%)
204 Projects
56 (27%)Educational
41 (20%)Office
32 (16%)Health Care
27 (13%)Lodging
20 (10%)Commercial
11 (5%)Sports & Recreation
11 (5%)Manufacturing
4 (2%) Correctional
2 (1%)Transportation
Facility Types
Number of Projects
1 32
Facility Sizes
(44%) 90 0 - 99,000 ft2(24%) 49 100,000 - 199,000 ft2
(13%) 26 200,000 - 299,000 ft2
(7%) 15 300,000 - 399,000 ft2
(3%) 6 400,000 - 499,000 ft2(2%) 3 500,000 - 599,000 ft2
(3%) 7
> 700,000 ft2
600,000 - 699,000 ft2
(4%) 8

FrameworkGroup CohesionDevelopment into an
effective unit
Team IntegrationBringing together In
high-quality interactions
DeliveryMethod
ProcurementProcess
Cost
Quality
Project Performance
Schedule
Goal: Determine if team processes and behaviors have an impact on project performance
Payment Terms
Delivery StrategyPlan for structuring design and construction services
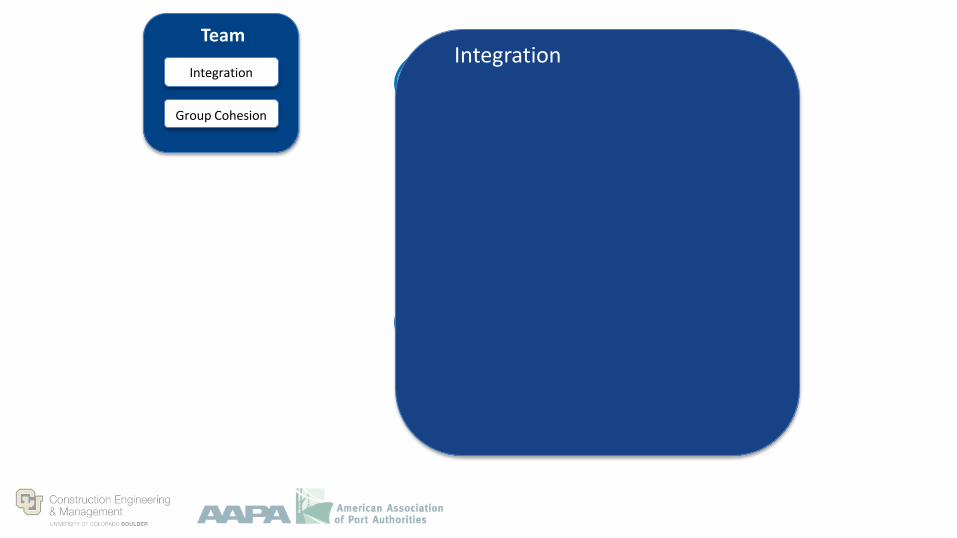
Group CohesionDevelopment into an
effective unit
Team IntegrationBringing together In
high-quality interactions
Team
Integration
Group Cohesion
Integration

Team
Integration
Cohesiveness
Degree to which team members from
separate organizations and disciplines are
engaged in collaborative activities
• Participation in • Joint Goal Setting• Cross Disciplinary design charrettes• BIM Execution Planning
• Increased sharing of information and analysis through BIM
• Increased team interaction through colocation
Higher levels of integration led to:• Reduced schedule growth• Enabled more intense schedules• Led to more cohesive teams
Team
Integration
Group Cohesion
Integration
Team
Integration
Group Cohesion
Group Cohesion
Degree to which team, as individuals,
have shared, task commitment, group
pride, and interpersonal alignment
• Commitment to shared goals
• High levels of team chemistry
• Communication is timely and effective
Higher group cohesiveness led to:• Reduced cost growth• Higher system quality• Improved turnover experience
Gro
up
Co
he
sio
n
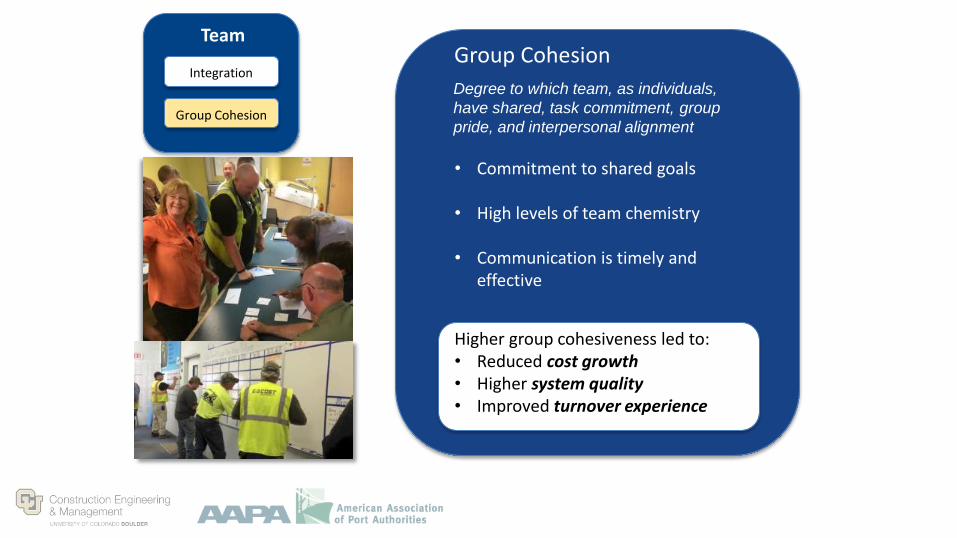
Team IntegrationTeam Integration
Gro
up
Co
hesio
n
Factor Value

Gro
up
Co
he
sio
n
Team Integration
70% of projects delivered late had below average levels of Team Integration
Team Integration
Gro
up
Co
hesio
n
Factor Value

Gro
up
Co
he
sio
n
Team Integration
60%of on budget projects had above
average levels of Group Cohesion
Team Integration
Gro
up
Co
hesio
n
Factor Value

Gro
up
Co
he
sio
n
Team IntegrationTeam Integration
Gro
up
Co
hesio
n
Factor Value
Gro
up
Co
he
sio
n
Team Integration
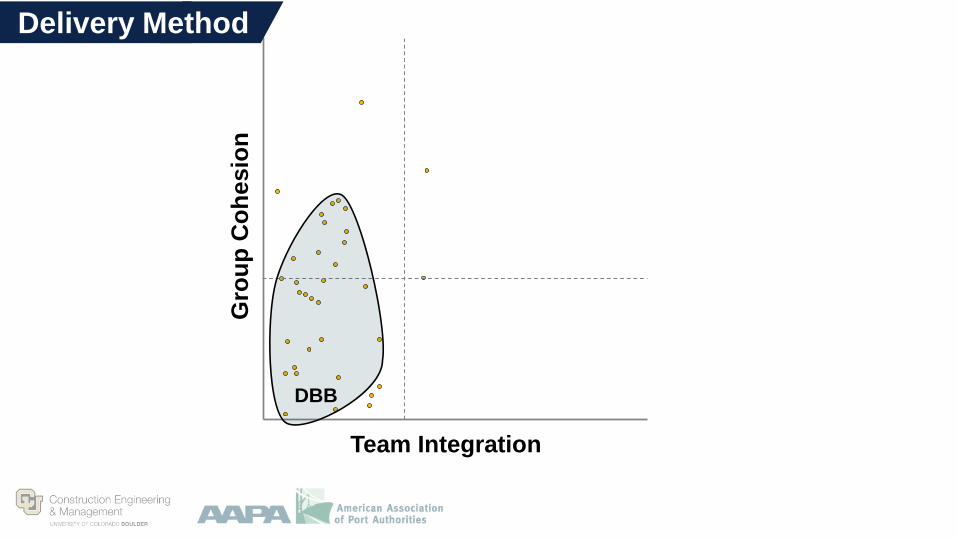
DBB
Team Integration
Gro
up
Co
hesio
n
Delivery Method

Gro
up
Co
he
sio
n
Team Integration
CM@R
Team Integration
Gro
up
Co
hesio
n
Delivery Method

Gro
up
Co
he
sio
n
Team Integration
DB
Team Integration
Gro
up
Co
hesio
n
Delivery Method

Gro
up
Co
he
sio
n
Team Integration
IPD
Team Integration
Gro
up
Co
hesio
n
Delivery Method

Gro
up
Co
he
sio
n
Team Integration
DBB
CM@R
DB
IPD
Large variance within
each delivery method
We need to consider more
than just delivery method
Delivery Method
Team Integration
Gro
up
Co
hesio
n
Gro
up
Co
he
sio
n
Team Integration
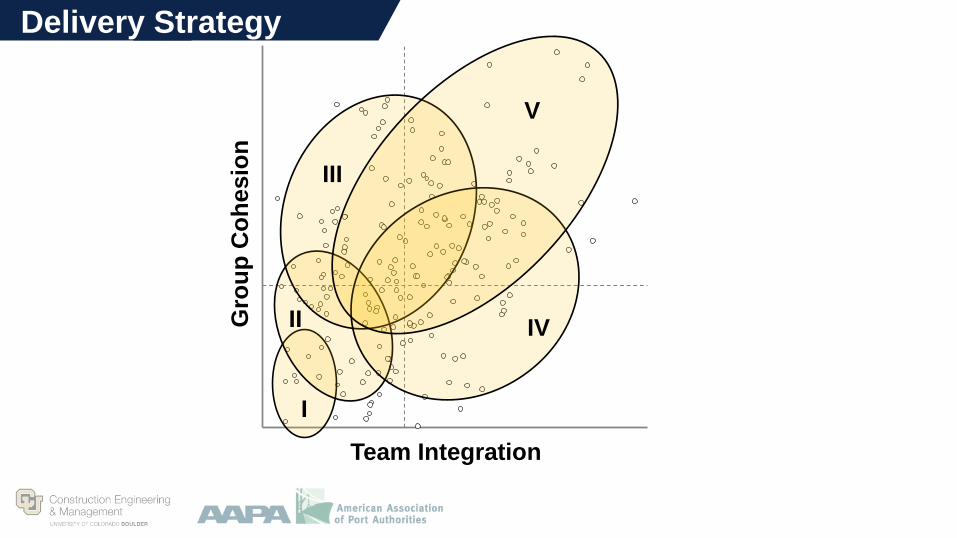
I
II
III
IV
V
Delivery Strategy
Team Integration
Gro
up
Co
hesio
n

Gro
up
Co
he
sio
n
Team Integration
I
II
III
IV
V
Team Integration
Gro
up
Co
hesio
n
• Reduced cost growth• Improved turnover experience• Higher system quality
• Reduced schedule growth• Enabled more intense schedules• Led to more group cohesion
The Owner’s GuidePulling it all together
Best performing delivery strategies maximize
1. Early involvement of the core team
2. Qualification-based team selection
3. Transparency in cost accounting

Sponsored by the Charles Pankow Foundation and the Construction Industry Institute Website: http://bim.psu.edu/delivery
Maximizing Success in
Integrated ProjectsAn Owner’s Guide
http://bim.psu.edu/delivery

1. Define Project NeedsAssess goals for management and performance
Document project summary
information (e.g. size, type, etc.)
Determine project goals (e.g.
time, cost, quality, etc.)
2. Explore Delivery OptionsDiscuss delivery decisions with attention to integrated
processes and team cohesion
1a.
1b. 2a-b.
2c.
2d-g.
Discuss organizational structure
(single vs. split D&C contracts,
timing of core team involvement)
Discuss contract payment terms
for builder and key trades (open
vs. closed book)
Discuss team assembly (e.g.
selection process and criteria, prior
experience, etc.)
Owner’s Project Delivery Strategy
– Project summary
– Project goals
– Etc.
3. Select Delivery StrategyIdentify an optimal delivery strategy consistent with
owner constraints
3a.
3b.
Identify owner’s legal and policy
constraints (e.g. procurement law,
staff experience, etc.)
Determine strategy by comparing to
research results (e.g. Classes I-V)
3c. Select and Implement Project
Delivery Strategy
The Process

Maximizing Success on Integrated Projects:An Owner’s Guide
An Overview of the Research and Owner’s Guide