Embed Size (px)
Citation preview

This presentation draws on ideas from Professor Porter’s articles and books, in particular, The Competitive Advantage of Nations (The Free Press, 1990), “Building the Microeconomic
Foundations of Competitiveness,” in The Global Competitiveness Report (World Economic Forum), “Clusters and the New Competitive Agenda for Companies and Governments” in On
Competition (Harvard Business School Press, 2008), “Creating Shared Value” (Harvard Business Review, Jan 2011), the Social Progress Index Report (Social Progress Imperative)
and ongoing related research. No part of this publication may be reproduced, stored in a retrieval system, or transmitted in any form or by any means - electronic, mechanical,
photocopying, recording, or otherwise - without the permission of Michael E. Porter. For further materials, see the website of the Institute for Strategy and Competitiveness
(www.isc.hbs.edu), FSG (www.fsg.org) and the Social Progress Imperative (www.socialprogressimperative.org).
Mauritius Competitiveness Overview
Professor Michael E. Porter
Harvard Business School
BSP International Conference
Pont Fer, Phoenix, Mauritius
April 2nd, 2014

Copyright 2014 © Professor Michael E. Porter 2 20140402—BSP Group Competitiveness Presentation—FINAL
• Competitiveness depends on the long-run productivity and efficiency of a
location as a place to do business
- The productivity of existing firms and workers
- The ability to achieve high participation of citizens in the workforce
• Competitiveness is not:
- Low wages
- A weak currency
- Jobs per se
A nation or region is competitive to the extent that firms operating there are able
to compete successfully in the regional and global economy while maintaining
or improving wages and living standards for the average citizen
What is Competitiveness?

Copyright 2014 © Professor Michael E. Porter 3 20140402—BSP Group Competitiveness Presentation—FINAL
1. Mauritius Performance
2. Drivers of Competitiveness
3. Economic Development Strategy
Agenda

Copyright 2014 © Professor Michael E. Porter 4 20140402—BSP Group Competitiveness Presentation—FINAL
Note: Upper middle income as defined by the World Bank includes countries with GNI per capita of $4,036 to $12,475
Source: EIU (2014), authors calculations
Prosperity Performance Mauritius vs. Upper Middle Income and Neighboring Countries
Albania
Algeria
Angola
Argentina
Belarus
Belize
Bosnia and Herzegovina
Botswana
Brazil
Bulgaria
Colombia
Costa Rica
Cuba
Dominica
Dominican Republic
Ecuador
Fiji
Gabon
Grenada
Hungary
India
Iran
Iraq
Jamaica Jordan
Kazakhstan Lebanon
Libya
Macedonia
Madagascar
Malaysia
Mauritius
Mexico
Mozambique
Namibia
Panama
Peru
Romania
Russia
Serbia
Seychelles
South Africa
St Lucia
Suriname
Tanzania
Thailand
Tonga
Tunisia
Turkey
Turkmenistan
Venezuela
$0
$5,000
$10,000
$15,000
$20,000
$25,000
$30,000
0% 1% 2% 3% 4% 5% 6% 7% 8% 9% 10%
PPP-Adjusted GDP per Capita, 2013 ($USD)
Growth in Real GDP per Capita (PPP-adjusted), CAGR, 2003-2013
China
(12.0%, $10,060)
Azerbaijan
(13.3%, $14,050)
Average: +5.6%
Average: $11,457
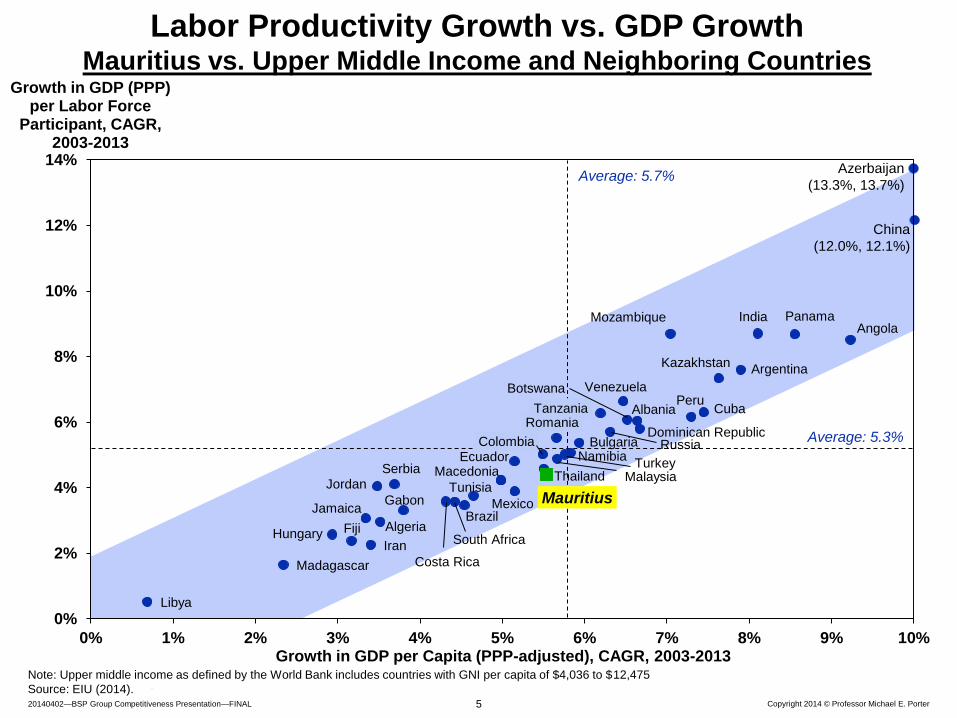
Copyright 2014 © Professor Michael E. Porter 5 20140402—BSP Group Competitiveness Presentation—FINAL
Labor Productivity Growth vs. GDP Growth Mauritius vs. Upper Middle Income and Neighboring Countries
Note: Upper middle income as defined by the World Bank includes countries with GNI per capita of $4,036 to $12,475
Source: EIU (2014).
Average: 5.3%
Average: 5.7%
China
(12.0%, 12.1%)
Azerbaijan
(13.3%, 13.7%)
Albania
Algeria
Angola
Argentina
Botswana
Brazil
Bulgaria Colombia
Costa Rica
Cuba
Dominican Republic
Ecuador
Fiji
Gabon
Hungary
India
Iran
Jamaica
Jordan
Kazakhstan
Libya
Macedonia
Madagascar
Malaysia
Mauritius Mexico
Mozambique
Namibia
Panama
Peru
Romania
Russia
Serbia
South Africa
Tanzania
Thailand Tunisia
Turkey
Venezuela
0%
2%
4%
6%
8%
10%
12%
14%
0% 1% 2% 3% 4% 5% 6% 7% 8% 9% 10%
Growth in GDP (PPP) per Labor Force
Participant, CAGR, 2003-2013
Growth in GDP per Capita (PPP-adjusted), CAGR, 2003-2013

Copyright 2014 © Professor Michael E. Porter 6 20140402—BSP Group Competitiveness Presentation—FINAL
Note: Upper middle income as defined by the World Bank includes countries with GNI per capita of $4,036 to $12,475
Source: EIU (2014), World Bank, authors calculations
The Role of Workforce Participation Mauritius vs. Upper Middle Income and Neighboring Countries
Improving Participation Declining Participation
Workforce Participation Rate
Labor Force Size
Population Age 15-64 =
Albania
Algeria
Angola
Argentina
Azerbaijan
Botswana
Brazil
Bulgaria
China
Colombia
Costa Rica
Ecuador
Gabon
Hungary
India
Iran
Jamaica
Jordan
Kazakhstan
Libya
Madagascar
Malaysia
Mauritius
Mexico
Namibia
Panama
Peru
Romania
Thailand
Tunisia
Turkey
Venezuela
40%
50%
60%
70%
80%
90%
100%
-10% -8% -6% -4% -2% 0% 2% 4% 6% 8% 10%
Labor Force Participation (2013)
Change in Labor Force Participation Rate, 2003-2013
Average: 1.2%
Average: 66.6%

Copyright 2014 © Professor Michael E. Porter 7 20140402—BSP Group Competitiveness Presentation—FINAL
Productivity Level and Growth
Country Competitive Environment
Domestic
investment Imports
Outbound
foreign direct
investment
Domestic
innovation
Inbound
foreign direct
investment
Exports
Competitiveness Indicators and Enablers
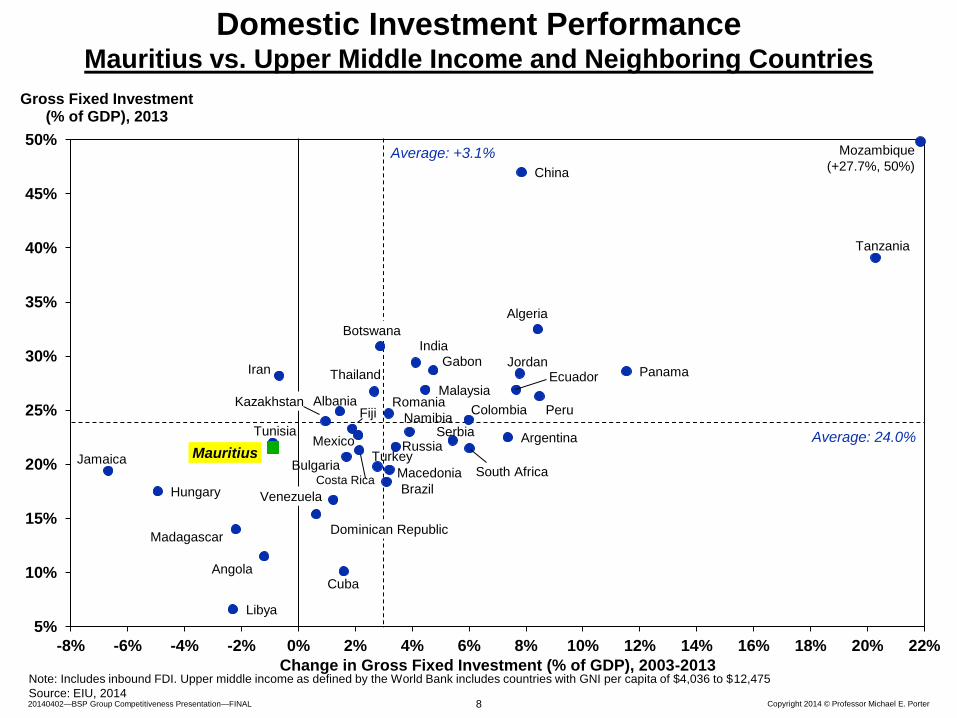
Copyright 2014 © Professor Michael E. Porter 8 20140402—BSP Group Competitiveness Presentation—FINAL
Albania
Algeria
Angola
Argentina
Botswana
Brazil
Bulgaria
China
Colombia
Costa Rica
Cuba
Dominican Republic
Ecuador
Fiji
Gabon
Hungary
India
Iran
Jamaica
Jordan
Kazakhstan
Libya
Macedonia
Madagascar
Malaysia
Mauritius Mexico
Namibia
Panama
Peru Romania
Russia Serbia
South Africa
Tanzania
Thailand
Tunisia
Turkey
Venezuela
5%
10%
15%
20%
25%
30%
35%
40%
45%
50%
-8% -6% -4% -2% 0% 2% 4% 6% 8% 10% 12% 14% 16% 18% 20% 22%
Gross Fixed Investment (% of GDP), 2013
Change in Gross Fixed Investment (% of GDP), 2003-2013
Mozambique
(+27.7%, 50%)
Domestic Investment Performance Mauritius vs. Upper Middle Income and Neighboring Countries
Average: 24.0%
Average: +3.1%
Note: Includes inbound FDI. Upper middle income as defined by the World Bank includes countries with GNI per capita of $4,036 to $12,475
Source: EIU, 2014

Copyright 2014 © Professor Michael E. Porter 9 20140402—BSP Group Competitiveness Presentation—FINAL
Albania Algeria
Angola
Argentina
Azerbaijan
Botswana
Brazil
Bulgaria
China
Colombia
Costa Rica
Cuba
Dominican Republic
Ecuador
Fiji Gabon
Hungary
India
Iran
Jamaica
Jordan Kazakhstan
Libya Macedonia
Madagascar
Malaysia
Mauritius
Mexico
Mozambique
Namibia
Panama
Peru
Romania
Russia
Serbia
South Africa
Tanzania
Thailand
Tunisia
Turkey Venezuela
0%
10%
20%
30%
40%
50%
60%
70%
80%
90%
100%
-30% -20% -10% 0% 10% 20% 30% 40%
Exports of Goods and Services (% of GDP),
2013
Change in Exports of Goods and Services (% of GDP), 2003-2013
Export Performance Mauritius vs. Upper Middle Income and Neighboring Countries
Note: Upper middle income as defined by the World Bank includes countries with GNI per capita of $4,036 to $12,475
Source: EIU (2014), authors calculations
Average: 40.7%
Average: 2.0%

Copyright 2014 © Professor Michael E. Porter 10 20140402—BSP Group Competitiveness Presentation—FINAL
Albania
Algeria
Angola
Argentina
Botswana
Brazil
Bulgaria
China
Colombia
Costa Rica
Cuba
Dominican Republic
Ecuador
Fiji
Gabon
Hungary
India
Iran
Jamaica
Jordan
Kazakhstan
Libya
Macedonia
Madagascar
Malaysia
Mauritius
Mexico
Mozambique
Namibia
Panama
Peru
Romania
Russia
Serbia
South Africa Tanzania
Thailand
Tunisia
Turkey
Venezuela
0%
10%
20%
30%
40%
50%
60%
70%
80%
90%
100%
-30% -20% -10% 0% 10% 20% 30% 40%
Imports of Goods and Services (% of GDP),
2013
Change in Imports of Goods and Services (% of GDP), 2003-2013
Import Performance Mauritius vs. Upper Middle Income and Neighboring Countries
Note: Upper middle income as defined by the World Bank includes countries with GNI per capita of $4,036 to $12,475
Source: EIU (2014), authors calculations
Average: 4.4%
Average: 44.0%

Copyright 2014 © Professor Michael E. Porter 11 20140402—BSP Group Competitiveness Presentation—FINAL
Albania Algeria
Angola
Argentina
Azerbaijan
Belarus
Belize
Bosnia and Herzegovina
Botswana
Brazil
Bulgaria
China Colombia
Costa Rica
Dominica
Dominican Republic Ecuador
Fiji
Gabon
Grenada
Hungary
Iran Iraq
Jamaica
Jordan
Kazakhstan
Lebanon
Libya
Madagascar
Malaysia
Maldives
Mauritius
Mexico
Mozambique Namibia
Palau
Panama
Peru
Romania
Russia
Serbia
Seychelles
South Africa
Thailand
Tonga
Tunisia
Turkey
Turkmenistan Venezuela
0%
20%
40%
60%
80%
100%
120%
0% 5% 10% 15% 20% 25% 30% 35% 40% 45% 50% 55% 60%
Inward FDI Stocks as % of GDP, Average 2001-
2011
FDI Inflows as % of Gross Fixed Capital Formation, Average 2001-2011
Inbound Foreign Investment Performance Mauritius vs. Upper Middle Income and Neighboring Countries
Note: Upper middle income as defined by the World Bank includes countries with GNI per capita of $4,036 to $12,475
Source: UNCTAD, World Investment Report (2013)
Average: 23.1%
Average: 40.7%
Montenegro
(87.2%, 98.27%)

Copyright 2014 © Professor Michael E. Porter 12 20140402—BSP Group Competitiveness Presentation—FINAL
1. Mauritius Performance
2. Drivers of Competitiveness
3. Economic Development Strategy
Agenda

Copyright 2014 © Professor Michael E. Porter 13 20140402—BSP Group Competitiveness Presentation—FINAL
Macroeconomic Competitiveness
Microeconomic Competitiveness
Sophistication
of Company
Operations and
Strategy
Quality of the
Business
Environment
State of Cluster
Development
Endowments
Human Development
and Effective
Political Institutions
Sound Monetary
and Fiscal Policies
What Determines Competitiveness?
• Productivity ultimately depends on improving the microeconomic capability of the economy and the
sophistication of local competition revealed at the level of firms, clusters, and regions
• Macroeconomic competitiveness sets the economy-wide context for productivity to emerge, but is not
sufficient to ensure productivity
• Endowments, including natural resources, geographical location, population, and land area, create a
foundation for prosperity, but true prosperity arises from productivity in the use of endowments

Copyright 2014 © Professor Michael E. Porter 14 20140402—BSP Group Competitiveness Presentation—FINAL
ISC Competitiveness Model Mauritius Competitiveness Profile, 2012
Mauritius’ GDP per capita rank is 58th
versus 140 countries
Source: Institute for Strategy and Competitiveness, Harvard University (2012), based in part on survey data from the World Economic Forum; analysis prepared based on research findings by Scott Stern, Mercedes
Delgado, and Christian Ketels.
Macroeconomic
Competitiveness
36
Political Institutions
31
Rule of Law
35
Human
Development
44
Microeconomic
Competitiveness
39
Macroeconomic
Policy
52
National Business
Environment
38
Company Operations
and Strategy
43
Country Competitiveness
37
Significant disadvantage
relative to income
Significant advantage
relative to income
Moderate advantage
relative to income
Moderate disadvantage
relative to income Neutral
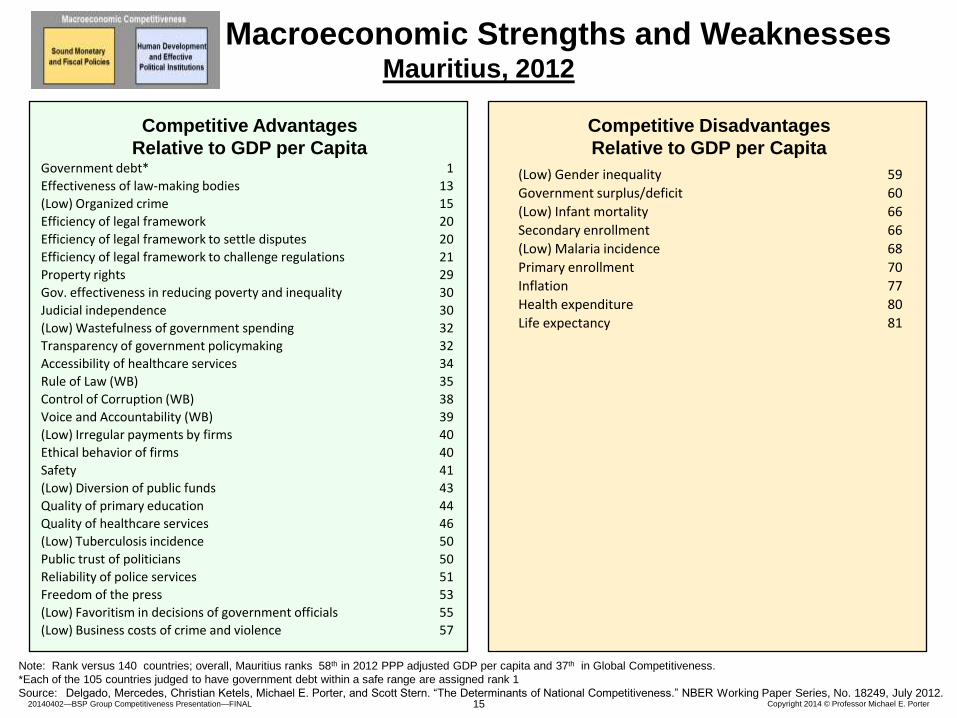
Copyright 2014 © Professor Michael E. Porter 15 20140402—BSP Group Competitiveness Presentation—FINAL
Competitive Disadvantages
Relative to GDP per Capita
Competitive Advantages
Relative to GDP per Capita
Macroeconomic Strengths and Weaknesses Mauritius, 2012
Government debt* 1
Effectiveness of law-making bodies 13
(Low) Organized crime 15
Efficiency of legal framework 20
Efficiency of legal framework to settle disputes 20
Efficiency of legal framework to challenge regulations 21
Property rights 29
Gov. effectiveness in reducing poverty and inequality 30
Judicial independence 30
(Low) Wastefulness of government spending 32
Transparency of government policymaking 32
Accessibility of healthcare services 34
Rule of Law (WB) 35
Control of Corruption (WB) 38
Voice and Accountability (WB) 39
(Low) Irregular payments by firms 40
Ethical behavior of firms 40
Safety 41
(Low) Diversion of public funds 43
Quality of primary education 44
Quality of healthcare services 46
(Low) Tuberculosis incidence 50
Public trust of politicians 50
Reliability of police services 51
Freedom of the press 53
(Low) Favoritism in decisions of government officials 55
(Low) Business costs of crime and violence 57
(Low) Gender inequality 59
Government surplus/deficit 60
(Low) Infant mortality 66
Secondary enrollment 66
(Low) Malaria incidence 68
Primary enrollment 70
Inflation 77
Health expenditure 80
Life expectancy 81
Note: Rank versus 140 countries; overall, Mauritius ranks 58th in 2012 PPP adjusted GDP per capita and 37th in Global Competitiveness.
*Each of the 105 countries judged to have government debt within a safe range are assigned rank 1
Source: Delgado, Mercedes, Christian Ketels, Michael E. Porter, and Scott Stern. “The Determinants of National Competitiveness.” NBER Working Paper Series, No. 18249, July 2012.

Copyright 2014 © Professor Michael E. Porter 16 20140402—BSP Group Competitiveness Presentation—FINAL
Competitive Disadvantages
Relative to GDP per Capita
Competitive Advantages
Relative to GDP per Capita
Sophistication of Company Operations and Strategy Mauritius, 2012
Value chain breadth 26
Control of international distribution 29
Extent of staff training 34
Nature of competitive advantage 35
Degree of customer orientation 39
Organizational practices 39
Internationalization of firms 41
Production process sophistication 43
Extent of incentive compensation 43
Reliance on professional management 44
Strategy and operational effectiveness 51
Prevalence of foreign technology licensing 52
Firm-level technology absorption 53
Willingness to delegate authority 55
Extent of marketing 58
Company spending on R&D 84
Capacity for innovation 108
Note: Rank versus 140 countries; overall, Mauritius ranks 58th in 2012 PPP adjusted GDP per capita and 37th in Global Competitiveness
Source: Delgado, Mercedes, Christian Ketels, Michael E. Porter, and Scott Stern. “The Determinants of National Competitiveness.” NBER Working Paper Series, No. 18249, July 2012.

Copyright 2014 © Professor Michael E. Porter 17 20140402—BSP Group Competitiveness Presentation—FINAL
Assessing the Quality of the Business Environment
Context for Firm Strategy and Rivalry
Related and Supporting Industries
Factor (Input)
Conditions
Demand Conditions
• Sophisticated and demanding local
needs
– e.g., Strict quality, safety, and
environmental standards
– Sophisticated demand in the private
sector or government
• Many things matter for competitiveness
• Successful economic development is a process of successive upgrading, in which the business environment improves to enable increasingly sophisticated ways of competing
• Local rules and incentives that
encourage investment and productivity
– e.g. incentives for capital investments,
IP protection
• Sound corporate governance
• Open and vigorous local competition
− Openness to competition
− Strict competition laws • Improving access to high quality
business inputs
– Qualified human resources
– Capital availability
– Physical infrastructure
– Scientific and technological
infrastructure
– Administrative and regulatory
infrastructure • Availability and quality of suppliers and
supporting industries

Copyright 2014 © Professor Michael E. Porter 18 20140402—BSP Group Competitiveness Presentation—FINAL
Competitive Disadvantages
Relative to GDP per Capita
Competitive Advantages
Relative to GDP per Capita
Diamond Strengths and Weaknesses Mauritius, 2012
Factor (Input)
Conditions
Paying Taxes: Payments number (WB) 9
(Low) Time required to start a business 13
Soundness of banks 13
Regulation of securities exchanges 17
Protection of minority shareholders’ interests 18
Administrative infrastructure 19
Number of procedures required to start a business 25
Capital market infrastructure 26
Ease of access to loans 32
Financial market sophistication 33
(Low) Burden of government regulation 34
Quality of the educational system 34
Domestic credit to private sector 37
Quality of math and science education 37
Financing through local equity market 38
(Low) Burden of customs procedures 40
Telephone lines per 100 population 42
Quality of port infrastructure 45
Quality of roads 48
Quality of air transport infrastructure 48
Venture capital availability 51
Logistical infrastructure 55
(Low) Brain drain 57
Quality of management schools 60
Innovation infrastructure 62
Getting Credit Legal rights index (WB ) 63
Internet access in schools 64
Quality of electricity supply 66
Percentage of households with computer 68
Quality of domestic transport network: business 69
Communications infrastructure 71
Utility patents per million population 76
Internet users per 100 population 80
University-industry research collaboration 80
Tertiary enrollment 81
Mobile telephone subscribers per 100 population 84
Quality of scientific research institutions 85
Availability of scientists and engineers 101
Quality of railroad infrastructure 119
Note: Rank versus 140 countries; overall, Mauritius ranks 58th in 2012 PPP adjusted GDP per capita and 37th in Global Competitiveness
Source: Delgado, Mercedes, Christian Ketels, Michael E. Porter, and Scott Stern. “The Determinants of National Competitiveness.” NBER Working Paper Series, No. 18249, July 2012.

Copyright 2014 © Professor Michael E. Porter 19 20140402—BSP Group Competitiveness Presentation—FINAL
Competitive Disadvantages
Relative to GDP per Capita
Competitive Advantages
Relative to GDP per Capita
Context for Firm Strategy and Rivalry
Diamond Strengths and Weaknesses Mauritius, 2012
Business impact of rules on FDI 6
Tax impact on incentives to work and invest 9
Effect of taxes and subsidies on competition 10
Strength of investor protection 13
Efficacy of corporate boards 15
Strength of auditing and reporting standards 20
Prevalence of trade barriers 22
Intensity of local competition 33
FDI and technology transfer 34
(Low) Tariff rate 34
Effectiveness of antitrust policy 37
Regulatory quality 37
Cooperation in labor-employer relations 38
Disruption from state-owned enterprises 43
Pay and productivity 55
Intellectual property protection 55
Prevalence of foreign ownership 67
Extent of market dominance (by business) 75
Note: Rank versus 140 countries; overall, Mauritius ranks 58th in 2012 PPP adjusted GDP per capita and 37th in Global Competitiveness
Source: Delgado, Mercedes, Christian Ketels, Michael E. Porter, and Scott Stern. “The Determinants of National Competitiveness.” NBER Working Paper Series, No. 18249, July 2012.

Copyright 2014 © Professor Michael E. Porter 20 20140402—BSP Group Competitiveness Presentation—FINAL
Competitive Disadvantages
Relative to GDP per Capita
Competitive Advantages
Relative to GDP per Capita
Demand Conditions
Diamond Strengths and Weaknesses Mauritius, 2012
Presence of demanding regulatory standards 12
Laws relating to ICT 41
Buyer sophistication 42
Government success in ICT promotion 53
Stringency of environmental regulations 59
Gov’t procurement of advanced tech. 75
Note: Rank versus 140 countries; overall, Mauritius ranks 58th in 2012 PPP adjusted GDP per capita and 37th in Global Competitiveness
Source: Delgado, Mercedes, Christian Ketels, Michael E. Porter, and Scott Stern. “The Determinants of National Competitiveness.” NBER Working Paper Series, No. 18249, July 2012.
Copyright 2014 © Professor Michael E. Porter 21 20140402—BSP Group Competitiveness Presentation—FINAL
Competitive Disadvantages
Relative to GDP per Capita
Competitive Advantages
Relative to GDP per Capita
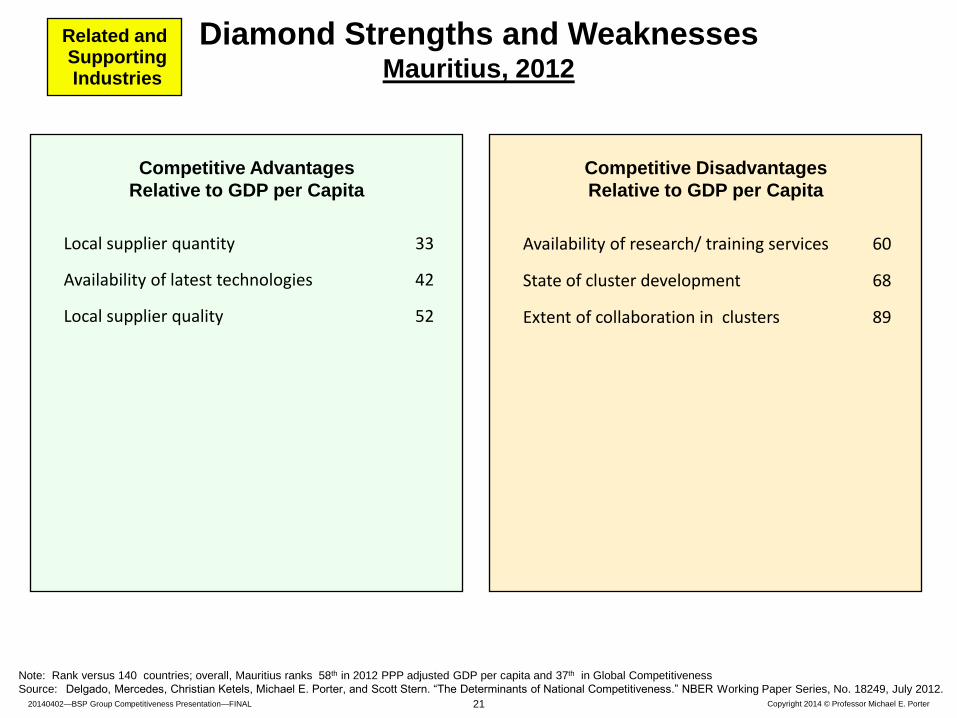
Related and Supporting Industries
Diamond Strengths and Weaknesses Mauritius, 2012
Local supplier quantity 33
Availability of latest technologies 42
Local supplier quality 52
Availability of research/ training services 60
State of cluster development 68
Extent of collaboration in clusters 89
Note: Rank versus 140 countries; overall, Mauritius ranks 58th in 2012 PPP adjusted GDP per capita and 37th in Global Competitiveness
Source: Delgado, Mercedes, Christian Ketels, Michael E. Porter, and Scott Stern. “The Determinants of National Competitiveness.” NBER Working Paper Series, No. 18249, July 2012.

Copyright 2014 © Professor Michael E. Porter 22 20140402—BSP Group Competitiveness Presentation—FINAL
What is a Cluster? Kenya’s Cut Flower Cluster
Plantstock
Greenhouse; Shading Structures
Irrigation Technology
Pre-Cooling Technology
Fertilizers, Pesticides, Herbicides
Agricultural Cluster
Horticultural Cluster
Post-Harvest Cooling
Technology
Grading / Packaging Sheds
Packaging & Labeling Materials
Refrigerated Trucks
Freight Forwarders
Clearing and Forwarding Agents
Air Carriers (Commercial /
Charters)
Tourism Cluster
Flower Farming Post-Harvest
Handling; Transport to Market
Horticultural Agencies, NGOs & Industry
Associations Horticultural Crops Development Authority (HCDA) Government Export Policies Targeting Horticulture
Non-Government Organizations (e.g., The Rural Enterprise Agri-Business Promotion Project)
Trade & Industry Associations (e.g., Kenya Flower Council)
Education, Research & Quality Standards
Organizations Research Institutions
(e.g., Kenya Agricultural Research Institute)
Public Universities with Post Graduate Degrees in Horticulture (e.g., University of Nairobi)
Quality & Standards (e.g., EUREGAP Standard, Kenya Plant Health Inspectorate Services)
Sources: MOC student team research by Kusi Hornberger, Nick Ndiritu, Lalo Ponce-Brito, Melesse Tashu, Tijan Watt, Harvard Business School, 2007

Copyright 2014 © Professor Michael E. Porter 23 20140402—BSP Group Competitiveness Presentation—FINAL
Empirical Evidence on Clusters Strong Clusters Drive Economic Performance
Source: “Cluster and Entrepreneurship” by Mercedes Delgado, Michael E. Porter, and Scott Stern (2010); “The Economic Performance of Regions” by Michael E. Porter (2003)
• Specialization in strong clusters
• Breadth of industries within each
cluster
• Strength in related clusters
• Presence of a region‘s clusters in
neighboring regions
• Job growth
• Higher wages
• Higher patenting rates
• Greater new business formation,
growth and survival

Copyright 2014 © Professor Michael E. Porter 24 20140402—BSP Group Competitiveness Presentation—FINAL
Mauritius National Cluster Export Portfolio 2001-2011
Mauritius Overall
World Export Share: 0.014%
Change in Mauritius Overall World Export Share: -.005%
= $30 million
Apparel
Business Services
Transportation and Logistics
Agricultural Products
Fishing and Fishing Products
Textiles
Construction Services
Metal Mining and Manufacturing
Medical Devices
Processed Food
Leather and Related Products
Lighting and Electrical Equipment
Chemical Products
Plastics
0.00%
0.02%
0.04%
0.06%
0.08%
0.10%
0.12%
0.14%
-0.12% -0.10% -0.08% -0.06% -0.04% -0.02% 0.00% 0.02% 0.04% 0.06%
World Export Market Share, 2011
Change in World Export Market Share, 2001-2011
Hospitality and Tourism
(.02%, .15%)
Copyright 2014 © Professor Michael E. Porter 25 20140402—BSP Group Competitiveness Presentation—FINAL
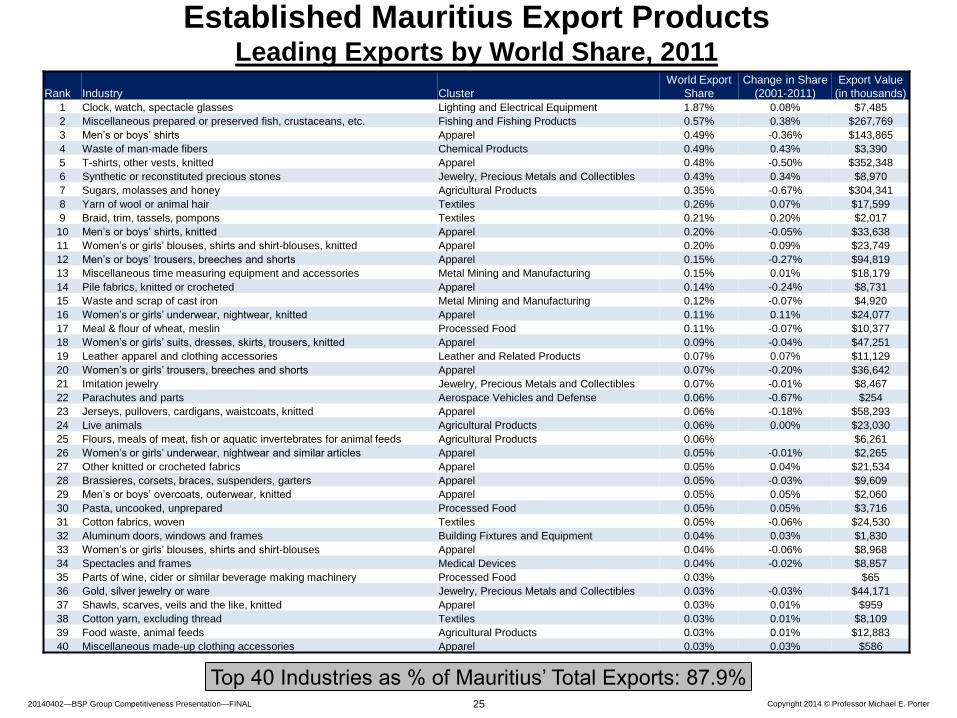
Established Mauritius Export Products Leading Exports by World Share, 2011
Rank Industry Cluster
World Export
Share
Change in Share
(2001-2011)
Export Value
(in thousands)
1 Clock, watch, spectacle glasses Lighting and Electrical Equipment 1.87% 0.08% $7,485
2 Miscellaneous prepared or preserved fish, crustaceans, etc. Fishing and Fishing Products 0.57% 0.38% $267,769
3 Men’s or boys’ shirts Apparel 0.49% -0.36% $143,865
4 Waste of man-made fibers Chemical Products 0.49% 0.43% $3,390
5 T-shirts, other vests, knitted Apparel 0.48% -0.50% $352,348
6 Synthetic or reconstituted precious stones Jewelry, Precious Metals and Collectibles 0.43% 0.34% $8,970
7 Sugars, molasses and honey Agricultural Products 0.35% -0.67% $304,341
8 Yarn of wool or animal hair Textiles 0.26% 0.07% $17,599
9 Braid, trim, tassels, pompons Textiles 0.21% 0.20% $2,017
10 Men’s or boys’ shirts, knitted Apparel 0.20% -0.05% $33,638
11 Women’s or girls’ blouses, shirts and shirt-blouses, knitted Apparel 0.20% 0.09% $23,749
12 Men’s or boys’ trousers, breeches and shorts Apparel 0.15% -0.27% $94,819
13 Miscellaneous time measuring equipment and accessories Metal Mining and Manufacturing 0.15% 0.01% $18,179
14 Pile fabrics, knitted or crocheted Apparel 0.14% -0.24% $8,731
15 Waste and scrap of cast iron Metal Mining and Manufacturing 0.12% -0.07% $4,920
16 Women’s or girls’ underwear, nightwear, knitted Apparel 0.11% 0.11% $24,077
17 Meal & flour of wheat, meslin Processed Food 0.11% -0.07% $10,377
18 Women’s or girls’ suits, dresses, skirts, trousers, knitted Apparel 0.09% -0.04% $47,251
19 Leather apparel and clothing accessories Leather and Related Products 0.07% 0.07% $11,129
20 Women’s or girls’ trousers, breeches and shorts Apparel 0.07% -0.20% $36,642
21 Imitation jewelry Jewelry, Precious Metals and Collectibles 0.07% -0.01% $8,467
22 Parachutes and parts Aerospace Vehicles and Defense 0.06% -0.67% $254
23 Jerseys, pullovers, cardigans, waistcoats, knitted Apparel 0.06% -0.18% $58,293
24 Live animals Agricultural Products 0.06% 0.00% $23,030
25 Flours, meals of meat, fish or aquatic invertebrates for animal feeds Agricultural Products 0.06% $6,261
26 Women’s or girls’ underwear, nightwear and similar articles Apparel 0.05% -0.01% $2,265
27 Other knitted or crocheted fabrics Apparel 0.05% 0.04% $21,534
28 Brassieres, corsets, braces, suspenders, garters Apparel 0.05% -0.03% $9,609
29 Men’s or boys’ overcoats, outerwear, knitted Apparel 0.05% 0.05% $2,060
30 Pasta, uncooked, unprepared Processed Food 0.05% 0.05% $3,716
31 Cotton fabrics, woven Textiles 0.05% -0.06% $24,530
32 Aluminum doors, windows and frames Building Fixtures and Equipment 0.04% 0.03% $1,830
33 Women’s or girls’ blouses, shirts and shirt-blouses Apparel 0.04% -0.06% $8,968
34 Spectacles and frames Medical Devices 0.04% -0.02% $8,857
35 Parts of wine, cider or similar beverage making machinery Processed Food 0.03% $65
36 Gold, silver jewelry or ware Jewelry, Precious Metals and Collectibles 0.03% -0.03% $44,171
37 Shawls, scarves, veils and the like, knitted Apparel 0.03% 0.01% $959
38 Cotton yarn, excluding thread Textiles 0.03% 0.01% $8,109
39 Food waste, animal feeds Agricultural Products 0.03% 0.01% $12,883
40 Miscellaneous made-up clothing accessories Apparel 0.03% 0.03% $586
Top 40 Industries as % of Mauritius’ Total Exports: 87.9%
Copyright 2014 © Professor Michael E. Porter 26 20140402—BSP Group Competitiveness Presentation—FINAL
Marine
Equipment
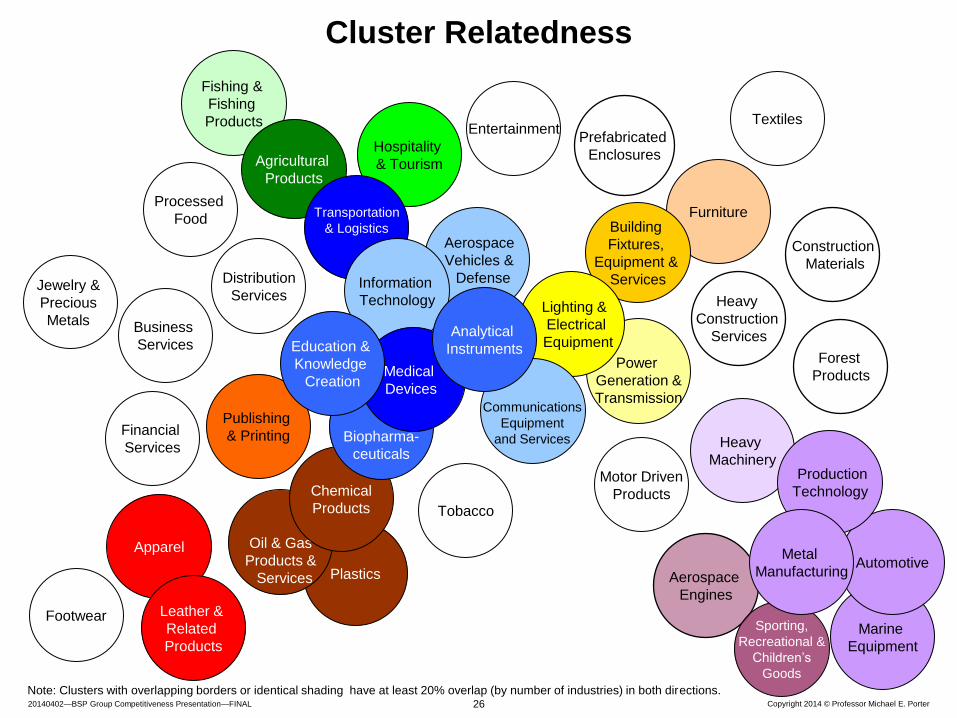
Cluster Relatedness
Furniture Building
Fixtures,
Equipment &
Services
Fishing &
Fishing
Products
Hospitality
& Tourism Agricultural
Products
Transportation
& Logistics
Plastics
Oil & Gas
Products &
Services
Chemical
Products
Biopharma-
ceuticals
Power
Generation &
Transmission
Aerospace
Vehicles &
Defense
Lighting &
Electrical
Equipment
Financial
Services
Publishing
& Printing
Entertainment
Information
Technology
Aerospace
Engines
Business
Services
Distribution
Services
Forest
Products
Heavy
Construction
Services
Construction
Materials
Prefabricated
Enclosures
Heavy
Machinery
Automotive
Sporting,
Recreational &
Children’s
Goods
Production
Technology Motor Driven
Products
Metal
Manufacturing
Jewelry &
Precious
Metals
Textiles
Footwear
Processed
Food
Tobacco
Medical
Devices
Analytical
Instruments Education &
Knowledge
Creation
Apparel
Leather &
Related
Products
Note: Clusters with overlapping borders or identical shading have at least 20% overlap (by number of industries) in both directions.
Communications
Equipment
and Services

Copyright 2014 © Professor Michael E. Porter 27 20140402—BSP Group Competitiveness Presentation—FINAL
Furniture Building
Fixtures,
Equipment &
Services
Fishing &
Fishing
Products Hospitality
& Tourism Agricultural
Products Transportation
& Logistics
Plastics
Oil &
Gas
Chemical
Products
Biopharma-
ceuticals
Power
Generation
Aerospace
Vehicles &
Defense
Lightning &
Electrical
Equipment
Financial
Services
Publishing
& Printing
Information
Tech.
Communications
Equipment
and Services*
Business
Services
Distribution
Services
Forest
Products
Heavy
Construction
Services
Construction
Materials
Prefabricated
Enclosures
Apparel
Leather &
Related
Products
Jewelry &
Precious
Metals
Textiles
Footwear
Processed
Food
Tobacco
Medical
Devices
Analytical
Instruments Education &
Knowledge
Creation
Note: Mauritius’ overall share of world exports is .0211%. * Data reflects Communications Services only.
Marine
Equipment
Aerospace
Engines
Heavy
Machinery
Sporting
& Recreation
Goods
Automotive
Production
Technology
Motor Driven
Products
Mining & Metal
Manufacturing
Entertainment
Cluster Relatedness and Economic Diversification Mauritius, 2001
0.01% - 0.021%
0.0211% - 0.1%
>0.1%
World Export Share
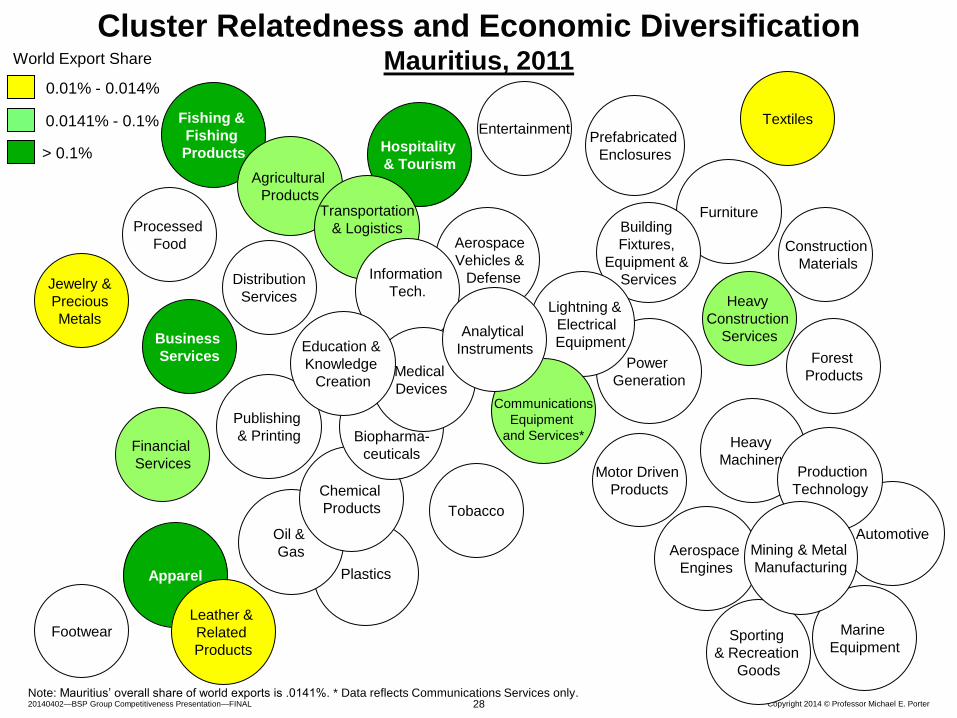
Copyright 2014 © Professor Michael E. Porter 28 20140402—BSP Group Competitiveness Presentation—FINAL
Furniture Building
Fixtures,
Equipment &
Services
Fishing &
Fishing
Products Hospitality
& Tourism Agricultural
Products Transportation
& Logistics
Plastics
Oil &
Gas
Chemical
Products
Biopharma-
ceuticals
Power
Generation
Aerospace
Vehicles &
Defense
Lightning &
Electrical
Equipment
Financial
Services
Publishing
& Printing
Information
Tech.
Communications
Equipment
and Services*
Business
Services
Distribution
Services
Forest
Products
Heavy
Construction
Services
Construction
Materials
Prefabricated
Enclosures
Apparel
Leather &
Related
Products
Jewelry &
Precious
Metals
Textiles
Footwear
Processed
Food
Tobacco
Medical
Devices
Analytical
Instruments Education &
Knowledge
Creation
Marine
Equipment
Aerospace
Engines
Heavy
Machinery
Sporting
& Recreation
Goods
Automotive
Production
Technology
Motor Driven
Products
Mining & Metal
Manufacturing
Entertainment
Cluster Relatedness and Economic Diversification Mauritius, 2011
0.01% - 0.014%
0.0141% - 0.1%
> 0.1%
World Export Share
Note: Mauritius’ overall share of world exports is .0141%. * Data reflects Communications Services only.
Copyright 2014 © Professor Michael E. Porter 29 20140402—BSP Group Competitiveness Presentation—FINAL
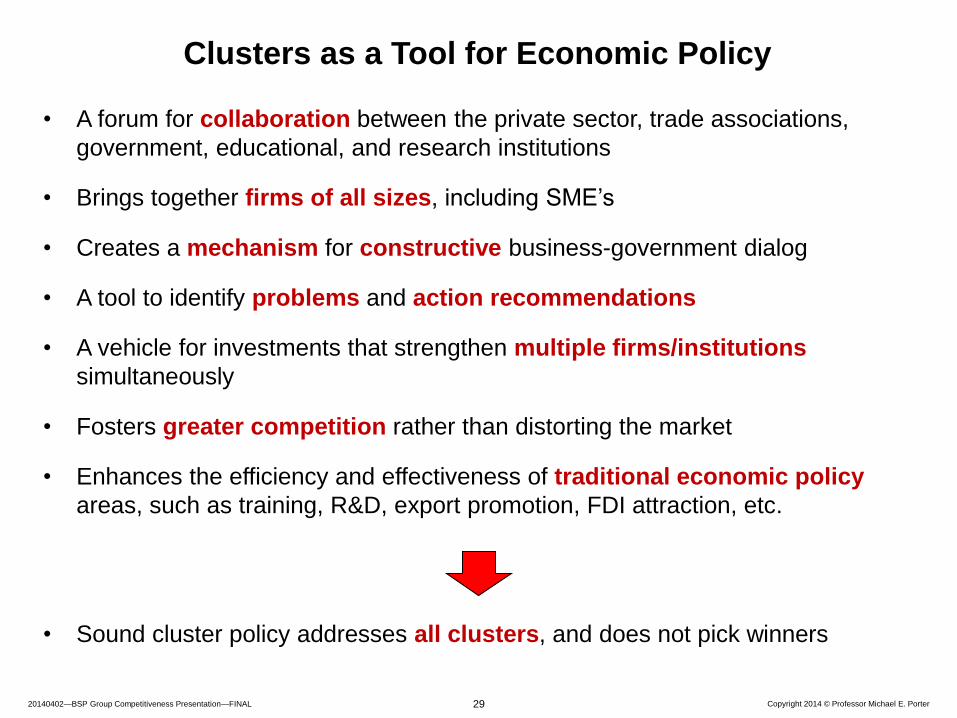
Clusters as a Tool for Economic Policy
• A forum for collaboration between the private sector, trade associations,
government, educational, and research institutions
• Brings together firms of all sizes, including SME’s
• Creates a mechanism for constructive business-government dialog
• A tool to identify problems and action recommendations
• A vehicle for investments that strengthen multiple firms/institutions
simultaneously
• Fosters greater competition rather than distorting the market
• Enhances the efficiency and effectiveness of traditional economic policy
areas, such as training, R&D, export promotion, FDI attraction, etc.
• Sound cluster policy addresses all clusters, and does not pick winners

Copyright 2014 © Professor Michael E. Porter 30 20140402—BSP Group Competitiveness Presentation—FINAL
1. Mauritius Performance
2. Drivers of Competitiveness
3. Economic Development Strategy
Agenda

Copyright 2014 © Professor Michael E. Porter 31 20140402—BSP Group Competitiveness Presentation—FINAL
National Value Proposition
The Need for an Economic Strategy
• What is the distinctive competitive position of the nation given its
location, legacy, existing strengths, and potential strengths?
– What unique advantages as a business location?
– For what types of activities and clusters?
– What roles with the surrounding countries and the broader global economy?
Developing Unique Strengths Achieving and Maintaining Parity
with Peers
• What elements of the business
environment can be unique strengths
relative to peers/neighbors?
• What existing and emerging clusters
can be built upon?
• What weaknesses must be addressed to
remove key constraints and achieve parity
with peer locations?
• Priorities and sequencing are a necessity in economic development

Copyright 2014 © Professor Michael E. Porter 32 20140402—BSP Group Competitiveness Presentation—FINAL
Tests of an Economic Strategy
• Does the strategy articulate a distinctive position for the country or region?
– That will create a positive identity?
– That will inspire citizens?
• Does the strategy build on existing or potential strengths?
– Are the strengths realistic versus neighbors and other peer countries?
• Does the strategy fit with trends in the neighborhood and the world economy?
• Is the strategy realistic given the country’s or region’s weaknesses? Can weaknesses that retard the strategy be neutralized?
• Are social and political reforms integrated with economic reforms and pursued simultaneously?
• Is there the political will and the political consensus to implement the strategy?

Copyright 2014 © Professor Michael E. Porter 33 20140402—BSP Group Competitiveness Presentation—FINAL
Tests of an Economic Strategy Continued
• Do the policy priorities fit the strategy?
– The choice of policies, and their design?
– The sequence in which policies are implemented?
• Has the strategy been communicated clearly to all stakeholders?
• Is the private sector engaged?
• Is government organized around the strategy?
• Is there an overall coordinating structure for economic development?
• Is the quality of governmental agencies and other institutions sufficient for effective implementation?
• Are there mechanisms to measure progress and review / modify the strategy as prosperity improves or conditions change?

Copyright 2014 © Professor Michael E. Porter 34 20140402—BSP Group Competitiveness Presentation—FINAL
Old Model
• Government drives economic
development through top down policy
decisions and incentives
New Model
• Economic development is a
collaborative process involving
government at multiple levels,
companies, educational and research
institutions, and private sector
organizations
• Competitiveness is the result of both top-down and bottom-up processes in
which many companies and institutions take responsibility
• Translating policy into action is decisive in determining success
The Process of Economic Development Shifting Roles and Responsibilities