Embed Size (px)
Citation preview

Matt Hopkins and William LazonickUniversity of Massachusetts Lowell
The Academic Industry Research Network (AIRNET)
Ford Foundation Conference on Finance, Business Models,And Sustainable Prosperity
December 6 and 7, 2012
Innovation versus Financialization in Renewable Energy
Total Carbon Dioxide Emissions from the Consumption of Energy (Million Metric Tons), Selected Countries, 1980-2009
Source: “Total Carbon Dioxide Emissions from the Consumption of Energy (Million Metric Tons)” eia.gov. Energy Information Administration. International Energy Statistics Data. Accessed 13 Apr 2011.
The Cause of Climate Change is the Emission of Greenhouse Gases (GHG), and CO2 Emissions are the Major GHG of the World
ChinaUSA
IndiaRussia
AfricaJapan
Germany
CanadaIran
S. Korea UK
South AfricaMexico
Saudi Arabia
Brazil
Other 2020
1,000
2,000
3,000
4,000
5,000
6,000
7,000
8,000
9,000
1980 1990 1995 2000 2005 2010

Total Primary Energy Supply, World and OECD, 1973 and 2009
Source: “Key World Energy Statistics 2011.” International Energy Agency. According to the IEA “Other” includes geothermal, solar, wind, tide / wave / ocean energy, electricity, and heat. There were 34 members of the OECD in 2010, and 24 in 1973. 34 Members exist currently. According to the IEA “Total Primary Energy Supply” (TPES) is made up of production + imports – exports – international marine bunkers –
international aviation bunkers ± stock changes. For the world total, international marine bunkers and international aviation bunkers are not subtracted from TPES.
OilCoal/Peat
Natural Gas
Biofuels and WasteNuclear
Hydro Other0%
10%
20%
30%
40%
50%
1%
World Percent of Total Primary Energy Supply 1973
World Percent of Total Primary Energy Supply 2009
OECD Percent of Total Primary Energy Supply 1973
OECD Percent of Total Primary Energy Supply 2010
The World (Still) Runs on Fossil Fuels

Clean Technology is expected to address three issues: the need for GHG reduction, Energy Independence, and Job Creation
GHG reduction in response to the threat of climate change, energy independence in response to Fossil Energy dominated economies (Including coal power, U.S. is also the top consumer of petroleum, Top 4 producer), and . . .
– In the wake of the recent global economic crisis, a means to spur economic growth
– $194 billion in 2009 funding worldwide, lead by the U.S. ($67 billion) and China ($47 billion).
Given the “Mission Requirements” Policy Makers must focus on three core activities, which are R&D, Manufacturing, and Deployment of Clean Technology
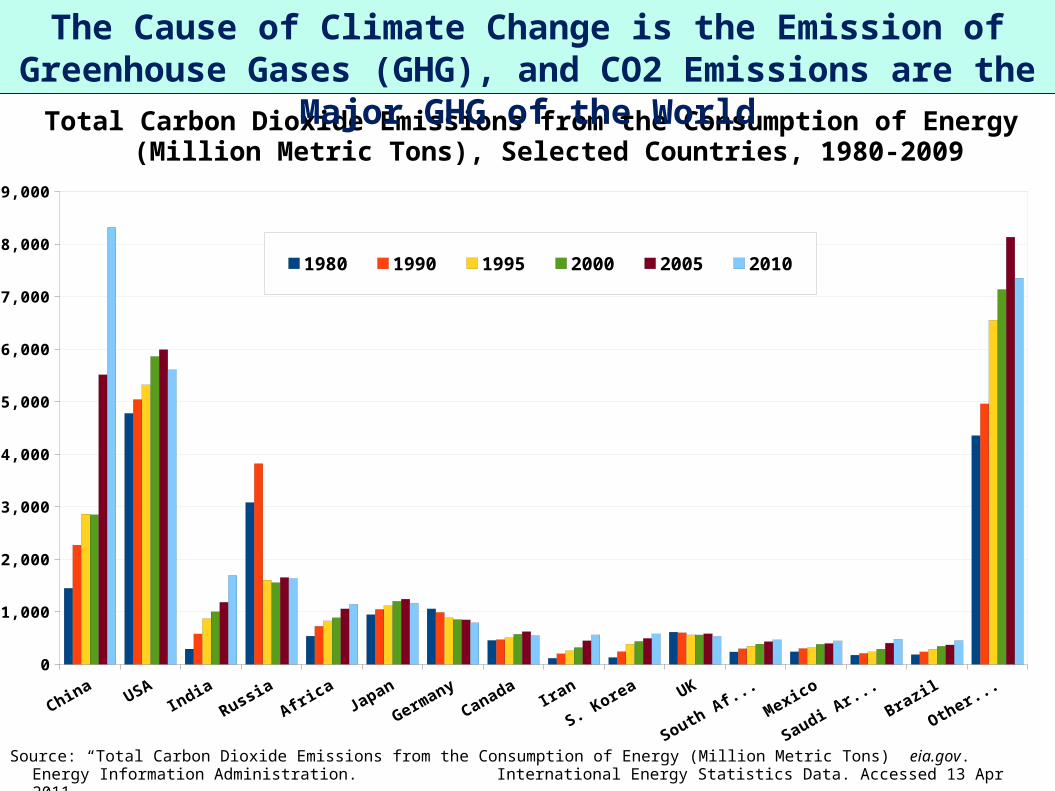
Clean Technology Development as a Response to Multiple “Missions”
Clean technology spans many different economic sectors, such as transportation, energy, energy efficiency, energy storage, and smart grid. What does “all of the above mean?”
Making these investments requires attention to the Theory of the Innovative Enterprise – which provides an explanation as to how policy makers and business enterprises can overcome uncertainties as they seek to generate disruptive energy technologies
The Expectation that Innovation will occur as a result of public and business investments requires that each will provide and sustain the patient capital required to develop the technologies, firms, and markets that make up clean technology sectors and which are full of uncertainty and risk
What are the commitments of the U.S. government and Business Community, and what have been some of the outcomes?
Clean Technology Development as a Response to Multiple “Missions”
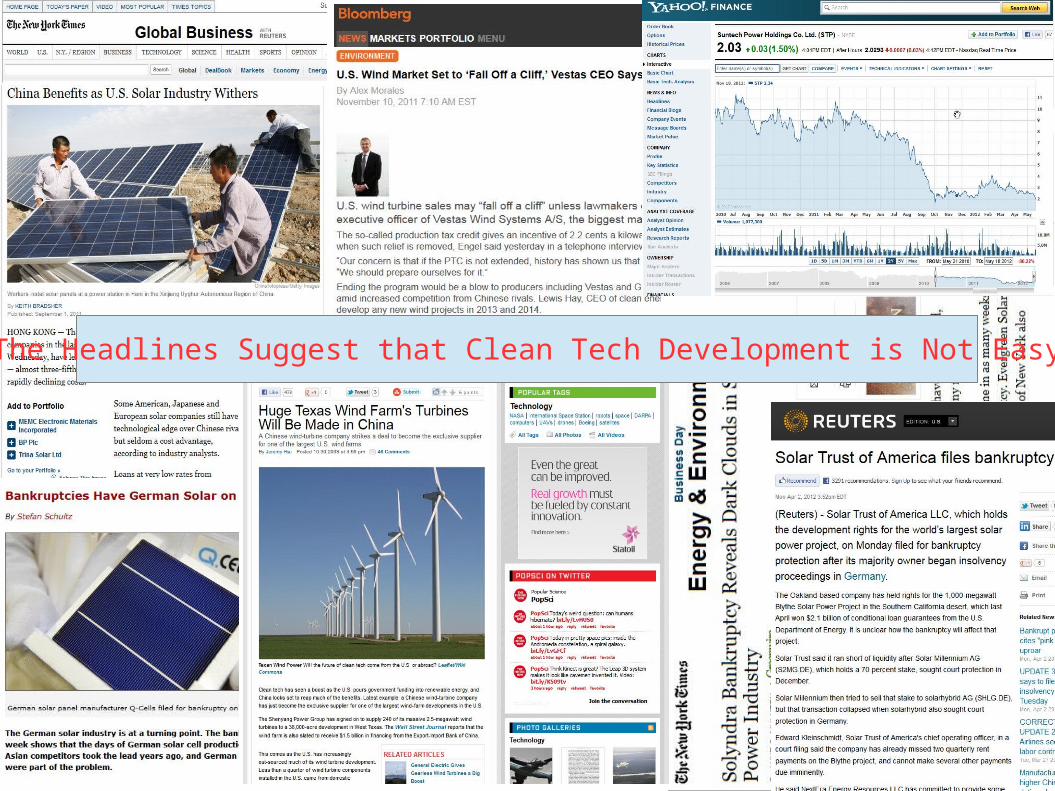
The Headlines Suggest that Clean Tech Development is Not Easy
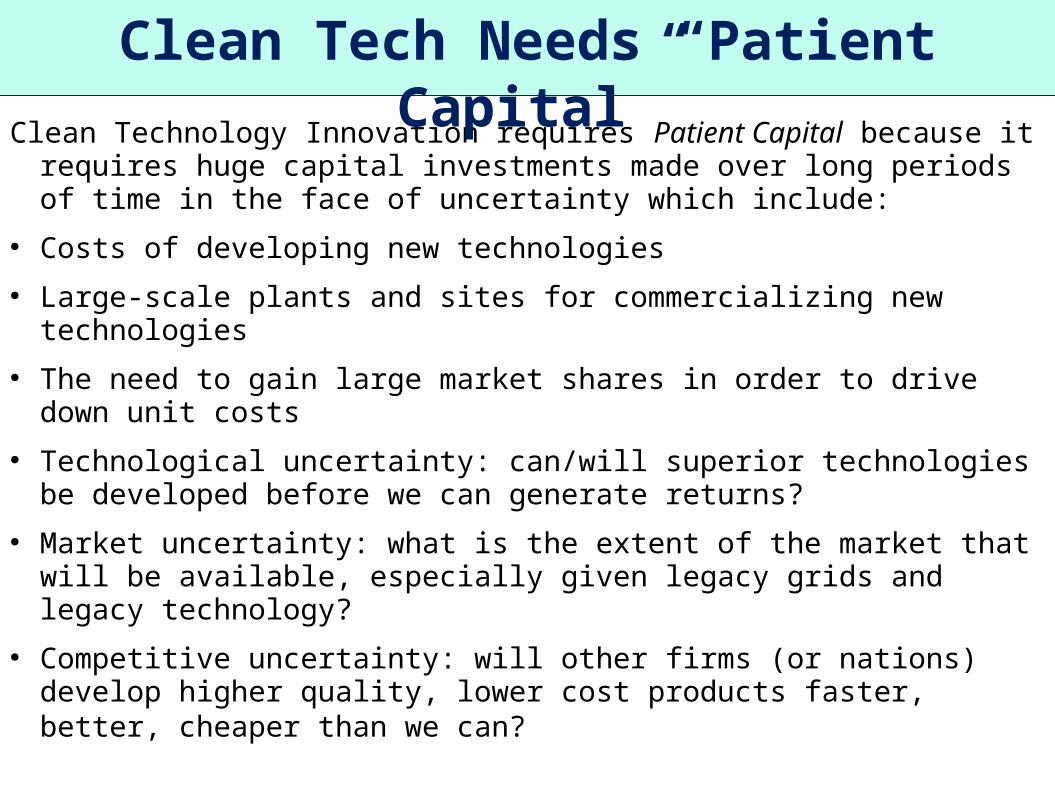
Clean Technology Innovation requires Patient Capital because it requires huge capital investments made over long periods of time in the face of uncertainty which include:
● Costs of developing new technologies
● Large-scale plants and sites for commercializing new technologies
● The need to gain large market shares in order to drive down unit costs
● Technological uncertainty: can/will superior technologies be developed before we can generate returns?
● Market uncertainty: what is the extent of the market that will be available, especially given legacy grids and legacy technology?
● Competitive uncertainty: will other firms (or nations) develop higher quality, lower cost products faster, better, cheaper than we can?
Clean Tech Needs “Patient Capital”
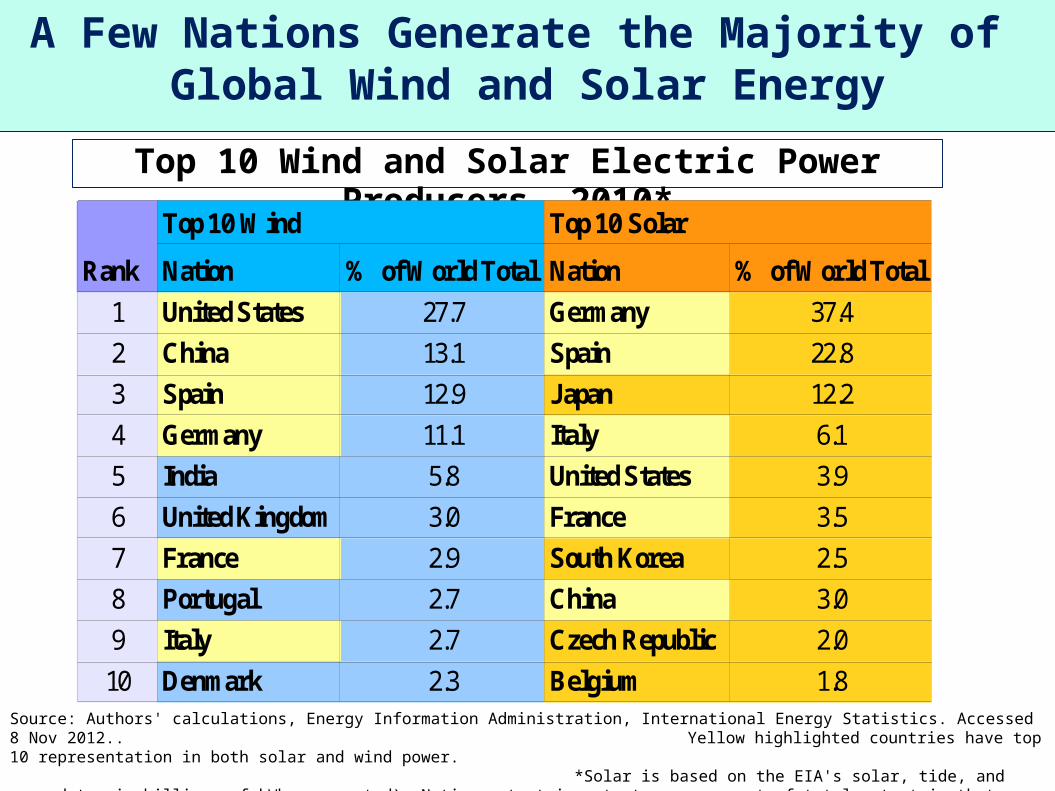
Source: Authors' calculations, Energy Information Administration, International Energy Statistics. Accessed 8 Nov 2012.. Yellow highlighted countries have top 10 representation in both solar and wind power. *Solar is based on the EIA's solar, tide, and wave data, in billions of kWhs generated). Nation output is output as a percent of total output in that category. There is virtually no tidal or wave energy power being produced on the planet at this time, so the figures are meaningful for showing leadership in solar power.
A Few Nations Generate the Majority of Global Wind and Solar Energy
Top 10 Wind and Solar Electric Power Producers, 2010*
Rank
Top 10 Wind Top 10 Solar
Nation % of World Total Nation % of World Total
1 United States 27.7 Germany 37.4
2 China 13.1 Spain 22.8
3 Spain 12.9 Japan 12.2
4 Germany 11.1 Italy 6.1
5 India 5.8 United States 3.9
6 United Kingdom 3.0 France 3.5
7 France 2.9 South Korea 2.5
8 Portugal 2.7 China 3.0
9 Italy 2.7 Czech Republic 2.0
10 Denmark 2.3 Belgium 1.8

● Nations that lead in Renewable Energy development tend to have policies supporting R&D, manufacturing, and deployment, and also policies that:
Define social goals and couple them to targets/goals for RE development
Define environmental goals and couple them to targets for emissions reductions
Regulate and standardize interconnection of new energy resources
Subsidize the cost of Renewable Energy technology development, manufacture, and deployment by providing and sustaining government support
Government as a Source of Patient Capital?

Advanced Research Projects Agency, Energy (ARPA-E) was the only new Government Agency created from the ARRA
– ARPA-E founded under the 2007 America Competes Act but funded by the 2009 ARRA (Steven Chu helps author NAS report “inventing” the agency) – sole purpose is to disrupt and commercialize
– Initial funding of $400 million, $850 million total through 2012, with request for $350 million FY13
21 billion ($2011) has supported Renewable Energy R&D between 1948-2010, out of 184 billion in U.S. R&D support overall
– 17 billion for Energy Efficiency, 96 billion to Nuclear, 48 billion fossil, 9 billion Electric Systems
– Virtually unfunded until creation of DOE in 1978
– Even over last decade, Fossil and nuclear receive more 3.4 billion ($2011) allocated to solar PV, and 1.2 billion wind ($2011) 1990s to
today
Putting a Dollar Value on Government Support(R&D)

DOE Loan Guarantee Program created by 2005 Energy Policy Act, funded by 2009 ARRA to provide $35 billion through -
– 1703 program: U.S.-located firms producing high risk, non-commercial new technology. $10 billion for Nuclear Power projects
– 1705 program: RE Project funding and Manufacturing support $16 billion
– (ATVM) Advanced Technology Vehicles Manufacturing: Finances Tesla, Fisker, Nissan, Ford, Vehicle Production Group. $8 billion
1705 Program provided $1.3 billion in loan guarantees to solar manufacturers (Solyndra, 1366 Tech, SoloPower, Abound)
Examples of State/alternate funding:
– $58 million to Evergreen from State of MA
– $22 million from State of Ohio to First Solar, about $60 million from Germany
– $32 million from State of NY to Spectrawatt
Putting a Dollar Value on Government Expend.(Manufacturing)
Putting a Dollar Value on Government Expend.(Government as a source of patient capital?)
Putting a Dollar Value on Government Expend.(Deployment Support)
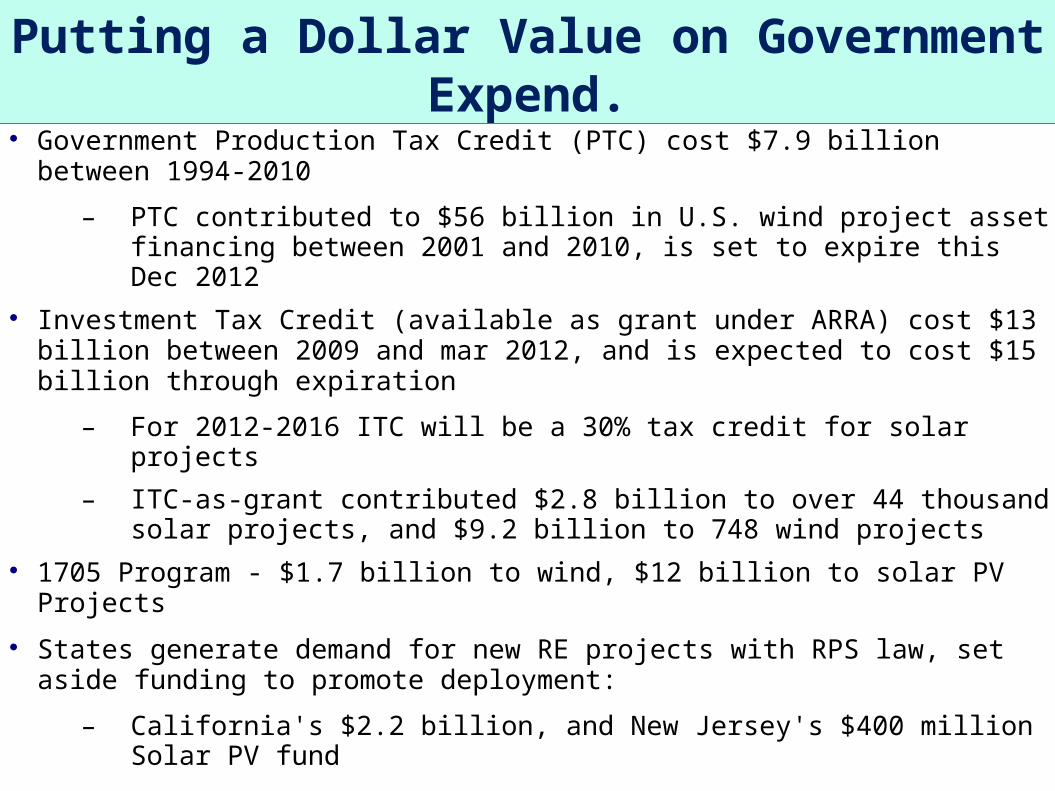
Government Production Tax Credit (PTC) cost $7.9 billion between 1994-2010
– PTC contributed to $56 billion in U.S. wind project asset financing between 2001 and 2010, is set to expire this Dec 2012
Investment Tax Credit (available as grant under ARRA) cost $13 billion between 2009 and mar 2012, and is expected to cost $15 billion through expiration
– For 2012-2016 ITC will be a 30% tax credit for solar projects
– ITC-as-grant contributed $2.8 billion to over 44 thousand solar projects, and $9.2 billion to 748 wind projects
1705 Program - $1.7 billion to wind, $12 billion to solar PV Projects
States generate demand for new RE projects with RPS law, set aside funding to promote deployment:
– California's $2.2 billion, and New Jersey's $400 million Solar PV fund

Business as a Source of Patient Capital? Business can provide patient capital:
Private equity (including venture capital) Retained earnings Public bond issues
Uses of patient capital: Fund internal R&D Knowledge transfer, such as through joint venture,
licensing agreements, participation in government or university research collaboration
Merger & Acquisition

Interaction of Government and Business Finance:The presence of substantial public and business investment in innovation
means that government finance will interact and are inseparable. “Patient” government capital encourages “risky” business investment:
● Government investment in fundamental and applied R&D creates or supports creation of solution, then encourages firm formation and growth- VC and PE appear to finance the transition made between R&D, product
prototyping, and commercialization- Financial support for manufacturing encourages scale, or the translation
of high fixed costs into low unit costs- Meanwhile the promise of future returns creates “exit” opportunity for
VC and PE investors via IPO or Merger/Acquisition● Meanwhile support for a strong RE development market encourages RE
developers to purchase lots of wind turbines and solar panels (developers can be utilities, businesses, or homeowners), and allows 3rd party investors opportunity to cash in on tax credits
But is an Abundance of Capital the Same as an Abundance of Patient Capital? Are we carrying out the missions?

Wind Power:
$11 billion invested in wind projects in 2010 alone
Cumulative investment in wind power $78 billion for 40 GW between 1980s-2010 (not including manufacturing, R&D, or O&M costs)
Number of manufacturing facilities increasing, domestic content growing (Even as GE loses international market share)
Disruption in the availability of tax credits driving wind deployment has a negative impact on manufacturing (layoffs, canceled plans to enter U.S. market, etc)
Poor Government Commitment?

Legislative History of the Production Tax Credit
Why is the U.S. Falling Behind in Clean Tech?
Year Event
1978 ITC introduced
1985 ITC discontinued, except for Solar PV
1992-1999 PTC introduced
Jan-1999 July 1999 PTC lapses for 6 months
Jan 2002-Mar 2001 PTC lapses for 2 months
Jan 2004-Oct 2004 PTC Lapses for 9 months
2009 PTC Set to expire Dec 2012
30% ITC reintroduced for 24 months for Wind
Sources: (1) Wiser, Bolinger, and Barbose. “Using the Federal Production Tax Credit to Build a Durable Market for Wind Power in the United States.” Lawrence Berkeley National Laboratory. Nov 2007. Web. 11 May 2011. (2) “Renewable Electricity Production Tax Credit.” Dsireusa.org. DSIRE. Web. 14 Jun 2011 (3) “Business Energy Investment Credit.” Dsireusa.org. DSIRE. Web. 12 Nov 2012.
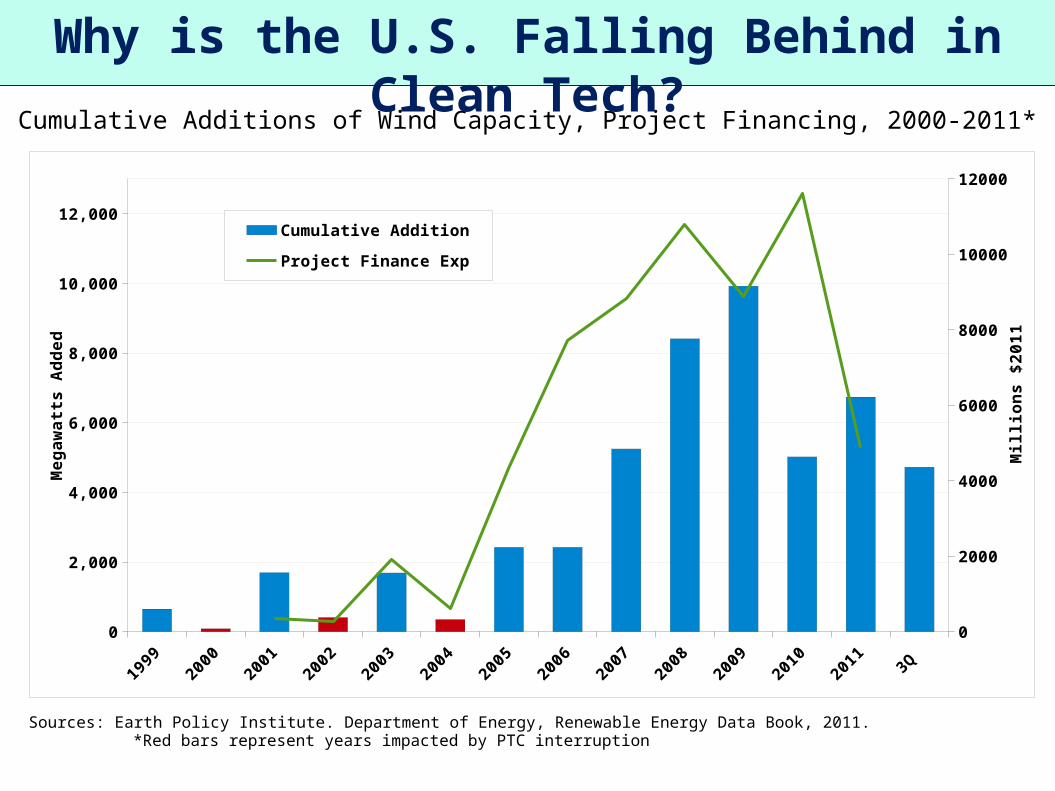
Cumulative Additions of Wind Capacity, Project Financing, 2000-2011*
Why is the U.S. Falling Behind in Clean Tech?
1999
2000
2001
2002
2003
2004
2005
2006
2007
2008
2009
2010
2011
3Q 20
120
2,000
4,000
6,000
8,000
10,000
12,000
0
2000
4000
6000
8000
10000
12000
Cumulative Addition
Project Finance Exp
Meg
awat
ts A
dd
ed
Mill
ion
s $2
011
Sources: Earth Policy Institute. Department of Energy, Renewable Energy Data Book, 2011. *Red bars represent years impacted by PTC interruption

Percent of Total Installed World Wind Capacity, 2011*
Sources: Authors' calculations, Earth Policy Institute, Global Wind Energy Council. *Shown are the top 10 ordered by total amount of total capacity installed as of 2011. Total capacity represents the aggregate generator value of all wind
turbine installed globally. One wind turbine might equal 1.5 MW. The percent of total installed capacity represents that nation's share of the wind power capacity installed in 2011.
Others
Portugal
Canada
UK
Italy
France
India
Spain
Germany
U.S.
China
0% 5% 10% 15% 20% 25% 30% 35% 40% 45%
43%34%
Percent of Total Global Capacity 2011Percent Global Installed Capacity 2011
While the U.S. Struggles to regain domestic market momentum, China marches On.
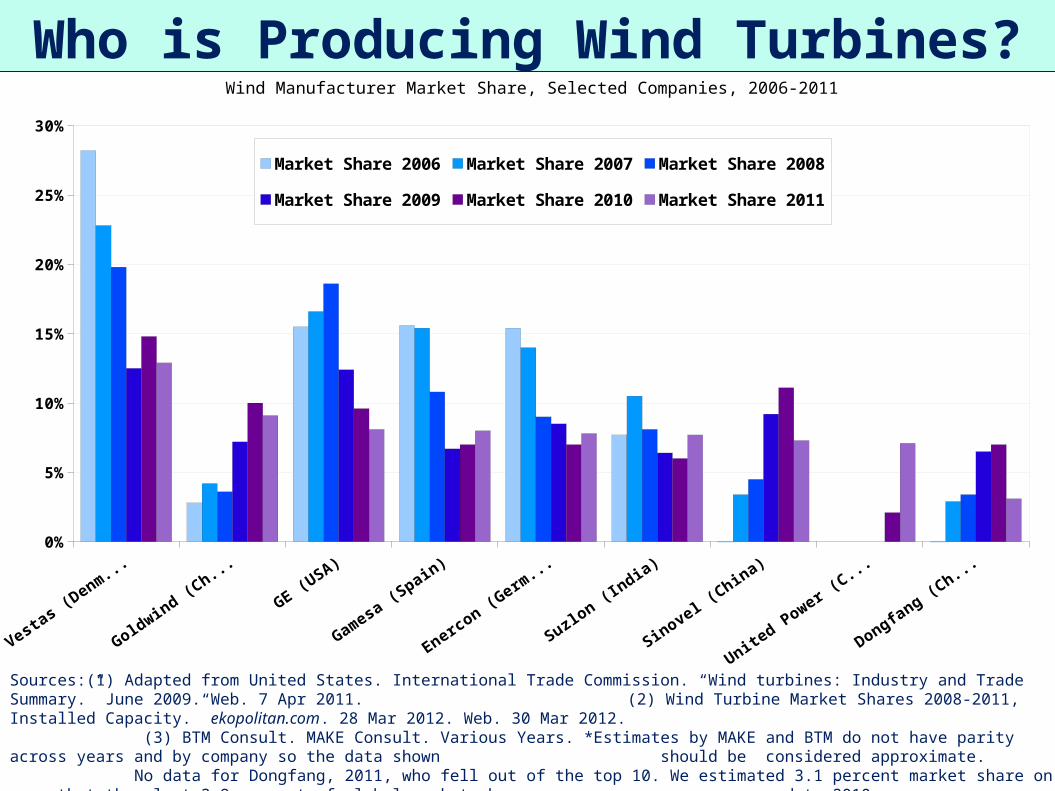
Wind Manufacturer Market Share, Selected Companies, 2006-2011
Vestas (D
enmark
)
Goldwind (China)
GE (USA)
Gamesa (S
pain)
Enercon (G
ermany)
Suzlon (In
dia)
Sinovel (China)
United Power
(China)
Dongfang (China)
0%
5%
10%
15%
20%
25%
30%
Market Share 2006 Market Share 2007 Market Share 2008
Market Share 2009 Market Share 2010 Market Share 2011
Who is Producing Wind Turbines?Who is Producing Wind Turbines?Who is Producing Wind Turbines?
Sources:(1) Adapted from United States. International Trade Commission. “Wind turbines: Industry and Trade Summary.” June 2009. Web. 7 Apr 2011. (2) Wind Turbine Market Shares 2008-2011, Installed Capacity.” ekopolitan.com. 28 Mar 2012. Web. 30 Mar 2012. (3) BTM Consult. MAKE Consult. Various Years. *Estimates by MAKE and BTM do not have parity across years and by company so the data shown should be considered approximate. No data for Dongfang, 2011, who fell out of the top 10. We estimated 3.1 percent market share on news that they lost 3.9 percent of global market share compared to 2010.

Clean Technology already creates substantial “exit” possibilities for investors:
$59 billion raised by 356 Clean Technology IPOs done between 2005-2011, $10 billion (92 IPOs) by North American Firms.
$132 billion in M&As in 1,700 deals between 2005-2011, $51 billion (892 deals) in North American deals.
U.S. leads in global VC/PE with appr. $31 billion invested in U.S. companies between 2004 and 2011 (compared to $50 billion for companies worldwide)
On the Deployment front, of the Approx. $1.2 trillion invested in clean technologies between 2001-2010, half is the asset financing which funds RE projects – aka Technology “Deployment” - mostly of wind turbines.
Putting a Dollar Value on the Interaction of Government and Business Capital

Sources: (1) Pernick, Ron, et al. “Clean Energy Trends 2012.” Cleanedge. Mar 2012. Web. 15 Mar 2012. (2) “Who's Winning the Clean Energy Race?” Pew Charitable Trust. Various Years.
2001
2000
2002
2003
2004
2005
2006
2007
2008
2009
2010
2011
$0
$10
$20
$30
$40
$50
$60
$70
$80
$90
$100
$0
$2
$4
$6
$8
$10
$12
Solar PVBiofuelsWind PowerUS Venture CapitalGlobal Venture Capital and Private Equity
Glo
bal
Mar
ket
$B
illio
ns
VC
Exp
end
itu
res
$Bill
lion
s
Global Clean-Energy Market Size and VC Spending, 2000-2011
As Markets Grow U.S. is still VC King
Solar Power:
$8.1 billion in Venture Capital and Private Equity flowed into solar companies between 2001 and 2010.
Rise of thin-film and C-Si solar manufacturers in part supported with at least $3.3 billion in public equity through IPOs conducted between 1980 and 2012 by U.S. Solar PV companies
Meanwhile, public support also helped make 2011 a historic year for the United States which installed 1,855 MWs of solar PV (albeit with growing share of Chinese solar panels), an $8.4 billion market
U.S. Manufacturers supplied just 7% of the 28 GW global market, however
U.S. companies develop advanced solar technologies and innovative solar development approaches – but do they have the patient capital to complete the missions?
The Sun Could Set on U.S. Solar PV Manufacturing

Capital is flowing into the U.S. solar sector, but it seems impatient business interests, including Clean Technology executives, want returns that are too high too soon:
Critics point to Solyndra's $535 million loan guarantee – not the presence of $1.1 billion in “smart money” which fled the company when its prospect of completing an IPO was challenged by a shift in global markets
Spectrawatt was bankrupted for a batch of defective components and want of $40 million to continue operations
Evergreen lost $1.1 billion throughout its history and, despite government support to open a Devens, MA, plant, was lured to China by a superior public finance package
The Sun Could Set on Solar PV Manufacturing (cont)

Producers of Solar PV by Percent of Annual Total, Selected Nations, 1995-2010
Source: “Annual Solar Photovoltaics Production by Country, 1995-2010.” Earth Policy Institute. 27 Oct 2011. Accessed 14 May 2012.
1995
1996
1997
1998
1999
2000
2001
2002
2003
2004
2005
2006
2007
2008
2009
2010
0%
10%
20%
30%
40%
50%
60%
China Taiwan Japan Germany United States Rest of World
Who is Producing Solar Panels?
● At least 22 IPOs have produced $1.4 billion in U.S.-based Solar PV IPOs since the 1980s, two of the largest for GT Solar ($500 million) and First Solar ($400 million)
● In the presence of a speculative stock market, coupled to firms which finance growth and compensation with equity produce value whether firms succeed or fail: A Perverse Incentive
● The success of First Solar provided for the sale of $2.8 billion in stock between 2006 and 2012, from which Investor/CEO Michael Ahearn reaped $740 million. He has since renounced any additional equity compensation. Meanwhile, at least $42 million in non-stock compensation has flowed to top executives
● GE has announced intentions to invest $600 million in CdTe thin-film solar PV manufacture in Colorado, but retracted this decision to spend more time improving on technologies absorbed through acquisition of Astrosolar (2004), and Primestar (2011), which developed record setting CdTe technology with government support
Value Extraction: Picking Winners and Losers
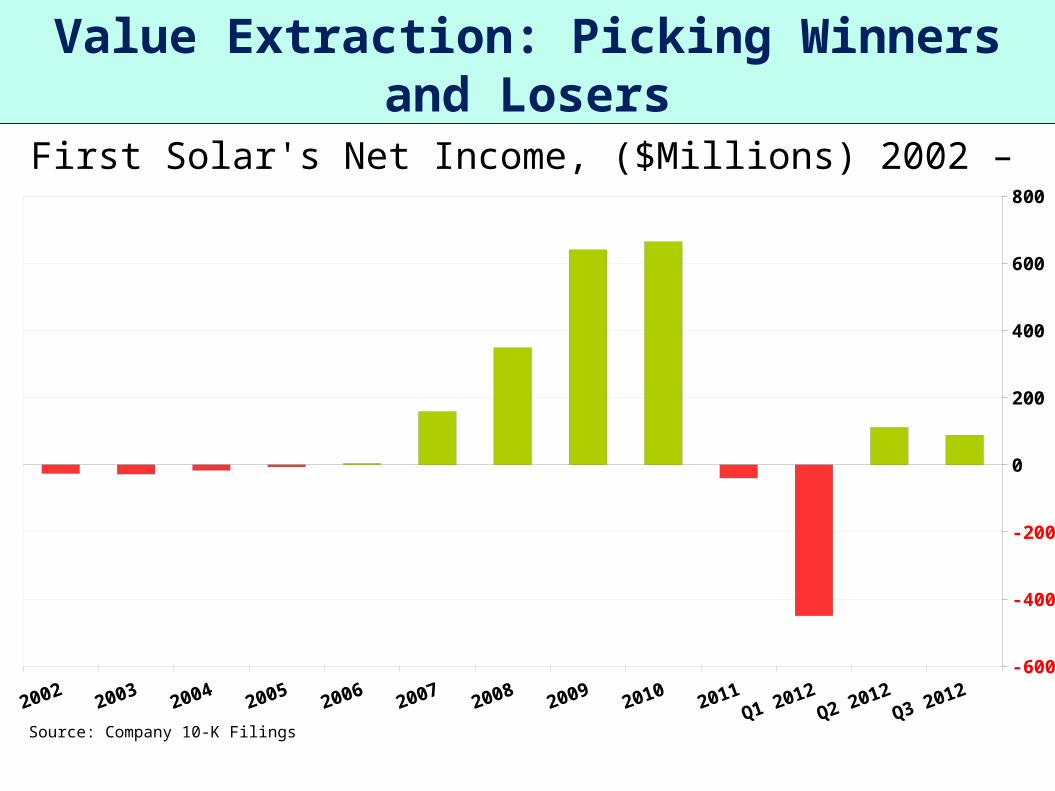
First Solar's Net Income, ($Millions) 2002 – 3Q 2012
Value Extraction: Picking Winners and Losers
Q3 2012Q2 2012
Q1 20122011201020092008200720062005200420032002-600
-400
-200
0
200
400
600
800
Source: Company 10-K Filings

● SunPower, an innovative C-Si producer, has seen $900 million in extraction between 2005 and 2012, and handed out $24 million in non-equity compensation to top executives
● Astropower bankrupt in 2004, limited data shows $1.5 million for CEO Allen Barnett in 2000, $900k for Thomas Stiner in 2001
● Evergreen provided for the extraction of at least $25 million, and $10 million in non-equity compensation
● This Value extraction occurs while the U.S. is failing to become a global leader in Solar PV
Value Extraction: Continued
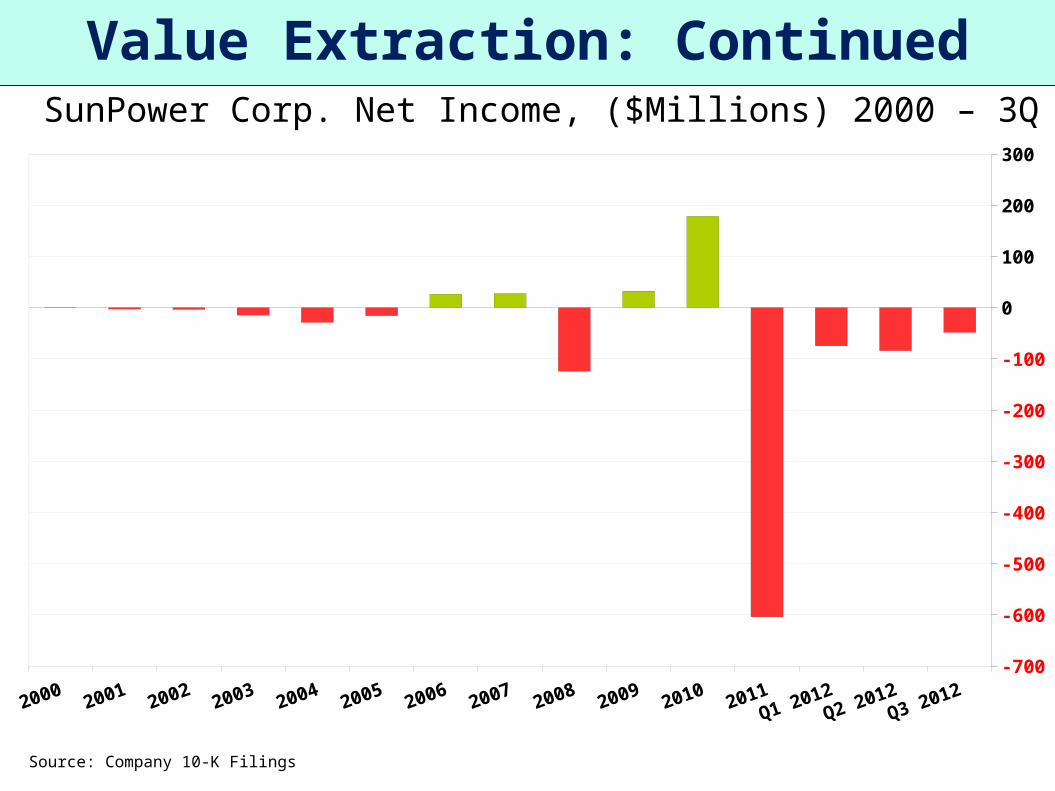
SunPower Corp. Net Income, ($Millions) 2000 – 3Q 2012
Value Extraction: Continued
Q3 2012Q2 2012
Q1 2012201120102009200820072006200520042003200220012000-700
-600
-500
-400
-300
-200
-100
0
100
200
300
Source: Company 10-K Filings

In 2007, Ahearn opined about the company's stock option plan:
“The more the stock price goes up, the more people internally start thinking about the stock price and how you perpetuate that, and how we meet expectations . . . I think that can really take you out of your game . . . We need to spend a little more time internally making sure we keep our focus." ( as quoted in Gelsi, 2007).
Ahearn is describing the need to resist temptation to focus on stock-price performance, rather than focusing on the innovation process which, with government support, helped establish First Solar's competitive lead in the first place. Missing from Ahearn's account however is about $2.8 billion in stock sales by First Solar's major equity investors (the estate of John Walton and JCL Holdings) as well as $740 million of his own stock sales. With his fortune in hand, Ahearn has since rejected any future equity-based compensation from the company.
Value Extraction: Picking Winners and Losers

Percent of Total World Solar PV Capacity, Cumulative and Installed, by Nation, 2011*
Source: Authors' calculations. “Market Report 2011.” EPIA. Jan 2012. *Shown are the top 10 ordered by total amount of total capacity installed as of 2011. Total capacity represents the maximum aggregate generator value of all solar p/v generating equipment installed globally. The percent of total installed capacity, represents that nation's share of the 28 GWs of solar p/v capacity installed in 2011.
All Other
UK
Australia
Belgium
France
China
Spain
USA
Japan
Italy
Germany
0% 5% 10% 15% 20% 25% 30% 35% 40%
33%
37%
Percent of Total Global Capacity as of 2011
Percent of Total Installed Capacity in 2011
Where are the Biggest Solar Markets?

Leading Solar Companies and Evidence of European Dependency (millions of USD), 2010
Sources: Author's Calculations, 10-K filings, Published Company Annuals. Sorted by Revenue.
A Deployment Problem:European Dependency
Company Country
Japan 4,815 255
China 2,902 238 20,231 66
First Solar USA 2,564 664 6,100 46 60
LDK Solar Co. China 2,509 296 22,400 36 36
REC Solar Norway 2,360 224 4,210 21 45
MEMC/Sun Edison USA 2,239 34 6,500 29
Sharp Japan 2,235
USA 2,219 179 5,150 21 46
China 1,894 210 11,435 69
Trina Corporation China 1,858 311 12,863 77
Q-Cells Germany 1,809 25 2,379 82
JA Solar Holdings China 1,782 266 10,725 18 19
Solar World AG Germany 1,743 117 1,000 40 57
Japan 1,681 213 6,783
Canadian Solar China 1,496 51 8,733 80 80
China 1,206 169 7,869 15 35
S Korea 1,140 115 10,241 63 74
Taiwan 1,018 156 2,861 36
Taiwan 968 155 1,632 40
China 705 134 6,735 25 52
Evergreen Solar USA 339 -465 1,034 61
FY2010 Revenue ($ Millions)
FY2010 Net Income ($ Millions)
FY2010 Employmen
t
% Revenue
from Germany
% Revenue
from Europe
Sanyo
SunTech Power
SunPower Corp
Yingli Green Energy
Kyocera Solar
Renesola
Hanwha SolarOne
Motech Solar
Gintech
JinkoSolar

Leading Solar Companies and Evidence of European Dependency (millions of USD), 2011
Sources: Author's Calculations, 10-K filings, Published Company Annuals. Sorted by Revenue.
European Dependency (continued)
Company Country
Japan 5,152 476
China 3,147 -1,019 17,693 20 45
First Solar USA 2,766 -39 7,000 23 38
LDK Solar Co. China 2,158 -609 24,449 29
MEMC/Sun Edison USA 2,716 -1,536 6,350 10
Sharp* Japan 3,208
REC Solar Norway 2,230 -1,661 3,587 26 86
USA 2,312 -604 5,220 8 31
China 2,332 -510 16,054 45 45
Trina Corporation China 2,048 -38 14,386 37 68
Q-Cells Germany 1,324 -1,094 2,416 59 80
JA Solar Holdings China 1,705 -90 11,639 20 20
Solar World AG Germany 1,355 -387 2,701 42 60
Japan 2,388 351 7,606
Canadian Solar China 1,899 -91 9,087 42 65
China 985 0 7,595 11 29
S Korea 1,019 -58 9,624 41 49
Taiwan 687 -81 3,142 38
Taiwan 628 -67 1,650 32
China 1,173 189 7,941 33 71
FY2011 Revenue ($ Millions)
FY2011 Net Income ($ Millions)
FY2011 Employment
% Revenue
from Germany
% Revenue
from Europe
Sanyo
SunTech Power
SunPower Corp
Yingli Green Energy
Kyocera Solar
Renesola
Hanwha SolarOne
Motech Solar
Gintech
JinkoSolar
What if Value Extraction in Clean Technology is occurring in all it's major sectors?
● No data on executive compensation exists for many clean technology companies as most are not a part of the S&P 1500 index
● We have collected compensation data on 46 U.S. firms based upon our knowledge of how execucomp collects their data, for the years 1992 – 2011
● Sectors include wind, solar, storage, energy efficiency, biomass, tidal, and others
● Dataset currently contains approximately 1,500 rows of data
● Our compensation total reflects only compensation actually received (versus including estimated dollar value of stock and option awards such as done by execucomp)
Value Extraction in Clean Technology

The Top 200 Clean Technology paychecks so far observed range in value from approximately $768 thousand to over $40 million
– The Top 100 paychecks average $4 million and range between $3 and $40 million
The average value derived from the exercise of stock options was $2.3 million among the top 200 paychecks
– The value of stock-based pay for the Top 100 rises to $2.8 million
Stock Options represent, on average approximately 41% of executive pay during those years in which they are exercised (with a range of 0.1% to 100%)
– Among the Top 100 paychecks recorded, the average amount of compensation derived from stock options rises to 43% (range of 0% to 95%)
– If not stock options, though, “other compensation” and bonuses provide millions to the top earners.
Value Extraction in Clean Technology
Approximately 1/3rd of compensation data is devoted to solar and wind companies
– Highest paid executives are found at First Solar, American Superconductor, GT Advanced Technologies, Evergreen, Kenetech
• American Superconductor has accumulated losses of $507 million between 1992-2011, GT is lavishing larger paychecks on top executives each year. Kenetech was bankrupted in 1996, Evergreen in 2011.
– First Solar is in fact the compensation leader across all clean technology companies observed so far
• First Solar posted net losses leading up to its IPO, and has since posted a loss in 2011. The company competes for limited markets in the U.S. and Europe, and soon will face GE as a direct competitor
Value Extraction by Wind and Solar Companies

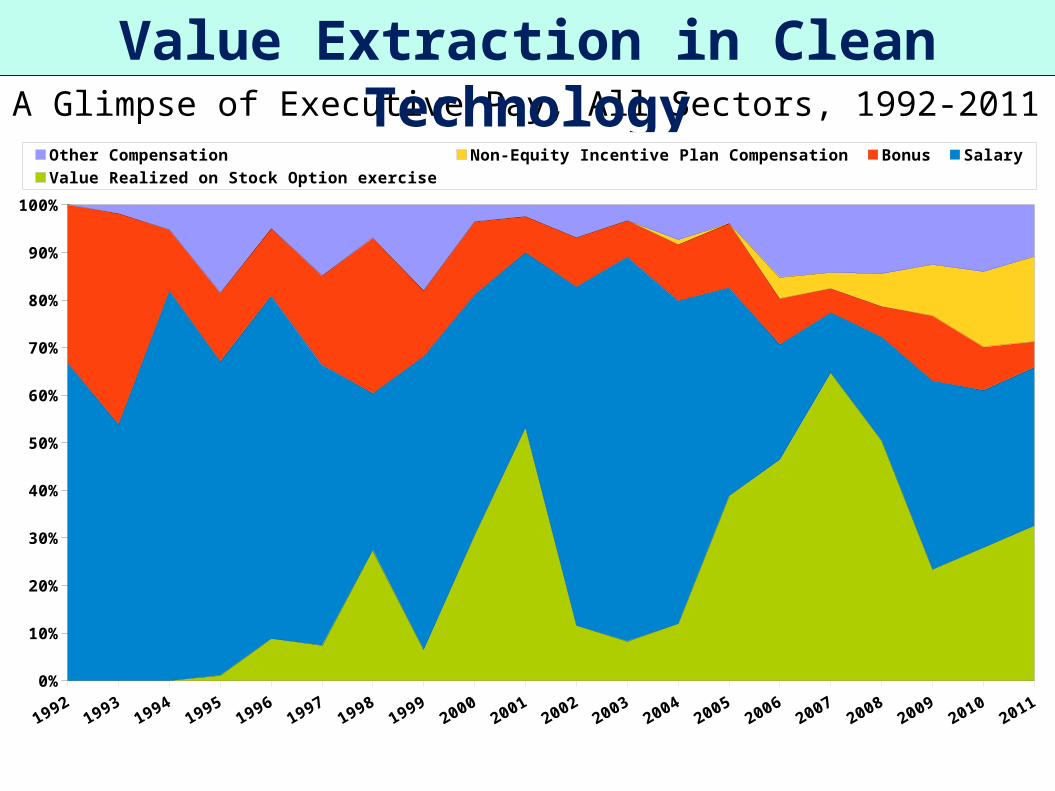
A Glimpse of Executive Pay, All Sectors, 1992-2011
Value Extraction in Clean Technology
19921993
19941995
19961997
19981999
20002001
20022003
20042005
20062007
20082009
20102011
0
50,000
100,000
150,000
200,000
250,000
300,000
0
5
10
15
20
25
30
35
40Other Compensation
Non-Equity Incentive Plan Compensation
Bonus
Salary
Value Realized on Stock Option exercise
No. Firms Observed$M
illio
ns
Nu
mb
er
of
Fir
ms
Ob
se
rve
d
A Glimpse of Executive Pay, All Sectors, 1992-2011
Value Extraction in Clean Technology
19921993
19941995
19961997
19981999
20002001
20022003
20042005
20062007
20082009
20102011
0%
10%
20%
30%
40%
50%
60%
70%
80%
90%
100%
Other Compensation Non-Equity Incentive Plan Compensation Bonus Salary Value Realized on Stock Option exercise
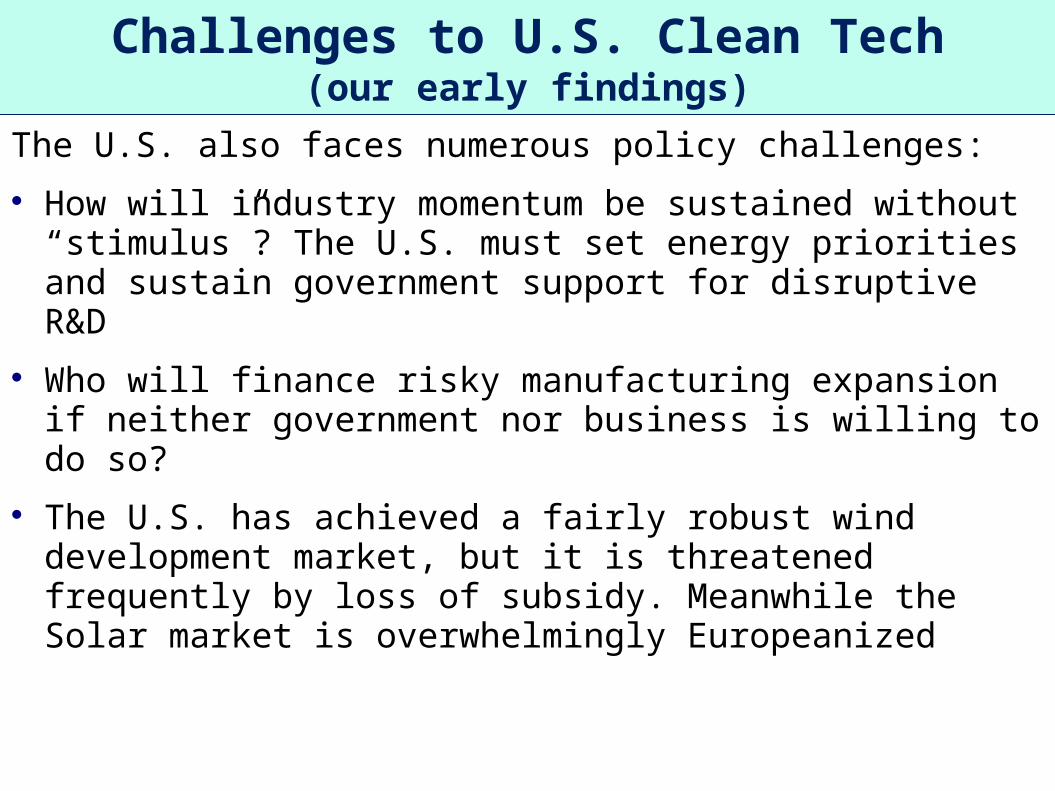
The U.S. also faces numerous policy challenges:
How will industry momentum be sustained without “stimulus”? The U.S. must set energy priorities and sustain government support for disruptive R&D
Who will finance risky manufacturing expansion if neither government nor business is willing to do so?
The U.S. has achieved a fairly robust wind development market, but it is threatened frequently by loss of subsidy. Meanwhile the Solar market is overwhelmingly Europeanized
Challenges to U.S. Clean Tech(our early findings)

What we know about Clean Technology:
Plenty of government and business money has flowed into the industry – but the industry has not been very successful, and is now losing out to the Chinese
Is the problem a lack of patient capital?
Clean Technology is already a global industry, not a domestic industry, and innovation will separate it's producers from its importers.
How patient of committed finance is depends on the incentives and abilities of top executives who exercise strategic control to invest in innovation – the ability of top executives of clean tech companies to make huge stock market gains even when the company is not successful over the long run may undermine their incentives to ensure financial commitment to the innovation process
How productive finance is depends on the organizational integration of the skills and efforts of employees into the organizational learning process that is the essence of innovation – organizational integration depends on strategic control and financial commitment
Why is the U.S. Falling Behind in Clean Tech?