Embed Size (px)
Citation preview

Matrix-mitigated edge and area effects on
Neotropical bats in a fragmented landscape
Milou Groenenberg
00701889
September 2012
A thesis submitted in partial fulfilment of the requirements of the degree of Master of
Science and the Diploma of Imperial College London.

2
Declaration of own work
I declare that this thesis: ‘Matrix-mitigated edge an area effects on Neotropical bats in a fragmented landscape’ is entirely my own work and that where material could be construed as the work of others, it is fully cited and referenced, and/or with appropriate acknowledgement given. Name of student: Milou Groenenberg Signature : Name of Supervisors: Dr. Cristina Banks-Leite Dr. Christoph F.J. Meyer

3
Table of Contents
List of figures 4 List of tables 4 List of acronyms 5 Abstract 6 Acknowledgements 7 1. Introduction 8 1.1 Deforestation 8 1.2 Fragmentation 8 1.3 Edge effects 9 1.4 Area and edge effects 9 1.5 The matrix matters 10 1.6 Bats as a model 10 1.7 Edge effects on bats 10 1.8 Aims and objectives 11 2. Background 12 2.1 Edge effects on bats 12 2.2 Underlying mechanisms 13 2.3 Species composition 14 2.4 The impact of patch size and the interaction between patch size and 16
edge effects 2.5 Vegetation 17 2.5.1 The matrix 17 2.5.2 Vegetation characteristics 18 2.6 Expectations 18 3. Methods 20 3.1 Study site 20 3.2 Methodological framework 21 3.3 Field methods 23 3.3.1 Bat sampling 23 3.3.2 Vegetation sampling 24 3.4 Analytical methods 25 4. Results 29 4.1 Completeness of the bat inventory 29 4.2 Species richness, diversity, evenness and abundance at the assemblage level 30 4.3 Species composition 31 4.4 Differences in vegetation structure and composition between habitat types 34 4.5 The influence of vegetation characteristics on bats 35 5. Discussion 36 5.1 Edge effects 36 5.2 Area effects 39 5.3 Caveats 40 5.4 Conservation Implications 42 References 44 Appendix1. Bat inventory 58

4
List of figures
Figure 3.1 An experimentally fragmented 1ha forest patch of the BDFFP. Figure 3.2 Map of the ‘biological dynamics of forest fragmentation project’-research area. Figure 3.3 Schematic overview of the sampling design. Figure 4.1 Species accumulation curve for the complete bat inventory. Figure 4.2 Species accumulation curves for the interior-, edge- and matrix habitat. Figure 4.3 Rank Abundance curves for the interior-, edge- and matrix habitat. Figure 4.4 Mean capture rate in the interior-, edge- and matrix habitats in each fragment size
category. Figure 4.5 The first two PCOA vectors of the principle coordinate analysis based on bat
capture rates. Figure 4.6 Mean and standard errors of the first vector of the PCOA analysis based on bat
capture rates in interior-, edge- and matrix habitats. Figure 4.7 Mean capture rates of the guilds and four most abundant species. Figure 4.8 First two PCA vectors of vegetation characteristics in interior-, edge- and matrix
habitat. Figure 4.9 Capture rate of bats in relation to the first PCA vector of vegetation
characteristics.
List of tables
Table 2.1 Overview of all recent (>1995) scientific literature on edge effects on bats. Table 3.1 Properties of the study sites and sampling effort per treatment. Table 4.1 Mean values of the attributes of the bat assemblage and vegetation data and
p=values for RM-ANOVA model1, 2 and 3. Table 4.2 Vegetation characteristic with the most influence on the first vegetation PCA-1.

5
List of acronyms
AGB : Above Ground Biomass
ANI: Gleaning animalivores
ANOVA: Analysis of Variance
BDFFP: Biological Dynamics of Forest Fragmentation Project
CF: Cabo Frío
CO: Colosso
DBH: Diameter at Breast Height
DI: Dimona
FL: Florestal
FR: Frugivores
FR CN: Canopy frugivores
FR OPP: Opportunistic frugivores
FR SH: Shrub frugivores
GEE: Geometric Edge Effects
GLM: Generalized Linear Model
IBT: Island Biogeographic Theory
INS: Aerial insectivores
K41: KM-41
mnh: Mist Net Hours
NEC: Nectarivores
PA: Porto Alegre
PCoA: Principle Coordinate Analysis
RM-ANOVA: Repeated Measures Analysis of Variance
SAN: Sanguivores
SAR: Species Area Relation
SE: Standard Error

6
Abstract
Deforestation and forest fragmentation are a major conservation concern in the tropical forests of
the Brazilian Amazon. Edge effects are important determinants of both physical and biological
responses to fragmentation, yet major gaps of knowledge exist on the extent of these effects and
their underlying mechanisms for many animal groups. This study contributes to the existing
knowledge by exploring edge effects and their interaction with patch size and matrix vegetation,
using bats (Chiroptera) as a model group, in the experimentally fragmented research area of the
Biological Dynamics of Forest Fragmentation Project in the Brazilian Amazon. We captured
members of the Phyllostomidae family and Pteronotus parnellii (Mormoopidae) using ground-
level mist nets in fragments of different size categories (1,10,100ha and control plots in the
continuous forest) and in three different habit types: interior-, edge- and matrix habitat and
conducted vegetation sampling at the same sites.
We found that neither edge- nor area effects had an impact on species richness, diversity and
evenness. However, species composition and abundance differed in fragment interior habitat
compared to edge- and matrix habitat. These results were primarily caused by as steep increase in
the capture frequency of understory frugivores and the most abundant species (Carollia
perspicillata) in edge- and matrix habitat compared to the fragment interior. No other guilds or
species appeared to be impacted by edge effects. However, the capture rate of gleaning
animalivores was negatively associated with decreasing patch size. I conclude that the relative
mature age and tall canopy of the matrix habitat attenuates edge effects on bats, which confirms
the important role of matrix management in conservation. I furthermore recommend the
preservation of sufficiently large forest fragments and their habitat attributes (e.g. large trees
which may serve as roost-sites) to mitigate the impact of forest fragmentation on sensitive
animalivorous bat species.
(Word count: 11,617)

7
Acknowledgements
I am most thankful to my two wonderful supervisors. Dr. Cristina Banks-Leite, I would not have
been able to do this without your never ending support, insight, patience and enthusiasm, the
hours, days, weeks (years?) I spend in your office. Thanks for guiding me through the mysterious
ways of “R” and for keeping me motivated and enthusiastic right when I needed it the most. Dr.
Christoph F.J. Meyer, I am indebted to the amazing opportunity you gave me to work on such an
interesting topic in a worldwide renowned ecological project. Thanks as well for your insightful
comments and suggestions, for sharing your knowledge on ecology in general and bats in specific
and for the entertaining field nights with you and Joana.
Major thanks to the one and only Català batman: Adrià López Baucells for your unwearying
support with the ‘vegetação’, for saving me when I was lost in Dimona and for your never ending
enthusiasm and optimism. I don’t know if I have ever met someone as altruistic and hard working
as you.
Big ‘obrigada’ to Ricardo Rocha for introducing me to the fascinating world of bats and for all your
hard work that contributed to an impressive dataset an which helped me get through so many
obstacles along the way.
I would like to express my gratitude to Paulo Estefano Dineli Bobrowiec for support in the field as
well as during our ‘brainstorming’ sessions on the project. Thanks to Julia Treitler and Solange
Farias for helping us catch those hundreds of bats.
A warm thanks for our wonderful field assistants Leo and Junior, thanks for keeping me safe and
alive during the long nights in the mighty jungle.
Thanks to the Brazilian government, polícia federal and Brazilian embassy in London for issuing
my research visa. Major thanks to the Biological Dynamics of Forest Fragments Project, Instituto
Nacional de Pesquisas da Amazônia and Smithsonian Tropical Research Institute (C.P. 478,
Manaus, AM 69011-970, Brazil) for logistical support.
8
1. Introduction
Tropical forests are the most biologically diverse ecosystems on earth (Dirzo & Raven 2003;
Laurance 2007). They sustain at least 50% of all species (Myers 1992; Pimm 2001) and far more
endemics than all other biomes combined (MEA 2005). The Amazon basin contains ~60% of
remaining tropical rain-forest (Fearnside 1999) and contributes to numerous ecosystem services
such as the global carbon- (Dixon et al. 1994) and hydrological cycles (Avissar 2005; Davidson et
al. 2012) and provisioning of fuel, food, and water for many of the world’s poorest people (MEA
2005).
1.1 Deforestation
Despite their recognized value, tropical forests are disappearing at an alarming rate (Butchart et
al. 2010; Laurance 2007). The Brazilian Amazon has the world’s highest absolute deforestation
rates (Laurance et al. 2002), with 1.8 million hectares of forest being lost every year between
2001 and 2010 (Aide et al. 2012; INPE 2011) although deforestation rates have stopped
accelerating and are even decreasing in some regions (Wright 2010). Furthermore, Brazil has the
highest reforestation rate of the Neotropics: 1.5million ha from 2001 to 2010 (Aida et al. 2012).
However, reforestation and deforestation do not always occur in the same regions or even
biomes and the conservation value of secondary regrowth remains a topic of debate (Dent &
Wright 2009; Dent 2010; Gibson et al. 2011; Herrera-Montes & Brokaw 2010).
Increasing global industrialization and per-capita consumption will accelerate the synergistic
pressures on tropical forests (Asner et al. 2005; Davidson et al. 2012; Finer et al. 2008; MEA 2005;
Nepstad et al. 2001). Although extinctions in the Brazilian Amazon have been minimal so far, a
recently developed model by Wearn et al. (2012) projects average losses of 2-3 mammals (5.5%),
3-7 birds (5.3%) and 1-2 amphibians (4.5%) for every 2500km2 by 2050, leaving an ‘extinction
debt’ of 60-70% for the years thereafter.
1.2 Fragmentation
One of the main consequences of deforestation is habitat fragmentation, which is a primary
concern in conservation biology and perhaps the most alarming trend in the Amazon (Franklin &
Noon 2002; Gascon 2000; Peres 2001; Laurance et al. 2011). A key study by Skole & Tucker (1993)

9
estimated the area of fragmented forest (<100km2) in the Brazilian Amazon to be more than 150%
larger than the area deforested.
Island Biogeography Theory (IBT) is the foundation of landscape ecology. It is based on two main
pillars: the species-area relationship (SAR) and isolation (MacArthur & Wilson 1967). Although this
theory has provided many useful insights, it ignores some essential determinants of species
responses to fragmentation, most importantly: matrix- and edge effects (Koh et al. 2010; Kupfer
et al. 2006; Laurance 2004; Watling et al. 2011).
1.3 Edge effects
Edge effects are ‘physical and biological alterations that occur along a gradient between a border
of one habitat type with another’ (combined from: Kupfer et al. 2006; Laurance 2008) and can be
either natural or anthropogenic. Edge effects are dominant drivers of fragment dynamics and a
major determinant of species composition, structure and ecological processes (Banks-Leite et al.
2010; Laurance et al. 2011; Ries et al. 2004). Better understanding the consequence of edge
effects can bring important contributions to conservation planning and management, for example
through the design of nature reserves (Collinge 1996; Laurance 1991) and mitigation of the
impacts of habitat loss (Laurance et al. 2002).
Despite decades of research, much remains to be discovered especially considering the
mechanisms behind edge effects and the interaction of factors that modulate edge effects such as
patch size and matrix vegetation (Didham et al. 1988; Murcia 1995).
1.4 Area & edge effects
Reduction in patch size generally leads to a decrease in suitable habitat with consequent
decreases in species richness and abundance (Fahrig 2003; Watlin & Donnelly 2006).
Small and irregularly shaped fragments have a high perimeter:area ratio, which means edge
effects extend over a relatively large area and multiple edge may synergistically impact fragment
interiors (Ewers & Didham 2007; Laurance et al. 2006; Laurance 2008). The core-area model of
Laurance and Yensen (1991) (and revised version: Didam & Ewers 2012) incorporates patch size
and shape to predict the extend of edge- and matrix affected area and found that below a certain
threshold the impacts of edge effects increase almost exponentially with decreasing fragment
size.

10
Edge- and area-effects are confounding factors and it is a challenging task to distinguish between
them (Didham et al. 1998; Ewers et al. 2007; Laurance 2008). For example, a study in the Brazilian
Atlantic forest found that the change in bird species composition from interior to edges was
similar to the change from large fragments to small ones, but after controlling for edge effects,
area effects were no longer apparent (Banks-Leite et al. 2010).
1.5 The matrix matters
The strength of edge effects is further influenced by matrix quality (Laurance et al. 2011). Several
models on diverse animal assemblages demonstrated that matrix habitat was the strongest
predictor of occupancy in fragmented landscapes, even stronger than the combined effects of
isolation and size (Koh & Ghazoul 2010; Koh et al. 2010; Prugh et al. 2008; Watling et al. 2011). In
general, edge effects weaken as the contrast between fragment- and matrix habitat becomes less
pronounced (Didham & Lawton 1999; Kupfer at al. 2006; Laurance et al. 2008; Prugh et al. 2008).
For example, over time edges become ‘sealed’ and wind, light and heat fluxes become less
intense with subsequent buffering impacts on biota (Kapos et al. 1997; Matlack 1994).
1.6 Bats as a model
Bats (Chiroptera) are a promising model group for studies on fragmentation and edge effects
because they are abundant both in terms of species and individuals (Voss & Emmons 1996), they
are readily detected with cost-efficient sampling methods (Kalko & Handley 1996; Kunz & Parsons
2009) and they represent a high diversity of life-strategies with subsequent differential
vulnerability to disturbances (Kunz & Fenton 2006).
Bats are also important from a conservation perspective: they are the most species-rich mammal
group after rodents and can represent up to 40% of the mammal species in Neotropical
rainforests (Voss & Emmons 1996). Bats perform numerous ecosystem functions and services,
including seed- and pollen dispersal; arthropod and pest suppression, fertilizing guano, protein
and cultural services (e.g. mythology, tourism, traditional medicine) (Kunz et al. 2011). Bats play a
key role in forest restoration because they are primary dispersers of pioneer species and reduce
leaf damage to regrowth vegetation by predating on herbivorous insects (Kalka et al. 2008;
Morrison & Lindell 2012; Muscarella & Fleming, 2007).
1.7 Edge effect on bats
Bats are sometimes considered to be less affected by fragmentation due to their high mobility
and ability to exploit certain matrix habitats (Estrada et al. 1993; Lesinski et al. 2011). However,
11
evidence is mounting that fragmentation can have profound impacts on bat species richness
(Faria 2006; Gorresen & Willig 2004), abundance (Bernard & Fenton 2003; Ethier & Fahrig 2011),
activity patterns (Presley et al. 2009; Willig et al. 2007) and species composition (Faria et al. 2006;
Meyer & Kalko 2008; Schulze et al. 2000).
Meyer et al. (2008) found that edge-sensitivity was the single most important trait in determining
bat vulnerability to fragmentation. Despite this, relatively few studies on bats have been explicitly
designed to assess edge effects. The interaction of patch size with edge effects on bats has never
been addressed and most other studies rely on rather vague dichotomous descriptions (e.g.
disturbed vs. undisturbed, Fenton et al. 1992; interior vs. edge, Lesinski et al. 2011), but without
clear descriptive information on the differences in vegetation structure of the habitats under
consideration, interpretation and extrapolation of the findings becomes more subjective.
1.8 Aims and objectives
This study intends to fill some of the gaps of knowledge discussed above, with the ultimate aim to
‘assess the impacts of edge effects on bats and its implications for conservation in the Central
Amazon’.
The focus of the study is threefold and can be subdivided into the following three specific
objectives:
1. To evaluate how bats are influenced by edge effects, looking into differences in species
richness, abundance patterns and species composition between forest edge-, interior- and
matrix habitat at the assemblage, guild and species level.
2. To assess whether the strength of edge effects is influenced by the size of forest patches.
3. To assess differences in vegetation structure and composition between interior-, edge-
and matrix habitat and to evaluate how changes in vegetation characteristics influence
the bat assemblage and the strength of edge effects.
12
2. Background
2.1 Edge effects on bats
Few studies on bats have assessed the impacts of edges and a minority of these studies was set in
a tropical context (Table 2.1).
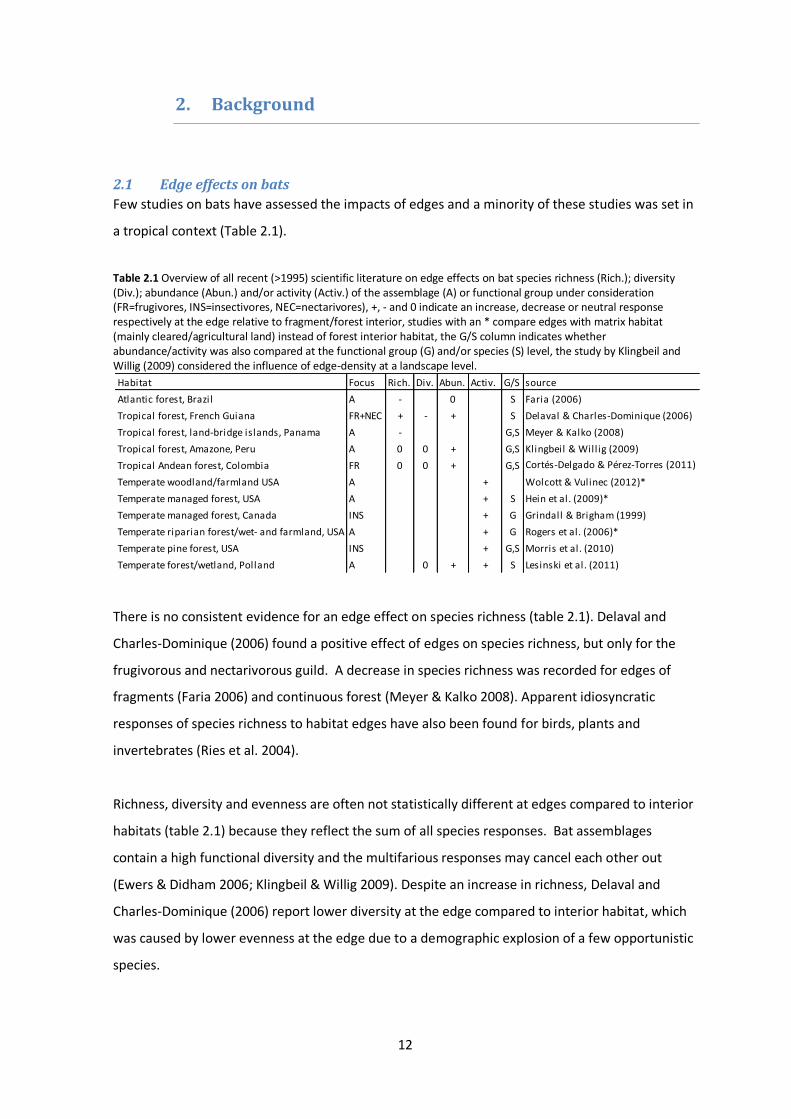
Table 2.1 Overview of all recent (>1995) scientific literature on edge effects on bat species richness (Rich.); diversity (Div.); abundance (Abun.) and/or activity (Activ.) of the assemblage (A) or functional group under consideration (FR=frugivores, INS=insectivores, NEC=nectarivores), +, - and 0 indicate an increase, decrease or neutral response respectively at the edge relative to fragment/forest interior, studies with an * compare edges with matrix habitat (mainly cleared/agricultural land) instead of forest interior habitat, the G/S column indicates whether abundance/activity was also compared at the functional group (G) and/or species (S) level, the study by Klingbeil and Willig (2009) considered the influence of edge-density at a landscape level.
There is no consistent evidence for an edge effect on species richness (table 2.1). Delaval and
Charles-Dominique (2006) found a positive effect of edges on species richness, but only for the
frugivorous and nectarivorous guild. A decrease in species richness was recorded for edges of
fragments (Faria 2006) and continuous forest (Meyer & Kalko 2008). Apparent idiosyncratic
responses of species richness to habitat edges have also been found for birds, plants and
invertebrates (Ries et al. 2004).
Richness, diversity and evenness are often not statistically different at edges compared to interior
habitats (table 2.1) because they reflect the sum of all species responses. Bat assemblages
contain a high functional diversity and the multifarious responses may cancel each other out
(Ewers & Didham 2006; Klingbeil & Willig 2009). Despite an increase in richness, Delaval and
Charles-Dominique (2006) report lower diversity at the edge compared to interior habitat, which
was caused by lower evenness at the edge due to a demographic explosion of a few opportunistic
species.
Habitat Focus Rich. Div. Abun. Activ. G/S source
Atlantic forest, Brazil A - 0 S Faria (2006)
Tropical forest, French Guiana FR+NEC + - + S Delaval & Charles-Dominique (2006)
Tropical forest, land-bridge islands, Panama A - G,S Meyer & Kalko (2008)
Tropical forest, Amazone, Peru A 0 0 + G,S Klingbeil & Willig (2009)
Tropical Andean forest, Colombia FR 0 0 + G,S Cortés-Delgado & Pérez-Torres (2011)
Temperate woodland/farmland USA A + Wolcott & Vulinec (2012)*
Temperate managed forest, USA A + S Hein et al. (2009)*
Temperate managed forest, Canada INS + G Grindall & Brigham (1999)
Temperate riparian forest/wet- and farmland, USA A + G Rogers et al. (2006)*
Temperate pine forest, USA INS + G,S Morris et al. (2010)
Temperate forest/wetland, Polland A 0 + + S Lesinski et al. (2011)

13
Almost all studies that consider bat assemblage abundance report increases at the edge
compared to interior habitat (table 2.1). Many other taxa have shown abundance increases at
forest edges, including termites; aphids (Fowler et al. 1993); light-loving butterflies (Brown and
Hutchings 1997) and generalist or gap-specialist birds (Stouffer & Bierregaard 1995).
Similar to the reports on abundance, all studies in temperate zones using acoustic surveys
consistently report higher activity at forest edges compared to the forest interior or matrix
habitat at the assemblage- and guild level (table 2.1). However, acoustic detectability is higher in
edge-habitats compared to forest interiors (Walsh et al. 2004) and most of the acoustic studies
were set in heavily managed and altered landscape which may have already lost edge-sensitive
species (Hayes & Loeb 2007).
2.2 Underlying mechanisms
Differential patterns in bat abundance and richness related to edges may be explained by four
principal mechanisms.
Access to spatially separated resources
Species abundance may increase at edges when habitats at both side of the edge provide
complementary resources to a species (Dunning et al. 1992) so that the edge-habitat provides
maximum access to both resources (Law & Dickman 1998). For example, bat species that forage in
open areas but roost in forest habitat increase in abundance at the forest borders because they
constantly cross borders to access both resources (Ethier & Fahrig 2011; O’Keefe et al. 2009).
Resource mapping
Resource mapping occurs when the abundance of a species follows the abundance of its
resources. Bats may prefer edges as flyways over structurally complex and dense interior
vegetation (Hogberg et al. 2002; Kusch et al. 2004), find protection from predation and wind
(Verboom & Spoelstra 1999) and use edges as a landmark for orientation (Law & Chidel 2002).
However, the latter two arguments only apply to edges in comparison to open areas, not to
interior habitats.
When resources of the matrix- and interior habitat come together at the edge, ‘species mixing’
may occur. In that case distinct matrix- and interior species map onto resources at the edge and
richness increases (Ingham & Samways 1996; Magura 2002).

14
Species interactions
The increase or decrease of certain species may indirectly cascade to the community level
through species interactions such as parasitism (Chalfoun et al. 2002; Wolf & Batzli 2001),
predation (Andren & Angelstam 1988), mutualism (Fleming & Heithaus 1981; Jules & Rathcke
1999) and competition (Remer & Heard 1998; Youngentob et al. 2012). Bats may interact with
insects (predation) and pioneer fruit species (mutualism) that have been shown to increase at
edges (Didham et al. 1998; Grindal 1996; Hein et al. 2009; Restrepo et al. 1999).
Geometric edge effects
The until recently ignored ‘geometric edge effects’ (Prevedello et al. 2012) provides an
explanation for abundance- and species decreases at edges. The theory states that areas in the
centre of a habitat patch will automatically receive more individuals than areas near the edge
simply because the centre receives individuals from all directions whereas edges do not receive
individuals from outside the patch. Although demonstrated for birds (Fletcher & Koford 2003;
King et al. 1997), the role of geometric edge effects has not yet received attention in the bat
literature. Many bat species are highly mobile and can pass through different habitat types
during a night (Fleming 1982; Fenton et al. 1992). Therefore, it seems unlikely that edges have
lower richness or abundance because they do not receive individuals from outside of the patch.
2.3 Species composition
Edges strongly influence assemblage structure in a variety of taxa, including tropical birds (Dale et
al. 2000; Restrepo & Gomez 1998) and bats (Faria 2006). To improve our understanding of these
compositional shifts, it can be useful to discern responses at the individual guild level.
Guilds
Guild classifications group species according to diet, foraging mode and habitat type (Kalko et al.
1996). Main food types ingested by bats include animals (tetrapods, arthropods and fish), fruits,
nectar and blood. Foraging mode of the animalivores can be categorized as ‘gleaning’ for bats that
glean prey from the vegetation or the ground or ‘aerial’ for hunters in open areas. Vertical
stratification is more pronounced in frugivorous bats than in the other guilds: aerial insectivores
are predominantly found in or above the canopy, whereas gleaning animalivores, nectarivores
and hematophagous species are more restricted to the understory (Bernard 2001; Pereira et al.
2010). Therefore, I used the following guild classification: shrub-, canopy- and opportunistic
frugivores, gleaning animalivores, aerial insectivores, nectarivores, and sanguivores.

15
Nectarivores and shrub Frugivores
Shrub frugivores and nectarivores show a dietary preference for understory pioneer plant
genera, such as Cecropia, Vismia, Solanum and Piper (Muscarella & Fleming, 2007; Thies & Kalko
2004) which increase in disturbed areas such as edge- and matrix habitats. Therefore, abundance
of shrub frugivores is often higher at the edge- and matrix compared to forest interiors (Cortés-
Delgado & Pérez-Torres 2011; Klingbeil & Willig 2009; Sampaio 2000). Furthermore, many
nectarivorous species are generalists, often including insects, pollen and fruit in their diets, which
may be beneficial in disturbed habitats with potential new food sources (Brosset et al. 1996).
Canopy frugivores
Canopy specialists feed mainly on canopy fruits such as Ficus (Estrada-Villegas et al. 2010) that
occur in low density, fruit asynchronously and for a short amount of time (Cosson et al. 1999).
Canopy specialists thus need to be highly mobile in order to visit different feeding patches. Fig-
eaters like Artibeus jamaicensis can travel up to 10km per night (Fleming 1982; Fenton et al.
1992), which minimizes the influence of habitat type on their abundance (Klingbeil & Willig 2009;
Schulze et al. 2000). Small canopy frugivores may be more limited in their dispersal abilities and
can respond negatively to edge- and matrix habitat due to a lack of roosts and canopy fruits
(Sampaio 2000).
Opportunistic frugivores
Opportunistic frugivores use upper- and lower strata equally and have a high level of flexibility in
habitat use, allowing them to persist in structurally different edge- and matrix habitat, while
taking advantage of new food sources (i.e. Cecropia, Vismia, Piper fruits) (Bernard 2001; Estrada &
Coates-Estrada 2002).
Gleaning animalivores
Despite the fact that prey species such as katydids (Tettigoniidae) and true bugs (Hemiptera)
often accumulate at edges (Naskrecki 2008; Morris et al. 2010), gleaning animalivores are
considered ´edge-sensitive´ (Clarke et al. 2005; Kalko & Handley 2001; Morris et al.2010; Meyer et
al. 2008). Their foraging strategy and wing morphology constrain the gleaners to a life in
structurally complex habitats and make them adverse to crossing open areas (Belwood 1988;
Norberg & Rayner 1987). The fact that many gleaning animalivores have a small home range and
specific roosting requirements provides an additional explanation to their sensitivity (Kalko et al.
2006).

16
Aerial insectivores
Aerial insectivores have a wing morphology and foraging strategy that is well suited for open
areas along ‘high-contrast edges’, where they often occur in high densities to take advantage of
elevated prey abundance (Cadenasso & Pickett 2000; Morris et al. 2010; Patriquin & Barclay
2003). Despite this, some aerial insectivores such as Pteronotus parnellii avoid open areas
(Neuweiler 1990) but have been shown to use secondary forests frequently (Sampaio 2000).
Sanguivores
Sanguivores are usually not caught in sufficient numbers to make inferences about their response
to habitat type (Faria 2006; Sampaio 2000; Schulze et al. 2000). Desmodus species feed on large
mammals and can increase in matrix habitats where cattle is present (Delpietro et al. 1992).
Diaemus species prey on large birds in the canopy and their abundance might map on to the
habitat response of the prey (Bernard 2001).
Edge-sensitive species
Even closely related taxa within the same guild may exhibit varied responses to edge formation
(Didham et al. 1998; Ewers & Didham 2006). Species that avoid matrix habitat and decline or
disappear after fragmentation are often the same species that are sensitive to edges (Cosson et
al. 1999; Meyer & Kalko 2008). Sensitivity to fragmentation/edges in bats has been associated
with traits such as poor dispersal ability and maneuverability, higher trophic level, specialized
habitat-/food requirements and naturally low in abundance (Cortés-Delgado & Pérez-Torres 2011;
Cosson et al. 1999; Kalko et al. 1999; Klingbeil & Willig 2009; Meyer et al. 2008; Sampaio 2000).
2.4 The impact of patch size and the interaction between patch size and edge effects
Species declines with decreasing patch size have been well documented for several animal groups
including butterflies (Holt et al. 1995), beetles (Laurance & Bierregaard 1996), gastropods (Baur &
Erhardt 1995), understory birds (Ferraz et al. 2007), and primates (Boyle & Smith 2010).
For bats this pattern is again not consistent, with reports of positive (Estrada & Coates-Estrada
2002; Struebig et al. 2008), negative (Gorresen & Willig 2004; Klingbeil & Willig 2009) and neutral
(Faria 2006; Schulze et al. 2000) relationships between richness and patch size. The direction of
response has been shown to depend on several factors, such as guild- and species characteristics
17
as well as spatial- (Meyer & Kalko 2008; Pinto & Keitt 2008) and temporal scale (Cosson et al.
1999).
To the best of my knowledge only one bat-study partially addressed the effect of patch size on
edge effects. Faria (2006) found that capture rate and richness did not differ significantly between
interiors of different sized patches and between edges of different sized patches. However, no
comparison was made on the difference between edge and interior habitat for different patch
sizes. Delaval and Charles-Dominique (2006) showed that some edge-related changes in the bat
assemblage extended up to 3km into the forest. This implies that interior-habitats of smaller
fragments exhibit more similarities in their bat assemblage to edge-habitats than interior-habitats
of larger fragments, which confirms the general finding that small fragments (<100ha) may consist
entirely of edge-habitat (Laurance 2008; Malcolm 1994).
2.5 Vegetation
2.5.1 The matrix
The faunal composition in fragment interiors and edges has to be viewed in context with the
matrix habitat. For example, small shrub frugivores such as Rhinophylla pumilio, Carollia castanea
and Carollia perspicillata decline in fragments surrounded by water (Cosson et al. 1999; Meyer
and Kalko 2008) but increase in fragments surrounded by secondary forest or coffee/cacao
plantations (Faria 2006; Numa et al. 2005; Schulze et al. 2000; Willig et al. 2007).
In the Neotropics deforestation is usually followed by the development of secondary forest which
may attenuate edge effects (Fearnside 1996; Antongiovanni & Metzger 2005). However, forest
interior habitat still differs profoundly from secondary forest vegetation and even different types
or successional stages of secondary forests differ in vegetation characteristics (Ricketts 2012). For
example, in the Amazon, sites that have been clear-cut without subsequent use develop in
Cecropia dominated regrowth and sites that are clear-cut and burned and/or used as pastures
develop in Vismia dominated vegetation (Mesquita et al. 2001). Cecropia regrowth is more divers
(twice the number of plant species) than Vismia-dominated regrowth and has a faster return of
primary forest species and vegetation characteristics that are common to the primary forest (e.g.
high DBH), with consequent buffering impacts on edge effects (Mesquita et al. 2001). Bat species
composition has been shown to differ between these two types of secondary regrowth
(Brobowiec & Gribel 2010) which may influence potential edge effects on bats.

18
2.5.2 Vegetation characteristics
Several studies have explicitly related vegetation characteristics to bat assemblage attributes.
Important determinants were vegetation density, structural complexity, height, and basal area
(Cortés-Delgado & Pérez-Torres 2011; Fenton et al. 1998; Hein et al. 2009; Law & Chidel 2002;
Pereira et al.2010; Peters et al. 2006).
Understory vegetation is usually denser in edge- and matrix habitats than in forest interiors (Kalko
& Schnitzler 1993; Patriquin & Barclay 2003) which has been shown to negatively impact
animalivorous bats even despite higher prey availability (Law & Chidel 2002; Peters et al. 2006).
Vegetation clutter may function as a movement barrier that requires energetically costly
maneuverable flight (Kusch et al. 2004; Meyer et al. 2008) and interferes with acoustics echoes
returning from prey (Fenton 1990; Schnitzler & Kalko 2001). Frugivores and nectarivores rely less
on echolocation and have been shown to thrive well in dense understory vegetation (Peters et al.
2006; Schnitzler & Kalko 2001).
Structural habitat complexity (i.e. many vertical layers) has been related to bat diversity (Pereira
et al.2010) because it allows the co-existence of more species in the same area due to niche
segregation (Delaval et al. 2005).
Finally, tree height and basal area have been positively related to bat abundance and richness
(Cortés-Delgado & Pérez-Torres 2011; Erickson & West 2003; Fenton et al. 1998; Hein et al. 2009)
which is probably related to higher roost availability in old large trees (Crampton & Barclay 1996;
Estrada & Coates-Estrada 2001; Kalko et al. 1996). Edges also tend to have lower variance in tree
height which may be preferred by fast-flying less maneuverable bats (Cortés-Delgado & Pérez-
Torres 2011).
2.6 Expectations
Considering the background information, I expect to find the following results for the stated
objectives:
1. Species richness, diversity and evenness may decrease at the edges and in the matrix due
to a loss of sensitive species and an explosion in abundance of disturbance preferring
species. I expect abundance levels to increase in edge- and matrix habitat driven by
increases in frugivorous and nectarivorous species. Gleaning animalivores are expected to
be edge-sensitive and have decreased abundances in edge- and matrix habitat compared

19
to interiors, while aerial insectivores, canopy frugivores and opportunistic frugivores may
respond less sensitive. Considering these differences in guild representation, I expect
species composition to differ between interior- edge- and matrix habitat with the latter
two potentially being a subset of the first.
2. I expect area and edge effects to act synergistically such that differences between large
and small patches are similar to differences between interior habitat compared to edge-
and matrix habitat and I expect differences between interior habitat compared to edge-
and matrix habitat to increase with patch size.
3. I expect to find clear differences in vegetation structure between interior habitat and
edge- and matrix habitat, with interiors having taller stratified vegetation with more
roosting opportunities (i.e. large trees, palms) which may explain part of the edge effects
on bats that I expect to find.

20
3. Methods
3.1 Study site
I conducted the fieldwork in the experimental area of the Biological Dynamics of Forest
Fragmentation Project (BDFFP). The BDFFP is the world’s longest running and largest scale
‘natural experiment’ of habitat fragmentation, covering a period of 33 years and an area of >1000
km2 (Laurance et al. 2011).
The BDFFP is located 80 km north of Manaus, in the Brazilian Amazon (2:25’S, 59:50’W). The area
is covered by low elevation (80-160m) ‘terra-firme’ forest on heavily weathered nutrient-poor
acidic latosols, typical for the majority of the Amazon basin (Lovejoy & Bierregaard 1990). The
area receives 1900 to 3500mm rainfall annually, with a rainy season from January to June and a
dry season from June to October. Mean annual temperature is 26.7 :C (Lovejoy and Bierregaard
1990).
The BDFFP-area was fragmented for research purposes in 1979 by clearing and burning (fig3.1). It
comprises 11 forest fragments of different sizes (five of 1ha, four of 10 ha and two of 100ha) and
is surrounded by vast expanses (~500.000ha) of continuous primary rainforest (fig 3.2)
(Bierregaard et al. 2001). The matrix habitat consists of secondary forest in various successional
stages (Mesquita 2001). For a complete description of the project design and history, please refer
to Laurance & Bierregaard (1997) and Bierregaard et al. (2001).
Figure 3.1: An experimentally fragmented 1ha forest patch of the BDFFP (photo by R.O. Bierregaard).

21
3.2 Methodological framework
The methodology for this study included the sampling of the bat assemblage with mist nets and
the sampling of the vegetation characteristics. The focus was on the family Phyllostomidae and
the mustached bat (Pteronotus parnellii, family: Mormoopidae) because only these species can be
sampled adequately and most effectively with mist nets (Fenton 1997; Kunz & Parsons 2009; Kunz
& Kurta 1988). Species from other families, especially aerial insectivores which have better
echolocation and/or forage over the canopy, remain underrepresented or completely undetected
in mist nets (Kalko et al. 1996; Kunz & Parsons 2009).
In order to study edge effects on bats, an experimental design was developed that included 33
sampling sites scattered over six locations: Cabo Frío (CF), Florestal (FL), KM-41 (K41), Colosso
(CO), Dimona (DI) and Porto Alegre (PA) (table 3.1, fig 3.2). Most of these sites had been sampled
for bats in the period between January 1996 and June 1999 by E. Sampaio (2000), although she
did not sampled the 100ha fragments nor systematically sampled the edge- and matrix habitat.
Sites were categorized by patch size and by habitat type (interior, -edge- or matrix) (table 3.1).
There were three fragments of 1ha; three fragments of 10ha; two fragments of 100ha and three
control plots in the continuous forest. Each fragment/control plot contained three paired
sampling sites: one for each habitat type (interior-, edge- or matrix). The only exception was the
control plot in KM-41. This plot is located in the middle of the continuous forest and does not
have borders. Instead an edge- and matrix site was established at the border of the continuous
forest in Dimona (table 3.1).
Figure 3.2: Map of the ‘biological dynamics of forest fragmentation project’-research area, study locations: CF= Cabo frío, CO=Colosso, DI= Dimona, FL=Florestal, K41= KM-41, PA= Porto Alegre (BDFFP 2012).

22
Table 3.1 Properties of the study sites and sampling effort per treatment, CF= Continuous Forest, mnh=Mist Net Hour: one mist net held open for one hour.
Size Replicates Habitat type mnh per treatment Locations
1 hectare 3 Interior 588 CO, DI, PA
Edge 378 CO, DI, PA
Matrix 378 CO, DI, PA
10 hectare 3 Interior 504 CO, DI, PA
Edge 378 CO, DI, PA
Matrix 378 CO, DI, PA
100 hectare 2 Interior 504 DI, PA
Edge 252 DI, PA
Matrix 252 DI, PA
Control 3 Interior 504 CF, FL, K41
(Continuous forest) Edge 378 CF, DI, FL
Matrix 378 CF, DI, FL
Total 11 33 4872 6
The interior sites were situated in the centre of a fragment or in a continuous forest site. Here,
two transects of seven mist nets each were established in a straight line. The edge sites contained
one transect of seven mist nets that were positioned in a straight line right at the border between
forest- and matrix habitat. The matrix sites also contained one transect of seven mist nets and
these were established parallel to the edge at a distance of ~100m (figure 3.3).
Figure 3.3: Schematic overview of the sampling design, red line = mist net transect with 7 mist nets (~84m), grey rectangle = vegetation plot (5x20m).
Vegetation was sampled for a wide variety of characteristics (see below). Three 100m2 vegetation
plots were established at each side of the mist net transects (fig. 3.3). The plots were placed at a
distance of ~5m from the mist net transect to avoid effects of the cleared area (trails) around the
nets on the vegetation. Vegetation plots were spaced at a minimum distance of 5m from each

23
other to avoid an overlap in measurements. Together the vegetation plots covered approximately
the total length of the mist net transect (~84m). From the two mist net transects at interior-sites,
one was randomly selected for vegetation sampling. All areas adjacent to matrix- and edge
transects were sampled. In total 198 plots (19,800m2) were sampled.
3.3 Field methods
Data was collected in the period between 22nd of March and 12th of July 2012. I personally
contributed to the sampling from between 16th of April and 12th of July.
3.3.1 Bat sampling
Bats were captured using ground-level mist nets (12 m long, 2.5 m high, five shelves, mesh
dimensions: 1.5x 1.5 cm). Each night, mist nets were left open between ~18:00 (sunset) and
~00:00 (with a variation of <10min).
Sites were never sampled at two consecutive nights to prevent potential capture bias due to net
shyness and learning behaviour (Kunz & Brock 1975; Larsen et al. 2007; Sampaio 2000). The
average period in between sampling was 28 days with only five occasions of less than 20 nights.
A possible capture bias may arise because we used forest trails t place the mist net transects.
Human modifications are frequently used by phyllostomid bats as flyways but may favor certain
species (specifically frugivores and nectarivores) more than others (O’Farrell and Gannon 1999;
Palmeirim & Etheridge 1985). However, this bias should be equal for all treatments and replicates.
Nets were checked every ~15 minutes. Net- and shelf number and time of capture was noted.
Species were identified with the help of identification keys by Aguirre, Vargas & Solari (2009); Lim
& Engstrom 2001; Medellín et al. (1997) and Sampaio & Kalko (unpublished). I followed the
taxonomic nomenclature of Gardner (2007). Captured bats were identified, weighed (Pesola
spring balances of 30, 60, 100 and 300g; 0.5, 0.5, 1, and 2g accuracy respectively), length of
forearm and tibia was measured and their sex, age class (juvenile, sub adult or adult) and
reproductive status (females: non-reproductive, pregnant or lactating; males: testicle size) was
determined.
Adult bats were marked to avoid double-counting and for potential future re-capture studies.
Frugivores were marked with a stainless-steel ball-chain necklace with a unique number (Handley
et al. 1991). Species with a small body size (i.e. all Glossophaginae and Mesophylla macconelli)

24
were not marked for health and safety reasons. Gleaning animalivorous bats were marked with a
subcutaneous sterilized trovan® electronic identification system transponder of size:
2.6x0.15x40mm with a unique number and bar-code. Recaptures were identified with a trovan®
LID-560 pocket transponder reader. All bats were released after handling.
3.3.2 Vegetation sampling
In each plot we counted the total number of stems that were at breast height or taller. All stems
with a diameter >10cm, the DBH (Diameter at Breast Height) was measured. At 5m-intervals (5
points per plot) tree height of the five closest trees was estimated (i.e. 25 trees per plot).
At the same 5m interval points vegetation stratification was estimated. Vegetation density was
classified (0= no vegetation, 1= very sparse vegetation 0-20%, 2=sparse vegetation 20-40%, 3=
medium vegetation 40-60%, 4= dense vegetation 60-80%, 5=very dense vegetation 80-100%) for
seven height intervals (0-1m, 1-2m, 2-4m, 4-8m, 8-16m, 16-24m, 24-32m). At each plot, canopy
cover was measured as the average of four spherical densiometer (Model-C, Robert E. Lemmon
forest densiometer, Forestry Suppliers Inc., Bartlesville, OK, USA) readings, taken at a minimum
distance interval of 35m. Stem count, DBH, stratification and canopy cover are common variables
for vegetation characterisation and have been shown to be related to species diversity and
composition (Banks-leite & Cintra 2008; Banks-Leite et al. 2010; Meyer & Kalko 2008; Raman &
Sukumar 2002; Schemske & Brokaw 2004; Schmiegelow et al. 1997; Watson et al. 2004).
The number of palms (dominant generas: Astrocaryum, Attalea and Bactris) within each plot was
counted. Palms can make up a considerable proportion of understory vegetation in tropical
forests and are used by a variety of bat species as roost sites (Kunz & Lumsden 2003; Scariot
1999). Liana density was classified at each 5m-interval to categories 0-5: from no lianas to very
high liana density. Liana abundance has been shown to increase at edges and in disturbed forests,
forming an important vegetation component which in turn can influence flora and fauna
(Laurance et al. 2001; Schnitzer & Bongers 2011). Finally, the number of potential roost sites per
plot was counted. Roost availability is often higher in primary forests compared to secondary
forests and may have an important impact on bat presence (Morris et al. 2010; Bobrowiec &
Gribel 2010; Schulze et al. 2000). Potential roost sites included: hollow (fallen) trunks and dead
trees, trees with abundant/large crevices, large buttress roots, large abandoned termite piles etc.
(Morris et al. 2010). At edge- and matrix sites, we identified what the most abundant plant genera
in the plot was (mainly: Vismia and Cecropia).

25
To reduce bias caused by the subjectivity of some of the vegetation variables, the same observer
was used for each task everywhere.
3.4 Analytical methods
Completeness of the bat inventory
To assess the completeness of the bat-inventory, I calculated a sample-based (100 permutations)
species accumulation curve for the entire landscape and for each habitat type individually (Gotelli
& Colwell 2001). Additionally, I consulted an estimator choice-framework that accounts for
movement heterogeneity of mobile animals, developed by Brose & Martinez (2004). In
accordance with the framework, I chose the first-order Jackknife (Jack1) estimator to assess
expected species richness in the edge-, interior- and matrix habitats.
Species richness, diversity, evenness and abundance
To enable comparative analysis between sites, I first had to correct for differences in sampling
effort among sites (table3.1). This was done by rarefying species richness by sampling effort
(Gotelli & Graves 1996). Due to uncertainties over the correct identification of Carollia benkeithi
and Carollia brevicauda, these species were grouped together as Carollia sp. and treated as one
species in further analysis. Capture rate (number of individuals per mnh) was used as a
standardized index of relative abundance, which is the mean number of bats for every hour of
one open mist net. Recaptures of the same night were excluded from analysis.
As a measure of alpha diversity I used the ‘effective number of species’ based on a bias-controlled
Shannon’s entropy. This is the exponential form of the Shannon’s index and is considered the
most suitable measure when undersampling is suspected and completeness is higher than 50%
(Beck & Schwanghart, 2010; Jost, 2006). As an evenness measure I used the Pielou’s index, which
is a commonly used derivative of the Shannon-index (Pielou 1975).
I performed a Kolmogoroff-Smirnov test to test for differences in rank-abundance distributions of
the different habitat types.
I compared differences in rarefied richness, diversity- and evenness indices and capture rates (at
the assemblage- and guild level and for the four most abundant species) between habitat types
with a repeated measures analysis of variance (RM-ANOVA) using the R-package ‘lme4’ (Bates et

26
al. 2011). Because data were not counts and were reasonably normal distributed, they were
modeled using Gaussian errors (Deriche, 1993). I used the following three models:
Y ~ “habitat type” + {“fragment”} (1)
Y ~ “habitat type” + “size” + {“fragment” } (2)
Y ~ “habitat type” + “size” + {“fragment”} (3)
In which ‘habitat type’ represents the interior-, edge- and matrix habitat, and ‘size’ represents the
value of 1,10,100ha, and control sites. Pseudo replication was controlled statistically by including
{‘fragment’} as a random effect.
The first model used ‘habitat type’ as only fixed effect and was used to assess the exclusive
impact of the interior-, edge- and matrix habitat on the estimates of the bat community. The
other two models were used to evaluate whether the size of forest patches influenced the
response to habitat type. Model 2 was used to assess whether the mean value of the measures
for a particular habitat type changed with size. Model 3 was used to assess whether the pattern of
differences between habitat types changed with patch size. For example, this model could discern
whether capture rate was lower in the interior compared to the edge habitat in small patches but
higher in large patches.
The RM-ANOVA is a powerful method to assess differences between interior-, edge- and matrix
habitat, as it controls for additional random variation by comparing the three habitat types within
each fragment (e.g. 1 hectare in Colosso). If habitat types were not sampled in a paired design and
instead located randomly, the statistical power would be much lower, due to unaccounted
random variation, and more replicates would be needed.
The models were tested for significance by using a ‘deletion test’ starting with the most complex
models (3 and 2) and ending with a comparison between model 1 and a null model that assumes
no differences in the data (Crawley 2007).
Species composition
To estimate compositional differences of the bat assemblages between habitat types, I used a
Principle Coordinate Analysis (PCoA) on a Bray-Curtis dissimilarity matrix based on species capture
rates. The Bray-Curtis index assigns a higher weight to the presence of a species than to its
absence and is considered robust for biological data (Magurran 2004). PCoA is a technique that

27
allows the positioning of the Bray-Curtis dissimilarity coefficients in a space of reduced
dimensionality while largely preserving their distance relationships (Legendre & Legendre 1998).
Species abundance was corrected for differential sampling effort through the use of capture rates
(see above). However, the number of species is still higher at sites with a larger sampling effort.
To correct for this issue, I used the number of rarefied species (rounded to nearest integer) to
draw from the assemblage which species were more likely to be sampled, using their capture rate
as sampling probability. This allowed me to obtain a matrix of species by sites that contained
information on species identity and yet was corrected for differences in sampling effort.
The first two PCOA vectors were plotted against each other to find out how much of the
differences in assemblage composition were explained by each axis. A ‘horseshoe’ or horizontal
pattern would indicate high explanatory power of the first PCOA axis.
The first PCOA vector was analyzed with the same models as described above. The variance of the
PCOA vector within each habitat type was compared to assess if beta-diversity was larger at a
given habitat type.
Differences in vegetation structure and composition between habitat types
The means and standard deviations of the vegetation measures were scaled to a mean of 0 and
standard deviation of 1, and then submitted to a Principle Component Analysis (PCA) (Tabachnick
& Fidell 2007). The dominant plant genera were converted into a code (1=Vismia, 2=Cecropia, 3=
interior habitat: no dominant genera) to enable inclusion into the ordination-matrix. The
coefficients of the first PCA vector were compared between habitat types with the models
described above. The relative importance of different vegetation characteristics was assessed by
correlating these variables with the first PCA-vector.
The influence of vegetation characteristics on bats
The first vegetation PCA vector was used as an explanatory variable in a generalized linear model
(GLM) with species richness, species composition (expressed as the first PCOA vector from the
Bray-Curtis dissimilarity index), and capture rates (per 1000mnh and rounded to 0 decimals) as
response variables. Because data showed a non-normal distribution with Poisson errors a model
from the Poisson family was used.

28
All statistical analysis were performed using the R statistical package (version 2.13.2, R
Development Core Team 2011), specifically: the ‘vegan package’ (Oksanen et al. 2011) and the
‘lme4 package’ (Bates et al. 2011).

29
4. Results
With a total effort of 4872 mnh, we captured 1272 bats (including 45 recaptures) from 23 genera
and 37 species, representing all of the seven guilds. Appendix 1 provides a complete overview of
the inventory and the respective capture rates in interior-, edge – and matrix habitats.
4.1 Completeness of the bat inventory
The species accumulation curve of the complete inventory (fig. 4.1) approaches, but does not fully
reach, an asymptote. None of the species accumulation curves for the interior-, edge- and matrix
habitats are close to reaching the asymptote (fig. 4.2), which demonstrates that the set of species
captured is not complete.
The Jackknife richness estimator indicates an overall completeness of 84.2% of the species at the
landscape level. The completedness for each treatment individually was: 74.7% (interior); 64.8%
(edge) and 77.0% (matrix).
Figure 4.1: Species accumulation curve for the complete inventory after a sampling effort of 4872 mist net hours, error bars indicate the 95% confidence interval.
Figure 4.2: Species accumulation curves for interior-, edge- and matrix habitat after sampling effort of 2100, 1386 and 1386 mnh respecitvaly.
0 20 40 60 80 100
10
20
30
40
Effort (1 unit = 42 mnh)
Sp
ecie
s
0 10 20 30 40 50
51
01
52
02
53
0
Effort (1 unit = 42 mnh)
Sp
ecie
s
Interior
Edge
Matrix

30
4.2 Species richness, diversity, evenness and abundance at the assemblage level
Table 4.1 shows the mean values of rarefied richness, the diversity- and evenness index and
capture rate. None of the RM-ANOVA’s demonstrated a significant difference in richness, diversity
or evenness between interior-, edge-, and matrix habitats.
Table 4.1: Mean values of richness; evenness; capture rate (total; for each guild and for the three most abundant species) and first PC(O)A vectors for interior-, edge- and matrix habitats and the p-value of the RM-ANOVA model1, 2 and 3, ** indicates a significant result (p<0.05), *indicates a near significant result (0.05<p<0.1).
Pielou’s evenness was highly similar amongst the different habitat-types (mean: 0.72±0.02 and
see table 4.2). This is confirmed by the fact that the rank abundance curves for each habitat type
(fig. 4.3) are not statistically different as shown by the Kolmogoroff-Smirnov test outcomes
(distribution interior vs. edge p=0.08; interior vs. matrix, p=0.08; ege vs. matrix p=0.6138). The
abundance distribution followed the skewed pattern typical for Neotropical bat assemblages: few
species with a high capture frequency and many species with a very low capture rate (Fleming
1986; Kalko & Handley 2001; Simmons & Vos 1998). At the assemblage level, the ten most
frequently captured species accounted for 91.1% of captures, while 24 species had less than 10
captures, of which seven were singletons and six were doubletons.
Interior Edge Matrix Model 1 Model 2 Model 3
Assemblage
Rarefied species richness 7.33(0.87) 6.55(0.73) 8.55(0.95) 0.22 0.37 0.89
Shannon's exponential diversity index 3.77(0.12) 4.74(0.13) 4.32(0.08) 0.21 0.11 0.32
Pielous's eveness index 0.75(0.04) 0.71(0.05) 0.70(0.03) 0.56 0.15 0.41
Capture rate 0.15(0.03) 0.38(0.08) 0.33(0.06) 0.02** 0.77 0.90
Species composition
PCOA-1 -0.15(0.09) 0.04(0.08) 0.11(0.08) 0.03** 0.20 0.93
Guilds: capture rates
Frugivores 0.13(0.03) 0.26(0.06) 0.29(0.06) 0.04** 0.85 0.82
Shrub frugivors 0.11(0.02) 0.22(0.04) 0.23(0.03) 0.03** 1.00 0.38
Canopy frugivores 0.02(0.001) 0.07(0.006) 0.09(0.01) 0.054* 0.21 0.41
Opportunistic frugivores 0.04(0.003) 0.07(0.02) 0.10(0.03) 0.54 0.45 0.81
Gleaning animalivores 0.04(0.01) 0.09(0.01) 0.09(0.005) 0.43 0.03** 0.62
Nectivores 0.01(0.002) 0.002(0.002) 0.003(0.002) NA NA NA
Sanguivores 0.001(NA) 0.00 0.00 NA NA NA
Species: capture rates
Carollia perspicillata 0.08(0.02) 0.17(0.04) 0.18(0.04) 0.04** 0.84 0.63
Rhinophylla pumilio 0.02(0.005) 0.03(0.01) 0.04(0.01) 0.33 0.06* 0.60
Artibeus obscurus 0.01(0.002) 0.02(0.02) 0.03(0.02) 0.49 0.46 0.81
Pteronotus parnellii 0.01(0.003) 0.02(0.01) 0.02(0.004) 0.32 0.09* 0.65
Vegetation
PCA-1 3.68(0.35) -0.90(0.5) -1.89(0.49) 2.26e^-10** 0.08* 0.83
Mean value per habitat type p-value

31
Significant differences were found for capture rates at the assemblage level across the three
habitat types, with lower capture rates in the interior- versus the edge- and matrix habitats in
fragments (fig 4.4). This trend appears to apply only to fragments larger than 1ha. However, the
models that included fragments size, either as an interactive or additive factor were all non-
significantly different from model 1: habitat type as only explanatory variable.
4.3 Species composition
The differences in assemblage are almost completely explained by the first PCOA axis (fig. 4.5).
Indeed, model 1 demonstrated significant differences in the first PCOA vector between interior, -
edge- and matrix habitats (p=0.03) (table 4.1).
The values of the first PCOA vector were more similar between edge- and matrix habitats than
between edge-/matrix- and interior habitat (fig. 4.6). This result points to a different species
composition in the interior- compared to the edge- and matrix habitats. The variance in PCOA-1
coefficients was not significantly different between habitat-types. This indicates that beta-
diversity was similar for all habitat types.
Figure 4.3: Rank Abundance curve based on the log transformed capture rate in the interior-, edge- and matrix habitat.
Figure 4.4: Mean capture rate in the interior-, edge- and matrix habitats in each fragment size category (error bars represent standard errors).
0 5 10 15 20 25 30
-3.5
-3.0
-2.5
-2.0
-1.5
-1.0
-0.5
Species Rank
Log (
Cap
ture
Rat
e)
Interior
Edge
Matrix
1ha 10ha 100ha CFC
aptu
re R
ate
0.0
0.2
0.4
0.6
0.8
Interior
Edge
Matrix

32
Abundance patterns at the guild level
The frugivores guild was represented by the greatest number of individuals (all frugivores, 82.3%;
shrub frugivores, 69.2%; opportunistic frugivores, 7.8%; canopy frugivores, 5.3%), followed by the
gleaning animalivores (10.7%). The nectarivores and sanguivores had too few captures (7 and 1
resp.) to be further analyzed.
Habitat-type significantly influenced capture rate at the guild level (table 4.1). The frugivores guild
(p=0.035) and the shrub frugivores (p=0.030) mirrored the abundance pattern of the entire
assemblage (table 4.1 and fig. 4.2, 4.7A, B). For the gleaning animalivores model 2 was significant
(p=0.03, table 4.1) which indicates that patch size influenced capture rate of the gleaners. Capture
rates are especially different between the interior of the 1ha fragments and the interior of larger
fragments, while capture rates at the edge seem to increase gradually with patch size (fig 4.7E).
None of the models were significant for the other guilds, although the canopy frugivores showed
a trend towards higher capture rate in the edge- and matrix habitat compared to the interior
habitat (p=0.054).
Abundance patterns at the species level
The most frequently captured bat was Seba’s short-tailed bat (Carollia perspicillata, 51.5%),
followed by the dwarf little fruit bat (Rhinophylla pumilio, 11.9%); the dark fruit-eating bat
Figure 4.5: PCOA vectors 1 and 2 of the principle coordinate analysis based on bat capture rates in interior-, edge- and matrix habitat, sizes of squares indicate fragment size (from small to large: 1ha; 10ha; 100ha; continuous forest), note the typical ‘horse shoe’ distribution.
Figure 4.6: Mean and standard errors of the first vector of the PCOA analysis based on bat capture rates in interior-, edge- and matrix habitats.
Interior Edge Matrix
PC
OA
-1
-0.3
-0.2
-0.1
0.0
0.1
0.2
-0.4 -0.2 0.0 0.2 0.4
-0.4
-0.2
0.0
0.2
0.4
PCOA-1
PC
OA
-2
Interior
Edge
Matrix

33
1ha 10ha 100ha CF
A: Frugivores
0.0
0.2
0.4
0.6
1ha 10ha 100ha CF
B: Shrub frugivores
0.0
0.1
0.2
0.3
0.4
1ha 10ha 100ha CF
C: Canopy frugivores
0.0
00
.02
0.0
40
.06
0.0
8
1ha 10ha 100ha CF
D: Opportunistic frugivores
0.0
00
.05
0.1
00
.15
0.2
0
Interior
Edge
Matrix
1ha 10ha 100ha CF
E: Animalivores
0.0
00
.02
0.0
40
.06
1ha 10ha 100ha CF
F: C. perspicillata
0.0
00
.10
0.2
00
.30
1ha 10ha 100ha CF
G: R. pumilio
0.0
00
.02
0.0
40
.06
1ha 10ha 100ha CF
H: A.obscurus
0.0
00
.05
0.1
00
.15
0.2
0
1ha 10ha 100ha CF
I: P.parnelli
0.0
00
.01
0.0
20
.03
0.0
4
(Artibeus obscurus, 7.2%) and the Parnell’s mustashed bat (Pteronotus parnellii, 5.3%). Only for C.
perspicillata could we demonstrate a significant difference between habitat types (p=0.04, table
4.1), with capture rates closely resembling those of the (shrub)frugivores (fig. 4.7B,F). The two
models that included patch size were not significant for any of the species. However, the relation
between patch size and capture rates was near significant for R. pumilio and P. parnellii (table
4.1). R. pumilio is a shrub frugivore but showed a different trend to the capture rate of that guild
(fig 4.7B,G). Capture rates in the interior were higher in the 10ha and 100ha fragment than the
1ha fragment and continuous forest and capture rates in the edge- and matrix habitat were lower
in the 1ha fragment than the larger fragments (fig. 4.7G). Capture rate of P. parnellii appears to
increase with patch size (p=0.09, table 4.1, fig.4.7I) and both P.parnellii and A. obscurus seem to
Figure 4.7: Mean capture rates of frugivores (A); shrub frugivores (B); canopy frugivores (C); opportunistic frugivores (D); gleaning animalivores (E); C. perspicillata (F); R. pumilio (G); A. obscurus (H) and P.parnellii (I) for the different habitat types (interior; edge; matrix) and different fragment sizes (1;10;100ha and CF: continuous forest), errors bars indicate standard errors.

34
have peak capture rates in the 10ha edge- and/or matrix habitat (fig. 4.7I,H). The capture rate of
A.obscurus closely mirrors the capture rate of the opportunistic frugivores (fig. 4.7D,H).
4.4 Differences in vegetation structure and composition between habitat types
Most of the variation in vegetation data is explained by the first PCA vector (fig. 4.8). This is
confirmed by the results of model 1 that was significant for the first PCA vector (p=2.257e^-10,
table 4.1). Patch size was nearly significantly related to the first PCA vector (p=0.08, table 4.1).
Figure 4.8 also demonstrates that interior sites cluster together, indicating similarity in vegetation
characteristics. To a somewhat lesser extent, the same clustering can be observed for matrix sites.
Edge sites are scattered around the graph, but it is interesting to see that the vegetation plots
taken at the interior-side of the edge (side1) are grouped towards the interior sites on the right
side of the graph. Vegetation plots taken at the matrix-side of the edge (edge 2) are grouped
around the matrix sites on the left side of the graph. Interior sites of the small fragments (1ha)
appear to be grouped more towards the matrix- and edge sites compared to interior sites of the
larger fragments.
Figure 4.8: Vectors 1 and 2 of the principle component analysis of vegetation characteristics in interior-, edge side 1- (towards interior), edge side 2- (towards matrix), and matrix habitat, sizes of squares indicate fragment size (from small to large: 1ha; 10ha; 100ha; continuous forest).
-6 -4 -2 0 2 4
-6-4
-20
24
PCA-1
PC
A-2
Interior
Edge side 1
Edge side 2
Matrix

35
Interior Edge Matrix
Vegetation dens ity at 16-24m 2.86 ± 0.29 1.06 ± 0.22 0.61 ± 0.27
Standard deviation height 8.25 ± 0.47 4.89 ± 0.36 4.39 ± 0.54
Vegetation dens ity at 8-16m 3.58 ± 0.16 2.46 ± 0.32 1.74 ± 0.37
DBH 23.56 ± 0.61 17.36 ± 1.28 16.41 ± 0.61
-6 -4 -2 0 2 4 6
02
00
40
06
00
80
0
Vegetation PCA-1
Cap
ture
Rat
e (b
ats
per
1000 m
nh) Interior
Edge
Matrix
The vegetation characteristics with the most influence on the first PCA vector were vegetation
density at the 16-24m level (85%); standard deviation in height (84%), density at the 8-16m level
(78%), and DBH (65%) (table 4.2).
Table 4.2: Mean and standard error of the four vegetation characteristic with the most influence on the first vegetation PCA-1.
4.5 The influence of vegetation characteristics on bats
The capture rate of the entire assemblage is inversely related to the first vegetation PCA (p=0.02,
fig 4.9). Interior sites cluster at the bottom right of the graph, indicating similarity in vegetation
characteristics and capture rates of bats that is different from edge- and matrix habitats. When
analyzing the interior-, edge- and matrix habitat separately no significant relation between PCA1
and capture rate was found. This points to similarity in vegetation characteristics (and related
capture rates) within each habitat type. However, the relationship was near significant for the
matrix habitat (p=0.058) and there appears to be a wide distribution of points for the matrix
habitat (fig 4.9). There was no significant relation between the first PCA vector of vegetation
characteristics and the first PCOA vector of bat species composition (p=0.08), species richness
(p=0.65), diversity (p=0.39) or evenness (p=0.82).
Figure 4.9: Capture rate of bats (individuals per 1000mnh) in relation to the first PCA vector of vegetation characteristics.

36
5. Discussion
5.1. Edge effects
The results provide some support for the existence of an edge effect on bats, as overall capture
rate was lower in the interior habitat compared to edge- and matrix habitats. Capture rate at the
assemblage level was dominated by the most abundant guild (shrub-frugivores) and more
specifically by the most abundant species (C. perspicillata).
These results are consistent with those of Delaval and Charles-Dominique (2006) and Cortés-
Delgado and Pérez-Torres (2011). For example, in French Guyana, the edge-habitat harboured
seven times more individuals as the forest interior which was caused by an increased abundance
of a few frugivorous species such as C.perspicillata. Elevated capture rates in matrix habitat
compared to forest-/fragment interiors of bat assemblages that are driven by an increase in
shrub-frugivores such as C. perspicillata have also been demonstrated for a variety of matrix
habitats including: secondary forests (Castro-Luna et al. 2007; Sampaio 2000), shade cacao- or
coffee plantations (Faria 2006; Faria et al. 2006), crop fields (Willig et al. 2007) and logged forests
(Peters et al. 2006) and this group and species have even been suggested as an indicator of
habitat disruption in the Neotropics (Medellín et al. 2000; Wilson et al. 1996).
Increased abundances of shrub-frugivores can be related to their preferred pioneer fruit trees
(e.g. Piper, Cecropia and Vismia) which are highly abundant in edge- and matrix habitats
(Muscarella & Fleming 2007). Specifically at the edges, abundance may increase because shrub
frugivores such as C.perspicillata and R.pumilio frequently enter and exit the fragments to reach
complementary resources (i.e. roosts and fruits) (Cortés-Delgado and Pérez-Torres 2011; Sampaio
2000). Finally, capture rates of shrub frugivores and C.perspicillata have been negatively
correlated to similar vegetation characteristics that are typical for forest interior, as in our study,
i.e. high canopy foliage density (Castro-Luna et al. 2007; Peters et al. 2006; Rex et al. 2011), large
tree basal area and high variability in tree trunk height (Cortés-Delgado & Pérez-Torres 2011).
Other studies (i.e. Faria 2006, Meyer & Kalko 2008) did not demonstrate pronounced differences
in capture rates between edge- and interior habitats at the assemblage level and/or for shrub-
frugivores. However, Faria (2006) sampled ‘edges’ 20m from the border inside the forest
fragment, where shrub-frugivores may fly through but don’t spend time foraging since the
availability of pioneer fruit species is higher outside the fragment. Meyer & Kalko (2008) found no

37
differences in vegetation structure variables between their edge- and interior sites. In contrast,
the study by Cortés-Delgado and Pérez-Torres (2011) as well as the present study, found
significant differences in vegetation structure between edge- and interior habitat which was
significantly related to capture rate at the assemblage level.
Canopy frugivores showed a near significant trend of higher capture rates in edge- and or matrix
habitats when compared to forest interior. However, when looking at the data more closely, the
canopy frugivores appear to show a clumped distribution. For instance, the relatively high capture
rates in the matrix surrounding 10-, and 100ha fragments were based mostly on two locations:
Porto Alegre and Dimona. In the matrix of the 10ha fragment in Porto Alegre only large canopy
species were caught (Artibeus concolor and Artibeus literatus), whereas in the matrix of the 10-
and 100ha fragments in Dimona only small canopy frugivores were caught (Artibeus cinereus and
Artibeus gnomus).
These inconsistencies may be caused by the mapping of these species onto their preferred fruiting
trees, which indicates that factors other than habitat type, such as fruiting phenology, might be
more important in determining the abundance of canopy species (Brosset & Charles-Dominique
1990). Trees that are commonly used as food resource by canopy frugivores (e.g. figs) are
relatively low in abundance near Manaus (Nee 1995), which provides further support for this
hypothesis. In contrast, another study in which fig tree density was very high showed an overall
high canopy frugivore abundance, with three canopy species accounting for almost 90% of the
captures (Meyer & Kalko 2008).
Future studies in this area could be improved by locating important fruiting trees for canopy
species and recording their fruiting events. Furthermore, a combined sampling design with
ground-level and canopy-level mist nets may give a more complete picture of the response of the
canopy frugivores (Bernard 2001; Kalko & Handley 2001; Sampaio et al. 2003).
None of the other guilds showed significant differences in capture rates between the different
habitat types. The general low abundance of nectarivorous guild may seem surprising because
most previous studies have shown distinct increases in nectarivorous species such as Glossophaga
soricina and Lonchophylla thomasi in disturbed areas such as forest edges (Delaval and Charles-
Dominique 2006; Meyer & Kalko 2008) and in matrix habitat (Estrada & Coates-Estrada 2002;
Sampaio 2000) compared to interiors. Meyer (2007) even found a more than thousand fold
increase in G. soricina on land-bridge islands compared to mainland in Panamá. Previous studies
at the BDFFP in both continuous forest and matrix habitat in an earlier successional stage
(Bernard 2001; Sampaio 2000) also found low capture rates for the nectarivores, which suggest
38
they are naturally low in abundance in both the undisturbed and altered habitats of our study
area (Estrada & Coates-Estrada 2001; Faria 2006; Willig et al. 2007).
Gleaning animalivorous species are known to be ‘edge-sensitive’ (Meyer et al. 2008) and previous
studies have shown decreased capture rates at forest edges (Meyer & Kalko 2008) and disturbed
habitats (Medellín et al. 2000; Peters et al. 2006) compared to forest interior habitat and have
negatively associated the gleaners to edge-density at the landscape level (Klingbeil & Willig 2009).
In contrast to expectations, an edge effect on the abundance of gleaning animalivores was not
apparent and all but one of the species of this guild was found in edge- and/or matrix habitat.
Possibly, the old secondary forest at our study site is relatively hospitable for the animalivores,
providing a buffering impact on the strength of the edge effect (Didham & Lawton 1999; Kupfer et
al. 2006. For example, the abundance of gleaning animalivores declines markedly in fragments
surrounded by a water-matrix with some species (e.g. Lophostoma silvicolum, Trachops cirrhosus)
even completely disappearing (Meyer & Kalko 2008), whereas the same species persist in
fragments embedded in a secondary forest and may even increase in the matrix habitat (Sampaio
2000). Similar results have been found for birds, for example, Bierregaard & Stouffer (1997) found
that disturbance-sensitive insectivorous birds disappeared quickly after fragmentation of the
BDFFP, but were also amongst the first to return when secondary forest started to develop in the
matrix.
The secondary growth in our matrix habitat was relatively mature, reaching a mean tree height of
7.35(±0.15m) at edges and 7.30(±0.24m) in the matrix compared to 9.26(±0.24m) in the forest
interior. This successional stage of the secondary forest might provide sufficient vegetation clutter
to enable gleaning bats to forage or at least traverse the matrix as to combine resources from
several fragments (Ewers & Didham 2006; Tscharntke et al. 2002). Indeed, studies by Castro-Luna
et al. (2007) and Brobowiec and Gribel (2010) demonstrated that gleaning animalivores of the
sub-family Phyllostominae were lacking in young secondary forest or pasture but persisted in
secondary forest.
Despite the relatively ‘soft’ conditions of the matrix in our study area, I was still able to find an
edge effect on species composition. There did not appear to be a distinct ‘edge-species
community’. Rather species composition was similar in edge- and matrix habitat, but distinct from
interior habitat. Again, this result is probably related to the relative high abundance of frugivorous
species in the edge- and matrix compared to interior habitat. These results somewhat contrast
the findings of Faria (2006) where the edge assemblage was a mere subset of the interior

39
assemblage. This does not seem to be the case in our study area since only five species were
captured exclusively in the interior-habitat, compared to one and four in the edge- and matrix
habitat respectively, with 76% of the species captured in at least two of the habitat-types.
5.2 Area effects
I did not find a significant difference in richness, diversity, evenness or capture rate at the
assemblage level for any of the three habitat types with patch size, nor did patch size influence
the strength of any of the edge effects that were found (i.e. the difference between interior-
compare to edge- or matrix habitat for any of the bat assemblage attributes). This is in contrast to
prior findings in the same research area. Sampaio (2000) found species richness and diversity to
increase with patch size for interior habitats and found lower capture rates in the interiors of 1ha
fragments compared to the interiors of 10ha fragment s (100ha fragments were not sampled).
Struebig et al. (2008) and Cosson et al. (1999) also found significant impacts of patch size on bat
species richness, abundance, and/or species composition in the interiors of fragments embedded
in an agriculture/secondary forest matrix and water matrix respectively and Gorresen & Willig
(2004) found these measures to change with patch size at the landscape level in a system
dominated by pasture and water. Again, these contrasting findings might be related to the more
hostile conditions of the matrix in these other studies compared to mine.
However, at the guild level, gleaning animalivores had higher capture rates in all habitat types in
larger patches compared to smaller patches. Capture rate of the gleaners differed most
pronouncedly with size in the interior habitat, with especially low abundances in the 1ha
fragment. Higher capture rates in the edge- and matrix habitat with increasing patch size may be
explained by ‘spill over’ from interior habitats that hold source populations (Didham 1997; Holt et
al. 1997).
For the capture rate of the gleaners, no edge effect could be discerned, nor could I find the
difference between habitat types to change with patch size. These results suggest that the area
effect is stronger than the edge effect for gleaning animalivores. Edge-sensitivity may be less
pronounced in study systems with a low contrast matrix like ours compared to systems
embedded in water- or pasture (Meyer et al. 2008). In contrast, area sensitivity may remain
because small fragments may not hold sufficient resources (e.g. roosts) and/or may hold
vulnerable small populations that are subject to demographic and genetic stochasticity (Gaggiotti
& Hanski 2004). Vegetation characteristics varied nearly significantly with patch size at this study
area, which may be part of the explanation for the observed pattern because the gleaners have

40
been shown to be negatively impacted by low canopy foliage density, small DBH and low variation
in tree height (Castro-Luna et al. 2007; Cortés-Delgado & Pérez-Torres 2011; Peters et al. 2006).
For example, some gleaners (i.e. Tonatia saurophila) require trees with a minimum DBH of 40cm
for roosting (Kalko et al. 1999).
However, edge effects cannot be completely excluded as mechanism behind the observed
pattern. Edge effects increase disproportionately with size (Laurance & Yensen 1991) and unlike
the larger fragments, the 1ha fragment interiors may have been subject to the effects of multiple
edges (Malcolm 1994). Edge and area effects may thus have played a synergistic role in the 1ha
fragments, which is a common finding in studies that explicitly address the two mechanisms (e.g.
Banks-Leite et al. 2010; Didham 1997; Ewers et al. 2007)
At the species level, R.pumilio seemed to have peak interior-abundances in medium-sized
fragments (10 and 100ha), while edge-, and matrix abundance was consistently higher around
fragments larger than 1ha and in continuous forest (trends were however, not significant). A
distinct response to fragmentation of R. pumilio relative to other shrub frugivores have been
reported before (Faria et al. 2006; Presley et al. 2009). For example, Faria et al. (2006) found that
R.pumilio was more abundant in patches of shade-cacao plantations than forest fragments in a
landscape dominated by primary forest, but represented just 2% of total captures in shade-cacao
plantations set in a more disturbed landscape where their abundance in forest remnants
increased. The abundance of R.pumilio may thus be determined by a complex combination of
patch size and relative abundance of complementary resources from primary forest (e.g. roosts in
palm- and Heleconia leaves) and disturbed matrix (e.g. Piper fruits) (Cosson et al. 1999; Faria
2006).
5.3 Caveats
Edge-related changes in species richness, diversity and evenness have been demonstrated for
organisms such as invertebrates (Didham 1997), butterflies (Brown & Hutchings 1997), small
mammals (Malcolm 1997), birds and bats (Delaval & Charles-Dominique 2006; Meyer & Kalko
2008). However, we did not find species richness, diversity and evenness -to be affected either by
habitat type or by patch size. There is a general inconsistency in the bat literature regarding these
measures (Cunto & Bernard 2012) which is due in part to the fact that they reflect the composite
of numerous variable species responses (Ewers & Didham 2006) but also to the wide variety of
experimental designs and research systems used in the study of bats (Cunto & Bernard 2012). This

41
raises the question whether these measures were truly unrelated to habitat, or if this was just an
artifact of our study limitations, as discussed in the following.
This study was conducted over a short time frame. Despite the fact that we captured a
considerable number of individuals and species (as a comparison Sampaio et al. (2003) captured
90% of the expected species number after 29,950mnh, while we capture 84,2% with less than
1/6th of that capture effort), stochastic events may become more important over a small
timeframe. For example, although not statistically significant, A. obscurus seemed to have highly
elevated capture rates at the edge and in the matrix of the 10ha fragments. However, looking at
the data more closely, 70% of all A.obscurus captures were obtained during merely one night of
sampling at the 10ha edge- and matrix habitat of Porto Alegre. This was a night with unusually
high capture rates (141 captures compared to a mean of 23, edge- and matrix combined) and also
an unusually high proportion of A. obscurus (45% of total captures compared to a mean of 2%).
The underlying cause of this exceptional nights I unknown bur might be related to a fruiting event
of a preferred food tree by this species (e.g. Ficus) (Kalko & Handley 2001). Stochasticities like this
may have a disproportional impact in smaller datasets, which could obscure results or lead to the
detection of spurious patterns (Banks-Leite et al. 2012). Sampling over a long timeframe would
also control for seasonal variation (Banks-Leite et al. 2012), although seasonal impacts are not
apparent for most bat species in this area (Sampaio 2000).
Another possible caveat of this study might be related to the conditions under which
fragmentation has occurred here. It is likely that the low contrast between matrix and forest and
the proximity of vast expanses of primary forest had a mitigating impact on possible edge effects
on bats (Bernard & Fenton 2003; Klingbeil & Willig 2009; Sampaio 2000). Studies that were set in
more hostile matrices of pasture (e.g. Bobrowiec & Gribel 2010; Cortés-Delgado & Pérez-Torres,
2011) or water (Cosson et al. 1999; Meyer & Kalko 2008) have shown different and stronger
responses to disturbance. On the other hand, our results might be more realistic and applicable to
the ‘real world’, considering that 47% of deforested land in the Brazilian Amazon was covered by
secondary regrowth in 1990 (Fearnside 1996) and this proportion has increased ever since
(Wright 2010).
Bearing in mind these limitations, the results that we found are based on a strong experimental
and analytical design using standardized methods that are observer-independent and thus
suitable for replication and possibly extrapolation to other study areas.

42
5.4 Conservation Implications
Species composition differed between the edge- and matrix habitat compared to the interior
habitat. Furthermore, the capture rate of one guild (shrub frugivores) and one species (C.
perspicillata) increased at the edges and in the matrix compared to forest interior, which may
have positive impacts on forest regeneration through the seed dispersal of successional plants
provided by this group (Muscarella & Fleming 2007). However, the proliferation of one guild or
species at the expense of another may lead to ecological distortion that ends in less diverse and
simplified ecosystems (Terborgh et al. 1997). Also, the frugivorous guild clearly masked the
negative impact of decreasing patch size on the capture rate of the animalivorous guild. It is
important that fragmentation studies on bats consider guilds and species individually to avoid
displaying ‘false’ positive results.
From the perspective of the gleaning animalivorous bats, which reacted sensitively to patch size,
conservation efforts should focus on the maintenance of sufficiently large forest remnants, which
are generally considered superior to small reserves for the long-term persistence of area-sensitive
species (Ferraz et al., 2003) because they can retain larger populations (Connor et al. 2000) and
are less encroached by edge effects that may degrade the interior habitat (Laurance et al. 2002).
For example, in Amazonian forest fragments, edge effects such as elevated tree mortality,
reduced canopy height and canopy density may extend several hundreds of meters into the
fragment interior (Laurance 2008; Laurence et al. 2002). This may in turn have detrimental
impacts on roost-site availability for the gleaners that is associated with large trees.
Retaining large forest remnants with a low perimeter: area ratio could also mitigate the amount
of area exposed to edge effects on bats such as the altered species composition and change in
relative abundance that was observed in this study.
Nonetheless, edge and area effects on the bats in our study area can be considered relatively
moderate compared to high-contrast study systems embedded in a water- (Kalko & Meyer 2008)
or pasture matrix (Brobowiec & Gribel 2010). Even in the same study system, the negative
impacts of patch size on species richness, diversity and abundance that were observed 15 years
ago when forest stands were younger and shorter (Sampaio 2000) seem to have faded (although
this should be interpreted with caution because of the larger sampling effort in the previous
study).

43
These findings are most likely related to the mitigating impacts of the relatively mature secondary
forest in the matrix of our study area, which confirms the important role of matrix management in
conservation (Koh & Gazoul 2010; Santos-Barrera & Urbina-Cardona 2011; Watling et al. 2011).
This also sheds a positive light on bat conservation with an eye on current reforestation rates, for
example Wright (2010) reports 21,500km2yr-1 of regenerating forest on abandoned land (~34% of
global deforestation rate) in just 29% of the entire moist tropical forest biome and Brazil is the
country with the highest woody vegetation gain of Latin America (Aide et al. 2012). The ambitious
target of the Brazilian government to reduce deforestation rates with 20% relative to the 1996-
2005 rate by 2020 (Government of Brazil, Presidential decree 2007) has led to an expanded
protected area network (e.g. Amazon Region Protected Areas Program) (Montiel 2004), increased
enforcement of the environmental law and pressure on the cattle- and soy industry which have
contributed to a decline in deforestation rate by 36% in 2009 compared to the 1996-2005
baseline (Nepstad 2009).
However, a recent revision of Brazils’ most important legal framework for conservation ‘the
Forest Code’ (Sparovek et al. 2012) will reduce prior legal requirements for private land owners to
restore native vegetation and may promote extensive deforestation of tropical forests on a
regional scale (Metzger et al. 2010; Sparovek et al. 2011). Such developments would cause habitat
loss and fragmentation to such a degree that bats, as well as many other organisms, may become
severely imperiled (Michalski et al. 2010; Soares-Filho et al. 2006; Wearn et al. 2012).

44
References
Aguirre, L.F., Vargas, A. & Solari, S. (2009) Clave de campo para la identificacion de los murcielagos de Bolivia. Centro de estudios en Biología Teórica y Aplicada. Cochabamba, Bolivia, Impreso en Bolivia por Imprenta ETREUS.
Aide, T.M., Matthew L. C., Grau, H.R., López-Carr, D., Levy, M.A., Redo, D., Bonilla-Moheno, M.,
Riner, G., Andrade-Núñez, M.J. & Muñiz, M. (2012) Deforestation and reforestation of Latin America and the Caribbean (2001-2010) Biotropica, 0(0), 1-10.
Andren, H. & Angelstam, P. (1988) Elevated predation rates as an edge effect in habitat islands:
Experimental evidence. Ecology. 69(2),544-547. Antongiovanni, M. & Metzger, J.P. (2005) Influence of matrix habitats on the occurrence of
insectivorous bird species in Amazonian forest fragments. Biological Conservation, 122, 441–451.
Banks-leite, C., & Cintra, R. (2008) The heterogeneity of amazonian treefall gaps and bird community composition. Ecotropica, 14(1), 1–13.
Banks-Leite, C., Ewers, R. M., & Metzger, J.P. (2010) Edge effects as the principal cause of area
effects on birds in fragmented secondary forest. Oikos, 119(6), 918–926. Banks-leite, C., Ewers, R.M., Pimentel, R.F. & Metzger, J.P. (2012) Decisions on Temporal Sampling
Protocol Influence the Detection of Ecological Patterns. Biotropica, 44(3), 378-385. Bates, D., Maechler, M. & Bolkers, B. (2011) Lme4: Linear mixed-effects models using S4 classes. R
Foundation for Statistical Computing. [online] Vienna. Available from: http://CRAN.R-project.org/package=lme4 [Accessed 27th July 2012].
Baur, B. & Erhardt, A. (1995) Habitat fragmentation and habitat alterations: principal threats to
most animal and plant species. GAIA, 4, 221-226. BDFFP (2012) Mapa: America Arie PDBFF [Online] Available from: hhtp://pdbff.inpa.gov.br/
area3p.htm [Accessed 23th August 2012]. Beck, J., & Schwanghart, W. (2010) Comparing measures of species diversity from incomplete
inventories: an update. Methods in Ecology and Evolution, 1(1), 38–44. Belwood, J. J. (1988) Foraging behavior, prey selection, and echolocation in phyllostomine bats
(Phyllostomidae) In: Nachtigall, P. E. & Moore, P. W. B. (eds.) Animal sonar. New York, USA. Plenum Press, pp. 601–605.
Bernard, E. (2001) Vertical stratification of bat communities in primary forests of central Amazon.
Brazilian Journal of Tropical Ecology, 17: 115–126. Bernard, E., & Fenton, M. B. (2003) Bat Mobility and Roosts in a Fragmented Landscape in Central.
differences, 35(2), 262–277. Bierregaard, R.O., Gascon, C., Lovejoy, T.E. & Mesquita, R. (ed.) (2001) Lessons from Amazonia:
45
Ecology and conservation of a fragmented forest. New Haven, Connecticut, Yale University Press.
Bierregaard, R.O. Jr. & Stouffer, P.C. (1997) Understory birds and dynamic habitat mosaic in
Amzonian rainforest In: Laurance, W.F. & Bierregaard, Jr., R.O. (eds.) Tropical forest remnants: ecology, management, and conservation of fragmented communities, Illinois, USA, University of Chicago Press, pp. 33-44.
Bobrowiec, P. E. D., & Gribel, R. (2010) Effects of different secondary vegetation types on bat community composition in Central Amazonia, Brazil. Animal Conservation, 13(2), 204–216.
Boyle, S.A. & Smith, A.T. (2010) Can landscape and species characteristics predict primate
presence in forest fragments in the Brazilian Amazon? Biological Conservation 143, 1134-1143.
Brose, U. & Martinez, N.D. (2004) Estimating the richness of species with variable mobility. Oikos,
105: 292-300. Brosset, A. & Charles-Dominique, P. (1990) The bats from French Guiana: a taxonomic, faunistic
and ecological approach. Mammalia 54, 509-560. Brosset, A., Charles-Dominique, P., Cockle, A., Cosson, J. & Masson, D. (1996) Bat communities
and deforestation in French Guiana. Canadian Journal of Zoology. 74, 1974–1982. Brown, K.S. & Hutchings, R.W. (1997) Disturbance, fragmentation, and the dynamics of diversity in
Amazonian butterflies. In: Laurance, W.F. & Bierregaard, Jr., R.O. (eds.) Tropical forest remnants: ecology, management, and conservation of fragmented communities, Illinois, USA, University of Chicago Press, pp. 33-44.
Cadenasso, M. L., & Pickett, S. T. A. (2000) Linking forest edge structure to edge function:
mediation of herbivore damage. Journal of Ecology, 88,31–44. Castro-Luna, A. A., Sosa V. J. & Castillo-Campos,G. (2007) Bat diversity and abundance associated
with the degree of secondary succession in a tropical forest mosaic in south-eastern Mexico. Animal Conservation, 10: 219–228.
Chalfoun, A.D., Thompson, F.R. & Ratnaswamy , M.J. (2002) Nest predators and fragmentation: a
review and meta-analysis. Conservation Biology, 16:306-318. Clarke, F.M. Pio, D.V. & Racey, P.A. (2005) A comparison of logging systems and bat diversity in
the Neotropics. Conservation Biology, 19:1194–1204. Collinge, S.K. (1996) Ecological consequences of habitat fragmentation: implications for landscape
architecture and planning. Landscape and Urban Planning, 36:59-77. Connor, E.F., Courtney A. C. & Yoder, J.M. (2000) Individuals-area relationships: the relationship
between animal population density and area. Ecology, 81: 734–748. Cortés-Delgado, N., & Pérez-Torres, J. (2011) Habitat edge context and the distribution of
phyllostomid bats in the Andean forest and anthropogenic matrix in the Central Andes of Colombia. Biodiversity and Conservation, 20(5), 987–999.
46
Cosson, J., Pons,J. & Masson, D. (1999) Effects of forest fragmentation on frugivorous and nectarivorous bats in French Guiana. Journal of Tropical Ecology, 15:515-534.
Crampton, L.H. & Barclay, R.M.R. (1996) Habitat selection by bats in fragmented and
unfragmented aspen mixed wood stands of different ages. Bats and Forests Symposium In: Barclay, R.M.R. & Brigham, R.M. (eds.) Working Paper 23/1996. Victoria, Canada, Research branch, British Columbia Ministry of Forests, pp. 238-259
Crawley, M.J. (ed.)(2007) Statistical modeling. in: The R book. Chichester, United Kingdom, John
Wiley & Sons, pp.323-386. Cunto, G.C. & Bernard, E. (2012) Neotropical bats as indicators of environmental disturbance:
what is the emerging message? Acta Chiropterologica, 14(1), 143–151.
Dale, S., Mork, K., Solvang, R. & Plumptre, A.J. (2000) Edge effects on the understorey bird
community in a logged forest in Uganda. Conservation Biology, 14,265–276. Delaval, M et al. (2005) Interspecific competition and niche partitioning: example of a neotropical
rainforest bat community. Revue d’ecologie-la terre et la vie, 60, 149-165. Delaval, M. & Charles-Dominique, P. (2006) Edge effects on frugivorous and nectarivorous bat
communities in a neotropical primary forest in French Guiana. Revue d’ecologie-la terre et la vie, 61, 343-352.
Delpietro, H. A., Marchevsky, N., & Simonetti, E. (1992) Relative population densities and
predation of the common vampire bat (Desmodus rotundus) in natural and cattle-raising areas in north-east Argentina. Preventive Veterinary Medicine, 14(1-2), 13–20.
Deriche, R. (1993) Recursively implementing the Gaussian and its derivatives. Sophia-Antipolis,
France. Institut National de Recherche en Informatique et en Automatique. Diamond, J.M. (1980) Patchy distribution of tropical birds. In: Soulé, M. and Wilcox, B.A. (eds.)
Conservation Biology: An Evolutionary-ecological Perspective, Sinauer, Sinauer Associates Inc, pp. 57-74.
Didham, R.K. (1997) The influence of edge effects and forest fragmentation on leaf litter
invertebrates in Central Amazonia In: Laurance, W.F. & Bierregaard, Jr., R.O. (eds.) Tropical forest remnants: ecology, management, and conservation of fragmented communities, Illinois, USA, University of Chicago Press, pp. 33-44.
Didham, R.K. et al. (1998) Beetle species responses to tropical forest fragmentation. Ecological
Monographs, 68, 295-303. Didham, R. K. & Ewers, R.M. (2012) Predicting the impacts of edge effects in fragmented habitats:
Laurance and Yensen's core area model revisited. Biological Conservation, 155, 104-110. Didham, R.K. & Lawton, J.H. (1999) Edge structure determines the magnitude of changes in
microclimate and vegetation structure in tropical forest remnants. Biotropica, 31,17-30. Dixon, R.K., Solomon, A. M., Brown, S., Houghton, R.A., Trexier, M.C. & Wisniewski, J. (1994)
Carbon pools and flux of global forest ecosystems. Science, 263, 185-190.

47
Dunning, J.B., Brent, J., Danielson, H. & Ronald P. (1992) Ecological processes that affect
populations in complex landscapes. Oikos, 65(1),169-175. Erickson, J.L. & West, S.D. (2003) Associations of bats with local structure and landscape features
Of forested stands in western Oregon and Washington. Biological Conservation, 109,95- 102.
Estrada, A. & Coates-Estrada, R. (2001) Bat species richness in live fences and in corridors of
residual rain forest vegetation at Los Tuxtlas, Mexico. Ecography, 24,94-102. Estrada, A. & Coates-Estrada, R. (2002) Bats in continuous forest, forest fragments and in an
agricultural mosaic habitat-island at Los Tuxtlas, Mexico. Biological Conservation, 103,237–245.
Estrada, A. R., Coates-Estrada, R. & Meritt Jr.,D. (1993) Bat species richness and abundance in tropical rain forest fragments and in agricultural habitats at Los Tuxtlas, Mexico. Ecography, 16,309-318.
Estrada-villegas, S., Pérez-Torres,J. & Stevenson, P.R. (2010) Ensamblaje de murciélagos en un
bosque subandino colombiano y análisis sobre la dieta de algunas especies. Flora, 17(1), 31–41.
Ethier, K. & Fahrig, L. (2011) Positive effects of forest fragmentation, independent of forest
amount, on bat abundance in eastern Ontario, Canada. Landscape Ecology, 26,865–876. Ewers, R.M. & Didham, R.K. (2006) Confounding factors in the detection of species responses to
habitat fragmentation. Biology Reviews, 81, 117–142. Ewers, R.M. Thorpe, S. & Didham,R.K. (2007). Synergistic interaction between edge and area
effects in a heavily fragmented landscape. Ecology, 88(1), 96-106. Fahrig, L. (2003) Effects if habitat fragmentation on biodiversity. Annual Review of Ecology
Evolution and Systematics, 34, 487–515. Faria, D. (2006) Phyllostomid bats of a fragmented landscape in the north-eastern Atlantic forest,
Brazil. Journal of Tropical Ecology, 22(05), 531. Faria, D., Laps, R.R., Baumgarten,J. & Cetra,M. (2006) Bat and bird assemblages from forests and
shade cacao plantations in two contrasting landscapes in the Atlantic Forest of southern Bahia, Brazil. Biodiversity and Conservation, 15,587–612.
Fearnside, P.M. (1996) Amazonian deforestation and global warming: carbon stocks in vegetation
replacing Brazil’s Amazon forests. Forest ecology and Management, 80,21-34. Fenton, M.B. (1990) The foraging behavior and ecology of animal-eating bats. Canadian Journal of
Zoology, 68,411-422. Fenton, M.B. (1997) Science and the conservation of bats. Journal of Mammalogy, 78,1-14. Fenton, M.B., Acharya, L., Audet,D., Hickey, M.B.C., Merriman, C., Obrist, M.K. & Syme,

48
D.M.(1992) Phyllostomid bats (Chiroptera, Phyllostomidae) as indicators of habitat disruption in the Neotropics. Biotropica, 24,440–446.
Fenton, M.B., Cumming, D.H.M., Rautenbach, I. L., Cumming, G.S., Cumming, M.S., Ford,G.,Taylor,
R.D., Dunlop,J., Hovorka, M.D., Johnston, D.S., Portfors, C.V., Kalcounis, M.C. & Mahlanga, Z. (1998) Bats and the loss of tree canopy in African woodlands. Conservation Biology, 12,399-407.
Ferraz, G., Nichols, J.D., Hines, J.E., Stouffer,P.C., Bierregaard Jr., R.O. & Lovejo y, T.E (2007) A large-scale deforestation experiment: effects of patch area and isolation on Amazonian birds. Science, 315, 238-241.
Ferraz, G., Russell G.J., Stouffer,P.C., Bierregaard, Jr., R.O., Pimm. S.L. & Lovejoy, T.E (2003) Rates
of species loss from Amazonian forest fragments. Proceedings of the National Academy of Sciences U.SA., 100, 14069–14073.
Fleming, T.H. (1982) Foraging strategies of plant-visiting bats. In: Kuntz, T.H. (eds.), Ecology of
Bats, New York, USA, PlenumPress, pp. 287–325. Fleming, T.H. & Heithouse, E.R. (1981) Frugivorous bats, seed shadows, and the structure of
tropical forests. Biotropica, 13,45-53. Fletcher, R.J. & Koford, R.R. (2003) Spatial responses of bobolinks (Dolichonyx oryzivorus) near
different types of edges in northern Iowa. The Auk , 120,799–810. Fowler, H. G., Silva-Carlos, A. & Venticinque, E. (1993) Size, taxonomic and biomass distributions
of flying insects in central Amazonia: forest edges vs. understory. Revista de Biología Tropical, 41,755-760.
Gaggiotti, O. E. & Hanski,I. (2004) Mechanisms of population extinction In: Hanski, I. & Gaggiotti,
O. E. (eds.) Ecology, genetics, and evolution of metapopulations. San Diego, Elsevier Academic Press, pp. 337–366.
Gorresen, P.M. & Willig, M.R. (2004) Landscape responses of bats to habitat fragmentation in
Atlantic forest Paraguay. Journal of Mammalogy, 85(4),688-697. Gotelli, N.J. & Colwell, R.K. (2001) Quantifying biodiversity: procedures and pitfalls in the
measurement and comparison of species richness. Ecology letters, 15, 2126-2136. Gotelli, N.J. & Graves, G.R. (1996) Null models in ecology. Washington, D.C, Smithsonian
Institution Press. Government of Brazil, Presidential decree 6.2631 (2007) National Climate Change Plan,
Government of Brazil, Brasília, 2008. [online] Available from: www.mma.gov.br/estruturas/smcq_ climaticas/arquivos / plano_nacional_ mudanca_clima.pdf [Accessed 19th June 2012].
Grindall, S.D. (1996) Habitat use by bats in fragmented forests. In: Barclay, R.M.R. & Brigham,
R.M. (eds.), Bats and Forests Symposium, Working Paper 23/1996., Victoria, Canada, Ministry of Forests, pp. 260-272.
Grindal, S., & Brigham, R. (1999) Impacts of forest harvesting on habitat use by foraging

49
insectivorous bats at different spatial scales. Ecoscience, 6,25–34. Handley, Jr., C.O., Wilson, D.E. & Gardner, A.L. (eds.) (1991) Demography and natural history of
the common fruit bat Artibeus jamaicensis on Barro Colorado Island, Panamá. Washington D.C., Smithsonian Institution Press.
Hayes, J. P. & Loeb, S. C. (2007) The influences of forest management on bats in North America In:
Lacki, M.J., Hayes, J. P. & Kurta, A. (eds.) Bats in forests: conservation and management, Baltimore,Maryland, Johns Hopkins University Press, pp. 207–235.
Hein,C.D., Castleberry,S.B. & Miller,K.V. (2009) Site-occupancy of bats in relation to forested
corridors. Forest Ecology and Management, 257,1200-1207. Hogberg, L. K., Krista, Patriquin, J. & Barclay, R.M.R. (2002) Use by bats of patches of residual trees
in logged areas of the boreal forest. American Midland Naturalist, 148,282–288.
Holt, R.D. (1997) From metapopulation dynamics to community structure: some consequences of spatial heterogeneity In: I.A. Hanski and M.E. Gilpin (eds.) Metapopulation Biology: ecology, genetics, and evolution. San Diego, California, Academic Press, pp. 149-165.
Holt, R.D., Debinski, D.M., Diffendorfer, J.E., Gaines,M.S., Martinko,E.A., Robinson, G.R. & Ward,
G.C. (1995) Perspective from an experimental study of habitat fragmentation in an agroecosystem In: Glen, D.M., Greaves, M.P. & Anderson, H.M. (eds.) Ecology and integrated farming systems, New York, Wiley, pp. 147-175.
Ingham, D.S. & Samways,M.J. (1996) Application of fragmentation and variegation models to
epigaeic invertebrates in South Africa. Conservation Biology, 10, 1353-1358. INPE (National Institute for Space Research) (2011) Projeto prodes monitoramento da floresta
Amazonica Brasileira por satélite prodes. [online] São José dos Campos, Accessible from: http://www.obt.inpe.br/prodes/ [Accessed 14th June 2012].
Jost, L. (2006) Entropy and diversity. Oikos, 113(2), 363–375. Jules, E.S. & Rathcke, B.J. (1999) Mechanisms of reduced trillium recruitment along edges of old-
growth forest fragments. Conservation Biology, 13:784–93 Kalka, M. B., Smith, A.R. & Kalko, E.K.V. (2008) Bats limit arthropods and herbivory in a tropical
forest. Science, 320,71. Kalko, E.K.V., Castleberry,S.B. & Miller,K.V. (2006) Roost structure, modification, and availability in
the white-throated round-eared bat Lophostoma silvicolum (Phyllostomidae) living in active termite nests. Biotropica, 38,398–404.
Kalko, E.K.V., Friemel, D., Handley, Jr.,C.O. & Schnitzler, H. (1999) Roosting and foraging behavior
of two neotropical gleaning bats, Tonatia silvicola and Trachops cirrhosus (Phyllostomidae). Biotropica, 31,344-353.
Kalko, E.K.V. & Handley, Jr.,C.O. (2001) Neotropical bats in the canopy: diversity, community
structure, and implications for conservation. Plant Ecology, 153, 319–333. Kalko E.K.V., Handley, Jr., C.O. and Handley D. (1996) Organization, diversity, and long-term

50
dynamics of a neotropical bat community. In: Cody M. and Smallwood J. (eds.) Long Term Studies in Vertebrate Communities. New York, Academic Press, pp. 503–551.
Kapos, V., Wandelli, E., Camargo, J.L. & Ganade, G. (1997) Edge-related changes in environment
and plant responses due to forest fragmentation in central Amazonia.In: Laurance, W.F. & Bierregaard, Jr., R.O. (eds.) Tropical forest remnants: ecology, management, and conservation of fragmented communities (eds.), Illinois, USA, University of Chicago Press, pp. 33-44.
King , D.I., Griffin, C.R. & DeGraaf, R.M. (1997) Effect of clearcut borders on distribution and
abundance of forest birds in northern New Hampshire. Wilson Bulletin, 109,239–45. Klingbeil, B. T., & Willig, M. R. (2009) Guild-specific responses of bats to landscape composition
and configuration in fragmented Amazonian rainforest. Journal of Applied Ecology, 203–213.
Koh, L.P. & Ghazoul, J. (2010) A matrix-calibrated species-area model for predicting biodiversity
losses due to land-use change. Conservation Biology, 24,994-1001. Koh, L. P., Lee, T. M., Sodhi, N. S. & Ghazoul, J. (2010) An overhaul of the species-area approach
for predicting biodiversity loss: incorporating matrix and edge effects. Journal of Applied Ecology, 47(5), 1063–1070.
Kunz, T.H., Braun de Torrez, E., Bauer, D., Lovoba,T. & Fleming, T.H. (2011) Ecosystem services
provided by bats. Annals of the New York academy of sciences, 1233, 1-38. Kunz, T.H. & Brock, C.E. (1975) A comparison of mist nets and ultrasonic detectors for monitoring
flight activity of bats. Journal of Mammalogy, 56: 907-911. Kunz, T.H. & Fenton, M.B. (eds.) (2006) Bat ecology. Chicago, The University of Chicago Press. Kunz, T.H. and Kurta, A. (1988) Capture methods and holding devices. In: Kunz,T.H. (eds.)
Ecological and behavioral methods for the study of bats, Washington D.C., Smithsonian Institution Press, pp. 1-29.
Kunz, T.H. & Lumdsen, L.F. (2003) Ecology of cavity and foliage roosting bats In: Kunz T. & Fenton
M.B. (eds.) Bat ecology. Chicago, The University of Chicago Press, pp. 3-89. Kunz, T.H.& Parsons, S. (2009) Ecological and behavioral methods for the study of bats, 2nd edition,
Baltimore, Maryland, Johns Hopkins University Press.
Kusch, J. C., Weber, C., Idelberger, S. & Koob, T. (2004) Foraging habitat preferences of bats in relation to food supply and spatial vegetation structures in a western European low mountain range forest. Folia Zoology, 53,113–128.
Larsen, R., Boegler, K., & Genoways, H. (2007) Mist netting bias, species accumulation curves, and
the rediscovery of two bats on Montserrat (Lesser Antilles) Acta, 9(2), 423–435. Laurance, W.F. (1991) Edge effects in tropical forest fragments: application of a model for the design
of nature reserves. Biological Conservation, 57,205-219.

51
Laurance, W.F. (2004) Responses of understory rain forest birds to road edges in central Amazonia. Ecological Applications, 14,1344-1357.
Laurance, W. F. (2008) Theory meets reality: How habitat fragmentation research has
transcended island biogeographic theory. Biological Conservation, 141(7), 1731–1744. Laurance, W.F. & Bierregaard, Jr., R.O. (1996) Fragmented tropical forests. Bulletin of the
Ecological Society of America, 77,34-36. Laurance, W.F. & Bierregaard, Jr., R.O. (Eds.) (1997) Tropical forest remnants: Ecology,
management, and conservation of fragmented communities, Chicago, University of Chicago Press.
Laurance, W. F., Laurance, S. G., & Hilbert, D. W. (2008) Long-term dynamics of a fragmented rainforest mammal assemblage. Conservation biology: the journal of the Society for Conservation Biology, 22(5), 1154–64.
Laurance, W.F. , Pérez-Salicrup, D., Delamônica, P., Fearnside, P.M., D’angelo, S., Jerozolinski, A.,
Pohl, L. & Lovejoy, T.E. (2001) Rain forest fragmentation and the structure of Amazonian liana communities. Ecology, 82,105-116.
Laurance, W.F. Thomas E. Lovejoy, Vasconcelos, H.L., Bruna, E.M., Didham,R.K., Stouffer, P.C.,
Gascon, C., Bierregaard, Jr., R.O., Laurance, S.G. & Sampaio, E. (2002) Ecosystem decay of Amazonian forest fragments: a 22-year investigation. Conservation Biology, 16, 605-618.
Laurance, W. F. & Yensen, E. (1991) Predicting the Impacts of Edge Effects in Fragmented
Habitats. Biological Conservation, 55, 77–92. Law, B. & Chidel, M. (2002) Tracks and riparian zones facilitate the use of Australian regrowth
forest by insectivorous bats. Journal of Applied Ecology, 39,605–617. Law, B.S. & Dickman, C.R. (1998) The use of habitat mosaics by terrestrial vertebrate fauna:
implications for conservation and management. Biodiversity Conservation, 7(3),323-333. Legendre,P. & Legendre, L. (1998). Ordination in reduced space In: Legendre,P. & Legendre, L.
(eds.) Numerical Ecology, pp. 378-480. Lesinkski, G., Olszewski, D. & Popczyk, B. (2011) Forest roads used by commuting and foraging
bats in edge and interior zones. Polish journal of ecology, 59(3),611-616. Lim, B.K. & Engstrom, B.D. (2001) Species diversity of bats (Mammalia: Chiroptera) in Iwokrama
Forest, Guyana, and the Guianan subregion: implications for conservation. Biodiversity and Conservation, 10,613-657.
Lovejoy, T.E. & Bierregaard,Jr., R.O. (1990) Central Amazonian forests and the minimum critical
size of ecosystem project In: Gentry A.H. (eds.) Neotropical bats rainforests, New Haven, Connecticut, USA, Yale University Press, pp. 60-71.
MacArthur, R.H. & Wilson, E.O. (1967) The theory of Island Biogeography, New Jersey, Princeton
University Press.

52
Magura, T. (2002) Carabids and forest edge: spatial patterns and edge effect. Forest Ecology and Management, 157,23-37.
Magurran, A.E. (2004) Measuring biological diversity. Oxford, United Kingdom, Blackwell
Publishing. Malcolm, J.R. (1994) Edge effects of central Amazonian forest fragments. Ecology, 75,2438-2445. Malcolm, J.R. (1997) Biomass and diversity of small mammals in Amazonian forest fragments In:
Laurance, W.F. & Bierregaard, Jr., R.O. (eds.) Tropical forest remnants: ecology, management, and conservation of fragmented communities, Illinois, USA, University of Chicago Press, pp. 33-44.
Matlack, G. R. (1994) Vegetation dynamics of the forest edge: trends in space and successional
time. Journal of Ecology, 82,113-123. MEA, Millennium Ecosystem Assessment (2005) Ecosystems and human well-being: biodiversity
synthesis, Washington, DC., World Resources Institute. Medellín R.A., Arita, H.T. & Sánchez, O. H. (1997) Identificación de los murcíelagos de México,
Clave de campo. Ciudad Universitaria, D.F, México, Asociación Mexicana de Mastozoología, pp. 83.
Medellín R.A., Equihua, M. & Almin, M.A. (2000) Bat diversity and abundance as indicators of
disturbance in Neotropical rainforests. Conservation Biology, 14,1666–1675. Mesquita, R. C. G., Ickes, K., Ganade, G., & Williamson, G. B. (2001) Alternative successional
pathwaysin the Amazon Basin. Journal of Ecology, 89(4), 528–537. Metzger, J.P. , Lewinshohn, T.M., Joly, C.A., Verdada, L.M., Martinelli,L.A. & Rodrigues, R.R. (2010)
Brazilian Law: full speed in reverse? Science, 329,276–277. Meyer, C.F.J. (2007) Effects of rainforest fragmentation on neotropical bats. Land-bridge islands as
a model system, Dissertation Univesität Ulm. [Online] Frankfurt am Main, Available from: http://vts.uni-ulm.de/docs/2007/5930/vts_5930_7936.pdf#page=87 [Accessed: 27th August 2012].
Meyer, C.F.J. , Frund,J., Lizano, W.P. & Kalko, E.K.V. (2008) Ecological correlates of vulnerability to
fragmentation in Neotropical bats. Journal of Applied Ecology, 45, 381-391. Meyer, C.F.J. & Kalko, E.K.V. (2008) Assemblage-level repsonses of phyllostomid bats to tropical
forest fragmentation: land-bridge islands as a model system. Journal of Biogeography, 35,1711-1726.
Meyer, C. F. J., & Kalko, E. K. V. (2008) Assemblage-level responses of phyllostomid bats to tropical
forest fragmentation: land-bridge islands as a model system. Journal of Biogeography, 35(9), 1711–1726.
Michalski, F. Norris D & Peres CA (2010) No return from biodiversity loss. Science, 329, 1282–
1282. Montiel, F. (2004) Programa Areas Protegidas da Amazônia—ARPA, resumo executivo. [Online]
53
Available from: http://www.mma.gov.br/port/sca/ppg7/doc/arpareex.pdf [Accessed 14th August 2012] .
Morris, A. D., Miller, D. A., & Kalcounis-Rueppell, M. C. (2010) Use of Forest Edges by Bats in a
Managed Pine Forest Landscape. Journal of Wildlife Management, 74(1), 26–34 Morrison, E.B. & Lindell, C.A. (2012) Birds and bats reduce insect biomass and leaf damage in
tropical forest restoration sites. Ecological applications, 22(5),1526-1534. Murcia, C. (1995) Edge effect in fragmented forests: implications for conservation. TREE,10 (2),
58-62. Muscarella, R. & Fleming, T.H. (2007) The role of frugivorous bats in tropical forest succession.
Biological Reviews, 82,573-590. Myers, N. (1992) The primary source: Tropical forests and our future. New York, Norton. Naskrecki, P. (2008) A survey of katydids (Insecta: Orthoptera:Tettigoniidae) of Ajenjua Bepo and
Mamang River Forest Reserves, Eastern Region of Ghana In: McCullough, J., Hoke, P. (eds.) A Rapid Biological Assessment of the Ajenjua Bepo and Mamang River Forest Reserves, Ghana, Arlington, Conservation International, pp. 34-39.
Nee, M. (1995) Flora preliminar do projeto Dinâmica Biológica de Fragmentos Florestais (PDBFPP).
Manaus, New York Botanical Garden and INPA/Smithsonian Projeto Dinâmica Biológica de Fragmentos Florestais.
Nepstad, D., Soares-Filho, B.S., Merry,F., Lima, A., Moutinho,P., Carter, J., Bowman, M., Cattaneo, A., Rodrigues, H., Schawrtzman,S., McGrath, D.G., Stickler, C.M., Lubowski, R., Piris-Cabezas, P., Rivero, S., Alencar, A., Almeida, O. & Stella, O. (2009) The End of Deforestation in the Brazilian Amazon. Science, 326, 1350-1351.
Neuweiler G. (1990) Auditory adaptations for prey capture in echolocating bats. Physiological
Reviews, 70, 615–641. Norberg, U.M. & Rayner, J.M.V. (1987) Ecological morphology and flight in bats (Mammalia;
Chiroptera): wing adaptations, flight performance, foraging strategy and echolocation. Philosophical Transactions of the Royal Society, Series B, 316, 335–427.
Numa, C., Verdú, J.R. & Sánchez-Palomino,P.(2005) Phyllostomid bat diversity in a variegated
coffee landscape. Biological Conservation, 122, 151-158. O’Farrel, M.J. and Gannon, W.L. (1999) A comparison of acoustic versus capture techniques for
the inventory of bats. Journal of Mammalogy, 80,24-30. O’Keefe J.M., Joy M., Loeb, S. C., Lanham, J.D. & Hill, H.S. (2009) Macrohabitat factors affect day
roost selection by eastern red bats and eastern pipistrelles in the southern Appalachian Mountains, USA. Forest Ecology and Management, 257(8), 1757–1763.
Oksanen, J. F. , Blanchet G., Kindt,R., Legendre,P., Minchin, P.R., O'Hara,R.B., Simpson, G.L.,
Solymos,P., Stevens,M.H.H. & Wagner,H. (2011) Vegan: community ecology package. R

54
package version 2.0-2. R Foundation for Statistical Computing. [Online] Vienna, Austria, Available from: http://CRAN.R-project.org/package=vegan [Accessed: 24th July 2012].
Palmeirim, J. M., & Ermridge, K. (1985) The influence of man-made trails on foraging by tropical
frugivorous bats. Biotropica, 17, 82-83. Patriquin K.J. & Barclay, R.M.R. (2003) Foraging by bats in cleared, thinned and unharvested
boreal forest. Journal of Applied Ecology, 40(4),646–657. Pearman, P.B. (2012) The scale of community structure: habitat variation and avian guilds in
Tropical forest understory. Ecological Monographs, 72(1), pp.19-39. Pereira, M.J.R., Marques, J.T. & Palmeirim, J.M. (2010) Vertical stratification of bat assemblages in
flooded and unflooded Amazonian forests. Current Zoology, 56 (4), 469−478. Peters, S.L., Malcolm, J.R. & Zimmerman, B.L. (2006) Effects of selective logging on bat
communities in the Southeastern Amazon. Conservation Biology, 5,1410-1421. Pielou, E. (1975) Ecological diversity. New York, Wiley. Pimm, S.L. (2001) The world according to Pimm: A scientist audits the earth. New York, McGraw-
Hill. Pinto, N. & Keitt, T.H. (2008) Scale-dependent responses to forest cover displayed by frugivore
bats. Oikos, 117, 1725–1731. Presley, S.J., Willig, M.R., Castro-Arellano, I. & Weaver, S.C. (2009) Effects of habitat conversion on
activity patterns of phyllostomid bats in lowland Amazonian rainforest. Journal of Mammalogy, 90(1),210–221.
Prevedello, J.A. (2012) Rethinking edge effects: the unaccounted role of geometric constraints.
Ecography, 35, 001–013. Prugh, L. R., Hodges, K. E., Sinclair, A. R. E., & Brashares, J. S. (2008) Effect of habitat area and
isolation on fragmented animal populations. Proceedings of the National Academy of Sciences of the United States of America, 105(52), 20770–20775.
Raman, T.R.S. & Sukumar, R., (2002) Responses of tropical rainforest birds to abandoned
plantations, edges and logged forest in the Western Ghats, India. Animal Conservation, 5(3), 201-216.
R Development Core Team (2011) R: A Language and Environment for Statistical Computing. R
Foundation for Statistical Computing. [Online] Vienna, Austria, Available from:http://www.R-project.org/ [Accessed at: 19th July 2012].
Remer, L.C. & Heard, S.B. (1998) Local movement and edge effects on competition and
coexistence in ephemeral-patch models. American Naturalist, 152, 896-904. Restrepo, C. & Gomez, N. (1998) Responses of understorey birds to anthropogenic edges in a
neotropical montane forest. Ecological Applications, 8, 170–183. Restrepo, C., Gomez, N. & Heredia,S. (1999) Anthropogenic edges, treefall gaps and fruit-frugivore

55
interactions in a Neotropical montane forest. Ecology, 80, 668–685. Rex, K., Michener,R., Kunz, T.H. & Voigt,C.C. (2011) Vertical stratification of Neotropical leaf-
nosed bats (Chiroptera: Phyllostomidae) revealed by stable carbon isotopes. Journal of Tropical Ecology, 27:211–222.
Ricketts, T. H. (2012) The Matrix Matters: Effective Isolation in Fragmented Landscapes. Matrix,
158(1), 87–99. Ries, L., Fletcher, R. J., Battin, J., & Sisk, T. D. (2004) Ecological responses to habitat edges:
Mechanisms, Models, and Variability Explained. Annual Review of Ecology, Evolution, and Systematics, 35(1), 491–522.
Rogers, D. S., Belk, M. C., González, M. W., Coleman, B. L., Biology, I., Bean, M. L., & Science, L.
(2006) Patterns of habitat use by bats along riparian corridor in Northern Utah. Southwestern Association of Naturalists, 51(1), 52–58.
Sampaio, E.(2000) Effects of the forest fragmentation on the diversity and abundance patterns of
central Amazonian bats. Berlin, Logos Verlag. Sampaio, E., Kalko, E.K.V., Bernard, R., Rodríguez-Herrera, B. & Handley Jr., C.O. (2003) A
biodiversity assessment of bats (Chiroptera) in a tropical lowland rainforest of Central Amazonia, including methodological and conservation considerations. Studies on neotropical Fauna and Environment, 38(1),17-31.
Santos-Barrera, G. & Urbina-Cardona, J.N. (2011) The role of the matrix-edge dynamics of
amphibian conservation in tropical montane fragmented landscapes. Revista Mexicana de Biodiversidad, 82:679–687.
Scariot, A. (1999) Forest fragmentation effects on diversity of the palm community in central
Amazonia. Journal of Ecology, 87,66-76. Schemske, D.W. & Brokaw, N. (2004) Treefalls and the Distribution of Understory Birds in a
Tropical Forest. Ecology, 62(4), 938-945. Schmiegelow, F.K.A., Machtans, C.S. & Hannon,S.J. (1997) Are boreal birds resilient to forest
fragmentation? An experimental study of short-term community responses. Ecology, 78(6), 1914-1932.
Schnitzer, S. A, & Bongers, F. (2011) Increasing liana abundance and biomass in tropical forests: emerging patterns and putative mechanisms. Ecology letters, 14(4), 397–406.
Schnitzler, H.U. & Kalko, E.K.V. (2001) Echolocation by insect-eating bats. BioScience, 51, 557-569. Schulze ,M.D., Seavy,N.D. & Whitacre, D.F. (2000) A comparison of the phyllostomid bat
assemblages in undisturbed Neotropical forest and in forest fragments of a slash-and-burn farming mosaic in Peten, Guatemala. Biotropica, 32,174–184.
Skole, D. & Tucker, C.J. (1993) Tropical deforestation and habitat fragmentation in the Amazon:
Satellite data from 1978 to 1988. Science, 260, 1905-1910. Soares-Filho, B.S., Nepstad,D.C., Curran, L.M., Cerqueira, G.C., Garcia,R.A., Ramos,C.V., Voll,E,

56
McDonald,A., Lefebvre,P. & Schlesinger,P. (2006) Modelling conservation in the Amazon bazin. Nature, 440,520-523.
Sparovek, G. et al. (2011) A revisão do Código Florestal brasileiro. Novos Estudos – CEBRAP, 89,
111–135. Sparovek, G., Berndes, G., Barretto, A. G. D. O. P., & Klug, I. L. F. (2012) The revision of the
Brazilian Forest Act: increased deforestation or a historic step towards balancing agricultural development and nature conservation? Environmental Science & Policy, 16, 65–72.
Stouffer, P.C. & Bierregaard,Jr., R.O. (1995) Effects of forest fragmentation on understory
hummingbirds in Amazonian Brazil. Conservation Biology, 9,1085-1094. Struebig, M.J., Kingston, T., Zubaidc,A. Mohd-Adnanc,A. & Rossitera, S.J. (2008) Conservation
value of forest fragments to Palaeotropical bats. Biological Conservation 141, 2112–2126. Tabachnick B.G. & Fidell, L.S.(2007) Using Multivariate Statistics. Boston, Pearson/Allyn & Bacon. Terborgh, J., L. Lopez, J. Tello, D. Yu, and A. R. Bruni. 1997. Transitory states in relaxing
ecosystems of land bridge islands. In: Laurance, W.F. & Bierregaard, Jr., R.O. (eds.) Tropical forest remnants: ecology, management, and conservation of fragmented communities, Illinois, USA, University of Chicago Press, pp. 33-44.
Thies, W. & Kalko, E.K.V. (2004) Phenology of Neotropical pepper plants (Piperaceae) and their
association with their main dispersers, two short-tailed fruit bats, Carollia perspicillata and C. castanea (Phyllostomidae) Oikos, 104, 362-376.
Tscharntke, T., Steffan-Dewenter,I., Kruess, A. & Thies, C. (2002) Contributions of small habitat
fragments to conservation of insect communities of grassland-cropland landscapes. Ecological Applications, 12, 354-363.
Verboom,B. & Spoelstra, K. (1999) Effects of food abundance andwind on the use of tree lines by
an insectivorous bat. Canadian Journal of Zoology, 77,1393–1401. Voss, R.S. & Emmons, L.H. (1996) Mammalian diversity in Neotropical lowland rainforests: a
preliminary assessment. Bulletin American Museum of Natural History, 230, 1-115. Walsh, A.L., Barclay, R.M.R. & McCracken, G.F. (2004) Designing bat activity surveys for inventory
and monitoring studies at local and regional scales In: Brigham, R.M., Kalko, E.K.V., Jones, G, Parsons,S. & Limpens, G.A. (eds.) Bat echolocation research: tools, techniques and analysis. Austin, Bat Conservation International, pp, 157-165.
Watling, J.I. & Donnelly, M.A. (2006) Fragments as islands: A synthesis of faunal responses to
habitat patchiness. Conservation Biology, 20,1 016-1025. Watling, J. I., Nowakowski, A.J., Donnely,M.A. & Orrock, J.L. (2011) Meta-analysis reveals the
importance of matrix composition for animals in fragmented habitat. Global Ecology and Biogeography, 20, 209-217.
Watson, J.E.M., Whittaker, R.J. & Dawson, T.P. (2004) Habitat structure and proximity to forest
57
edge affect the abundance and distribution of forest-dependent birds in tropical coastal
forests of southeastern Madagascar. Biological Conservation, 120(3), 311-327. Wearn O.R., Reuman, D.C. & Ewers,R.M. (2012) Extinction debt and windows of conservation
opportunity in the Brazilian Amazon. Science, 337,228-231.
Willig, M.R., Presley,S.J., Bloch, C.P., Hice, C.L., Yanoviak, S.P., Díaz,M.M.,Chauca, L.A., Pacheco,V.
& Weaver, S.C. (2007) Phyllostomid bats of lowland Amazonia: effects of habitat
alteration on abundance. Biotropica, 39, 737–746. Wilson, D. E, Ascorra, C.F. & Solari, S.T. (1996) Bats as indicators of habitat disturbance In:
Wilson,D.E. & Sandoval,A. (eds.) Manu, the biodiversity of southeastern Peru. Washington, D.C., Smithsonian Institution Press, pp. 613-625.
Wolcott K.A. & Vulinec, K. (2012) Bat Activity at Woodland/Farmland Interfaces in Central Delaware. Northeastern naturalist, 19(1),87–98. Wolf, M. & Batzli, G.O. (2001) Increased prevalence of botflies (Cuterebra fontinella)on white-
footed mice (Peromyscus leucopus) near forest edges. Canadian Journal of Zoology, 79,106–9.
Wright, S. J. (2010) The future of tropical forests. Annals of the New York Academy of Sciences,
1195, 1–27.
Youngentob, K. N. Yoon,H, Coggan, N. & Lindenmayer, D.B. (2012) Edge effects influence
competition dynamics: A case study of four sympatric arboreal marsupials. Biological
Conservation, 155, 68-76. Zealand, N., & Museum, A. (2007) Synergistic interactions between edge an area effects in a
heavily fragmented landscape. America, 88(1), 96–106.

58
Appendix 1 Bat Inventory
Guild* Individuals captured Interior Edge Matrix
Phyllostomidae
Carolliinae
Carollia perspicillata FR SH 655 6.57 16.52 17.60
Carollia sp. (benkeithi/brevicauda) FR SH 69 0.61 1.66 2.09
Rhinophylla fischerae FR SH 1 0.00 0.00 0.07
Rhinophylla pumilio FR SH 151 1.91 3.39 3.68
Desmodontinae
Desmodus rotundus SAN 1 0.04 0.00 0.00
Glossophaginae
Anoura caudifera NEC 2 0.04 0.07 0.00
Choeroniscus minor NEC 3 0.11 0.00 0.00
Glossophaga soricina NEC 2 0.07 0.00 0.00
Lonchophylla thomasi ANI 4 0.11 0.07 0.00
Phyllostominae
Glyphonycteris daviesi ANI 2 0.04 0.00 0.07
Lophostoma schulzi ANI 4 0.04 0.07 0.14
Lophostoma silvicolum ANI 25 0.29 0.72 0.51
Lampronycteris brachyotis ANI 1 0.04 0.00 0.00
Micronycteris nicefori ANI 1 0.04 0.00 0.00
Mimon crenulatum ANI 26 0.22 0.87 0.58
Phylloderma stenops FR - 3 0.00 0.07 0.14
Phyllostomus discolor ANI 4 0.04 0.14 0.07
Phyllostomus elongatus ANI 7 0.18 0.07 0.07
Phyllostomus hastatus ANI 2 0.04 0.07 0.00
Tonatia saurophila ANI 18 0.58 0.07 0.07
Trachops cirrhosus ANI 31 0.72 0.14 0.65
Trinycteris nicefori ANI 5 0.08 0.07 0.14
Stenodermatinae
Artibeus cinereus FR CN 9 0.00 0.29 0.36
Artibeus concolor FR CN 23 0.07 0.79 0.72
Artibeus gnomus FR CN 14 0.07 0.43 0.43
Artibeus lituratus FR CN 16 0.18 0.07 0.72
Artibeus obscurus FR OPP 92 0.54 2.31 3.25
Artibeus planirostris FR OPP 6 0.18 0.00 0.07
Mesophylla macconnelli FR SH 4 0.14 0.00 0.00
Platyrrhinus helleri FR OPP 1 0.00 0.00 0.07
Sturnira tildae FR - 11 0.00 0.07 0.72
Uroderma bilobatum FR CN 1 0.00 0.00 0.07
Vampyressa bidens FR CN 2 0.00 0.00 0.14
Vampyressa brocki FR CN 2 0.04 0.07 0.00
Vampyressa pussilla FR - 1 0.00 0.07 0.00
Mormoopidae
Pteronotus parnellii INS 67 0.87 1.52 1.59
Total 1266 13.82 29.65 34.05
* Gui lds : ANI, gleaning animal ivores ; FR CN, canopy frugivores ; FR OPP, opportunis tic frugivores ; FR SH, shrub-
frugivores ; INS, aereal insectivores , NEC, nectarivores , SAN:sanguivores .
Capture Rate (Individuals/100mnh)


![Neotropical cervidology_12[1]](https://img.dokumen.tips/doc/110x75/547f4ab5b37959a22b8b56e0/neotropical-cervidology121.jpg)
