Embed Size (px)
Citation preview

PHENOL AND CRESOL
Method no.: 32
Matrix: Air
Target concentration: 19 mg/m3 (5 ppm) for phenol(PEL) 22 mg/m3 (5 ppm) for cresol (all isomers)
Procedure: The analytes are collected on an XAD-7 sampling tube and desorbed withmethanol. The analysis is performed by HPLC with ultraviolet (UV)detection at 218 nm.
Recommended air volumeand sampling rate: 24 L and 0.1 L/min
Reliable quantitation limit: 0.041 mg/m3 (0.01 ppm) phenol0.046 mg/m3 (0.01 ppm) cresol
Standard error of estimatefor ambient storagesamples: 5.47% for phenol(Figures 4.8.1, 4.8.3) 5.41% for cresol
Status of method: A sampling and analytical method which has been subjected to theestablished evaluation procedures of the Organic Methods EvaluationBranch.
Date: November 1981 Chemist: Kevin CumminsFebruary 2001 (Modified)
Organic Methods Evaluation BranchOSHA Analytical Laboratory
Salt Lake City, Utah
1 of 19
1. General Discussion
1.1 Background
1.1.1 History
The analysis of phenol and cresol, like many chemicals in use for a long period of time, hasevolved from a number of nonspecific colorimetric methods to more selective separationtechniques using gas chromatography (GC) or high performance liquid chromatography(HPLC) (Refs. 5.1-5.3). The analytical procedure presented in this method uses reversephase HPLC with ultraviolet (UV) detection at 218 nm, since the unresolved cresol isomersrespond equally at this wavelength. An alternate gas chromatographic method using flameionization detection is also quite satisfactory. Although the GC method is less sensitivethan the liquid chromatographic method, it does provide better resolution of the cresolisomers.
Air sampling and analytical methods for phenol and cresol developed by NIOSH have beenin use for several years. The NIOSH phenol method uses an aqueous bubbler to collectvapors, whereas cresol vapors are collected on a silica gel tube. Both of these methodsutilize gas chromatography with flame ionization detection for analysis (Refs. 5.3 and 5.4). Recently a very sensitive method for detecting phenol in air has been developed byKuwata, et al. (Ref. 5.5). This method uses a 0.1 N NaOH bubbler solution to collect thephenol vapors followed by derivatization with p-nitrobenzenediazonium tetrafluoroborateand analysis by HPLC. Although the aqueous bubbler has been shown to be an effectivesampling device for collecting phenol in air, in an effort to simplify procedures for thedetermination of both analytes, a combined sampling and analytical method using solidsorbent tubes was investigated. The results of breakthrough studies of a variety of sorbentmaterials indicated that a number of resins could potentially be used for monitoring workerexposure to phenol and cresol. XAD-7, a high surface area acrylic ester polymer, and thePoraPak R, S, and T resins all demonstrated high capacities for the analytes and largebreakthrough air volumes. Lower breakthrough air volumes and capacities were observedfor XAD-8, a lower surface area acrylic ester polymer, and for XAD-4, a high surface areastyrene-divinylbenzene resin. Tenax and silica gel sampling tubes were the least effectivesampling devices evaluated. All of these sorbent materials, with the possible exception ofsilica gel, exhibited a higher capacity for cresol than for phenol. XAD-7 was selected asthe sampling medium for both of the analytes because of its effectiveness in sampling acombined atmosphere of phenol and cresol, and because it presents only minimalsampling and analytical problems.
1.1.2 Toxic effects (This section is for information only and should not be taken as the basis ofOSHA policy)
A number of cases of overexposure to phenol or cresol are reported in the literature. Bothcompounds are rapidly absorbed through the skin and can cause skin and eye burns uponcontact. Comas, convulsions, cyanosis and death can result from overexposure to eithercompound. The ingestion of 15 g of phenol produced death in a 19 year old woman within20 h. Internally, cresol and phenol affect the liver, kidneys, lungs, and vascular system. There is some indication that cresol may be more toxic than phenol when inhaled. Respiratory irritation in 8 of 10 human subjects exposed to 6 mg/m3 of o-cresol vapor hasbeen observed. Mice exposed to 22 to 76 mg/m3 of o-cresol for 2 h/day, six days a weekfor a period of one month exhibited signs of lethargy and irritability. Central nervoussystem damage, lung hemorrhages, inflamed airways, and degeneration of myocardialfibers were observed upon autopsy. In contrast no pathological or clinical differencesbetween controls and the study group were observed when monkeys, rats, and mice wereexposed to 19 mg/m3 of phenol for a month over an 8-h day, five days a week period. Noevidence exists to indicate that either phenol or the cresols have any carcinogenic potential. Because of the adverse effects observed for inhaled cresol, NIOSH recommends loweringthe time weighted average (TWA) standard to 10 mg/m3. NIOSH recommends a 20-mg/m3
TWA standard and a 15-min ceiling value of 60 mg/m3 for phenol (Refs. 5.6 and 5.7).
1.1.3 Workplace exposure
Phenol is used to make phenolic resins, caprolactam, bisphenol A and alkyl phenols. In1972, 1.23 million tons of phenol were produced in the U.S. primarily from syntheticprocesses. An estimated 10,000 employees are potentially exposed to phenol. This doesnot include possible worker exposure to products containing phenol (Ref. 5.6).
2 of 19

The majority of the cresols are derived from petroleum or coal tar acids. In 1975, 151million tons of cresol and cresylic acids were produced in the U.S. Cresol is used to makephenolic resins, tricresyl phosphate, disinfectants, and antioxidants. o-Cresol is largelyused to make the herbicides dinitro-o-cresol (DNOC) and 2-methyl-4-chloro-phenoxyaceticacid (MCPA). NIOSH estimates that 11,000 workers are potentially exposed to cresols. This estimate does not include intermittent exposures of workers to cresol containingproducts. (Refs. 5.1 and 5.7)
1.1.4 Physical properties (Refs. 5.6 and 5.7)
phenolmolecular weight: 94.11melting point: 40 - 41ECboiling point: 181.75ECvapor pressure: 0.35 mm Hg (25EC)specific gravity: 1.071 (25EC)flash point: 85EC (open cup), 79EC (closed cup)odor threshold: 3.8 mg/m3
Soluble in water, ether, alcohol and benzene. Colorless to light pink solid.
cresol (ortho-, meta-, and para-isomers)o-cresol m-cresol p-cresol
MW: 108.13 108.13 108.13mp: 30.9EC 12.0EC 34.8ECbp: 191.0EC 202.7EC 201.9ECvp(25EC): 0.25 mm Hg 0.15 mm Hg 0.11 mm Hgsp gr(20EC): 1.048 1.034 1.35flash pt: (closed cup) 81.1EC 86.1EC 86.1ECodor threshold: 0.0028 mg/m3 0.034 mg/m3 0.0021 mg/m3
Soluble in water, alcohol, ether, pet. ether and benzene.
1.2 Limit defining parameters (The analyte air concentrations listed throughout this method are basedon an air volume of 24 L and a solvent desorption volume of 2 mL. Air concentrations listed in ppmare referenced to 25EC and 760 mm Hg.)
1.2.1 Detection limit of the analytical procedure
The detection limit of the analytical procedure is 12 ng for phenol and 14 ng for cresol perinjection. This is the amount of analyte which will give a peak whose height is 5 times theheight of the baseline noise. (Section 4.1)
1.2.2 Detection limit of the overall procedure
The detection limit of the overall procedure is 0.97 µg per sample (0.041 mg/m3 or 0.01ppm) for phenol and 1.1 µg per sample (0.046 mg/m3 or 0.01 ppm) for cresol. This is theamount of analyte spiked on the sampling device which allows recovery of an amount ofanalyte equivalent to the detection limit of the analytical procedure.(Section 4.2)
1.2.3 Reliable quantitation limit
The reliable quantitation limit is 0.97 µg per sample (0.041 mg/m3 or 0.01 ppm) for phenoland 1.1 µg per sample (0.046 mg/m3 or 0.01 ppm) for cresol. This is the smallest amountof analyte which can be quantitated within the requirements of 75% recovery and 95%confidence limits of ±25%. (Section 4.3)
1.2.4 Sensitivity
The sensitivity of the analytical procedure over a concentration range representing 0.5 to2 times the target concentration based on the recommended air volume is 14,777 areaunits/(µg/mL) for phenol and 13,756 area units/(µg/mL) for cresol. The sensitivity isdetermined from the slope of the calibration curve. The sensitivity may vary withinstruments or instrumental conditions. (Section 4.5)
1.2.5 Recovery
3 of 19

The recovery of the analyte from the collection medium during storage must be 75% orgreater. The recovery of phenol and cresol samples stored at ambient conditions for 15days remained above 93% and 94% respectively. (Section 4.8)
1.2.6 Precision (analytical procedure)
The pooled coefficient of variation obtained from replicate determinations of analyticalstandards at 0.5, 1 and 2 times the target concentration is 0.0044 for phenol and 0.0061for cresol. (Section 4.4)
1.2.7 Precision (overall procedure)
The overall procedure must provide results at the target concentration that are ±25% orbetter at the 95% confidence level. The precision at the 95% confidence level for the15-day storage test is ±10.7% for phenol and ±10.6% for the cresols. These values includean additional 5% for sampling error. (Figures 4.8.1 and 4.8.3)
1.3 Advantages
1.3.1 The solid sorbent sampling tube for phenol and cresol provides greater ease of samplingthan an aqueous bubbler.
1.3.2 The analysis for phenol and cresols is rapid, sensitive, and precise.
2. Sampling Procedure
2.1 Apparatus
2.1.1 Use a personal sampling pump which can be calibrated to within ±5% of the recommended0.1 L/min flow rate while the sampling tube is in line.
2.1.2 Use glass sampling tubes of approximately 4 to 5 cm in length (4-mm i.d. × 6-mm o.d.)which are packed with a 100-mg front section, and a 50-mg back section of 15/50 meshXAD-7 resin (Rohm and Haas, Inc.). Empty glass sampling tubes, open on both ends withone of the tapered ends removed, are ideal for this purpose. Use small silanized glasswool plugs in the ends and in the middle of the tube to retain and separate the sorbentmaterial. Prior to use in the sampling tube, the XAD-7 resin must first be rinsed withseveral small volumes of methanol to remove fine particles. The resin is then Soxhletextracted with methanol for 48 h to remove trace impurities and finally dried by vacuum.
2.2 Reagents
None required
2.3 Technique
2.3.1 Label sampling tubes prior to sampling.
2.3.2 Attach the sampling tube to the pump using a section of flexible, plastic tubing. Do notplace any tubing ahead of the sampling device. Attach the sampling device in the workersbreathing zone in such a manner that it does not impede work performance.
2.3.3 After sampling for the appropriate time, remove the sampling device, and cap and seal thesampling tube with plastic caps.
2.3.4 Include at least one blank for each sampling set. The blank should be handled in the samemanner as the samples with the exception that air is not drawn through it.
2.3.5 Any bulk samples submitted for analysis must be shipped in separate containers to avoidcontamination of the air samples.
2.3.6 List any potential interferences on the sample data sheet.
4 of 19

2.4 Breakthrough
The volume of air containing 35.3 mg/m3 phenol and 34.8 mg/m3 cresols at 80% relative humiditywhich can be sampled at 0.2 L/min before 5% of the total analytes collected is detected on thebackup section of the sampling tube is estimated to be 173 L for phenol and 216 L for cresol. Thesebreakthrough volumes are based on two of three breakthrough studies using XAD-7 resin. Thesevalues reflect the calculated air volumes for a 100-mg front section of XAD-7 resin. The selectionof XAD-7 resin as the sampling medium was based on an extensive evaluation of a variety ofdifferent solid sorbent materials. The methods used to evaluate these materials and the results ofthe evaluation are presented in Section 4.7.
2.5 Desorption efficiency
The desorption efficiency of the analytes from the collection medium must be 75% or greater. Theaverage desorption efficiency over the range of 0.5 to 2 times the target concentration is 99.6% forphenol and 97.9% for cresol. (Section 4.6).
2.6 Recommended air volume and sampling rate
A 24-L air sample obtained by sampling at 0.1 L/min for 4 h is recommended for phenol and cresol. If necessary, the sensitivity of the analytical method will permit a sampling period as short as 15 minat 0.1 L/min for determination of the analytes at the target concentration.
2.7 Interferences
There are no known interferences to the sampling procedure.
2.8 Safety precautions
2.8.1 Attach the sampling equipment to the worker in such a manner that it will not interfere withwork performance or safety.
2.8.2 Follow all safety practices that apply to the work area being sampled.
3. Analytical Procedure
3.1 Apparatus
3.1.1 A high performance liquid chromatograph equipped with sample injector, analyticalreverse-phase HPLC column, variable wavelength detector, chart recorder and allnecessary hardware needed for the analysis. A Waters 6000A pump, a Waters WISP 710auto sampler, a Perkin-Elmer LC-55 UV-Visible detector and a stainless steel column(25-cm length × 4.6-mm i.d.), slurry packed with spherical 8-µm Zorbax ODS packingmaterial were used in this study.
3.1.2 An electronic integrator or other suitable means of measuring detector response isrequired. A Hewlett-Packard 3354 data system was used in this study.
3.1.3 Various sizes of volumetric glassware and pipettes are needed for sample and standardpreparations.
3.1.4 Three-milliliter (or larger) screw-cap or crimp-type vials are needed for desorbing theXAD-7 sampling adsorbent. Four milliliter Waters WISP vials were used in this study.
3.1.5 Small brown glass bottles fitted with inert cap liners are needed to store standard solutions.
3.2 Reagents
3.2.1 HPLC grade methanol.
3.2.2 HPLC grade water. Our laboratory uses a commercially available water filtration systemfor the preparation of HPLC grade water.
3.2.3 Reagent grade phosphoric acid.
5 of 19

3.2.4 Reagent grade standards of phenol and the cresol isomers are required. The standardsused in this study and their source are listed below:
Phenol, Chem. Service, (Lot 0-879), (West Chester, PA.); o-cresol 99+%,Matheson-Coleman-Bell (MCB), (Norwood, Ohio); m-cresol, (lot 4F22), MCB; p-cresol, (lotA7027), MCB.
3.3 Standard preparation
3.3.1 Prepare a stock solution of phenol by weighing approximately 120 mg of phenol into a25-mL volumetric and diluting to volume with methanol. Prepare stock solutions of eachof the cresol isomers by weighing approximately 35 mg of each isomer into separate 25-mLvolumetrics and diluting to volume with methanol.
3.3.2 Prepare 1/50, 1/25, and 2/25 dilutions of phenol and of each of the cresol isomers into theappropriate volumes of methanol to yield standard mixtures of phenol and the cresolisomers which represent 0.5, 1, and 2 times the target concentration. Transfer thestandards to dark brown glass bottles fitted with Teflon-lined caps for storage in therefrigerator.
3.4 Sample preparation
Transfer the front glass wool and sorbent section of the sampling tube to a 4-mL vial. Add 2 mL ofmethanol, immediately cap the vial, and shake it on a mechanical shaker for 15 min. Place theremaining backup section including both glass wool plugs into a separate 4-mL vial and desorb thesample in the same manner as the front sections.
3.5 Analysis
3.5.1 Prepare a high performance liquid chromatograph for sample analysis using the HPLCconditions listed below:
column: (25 cm × 4.6-mm i.d.) stainless steel column packed with Zorbax8-µm, ODS-bound, spherical, silica particles.
mobile phase: 59/41 (v/v) methanol/water,0.1% H3PO4 (v/v)
flow rate: 1 mL/minUV detector: 218 nminjection volume: 25 µLretention time: phenol = 5.2 min
cresol isomers = 6.9 minchromatogram: Figure 4.9
Insure that both the front and back sections of all sampling tubes are analyzed. Verify thatall sample response values lie within the range of the responses observed for thestandards.
3.5.2 The individual cresol isomers are not resolved by this method. A complete resolution ofthe three isomers in a tar acid mixture has been accomplished using normal phase HPLCmethods although the analysis time is 30 to 40 min (Ref. 5.2). It is not necessary to resolvethe cresol isomers in the analysis since the permissible exposure limit makes no distinctionbetween isomers, and an equal response of the isomers is obtained at 218 nm. It must berecognized that analysis of a cresol sample at wavelengths other than 218 nm can produceerroneous results if the weight ratio of cresol isomers in a sample differs markedly from theratio in an analytical standard. An equal weight ratio of ortho-, meta-, and para-cresolisomers was used in this study.
3.5.3 Analysis of phenol and cresol by gas chromatography (GC) with flame ionization detectionprovides a good alternate analytical method. Although somewhat less sensitive than UVdetection, the GC analysis does provide a better separation of the cresol isomers (Figure4.10).
GC conditionscolumn: (6 ft × 1/8 in.) stainless steel column packed with 0.1% SP1000 on
80/100 Carbopack Cinjector: 225EC
6 of 19
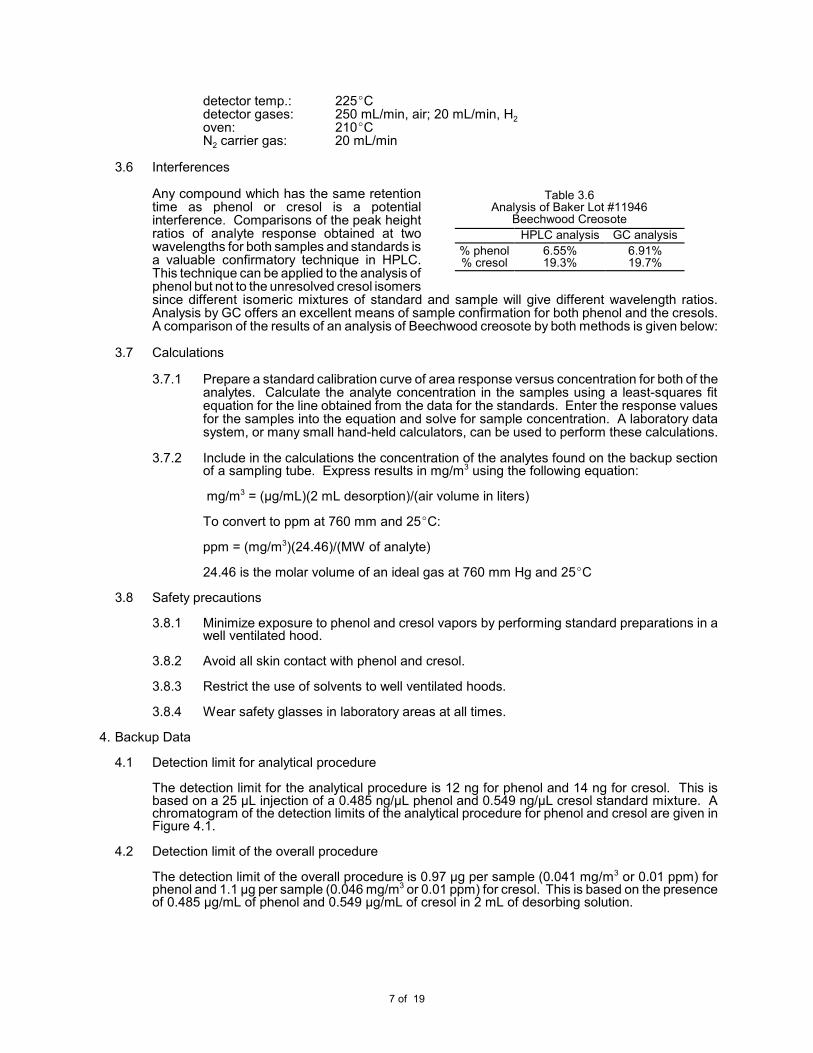
Table 3.6Analysis of Baker Lot #11946
Beechwood Creosote
HPLC analysis GC analysis
% phenol% cresol
6.55%19.3%
6.91%19.7%
detector temp.: 225ECdetector gases: 250 mL/min, air; 20 mL/min, H2
oven: 210ECN2 carrier gas: 20 mL/min
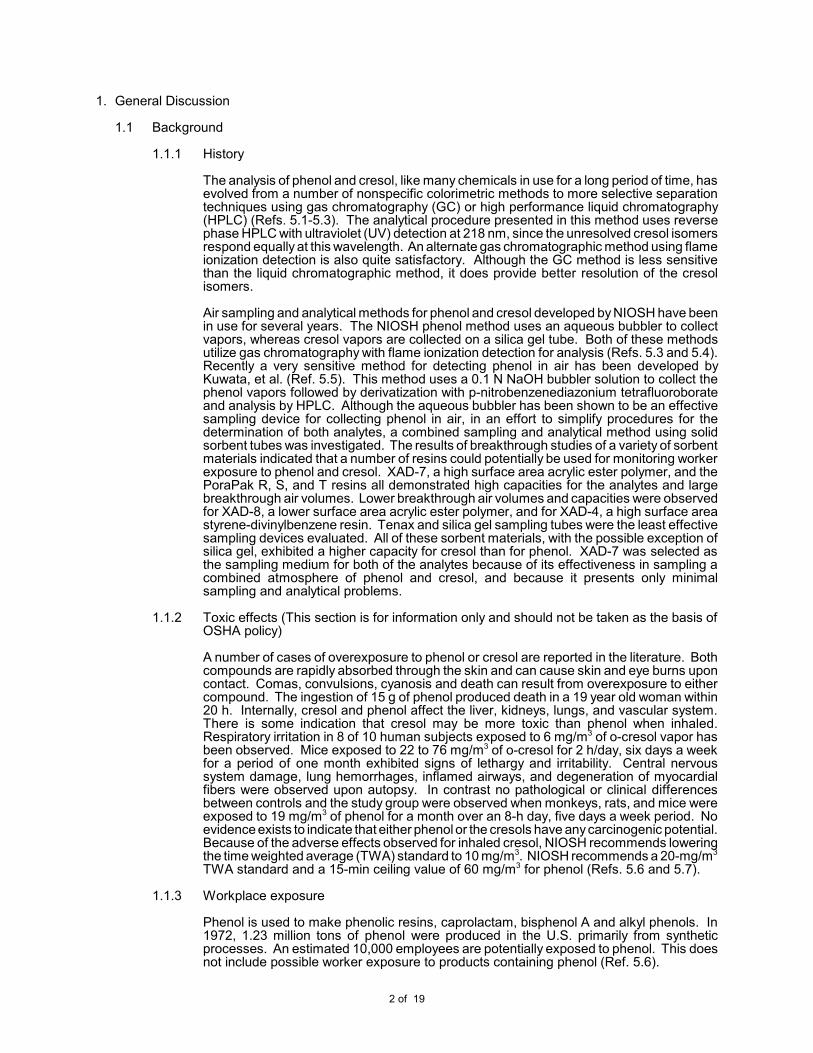
3.6 Interferences
Any compound which has the same retentiontime as phenol or cresol is a potentialinterference. Comparisons of the peak heightratios of analyte response obtained at twowavelengths for both samples and standards isa valuable confirmatory technique in HPLC. This technique can be applied to the analysis ofphenol but not to the unresolved cresol isomerssince different isomeric mixtures of standard and sample will give different wavelength ratios. Analysis by GC offers an excellent means of sample confirmation for both phenol and the cresols. A comparison of the results of an analysis of Beechwood creosote by both methods is given below:
3.7 Calculations
3.7.1 Prepare a standard calibration curve of area response versus concentration for both of theanalytes. Calculate the analyte concentration in the samples using a least-squares fitequation for the line obtained from the data for the standards. Enter the response valuesfor the samples into the equation and solve for sample concentration. A laboratory datasystem, or many small hand-held calculators, can be used to perform these calculations.
3.7.2 Include in the calculations the concentration of the analytes found on the backup sectionof a sampling tube. Express results in mg/m3 using the following equation:
mg/m3 = (µg/mL)(2 mL desorption)/(air volume in liters)
To convert to ppm at 760 mm and 25EC:
ppm = (mg/m3)(24.46)/(MW of analyte)
24.46 is the molar volume of an ideal gas at 760 mm Hg and 25EC
3.8 Safety precautions
3.8.1 Minimize exposure to phenol and cresol vapors by performing standard preparations in awell ventilated hood.
3.8.2 Avoid all skin contact with phenol and cresol.
3.8.3 Restrict the use of solvents to well ventilated hoods.
3.8.4 Wear safety glasses in laboratory areas at all times.
4. Backup Data
4.1 Detection limit for analytical procedure
The detection limit for the analytical procedure is 12 ng for phenol and 14 ng for cresol. This isbased on a 25 µL injection of a 0.485 ng/µL phenol and 0.549 ng/µL cresol standard mixture. Achromatogram of the detection limits of the analytical procedure for phenol and cresol are given inFigure 4.1.
4.2 Detection limit of the overall procedure
The detection limit of the overall procedure is 0.97 µg per sample (0.041 mg/m3 or 0.01 ppm) forphenol and 1.1 µg per sample (0.046 mg/m3 or 0.01 ppm) for cresol. This is based on the presenceof 0.485 µg/mL of phenol and 0.549 µg/mL of cresol in 2 mL of desorbing solution.
7 of 19

Table 4.3Reliable Quantitation Limit Data
analyteµg/sample
phenol0.971
cresol1.10
µgrecovered
X&(%)SD (%)
1.96SD(%)
0.7500.9880.8680.868
0.868(89)0.097(11.2)0.190(220
0.8240.8240.9521.06
0.915(83)0.115(12.6)0.225(25)
Table 4.4.1Analytical Precision Data for Phenol
µg/mL 97.08 194.2 405.1
arearesponse
×106
X&SDCVC&V&
1.4871.4881.4661.4821.4861.4901.483
0.00880.00590.0044
2.8222.8092.8012.7902.7982.8102.805
0.01110.0040
6.0336.0036.0046.0225.9856.0126.010
0.01660.0028
Table 4.4.2Analytical Precision Data for Cresol
µg/mL 109.8 219.6 439.3
arearesponse
×106
X&SDCVC&V&
1.5581.5631.5371.5451.5691.5681.5570.013
0.00840.0061
3.0132.9903.0032.9792.9813.0082.9960.014
0.0048
6.1136.0436.0816.0986.0596.0706.0780.025
0.0041
Table 4.6.1Desorption Efficiency for Phenol
× target concnphenol, µg
0.5×242
1×465
2×893
DE, %
X&
10110110398.0100101101
99.010099.010099.099.199.3
96.810010199.697.396.998.6
Table 4.6.2Desorption Efficiency for Cresol
× target concncresol, µg
0.5×273
1×526
2×10¹⁰
DE, %
X&
95.895.896.596.595.196.096.1
97.198.198.197.196.198.197.4
98.410210310198.798.7
100.3
4.3 Reliable quantitation limit
The reliable quantitation limit is the same asthe detection limit of the overall proceduresince the recovery at this concentration is atleast 75% and the precision is ±25% or betterat the 95% confidence level. The front sectionof four XAD-7 sampling tubes was spiked with5 µL of 194.2 µg/mL phenol and 219.6 µg/mLcresol in methanol and then capped for storageover a weekend in a laboratory drawer. Theresults of the following desorption with 2 mL ofmethanol are reported below:
4.4 Precision
The pooled coefficients of variation over a range of 0.5 to 2 times the target concentration for bothphenol and cresol were obtained from multiple 25-µL injections of three standard mixtures inmethanol containing 97.08/109.8, 194.2/219.6, and 405.1/439.3 µg/mL of phenol and cresolrespectively. The results are listed in Table 4.4.1 and 4.4.2.
4.5 Sensitivity
The slope of the calibration curve over the range of 0.5 to 2 times the target concentration for theanalytes represents the sensitivity of the method. The sensitivities determined in this manner are14,777 and 13,756 area units/(µg/mL) respectively for phenol and cresol. (Figures 4.5.1 and 4.5.2)
4.6 Desorption efficiency
The desorption efficiency from spiked samples over the range of 0.5 to 2 times the targetconcentration is 99.6% for phenol and 97.9% for cresol. A total of 18 XAD-7 sampling tubes werespiked with variable amounts of a mixture of phenol and cresol equivalent to 0.5, 1, and 2 times thetarget concentration of the analytes for a 4-h air sample at 0.1 L/min. Six samples each were spikedwith 2.6, 5, or 9.6 microliters of a standard mixture of 92.98/ 105.2 (mg/mL) phenol and cresol inmethanol. The tubes were capped and stored overnight in a laboratory drawer. The following dayeach sample was desorbed with 2 mL of methanol and analyzed. The results are reported in Tables4.6.1- 4.6.2.
8 of 19

4.7 Breakthrough
Commercially available Tenax, Silica gel, XAD-4, and PoraPak R, S, and T sampling tubes fromSKC, Inc. (Eighty-Four, PA 15330); and XAD-7 and XAD-8 tubes which were packed in thelaboratory were evaluated for breakthrough. These sorbent materials were selected for evaluationeither because of their high capacity for similar compounds when used as gas chromatographicpackings, or because of their widespread use as sampling media (Ref. 5.8). All of the abovematerials exhibited high desorption efficiencies with methanol when spiked with targetconcentrations of the analytes and analyzed 24 h later.
The retention efficiency, which is the ability to retain the analytes when humid air was drawn througha sampling tube, was determined for all of the sorbent materials except Tenax. These retentionefficiencies were measured by drawing humid air (80% RH) at 0.1 L/min, for a minimum of 3 h,through sorbent tubes which were spiked with an amount of phenol and cresol equivalent to twicethe target concentration. Silica gel was the only sorbent material which failed to adequately retainthe analytes on the front adsorbent section of the sampling tube.
Further evaluations of a collection method for phenol and cresol were performed using a vaporgeneration system. A 1.00% aqueous solution of phenol and a 0.985% aqueous solution of anequal-weight mixture of the cresol isomers were metered into a 2 L/min airstream with separate10-mL syringes at flow rates of 7.56 µL/min and 7.72 µL/min respectively. A constant 120ECtemperature was maintained at the inlet to the vapor generation system by wrapping the inlet withheating tape to ensure rapid volatilization of the analytes. Based on the analysis of sampling tubesused to monitor the generated atmosphere, approximately 92% of the expected concentration of37.8.0 mg/m3 phenol and 38.0 mg/m3 cresol was obtained with the system.
Attempts to monitor analyte breakthrough using either a total hydrocarbon analyzer, or a gaschromatograph equipped with a gas sampling valve mounted downstream from the sampling tubewere unsuccessful. It is suspected that adsorption of the analytes onto the glass surfaces of thevapor generation system resulted in the long lag time observed between actual breakthrough andthe time required for detection of breakthrough. Reliable measures of breakthrough weredetermined by analyzing both the front and back sections of solid sorbent sampling tubes placedin the vapor stream for various lengths of time. A maximum of six sampling tubes could be placedon the sampling manifold at one time. Critical flow orifices attached between the sampling tubesand the vacuum system were used to accurately sample the test atmosphere at 0.2 L/min. Withonly one exception, all breakthrough studies were performed at approximately 80% relative humidity. Breakthrough was measured by removing the sampling tubes from the vapor stream at various timeintervals and then analyzing front and back sorbent sections including the glass wool plugs. Theresults for the various solid sorbents tested were compared by plotting the air volume sampledversus the percent of the total analyte found on the backup section. A least squares parabolic curveforced through zero was arbitrarily used to fit the data points. The air volumes necessary to give5, 10, 15, and 20 percent breakthrough were determined from the equations for the curves. Representative breakthrough curves for XAD-7 (test 1) and for SKC, Inc. silica gel tubes areincluded. (Figures 4.7.1 - 4.7.4)
Due to the high analyte capacities observed for most of the sorbents tested, less than normalamounts of sorbent material were generally used in the breakthrough studies. Unless otherwiseindicated, all of the breakthrough studies were performed with an accurately weighed 25-mg frontportion of adsorbent and an approximate 50-mg back portion. Small silanized glass wool plugs wereused to separate and retain the sections.
The results of breakthrough studies for all solid sorbents tested are presented in Tables 4.7.1 -4.7.4. Breakthrough tests on XAD-7 were performed three times with the combined phenol andcresol atmosphere at 80% relative humidity and once at 50% relative humidity. Two tests of phenolbreakthrough on XAD-7 in the absence of cresol, and one test of cresol on XAD-7 in the absenceof phenol were also performed. Breakthrough tests were also conducted on PoraPak R, S, and Tsorbents with the combined analyte atmosphere. Because of their greatly reduced capacities forphenol and cresol, the entire front sections of both silica gel and Tenax were tested forbreakthrough. The breakthrough air volumes for silica gel listed in Tables 4.7.3 and 4.7.4 havebeen adjusted for the difference in the amount of sorbent used compared to the other sorbents.
An initial screening of SKC, Inc. Tenax (2,6-diphenyl-p-phenylene oxide polymer) tubes indicatedthat this material was not effective in trapping the analytes and further evaluations of breakthroughwere not conducted. The sampling of 36 L of the phenol and cresol atmosphere at 0.2 L/min andat 80% relative humidity resulted in the retention (on the entire Tenax sampling tube) of only 22%of the total phenol and 56% of the total cresol present in the atmosphere.
The capacities of the various sorbents on a percent weight basis are reported in Tables 4.7.5 and4.7.6. These values were determined from the breakthrough studies by dividing the amount of
9 of 19
analyte on the front section of the sampling tube at saturation by the weight of the solid sorbentused. With the possible exception of silica gel, all of the sorbents demonstrated a higher capacityfor cresol than for phenol. These values are consistent with the differences in breakthrough airvolumes observed for cresol and phenol. The low capacities measured for silica gel and Tenax arealso reflected in low breakthrough air volumes for these adsorbents.
Examination of the breakthrough volume and the capacity data indicate that XAD-7, with theexception of one study, is a very effective solid sorbent for sampling phenol and cresol in air. Although the determination of breakthrough volumes was subject to some variation, it appears thatthe collection efficiency of either phenol or cresol on XAD-7 is not affected by the presence of theother analyte. Lowered humidity apparently does not have an effect on breakthrough air volumesor capacity. In only one study of XAD-7 were both reduced breakthrough volume and reducedcapacities observed. The reason for the differences observed in this one study is not known.
The breakthrough volumes and the capacities determined for the PoraPak resins indicate that thesesorbent materials are also quite effective in collecting the analytes. The SKC PoraPak samplingtubes were not selected for use because they presented some potential sampling and analyticalproblems. The fine mesh size of the PoraPak resins used in the SKC sampling tubes resulted ina large pressure drop of 5 inches of water across the sampling tube at a 0.1 L/min flow rate. Thismay affect sample pump performance during prolonged sampling periods. Some problems werealso experienced with the analysis of the PoraPak sampling tubes. Difficulty in transferring theresins for methanol extraction was experienced, and extraneous UV-absorbing peaks extractedfrom the resins were observed upon analysis. All of the problems associated with the PoraPakresins might easily be overcome if properly sized and properly solvent-extracted resins are used inthe sampling tubes.
Table 4.7.1Parameters for Tests Listed in Table 4.7.2
analyte relativehumidity (%)
amount ofadsorbent (mg)
test 1test 2test 3test 4test 5test 6test 7
phenol/cresolphenol/cresolphenol/cresolphenol/cresol
phenolphenolcresol
80808050808080
2530*2525252525
* Air volumes of test 2 corrected by weight difference factor. (25 mg/30 mg) × air vol.
Table 4.7.2Breakthrough (BT) Air Volumes (L) on XAD-7
%BT 1phen/cres
2phen/cres
3phen/cres
4phen/cres
5phen
6phen
7cres
5101520
32.4/54.142.9/*50.9/*57.8/*
38.2/54.146.0/67.952.0/78.8
57.7/*
15.0/28.724.0/40.931.3/50.237.5/58.0
53.7/58.945.1/77.5
52.5/*58.8/*
29.639.046.352.4
27.237.045.152.2
44.256.866.775.0
* No breakthrough data obtained at this leveltest atmosphere concn: phenol - 37.8 mg/m3, cresol - 38.0 mg/m3
Table 4.7.3Phenol Breakthrough (BT) Air Volume (L) for Solid Sorbents
% BT PoraPak R PoraPak S PoraPak1T(30 mg)
PoraPak T XAD-4 XAD-8 Silica Gel1
(140 mg)
5101520
28.336.643.148.6
23.832.839.745.6
34.641.747.552.4
41.849.555.861.2
5.211.017.424.9
1525.534.141.6
0.681.201.642.04
1 Air volumes of test 2 corrected by weight difference factor (25 mg/30 mg used in test) × air vol
Table 4.7.4Cresol Breakthrough (BT) Air Volume (L) for Solid Sorbents
% BT PoraPak R PoraPak S PoraPak1T(30 mg)
PoraPak T XAD-4 XAD-8
5101520
52.767.779.3
*
49.762.672.8
*
50.562.171.4
*
65.5***
37.0***
31.4***
1 Thirty milligrams used in test. Air volume corrected by weight difference factor. (25 mg/30 mg) × air vol* No breakthrough data obtained at this concentration
10 of 19
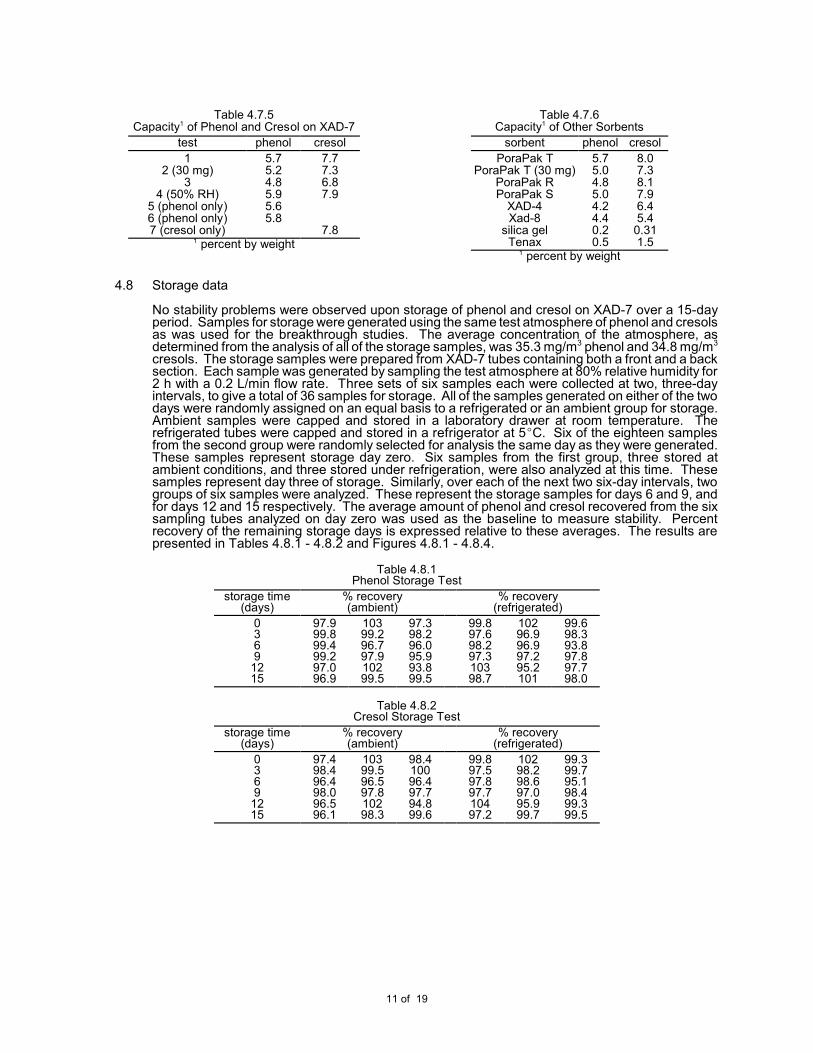
Table 4.7.5Capacity1 of Phenol and Cresol on XAD-7
test phenol cresol
12 (30 mg)
34 (50% RH)
5 (phenol only)6 (phenol only)7 (cresol only)
5.75.24.85.95.65.8
7.77.36.87.9
7.81 percent by weight
Table 4.7.6Capacity1 of Other Sorbents
sorbent phenol cresol
PoraPak TPoraPak T (30 mg)
PoraPak RPoraPak S
XAD-4Xad-8
silica gelTenax
5.75.04.85.04.24.40.20.5
8.07.38.17.96.45.4
0.311.5
1 percent by weight
4.8 Storage data
No stability problems were observed upon storage of phenol and cresol on XAD-7 over a 15-dayperiod. Samples for storage were generated using the same test atmosphere of phenol and cresolsas was used for the breakthrough studies. The average concentration of the atmosphere, asdetermined from the analysis of all of the storage samples, was 35.3 mg/m3 phenol and 34.8 mg/m3
cresols. The storage samples were prepared from XAD-7 tubes containing both a front and a backsection. Each sample was generated by sampling the test atmosphere at 80% relative humidity for2 h with a 0.2 L/min flow rate. Three sets of six samples each were collected at two, three-dayintervals, to give a total of 36 samples for storage. All of the samples generated on either of the twodays were randomly assigned on an equal basis to a refrigerated or an ambient group for storage. Ambient samples were capped and stored in a laboratory drawer at room temperature. Therefrigerated tubes were capped and stored in a refrigerator at 5EC. Six of the eighteen samplesfrom the second group were randomly selected for analysis the same day as they were generated. These samples represent storage day zero. Six samples from the first group, three stored atambient conditions, and three stored under refrigeration, were also analyzed at this time. Thesesamples represent day three of storage. Similarly, over each of the next two six-day intervals, twogroups of six samples were analyzed. These represent the storage samples for days 6 and 9, andfor days 12 and 15 respectively. The average amount of phenol and cresol recovered from the sixsampling tubes analyzed on day zero was used as the baseline to measure stability. Percentrecovery of the remaining storage days is expressed relative to these averages. The results arepresented in Tables 4.8.1 - 4.8.2 and Figures 4.8.1 - 4.8.4.
Table 4.8.1Phenol Storage Test
storage time(days)
% recovery(ambient)
% recovery(refrigerated)
0369
1215
97.999.899.499.297.096.9
10399.296.797.910299.5
97.398.296.095.993.899.5
99.897.698.297.310398.7
10296.996.997.295.2101
99.698.393.897.897.798.0
Table 4.8.2Cresol Storage Test
storage time(days)
% recovery(ambient)
% recovery(refrigerated)
0369
1215
97.498.496.498.096.596.1
10399.596.597.810298.3
98.410096.497.794.899.6
99.897.597.897.710497.2
10298.298.697.095.999.7
99.399.795.198.499.399.5
11 of 19

Figure 4.5.1. Calibration curve for phenol.
Figure 4.1. Detection limit for phenol and cresol.
12 of 19
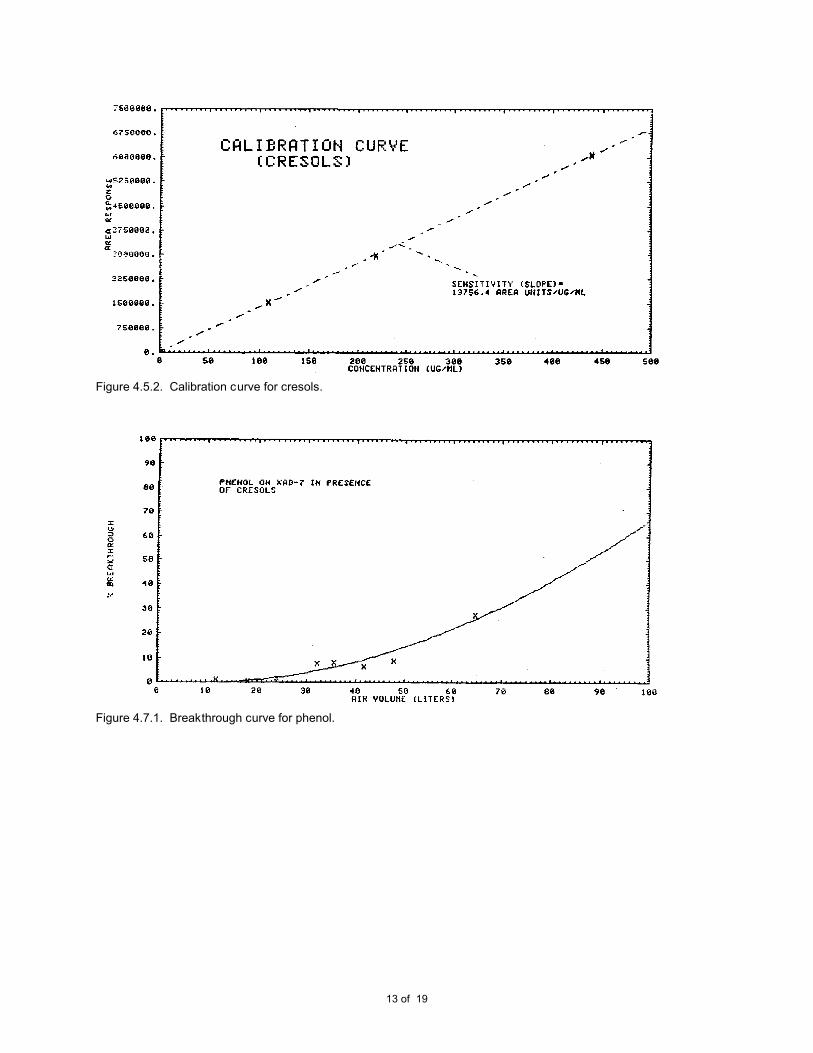
Figure 4.5.2. Calibration curve for cresols.
Figure 4.7.1. Breakthrough curve for phenol.
13 of 19

Figure 4.7.2 Breakthrough curve for cresols.
Figure 4.7.3. Breakthrough curve for phenol on silica gel.
14 of 19

Figure 4.7.4. Breakthrough curve for cresols on silica gel.
Figure 4.8.1. Ambient storage for phenol.
15 of 19

Figure 4.8.2. Refrigerated storage for phenol.
Figure 4.8.3. Ambient storage for cresols.
16 of 19
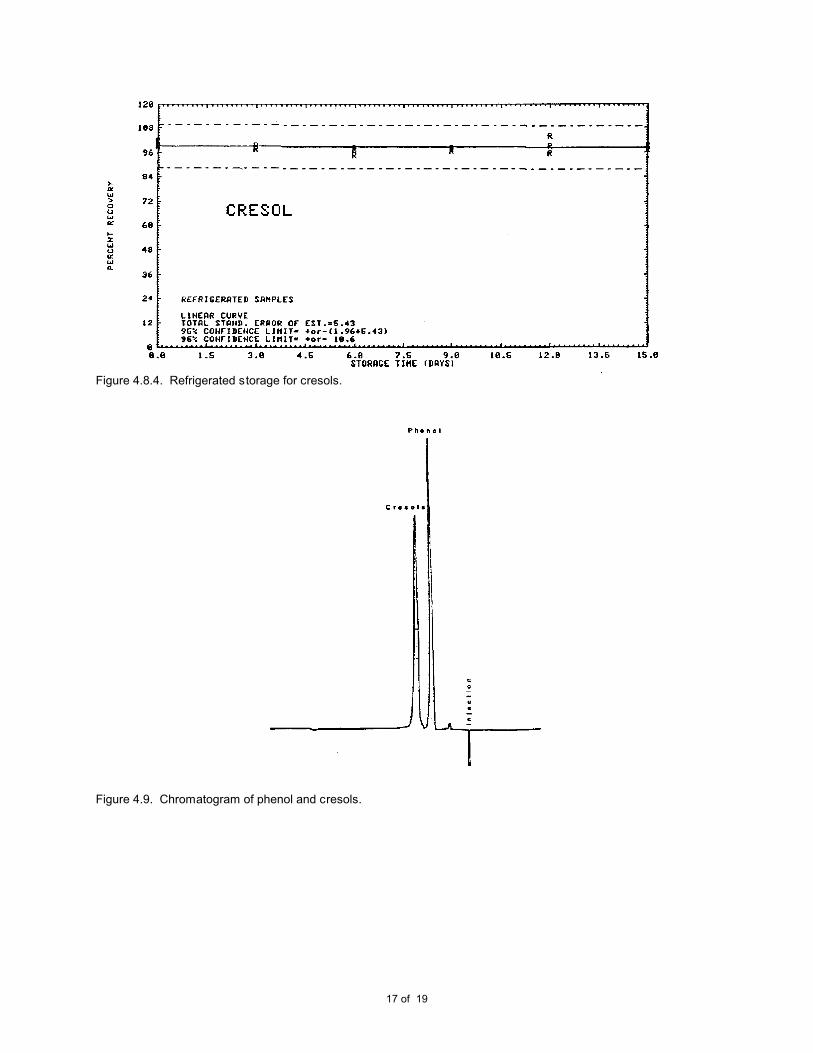
Figure 4.8.4. Refrigerated storage for cresols.
Figure 4.9. Chromatogram of phenol and cresols.
17 of 19

Figure A. A chromatogram of an analytical standard atthe concentration of 379 µg/mL phenol, 452 µg/mL o-cresol, 517 µg/mL m-cresol, and 531 µg/mL p-cresol. The peaks are identified in the chromatogram as: 1methanol, 2 DMF, 3 phenol, 4 o-cresol, and 5 m- and p-cresol.
5. References
5.1 Donald McNeil in "Kirk-Othmer Encyclopedia of Chemical Technology", Vol. 6, pp. 434 - 444, 2ndEdition, John Wiley and Sons, N.Y. 1965.
5.2 Husain, S.; Kunzelmann, P.; Schildknecht, H.; J. Chromatogr. (1977), 137, 53 - 60.
5.3 "NIOSH Manual of Analytical Methods", Vol. 3, 2nd Edition, April 1977, USDHEW, PHS, CDC,NIOSH, DHEW (NIOSH) Publication No. 77 - 157C.
5.4 "Documentation of the NIOSH Validation Tests", by Taylor, D.G.; Kupel, R.E.; and Bryant, J.M.;USDHEW, PHS, CDC, NIOSH, April 1977, DHEW (NIOSH) Publication No. 77 - 185.
5.5 Kuwata, K.; Uebori, M.; Yamazaki, Y.; Anal. Chem. (1980), 52, 857860.
5.6 "Criteria for a Recommended Standard....Occupational Exposure to Phenol", USDHEW, PHS, CDC,NIOSH, July 1976, HEW Publ. No. (NIOSH) 76 - 196.
5.7 "Criteria for a Recommended Standard....Occupational Exposure to Cresol", USDHEW, PHS, CDC,NIOSH, Feb. 1978, DHEW (NIOSH) Publication No. 78 - 133.
5.8 Dave, S.B.; J. Chromatog. Sci., (1969), 7, 389 - 399.
Method 32 Appendix A
Introduction
With the advent of capillary columns, detection limits by gas chromatography are as low as with liquidchromatography for phenol and cresols, typically 1 µg/sample. Analysis of samples by liquid chromatographycreates hazardous wastes, which do not occur with gas chromatography. The precision of capillary gaschromatography, with an internal standard, is typically as good or better than liquid chromatography. Forthese reasons the SLTC began analyzing phenol and cresol samples by capillary gas chromatography witha flame ionization detector (GC-FID). An internal standard of dimethyl formamide was used at a concentrationof 1 µL/mL in the methanol. The method precision can be considered unchanged by the use of capillary GC-FID.
Experimental
Instrument: HP5890 gas chromatograph with a flame ionization detectorColumn: 60-m × 0.32-mm i.d. capillary
coated with a 1.0-µm df DB-1(J&W Scientific, Folsom, CA)
Injection size: 1 µL (19:1 split)zone temperatures: 100EC (column), hold 4 min,
ramp at 5EC/min to 160EC, hold4 min210EC (injector)225EC (detector)
run time: 18 mincolumn gas flow: 2.9 mL/min (hydrogen)septum purge: 1.9 mL/min (hydrogen)retention times: 3.17 min (methyl alcohol)
6.22 min (DMF)11.58 min (phenol)14.20 min (o-cresol)14.85 min (m- and p-cresol)
FID conditions:hydrogen flow: 38 mL/minair flow: 450 mL/minmakeup flow: 30 mL/min (nitrogen)
Results
The desorption studies were performed by spiking XAD-7 tubes at concentrations of 379, 190, and 37.9 µgphenol; 452, 226, and 45.2 µg o-cresol; 517, 259, and 51.7 µg m-cresol; and 531, 266, and 53.1 µg p-cresol. The samples were allowed to equilibrate overnight at room temperature. They were opened, each sectionplaced into a separate 2-mL vial, and desorbed with 1 mL of the desorbing solvent of 1 µL/mL DMF inmethanol. The samples were placed on a shaker for ½ hour, and then analyzed by GC-FID. The averagedesorption efficiencies were phenol 98.4%, o-cresol 96.3%, m-cresol 96.8%, and p-cresol 97.5%. Qualitycontrol samples spiked with phenol, analyzed by GC-FID, over the period of 10/1/92 thru 10/1/97 had anaverage of 0.9601 for found/theoretical amounts.
18 of 19
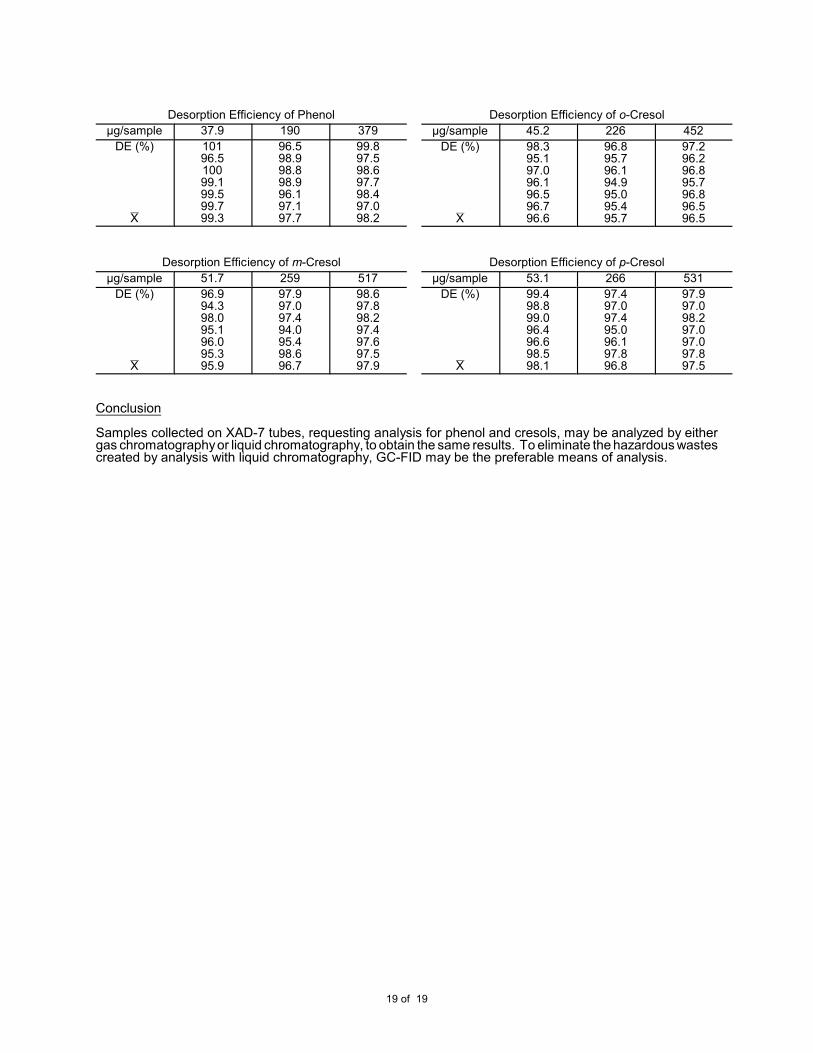
Desorption Efficiency of o-Cresol
µg/sample 45.2 226 452
DE (%)
X&
98.395.197.096.196.596.796.6
96.895.796.194.995.095.495.7
97.296.296.895.796.896.596.5
Desorption Efficiency of Phenol
µg/sample 37.9 190 379
DE (%)
X&
10196.510099.199.599.799.3
96.598.998.898.996.197.197.7
99.897.598.697.798.497.098.2
Desorption Efficiency of p-Cresol
µg/sample 53.1 266 531
DE (%)
X&
99.498.899.096.496.698.598.1
97.497.097.495.096.197.896.8
97.997.098.297.097.097.897.5
Desorption Efficiency of m-Cresol
µg/sample 51.7 259 517
DE (%)
X&
96.994.398.095.196.095.395.9
97.997.097.494.095.498.696.7
98.697.898.297.497.697.597.9
Conclusion
Samples collected on XAD-7 tubes, requesting analysis for phenol and cresols, may be analyzed by eithergas chromatography or liquid chromatography, to obtain the same results. To eliminate the hazardous wastescreated by analysis with liquid chromatography, GC-FID may be the preferable means of analysis.
19 of 19


![Thermal Applications of p-Cresol-Oxamide-Formaldehyde … · 2020. 7. 10. · Various modified phenol-formaldehyde resins have large number of practical applications [1, 2 , 3] viz](https://img.dokumen.tips/doc/110x75/60b072c8f3736a002545324a/thermal-applications-of-p-cresol-oxamide-formaldehyde-2020-7-10-various-modified.jpg)

![Lenzinger Berichte - TU Wien...LENZINGER BERICHTE 94 (2018) 15 – 26 organic acids, phenol and cresol as well as esters, ketones and amines can be applied [1]. Many process variants](https://img.dokumen.tips/doc/110x75/61244b1a37a0c255c42a0281/lenzinger-berichte-tu-wien-lenzinger-berichte-94-2018-15-a-26-organic.jpg)