Embed Size (px)
Citation preview

Matlab TutorialBasics
Gonzalo Vaca-CastanoUCF.2013
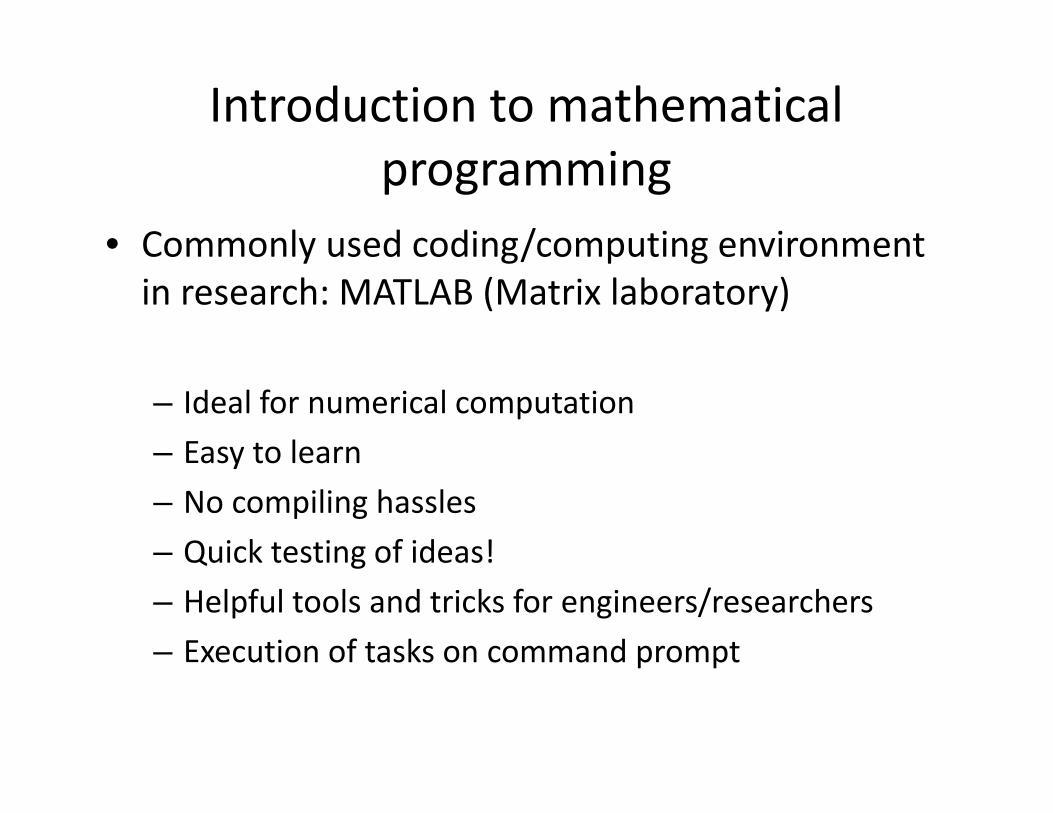
Introduction to mathematicalprogramming
• Commonly used coding/computing environmentin research: MATLAB (Matrix laboratory)
– Ideal for numerical computation– Easy to learn– No compiling hassles– Quick testing of ideas!– Helpful tools and tricks for engineers/researchers– Execution of tasks on command prompt

Matlab LayoutCurrent directory
CurrentVariables
COMMAND WINDOW

Getting Help
>> help ops;Press F1
Google it !!! . www.mathworks.com usually have an answer to whatever you need
VARIABLES

Variables
% Variables are defined as the assignmentoperator.• a=17• b='cap5415'• c=[3 4 2];• D=5*c - 2;• e=c.^2 * sin(a);
Output is displayed
Output is not displayed

Variables
% Variables are defined as the assignmentoperator.• a=17• b='cap5415'• c=[3 4 2];• D=5*c - 2;• e=c.^2 * sin(a);

Variables
• Matlab does not require variable declaration.• Matlab will declare variable automatically (be
careful with typos in variable names)

Vectors
• Creating vectors:– example: >> x=[1 2 3 4 5]
• Values retrieval>> x(1) %retrieve first element>> x([1 4]) %retrieve first and fourth element
Comment marks in Matlab

Colon Operator (:)
• Creating vectors:– example: >>x= [1 2 3 4 5]
• Same as :– x=1:5– x=1:1:5
Start Jump End
x = 1:10x = 1:2:10x = 10:-2:1y = 10:-2:1x = 1:2:10
MORE EXAMPLES

Colon Operator (:)
• Retrieving vectors:– example: >>x= [1 2 3 4 5]– a=x(2:4) %retrieve from second to fourth
element

Vector Operations• Dot product: ‘.’• Sum all elements: sum()• Sort elements: sort()• Find histogram of elements: hist()• Find average of elements: mean()

Matrices
• Creating a matrix:– Example: >> [1 1; 0 1]
• Matrix operations– Addition, multiplication, inverse, transpose– ‘+’ , ‘*’ , inv() , ‘
• Pinv = pseudo inverse
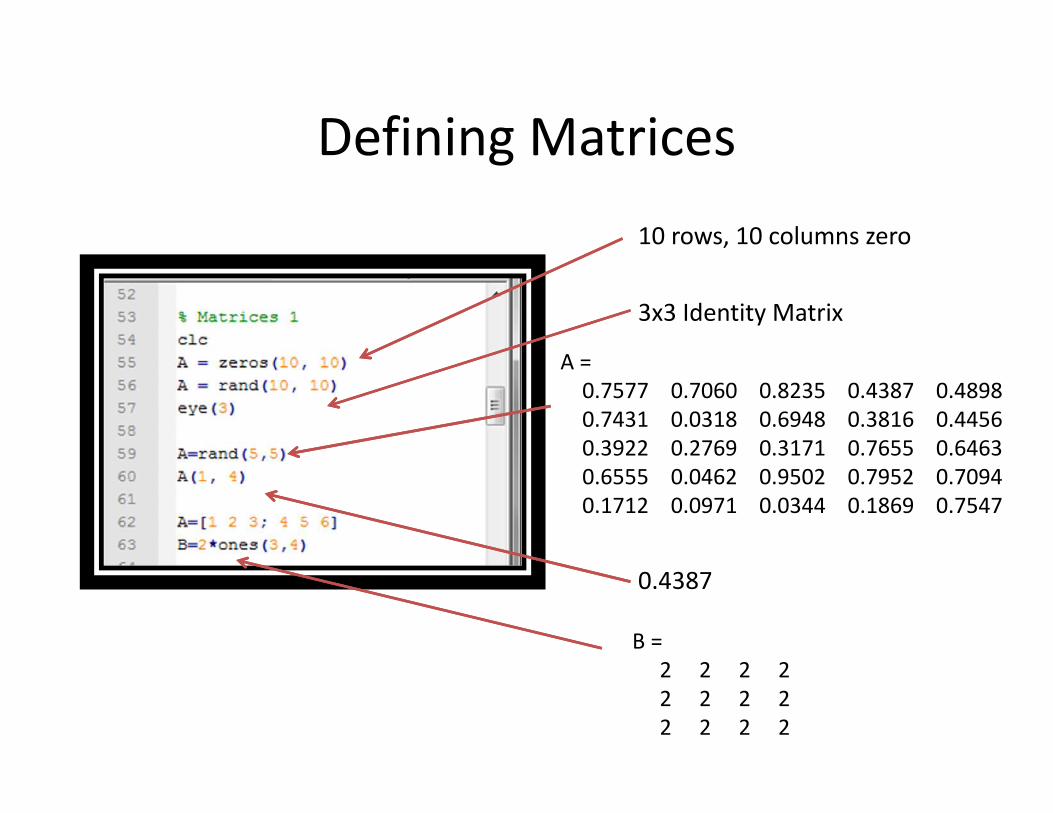
Defining Matrices10 rows, 10 columns zero
3x3 Identity Matrix
0.4387
A =0.7577 0.7060 0.8235 0.4387 0.48980.7431 0.0318 0.6948 0.3816 0.44560.3922 0.2769 0.3171 0.7655 0.64630.6555 0.0462 0.9502 0.7952 0.70940.1712 0.0971 0.0344 0.1869 0.7547
B =2 2 2 22 2 2 22 2 2 2

Matrix operationA =
1 2 34 5 6
B =2 2 22 2 2
C =12 1230 30
ans =
7 3 65 1 42 9 8

Matrix operationC =
7 5 23 1 96 4 8
ans =14 8 88 2 138 13 16
ans =
14 8 88 2 138 13 16

Matrix operation
????

Matrix operation
-2
ans =-2.0000 1.00001.5000 -0.5000
????

Solving a system of linear equations
• + + = 0• − ∗ + ∗ − = 1/2• +− + = −1•
3 2 1−1/2 2/3 −11 −2 1 =01/2−1

Solving a system of linear equations
• a=[3 2 1; -1/2 2/3 -1; 1 -2 1]• b=[0;1/2;-1]• c=inv(a)*b;
• Output: c= [-0.1429; 0.3214; -0.2143]

Indexing 2-D MatricesA =
Columns 1 through 15102 104 106 108 110 112 114 116 118 120 122 124 126 128 130
Columns 16 through 25132 134 136 138 140 142 144 146 148 150
A =102 112 122 132 142104 114 124 134 144106 116 126 136 146108 118 128 138 148110 120 130 140 150
Name Size Bytes Class AttributesA 5x5 200 doubleans 1x1 8 double
Name Size Bytes Class AttributesA 5x5 200 double
???

Indexing 2-D Matrices108
Useful if you have amultidimensional Array.
12
A =102 112 122 132 142104 114 124 134 144106 116 126 136 146108 118 128 138 148110 120 130 140 150

Some Useful functions

More Useful Function
• Load. Load data from MAT-file into workspace• Save. Save workspace variables to file
– save(filename, variables)
• Keyboard• Pause

PLOT FUNCTIONS

Plot>>plot(0:10:101)

Plot>> Q = [0, 0, 1, 1; 0, 1, 0, 2];>> figure>> plot(Q(1,:), Q(2,:), 'o', 'LineWidth', 2)
Display pattern.Try ‘x’ for exampleHelp plot;

Plot>> plot(rand(100,1), rand(100,1), 'b.');

Plot>> plot(rand(100,1), rand(100,1), ‘r.');

Hold on ; hold offplot(rand(100,1), rand(100,1), 'b.');hold onplot(rand(100,1), rand(100,1), 'r.');hold off

Subplotfigure(1);subplot(1,2,1);plot(rand(100,1), rand(100,1), 'b.');subplot(1,2,2);plot(rand(100,1), rand(100,1), 'r.');

See also
• xlabel• ylabel• axis• title

Meshgrid
• [X,Y] = meshgrid(1:3,10:14)
• X =• 1 2 3• 1 2 3• 1 2 3• 1 2 3• 1 2 3
• Y =• 10 10 10• 11 11 11• 12 12 12• 13 13 13• 14 14 14
[X,Y] = meshgrid(-2:.2:2, -2:.2:2);Z = X .* exp(-X.^2 - Y.^2);surf(X,Y,Z)

SIMPLE IMAGE

What is an Image?
• 2-D array of numbers (intensity values, graylevels)
• Gray levels 0 (black) to 255 (white)
• Color image is 3 2-D arrays of numbers– Red– Green– Blue


ImageRead Image File
rows =684; cols =912; chan =3

Image (Channel 1)

Image (Channel 2)

Image (Channel 3)

ImageConvert to Gray Scale

ImageSave Image File
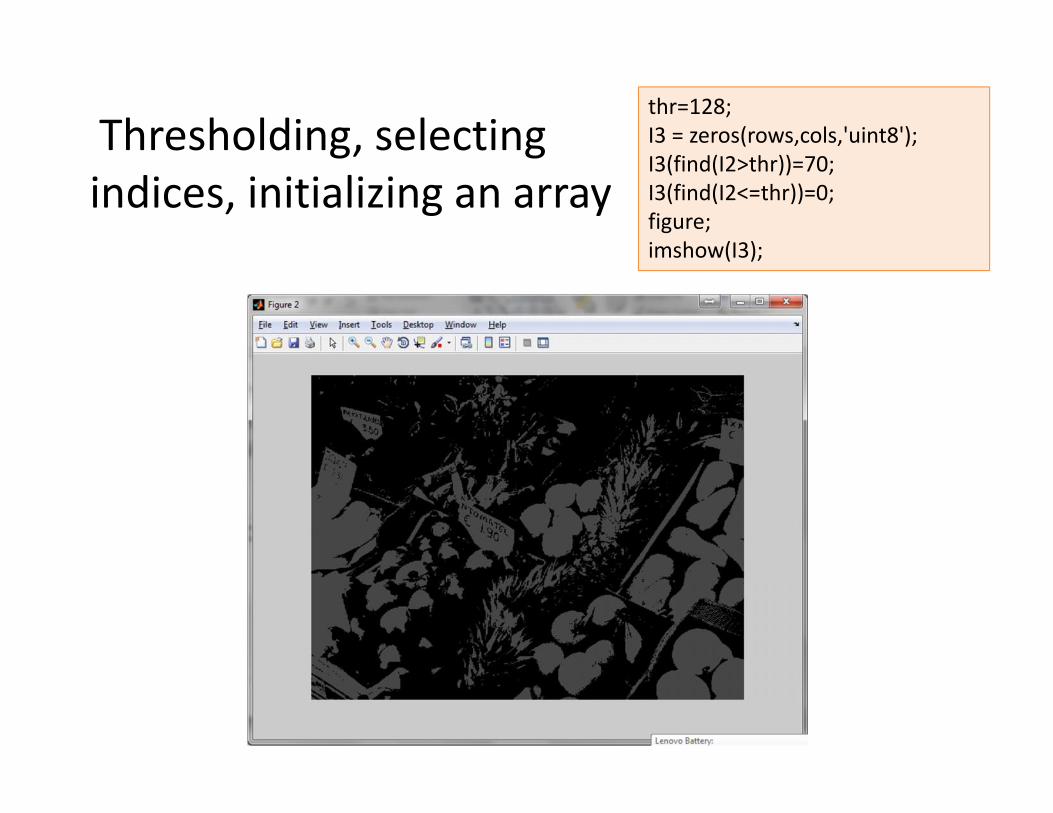
Thresholding, selectingindices, initializing an array
thr=128;I3 = zeros(rows,cols,'uint8');I3(find(I2>thr))=70;I3(find(I2<=thr))=0;figure;imshow(I3);

mat2gray.Convert arbitrary matrix to
scaled, intensity image
I4=mat2gray(I3);figure;imshow(I4);
unique(I4)
ans =
01

hist.histogram from matrix/Image.
figure;imhist(I2);

im2bw.Threshold gray image
I5=im2bw(I2,0.2); % thr 0 to 1figure;imshow(I5);

MATLAB PROGRAMMING
A little bit on Efficiency
• Matlab is optimized for Matrix Operation• For-Loops to access data works well in C and
other languages, but must me avoided whenthere is a matrix operation to replace it

Example
• Example of computing distances between allpairs of points using matrices
• No double loops !!!
a=uint8(100*rand(1,5))b=uint8(100*rand(1,5))diff=zeros(5,5)for i=1:5
diff(i,:)=double(b)-double(a(i));end

Example
• Another Matlab Way in 1 line.
diff2=repmat(double(b),5,1)-repmat(double(a'),1,5)
% - repmat. repeat matricesa=[1 2 3 4]repmat(a,[3 2])
ans =1 2 3 4 1 2 3 41 2 3 4 1 2 3 41 2 3 4 1 2 3 4

Functions
function result=testFunc(a,b)
result=(a^2)-b;
testFunc.m
>> x=testFunc(3,2)
CALL A FUNCTION
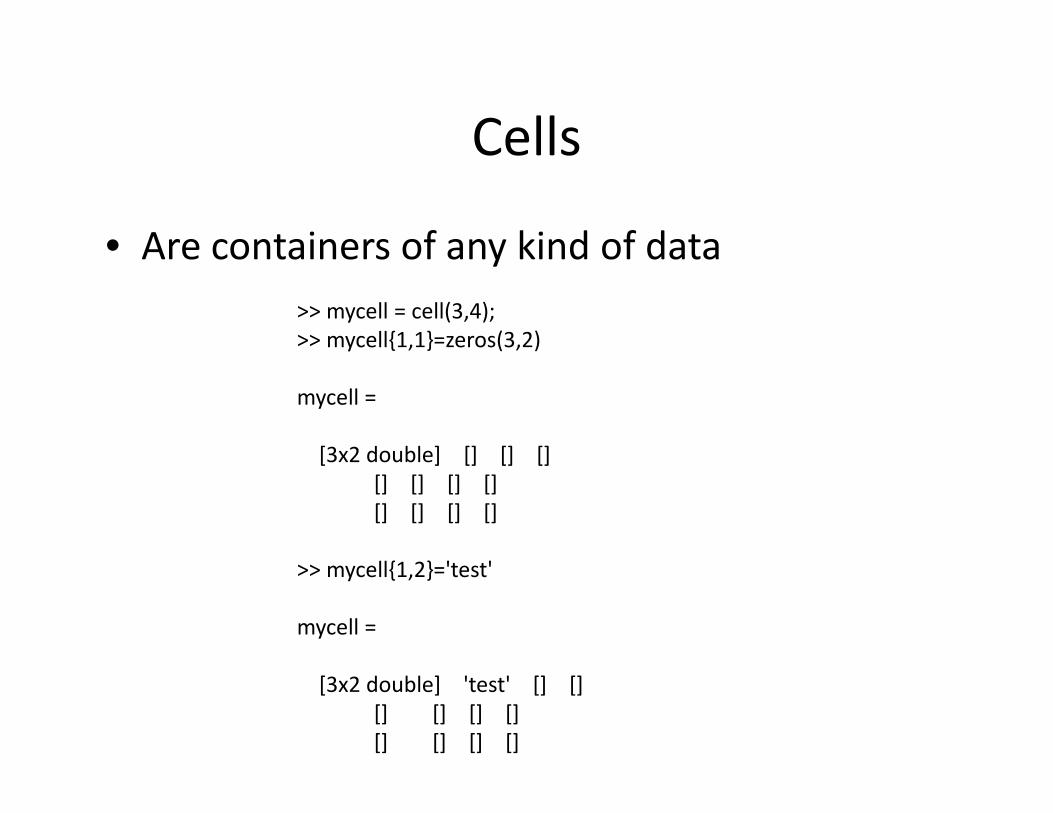
Cells
• Are containers of any kind of data>> mycell = cell(3,4);>> mycell{1,1}=zeros(3,2)
mycell =
[3x2 double] [] [] [][] [] [] [][] [] [] []
>> mycell{1,2}='test'
mycell =
[3x2 double] 'test' [] [][] [] [] [][] [] [] []

Struct. Example 1

Struct. Example 2

Nested Structures

EXTRA

Showing videos from extracted frames
• Ffmpeg is a good tool to extract frames fromvideos
inputPath = 'Sequence';figure;for i = 133:183
sprintf('%04d.jpeg', i)imshow(imread([inputPath '\' sprintf('%04d.jpeg', i)]));pause(.1);
end

Video. Other way
% - Read and display frames directly from AVIvideo.aviinfo('street.avi')frame25 = aviread('street.avi', 25);whosframe25imshow(frame25.cdata);