Embed Size (px)
Citation preview

MATLAB Tips and Tricks You Need to Know
Yair Altman
Undocumented Matlab.com
© Yair Altman UndocumentedMatlab.com 1

Key takeaways
© Yair Altman UndocumentedMatlab.com 2
• Tips and tricks to improve productivity with MATLAB o Usability and interactivity
o Visualizing large data sets
o Run-time performance
o MATLAB Central
• Some tips/tricks are easy to apply and have great effect
• MATLAB can be used to create professional-quality user-facing applications

New App Designer in MATLAB
© Yair Altman UndocumentedMatlab.com 3
• GUIDE replacement in native MATLAB
• Web-based figures
• Great-looking widgets/dials/knobs
• Integrated layout designer, code editor
• Enables using CSS for professional-looking UI

New App Designer in MATLAB
© Yair Altman UndocumentedMatlab.com 4

Old non-web GUI
© Yair Altman UndocumentedMatlab.com 5
• Programmed using GUIDE or straight m-code
• Based on Java Swing UI components
• Built-in support for HTML formatting (no Java knowledge/programming required!)
• Enables using Java for polished professional UI
• Might become unsupported in a future release

HTML formatting of uicontrol labels fontStr = @(font) ['<html><font face="' font '">' font];
htmlStr = cellfun(fontStr, listfonts, 'uniform',false);
uicontrol('style','popupmenu', 'string',htmlStr, 'pos',[20,350,60,20]);
© Yair Altman UndocumentedMatlab.com 6

HTML formatting of menu labels set(hMenuItem, 'Label',['<html>2: C:\My Documents\doc.txt<br>'...
'<font size="-1" face="Courier New" color="red"> '...
'Date: 15-Jun-2011 13:23:45<br> Size: 123 KB']);
txt1 = '<html><b><u><i>Save</i></u>';
txt2 = '<font color="red"><sup>this file';
txt3 = '<br>this file as...';
set(findall(hFig,'tag','figMenuFileSave'), 'Label',[txt1,txt2]);
set(findall(hFig,'tag','figMenuFileSaveAs'), 'Label',[txt1,txt3]);
© Yair Altman UndocumentedMatlab.com 7

Polished UI using Java components
© Yair Altman UndocumentedMatlab.com 8
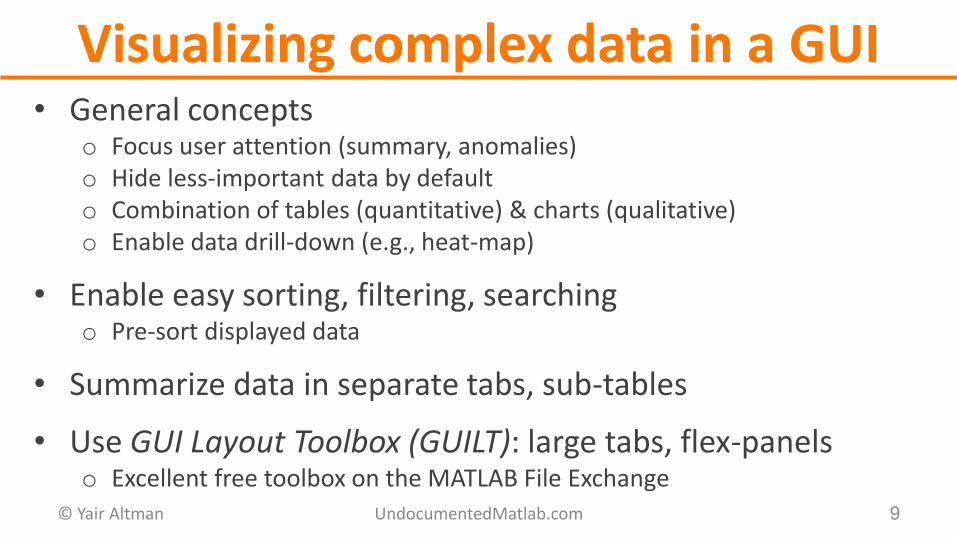
Visualizing complex data in a GUI
© Yair Altman UndocumentedMatlab.com 9
• General concepts o Focus user attention (summary, anomalies) o Hide less-important data by default o Combination of tables (quantitative) & charts (qualitative) o Enable data drill-down (e.g., heat-map)
• Enable easy sorting, filtering, searching o Pre-sort displayed data
• Summarize data in separate tabs, sub-tables
• Use GUI Layout Toolbox (GUILT): large tabs, flex-panels o Excellent free toolbox on the MATLAB File Exchange

Real-world example
© Yair Altman UndocumentedMatlab.com 10

Run-time performance
© Yair Altman UndocumentedMatlab.com 11
1. MATLAB’s built-in Profiler tool o Very useful, but largely under-appreciated
2. General programming tips o Caching o Loop-invariant hoisting (LIH)
3. Parallelization o Minimize broadcast data o Vectorization vs. CPU/GPU parallelization
4. Graphics

Built-in Profiler tool in MATLAB
© Yair Altman UndocumentedMatlab.com 12
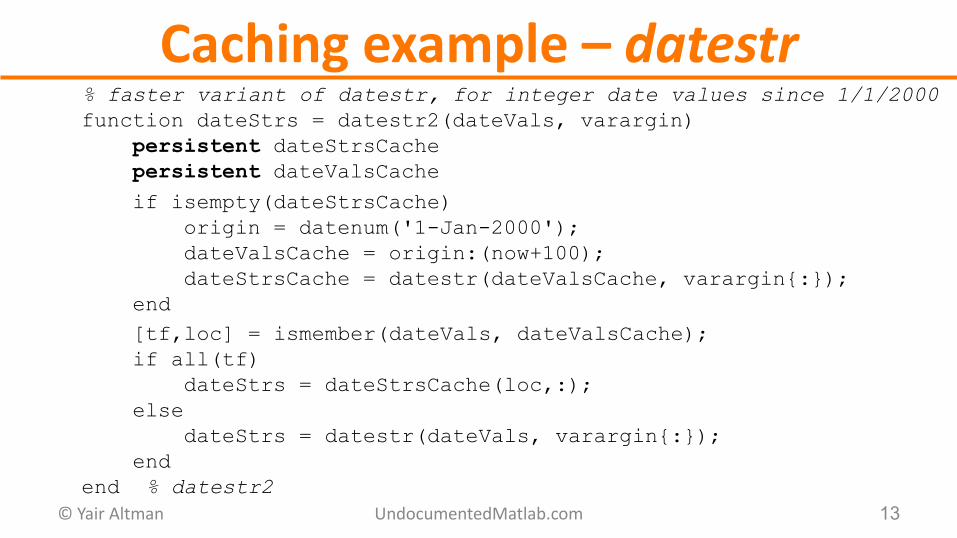
Caching example – datestr % faster variant of datestr, for integer date values since 1/1/2000
function dateStrs = datestr2(dateVals, varargin)
persistent dateStrsCache
persistent dateValsCache
if isempty(dateStrsCache)
origin = datenum('1-Jan-2000');
dateValsCache = origin:(now+100);
dateStrsCache = datestr(dateValsCache, varargin{:});
end
[tf,loc] = ismember(dateVals, dateValsCache);
if all(tf)
dateStrs = dateStrsCache(loc,:);
else
dateStrs = datestr(dateVals, varargin{:});
end
end % datestr2
© Yair Altman UndocumentedMatlab.com 13

Caching example – datestr % Prepare a 1000-vector of dates, starting 3 years ago until today
>> dateVals = fix(now)+(-1000:0);
% Run the standard datestr function 50mS
>> tic; s1=datestr(dateVals); toc
Elapsed time is 0.049089 seconds.
>> tic; s1=datestr(dateVals); toc
Elapsed time is 0.048086 seconds.
% Now run datestr2 function 0.3 mS (x150 faster)
>> tic; s2=datestr2(dateVals); toc
Elapsed time is 0.222031 seconds. % cache preparation: 222 mS
>> tic; s2=datestr2(dateVals); toc
Elapsed time is 0.000313 seconds. % subsequent calls: 0.3 mS
© Yair Altman UndocumentedMatlab.com 14

Loop-invariant hoisting (LIH) for iter = 1 : 1000
newData = constantFunction();
result(iter) = max(max(newData)) + rand(1);
end
newData = constantFunction();
maxNewData = max(max(newData));
for iter = 1 : 1000
result(iter) = maxNewData + rand(1);
end
result = maxNewData + rand(1,1000); %vectorized
© Yair Altman UndocumentedMatlab.com 15

Parallel processing
© Yair Altman UndocumentedMatlab.com 16
• Use built-in implicit parallelization (vectorization)
• Use explicit parallelization with the Parallel and Distributed Computing toolboxes
• Control # workers: parpool(feature('numcores'))
• Minimize amount of broadcast data
• Have realistic speedup expectations (Amdahl’s law)

Graphics performance • Install latest graphics driver on your computer
• Reduce the number of graphic objects (plot markers, non-visible lines/patches)
• Multi-segment lines using NaN
• Update existing graphic objects, don’t re-plot
• Minimize drawnow calls, use 'limitrate' © Yair Altman UndocumentedMatlab.com 17

Real-world example
© Yair Altman UndocumentedMatlab.com 18
http://mathworks.com/company/newsletters/articles/tips-for-accelerating-matlab-performance.html
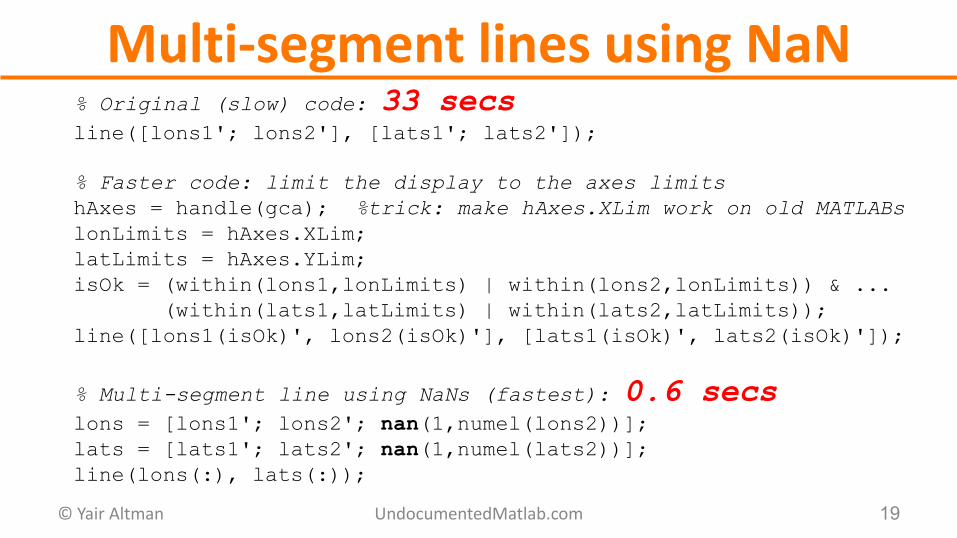
Multi-segment lines using NaN % Original (slow) code: 33 secs line([lons1'; lons2'], [lats1'; lats2']);
% Faster code: limit the display to the axes limits
hAxes = handle(gca); %trick: make hAxes.XLim work on old MATLABs
lonLimits = hAxes.XLim;
latLimits = hAxes.YLim;
isOk = (within(lons1,lonLimits) | within(lons2,lonLimits)) & ...
(within(lats1,latLimits) | within(lats2,latLimits));
line([lons1(isOk)', lons2(isOk)'], [lats1(isOk)', lats2(isOk)']);
% Multi-segment line using NaNs (fastest): 0.6 secs lons = [lons1'; lons2'; nan(1,numel(lons2))];
lats = [lats1'; lats2'; nan(1,numel(lats2))];
line(lons(:), lats(:));
© Yair Altman UndocumentedMatlab.com 19

Update existing graphic objects data = [0];
while someCondition()
newValue = getNewValue();
data = [data, newValue];
plot(hAxes, data);
drawnow
end
% Faster, less flicker: update existing graphic object
hLine = plot(hAx, 0,0); % initial line
while someCondition()
hLine.XData(end+1) = hLine.XData(end) + 1;
hLine.YData(end+1) = getNewValue();
% alternatively: set(hLine, 'XData',xVals, 'YData',yVals)
drawnow limitrate
end
© Yair Altman UndocumentedMatlab.com 20

MATLAB Central • http://mathworks.com/matlabcentral
• Huge repository of community content o Blogs
o File Exchange
o Usage examples
o Forum (“Answers”, newsgroup)
o Coding challenges (“Cody”)
• Use the ratings for high-quality content © Yair Altman UndocumentedMatlab.com 21

Conclusions • MATLAB is not inherently ‘slow’
• MATLAB GUI is not inherently ‘simplistic’
• MATLAB can be used to create professional-quality user-facing applications, while enjoying MATLAB’s benefits (RAD, functionality, reliability)
• As with everything in life, there are tradeoffs: o For better performance, invest extra code development time o For better appearance, invest extra design time o For better usability, use Java controls
© Yair Altman UndocumentedMatlab.com 22

Danke schön!
© Yair Altman UndocumentedMatlab.com 23
http://UndocumentedMatlab.com/files/Expo-2017.pdf
Also on: http://matlabexpo.com/ch
Yair Altman
UndocumentedMatlab.com