Embed Size (px)
Citation preview
Learning Media
Wellington
M A T H E M A T I C S
i n t h e N e w Z e a l a n d C U R R I C U L U M
Ministry of Education
First published 1992 byLearning Media,Ministry of Education,Box 3293, Wellington,New Zealand.
Copyright © Ministry of EducationAll rights reserved.Enquiries should be made to the publisher.
ISBN 0 478 05806 3Dewey number 510Item number 92/418
Foreword 5
Introduction 7
General Aims of Mathematics Education 8
Achievement Aims of the Mathematics Curriculum 9
Development of Essential Skills through Mathematics 10
Approaches to Teaching and Learning in Mathematics 11
Problem-solving Approach 11
Catering for Individual Needs 12
Use of Resources 13
Assessment and Evaluation in Mathematics 15
Format and Presentation of this Document 16
Strands 16
Achievement Objectives by Levels 16
Suggested Learning Experiences 17
Sample Assessment Activities 18
Development Band 19
Courses for Senior Secondary School 21
Mathematical Processes 23
Number 31
Number: Level 1 32
Number: Level 2 36
Number: Level 3 40
Number: Level 4 44
Number: Level 5 48
Number: Level 6 52
Measurement 57
Measurement: Level 1 58
Measurement: Level 2 62
Measurement: Level 3 66
Measurement: Level 4 70
Measurement: Level 5 74
Contents

4
Measurement: Level 6 78
Measurement and Calculus: Level 7 82
Measurement and Calculus: Level 8 86
Geometry 91
Geometry: Level 1 92
Geometry: Level 2 96
Geometry: Level 3 100
Geometry: Level 4 104
Geometry: Level 5 110
Geometry: Level 6 116
Geometry: Level 7 120
Geometry: Level 8 124
Algebra 129
Algebra: Level 1 130
Algebra: Level 2 134
Algebra: Level 3 138
Algebra: Level 4 142
Algebra: Level 5 148
Algebra: Level 6 154
Algebra: Level 7 158
Algebra: Level 8 164
Statistics 169
Statistics: Level 1 170
Statistics: Level 2 174
Statistics: Level 3 178
Statistics: Level 4 182
Statistics: Level 5 186
Statistics: Level 6 192
Statistics: Level 7 198
Statistics: Level 8 204
Glossary 210
5
Foreword
This curriculum statement replaces the syllabuses Mathematics: Junior Classes toStandard 4 and Mathematics: Forms 1 to 4. The statement specifies the mathematicslearning area described in The New Zealand Curriculum Framework and provides thebasis for mathematics programmes in schools from Year 1 to Year 13, that is, from Juniorclasses to Form 2 in primary schools and from Form 3 to Form 7 in secondary schools.
The Minister of Education initiated a redesign of the mathematics curriculum in 1991, aspart of a broad initiative aimed at improving achievement levels in the essential subjectsof the curriculum. The review and writing were undertaken by a small project teamunder the general guidance of a mathematics advisory committee. A draft statement wasprepared and circulated to schools and interested groups for comment and discussion.The views of all those who responded have been taken into account in preparing the finalcurriculum statement.
There are three major directions in this mathematics curriculum statement. It givesspecial emphasis to continuity and progression in learning in mathematics by specifyingclear learning goals expressed as achievement objectives at eight levels through all of theyears of schooling. The statement focuses on the importance of diagnostic and formativeassessment to enhance the teaching and learning process for all students. Finally, thecurriculum statement stresses the need for mathematics to be taught and learned withinthe context of problems which are meaningful to students and which lead tounderstanding of the way mathematics is applied in the world beyond school.
The Ministry is grateful to all who have contributed to the development of thiscurriculum statement, especially the contractor and the writers, the contract reviewcommittee, and the members of the policy advisory group all of whom gave freely of theirtime and experience.
Maris O’Rourke, PhDSecretary for Education

6
7
Introduction
Mathematics is a coherent, consistent, and growing body of concepts which makes useof specific language and skills to model, analyse, and interpret the world. Mathematicsprovides a means of communication which is powerful, concise, and unambiguous.
As a human endeavour, mathematics involves creativity and imagination in the discoveryof patterns of shape and number, the perceiving of relationships, the making of models,the interpretation of data, and the communication of emerging ideas and concepts.
The New Zealand Curriculum Framework includes mathematics as one of seven essentialareas of learning. Mathematical understanding and skills contribute to people’s sense ofself-worth and ability to control aspects of their lives. Everyone needs to developmathematical concepts and skills to help them understand and play a responsible role inour democratic society. Mathematics education aims to provide students with thoseskills and understandings.
The New Zealand Curriculum Framework also asserts the importance of eight essentialsets of skills: communication skills; numeracy skills; information skills; problem-solvingskills; self-management and competitive skills; social and co-operative skills; physicalskills; work and study skills.
The need for people to be numerate, that is, to be able to calculate, estimate, and usemeasuring instruments, has always been identified as a key outcome for education.Mathematics education aims to contribute to the development of the broad range ofnumeracy skills.
In an increasingly technological age, the need for innovation, and problem-solving anddecision-making skills, has been stressed in many reports on the necessary outcomes foreducation in New Zealand. Mathematics education provides the opportunity for studentsto develop these skills, and encourages them to become innovative and flexible problemsolvers.
The ability to communicate findings and explanations, and the ability to worksatisfactorily in team projects, have also been highlighted as important outcomes foreducation. Mathematics education provides many opportunities for students to developcommunication skills and to participate in collaborative problem-solving situations,thereby contributing to the development of many social and co-operative skills.
Increasingly, information is communicated through the use of data graphics. Thecommunication of information through graphics is particularly common in the massmedia. It is important that people can draw sensible conclusions from charts, tables, andgraphs of various kinds. At the same time, increasing numbers of occupations demandthe ability to collect data, to understand and use information technology for theorganisation and interpretation of data, and to present reports and summaries.Mathematics education gives young people the opportunity to develop informationskills through learning and practising data handling and data interpretation.
8
General Aims of Mathematics Education
Mathematics education aims to:
❏ help students to develop a belief in the value of mathematics and its usefulness tothem, to nurture confidence in their own mathematical ability, to foster a sense ofpersonal achievement, and to encourage a continuing and creative interest inmathematics;
❏ develop in students the skills, concepts, understandings, and attitudes which willenable them to cope confidently with the mathematics of everyday life;
❏ help students to develop a variety of approaches to solving problems involvingmathematics, and to develop the ability to think and reason logically;
❏ help students to achieve the mathematical and statistical literacy needed in asociety which is technologically oriented and information rich;
❏ provide students with the mathematical tools, skills, understandings, and attitudesthey will require in the world of work;
❏ provide a foundation for those students who may continue studies in mathematicsor other learning areas where mathematical concepts are central;
❏ help to foster and develop mathematical talent.

9
Achievement Aims of the MathematicsCurriculum
Mathematical Processes
The mathematics curriculum intended by this statement will provide opportunities forstudents to:
• develop flexibility and creativity in applying mathematical ideas and techniques tounfamiliar problems arising in everyday life, and develop the ability to reflectcritically on the methods they have chosen;
• become effective participants in problem-solving teams, learning to express ideas,and to listen and respond to the ideas of others;
• develop the skills of presentation and critical appraisal of a mathematicalargument or calculation, use mathematics to explore and conjecture, and learnfrom mistakes as well as successes;
• develop the characteristics of logical and systematic thinking, and apply these inmathematical and other contexts, including other subjects of the curriculum;
• become confident and competent users of information technology inmathematical contexts;
• develop the skills and confidence to use their own language, and the language ofmathematics, to express mathematical ideas;
• develop the knowledge and skills to interpret written presentations ofmathematics.
Number
The mathematics curriculum intended by this statement will provide opportunities forstudents to:
• develop an understanding of numbers, the ways they are represented, and thequantities for which they stand;
• develop accuracy, efficiency, and confidence in calculating — mentally, on paper,and with a calculator;
• develop the ability to estimate and to make approximations, and to be alert to thereasonableness of results and measurements.
Measurement
The mathematics curriculum intended by this statement will provide opportunities forstudents to:
• develop knowledge and understanding of systems of measurement and their useand interpretation;
• develop confidence and competence in using instruments and measuring devices;
• predict and calculate the effects of changes in variables and rate of change ofvariables on systems representable by simple mathematical models.

10
Geometry
The mathematics curriculum intended by this statement will provide opportunities forstudents to:
• gain a knowledge of geometrical relations in two and three dimensions, andrecognise and appreciate their occurrence in the environment;
• develop spatial awareness and the ability to recognise and make use of thegeometrical properties and symmetries of everyday objects;
• develop the ability to use geometrical models as aids to solving practical problemsin time and space.
Algebra
The mathematics curriculum intended by this statement will provide opportunities forstudents to:
• recognise patterns and relationships in mathematics and the real world, and beable to generalise from these;
• develop the ability to think abstractly and to use symbols, notation, and graphs anddiagrams to represent and communicate mathematical relationships, concepts,and generalisations;
• use algebraic expressions confidently to solve practical problems.
Statistics
The mathematics curriculum intended by this statement will provide opportunities forstudents to:
• recognise appropriate statistical data for collection, and develop the skills ofcollecting, organising, and analysing data, and presenting reports and summaries;
• interpret data presented in charts, tables, and graphs of various kinds;
• develop the ability to estimate probabilities and to use probabilities for prediction.
Development of Essential Skills through MathematicsThe key outcome of mathematics education is the development of the ability to applycertain of the essential skills described in The New Zealand Curriculum Framework —communication skills; numeracy skills; information skills; problem-solving skills; socialand co-operative skills; and work and study skills. The mathematical processes identifiedin this curriculum statement are the expression of these essential skills in mathematicalcontexts. This curriculum statement, therefore, suggests approaches to teaching,learning, and assessment which will give students the maximum possible opportunity todevelop the essential skills.
11
Approaches to Teaching and Learning inMathematics
Problem-solving ApproachA balanced mathematical programme includes concept learning, developing andmaintaining skills, and learning to tackle applications. These should be taught in such away that students develop the ability to think mathematically.
Students learn mathematical thinking most effectively through applying concepts andskills in interesting and realistic contexts which are personally meaningful to them. Thus,mathematics is best taught by helping students to solve problems drawn from their ownexperience.
Real-life problems are not always closed, nor do they necessarily have only one solution.Determining the best approximation to a solution, and finding the optimum way ofsolving a problem when several approaches are possible, are skills frequently required inthe workplace. Students need frequent opportunities to work with open-endedproblems. The solutions to problems which are worth solving seldom involve only oneitem of mathematical understanding or only one skill. Rather than remembering thesingle correct method, problem solving requires students to search the information forclues and to make connections to the various pieces of mathematics and other knowlegeand skills which they have learned. Such problems encourage thinking rather than mererecall.
Closed problems, which follow a well-known pattern of solution, develop only a limitedrange of skills. They encourage memorisation of routine methods rather thanconsideration and experimentation. While fluency with basic techniques is veryimportant, such routines only become useful tools when students can apply them torealistic problems.
The characteristics of good problem-solving techniques include both convergent anddivergent approaches. These include the systematic collection of data or evidence,experimentation (trial and error followed by improvement), flexibility and creativity,and reflection — that is, thinking about the process that has been followed andevaluating it critically.
Teachers can create opportunities for students to develop these characteristics byencouraging them to practise and learn such simple strategies as guessing and checking,drawing a diagram, making lists, looking for patterns, classifying, substituting,re-arranging, putting observations into words, making predictions, and developingproofs.
Learning to communicate about and through mathematics is part of learning to become amathematical problem solver and learning to think mathematically. Critical reflectionmay be developed by encouraging students to share ideas, to use their own words toexplain their ideas, and to record their thinking in a variety of ways, for example, throughwords, symbols, diagrams, and models.
The chance to look for problems as well as to solve them, to create and to produce ratherthan reproduce what already exists, is important for all students. Creativity in problemsolving is recognised as one of the basic traits that must be developed if outstandingachievement is to result, and it plays a major role in innovation, invention, and scientificdiscovery.

12
Catering for Individual NeedsIt is a principle of the New Zealand Curriculum Framework that all students should beenabled to achieve personal standards of excellence and that all students have a right tothe opportunity to achieve to the maximum of their potential. It is axiomatic in thiscurriculum statement that mathematics is for all students, regardless of ability,background, gender, or ethnicity.
Students of lower ability need to have the opportunity to experience a range ofmathematics which is appropriate to their age level, interests, and capabilities. Equally,students with exceptional ability in mathematics must be extended and not simplyexpected to repeat different permutations of work they have clearly mastered.
As new experiences cause students to refine their existing knowledge and ideas, so theyconstruct new knowledge. The extent to which teachers are able to facilitate this processsignificantly affects how well students learn. It is important that students are givenexplicit opportunities to relate their new learning to knowledge and skills which theyhave developed in the past. Factors such as out-of-school experience and language haveprofound effects on the way students learn mathematics.
In many cases in the past, students have failed to reach their potential because they havenot seen the applicability of mathematics to their lives and because they were notencouraged to connect new mathematical concepts and skills to experiences,knowledge, and skills which they already had. This has been particularly true for manygirls, and for many Maori students, for whom the contexts in which mathematics waspresented were irrelevant and inappropriate. These students have developed deeplyentrenched negative attitudes towards mathematics as a result.
An awareness of these issues has led to improved access for girls to mathematics, but theparticipation rate of female students in mathematics continues to be lower than that ofmale students at senior school level and beyond. This limits later opportunities for girlsand women.
The suggested learning experiences in this document include strategies that utilise thestrengths and interests that girls bring to mathematics. Techniques that help to involvegirls actively in the subject include setting mathematics in relevant social contexts,assigning co-operative learning tasks, and providing opportunities for extendedinvestigations.
The suggestions also describe experiences which will help girls develop greaterconfidence in their mathematical ability. Girls’ early success in routine mathematicaloperations needs to be accompanied by experiences which will help them developconfidence in the skills that are essential in other areas of mathematics. Girls need to beencouraged to participate in mathematical activities involving, for example, estimation,construction, and problems where there are any number of methods and where there isno obvious “right answer”.
It is particularly important that mathematical learning experiences for Maori studentsacknowledge the background experiences which have led to the formation of ideas andskills which those students already have. Maori students will be helped to achieve ifteachers acknowledge and value those ideas and experiences.

13
Traditional time-constrained pencil and paper tests have proved unreliable indicators ofMaori achievement in the past. Among the sample assessment activities, there areprocedures suggested which may be more appropriate for assessing Maori students. Inselecting assessment procedures, teachers should endeavour to ensure that all of thedesired objectives are evaluated and that the procedures which are selected are culturallyappropriate.
The development of more positive attitudes to mathematics and a greater appreciation ofits usefulness is the key to improving participation rates for all students.
Use of ResourcesApparatus
The importance of the use of apparatus to help students form mathematical concepts iswell established. Using apparatus provides a foundation of practical experience onwhich students can build abstract ideas. It encourages them to be inventive, helps todevelop their confidence, and encourages independence.
Junior school teachers are used to choosing an appropriate range of apparatus to focusstudents’ thinking on the concept to be developed and modifying the apparatus as thelearner’s understanding grows. Teachers know that students are capable of solving quitedifficult problems when they are free to use concrete apparatus to help them think theproblems through. Such an approach is equally valid with older students and should beused wherever possible.
At all levels, students should be introduced to new ideas by having their attention drawnto examples occurring in their natural environment, and then by modelling them withapparatus. For example, a child’s concept of “four” could be enriched by discussing thenumber of wheels on a car, legs on a table, or edges on a piece of paper. The child couldthen be encouraged to explore the idea further, using materials with which to make theirown models of “four”. Similarly, secondary students could be focused on the concept of“rate of change” by discussing, for example, that younger people grow faster than olderpeople, or by discussing the slope changes on nearby hills. Students could then modeluniform and non-uniform rate situations, using apparatus such as sand running throughan egg-timer or a ball rolling down a smooth slope.
Textbooks
Many textbooks contain material to provide students with practice and enrichment.Increasing numbers of books contain excellent ideas for problem-solving situationswhich develop mathematical skills and understandings. However, teachers must realisethat there are dangers in adhering too closely to any particular textbook. Many textscontain material not included in this curriculum statement, or have emphases which aredifferent from those advocated for New Zealand. In any event, teachers shouldcontinually re-evaluate the texts they are using in the light of the particular needs of theirstudents.

14
Technology
This curriculum statement assumes that both calculators and computers will be availableand used in the teaching and learning of mathematics at all levels. Instruction in thecorrect and appropriate use of calculators is particularly important.
Calculators, graphics calculators, and computers are learning tools which students canuse to discover and reinforce new ideas. Calculators are powerful tools for helpingstudents to discover numerical facts and patterns, and helping them to makegeneralisations about, for example, repeated operations. Graphics calculators, andcomputer software such as graphing packages and spreadsheets, are tools which enablestudents to concentrate on mathematical ideas rather than on routine mechanicalmanipulation, which often intrudes on the real point of particular learning situations.Computer programs, such as Logo, provide excellent environments for mathematicalexperimentation and open-ended problem solving.
15
Assessment and Evaluation in Mathematics
Evaluation of students’ achievement is an essential part of mathematics education.
Monitoring and evaluation are necessary to assess students’ readiness for new learning, togive teachers feedback on the success of their methods and approaches, and to assistplanning for new learning.
Evaluation includes diagnostic assessment procedures which enable teachers to discoverdifficulties that individual students may be having. Appropriate diagnostic assessmentmay reveal that the reason for a particular student’s lack of progress is a lack ofunderstanding achieved at some earlier time, and the difficulty may be relatively easilyaddressed. Diagnosis may also reveal that the student is very talented and is simply boredby lack of stimulation. Diagnostic assessments enable teachers to plan further learningactivities specifically designed to meet the learning needs of individual students.Worthwhile diagnosis is very often carried out by simple question and answer interactionin the classroom.
Assessment should focus both on what students know and can do, and on how they thinkabout mathematics. It should involve a broad range of mathematical tasks and problemsand require the application of a number of mathematical ideas. Skills assessed shouldinclude the ability to communicate findings, to present an argument, and to exploit anintuitive approach to a problem.
Assessment should, as far as possible, be integral to the normal teaching and learningprogramme. Continuing assessment as part of the teaching and learning programmeincreases the range and quality of assessment which can be carried out for gooddiagnosis, and avoids the artificial intrusion on learning and teaching time which isassociated with separate assessment sessions. Assessment should involve multipletechniques including written, oral, and demonstration formats. Group and teamactivities should also be assessed.
Teachers should avoid carrying out only tests which focus on a narrow range of skillssuch as the correct application of standard algorithms. While such skills are important, aconsequence of a narrow assessment regime which isolates discrete skills or knowledgeis that students tend to learn in that way. Mathematics becomes for them a set of separateskills and concepts with little obvious connection to other aspects of learning or to theirworld.
Assessment should also be undertaken to provide students and their parents with anindication of a student’s progress. In summarising the results of evaluations of students’achievement, teachers should report what students have been working on, what theyhave achieved, and how well they have achieved it. A grade, level, or mark alone isinsufficient.
16
Format and Presentation of this Document
Strands
There are six main achievement aims of the mathematics curriculum. Accordingly, thecurriculum statement is presented in six “strands” each of which reflects a particular aimof the curriculum. The strands are headed:
mathematical processes
number
measurement
geometry
algebra
statistics
This division is a convenient way of categorising the outcomes for mathematicseducation in schools. It emphasises that there are a number of aspects which are allequally important. The division does not mean that mathematics is expected to belearned in discrete “packages”. On the contrary, the mathematical processes strand isdeliberately intended to encourage teachers and students to make connections betweenthe other strands wherever possible.
Achievement Objectives by Levels
Each strand, other than “number”, is divided into eight levels describing thedevelopment of the mathematics curriculum from junior primary school (Year 1) toseventh form (Year 13).
A number of achievement objectives are described in each strand, and at each level. Theobjectives define what students should be able to achieve after appropriate learningexperiences in mathematics. They define the progression of learning outcomes which isthe core of this curriculum statement in mathematics.
At each level the objectives are quite broad. It is expected that, in assessing students’progress, teachers will make judgments as to an individual’s degree of achievement ofparticular objectives, and will include commentary on that degree of achievement whenreporting to parents.
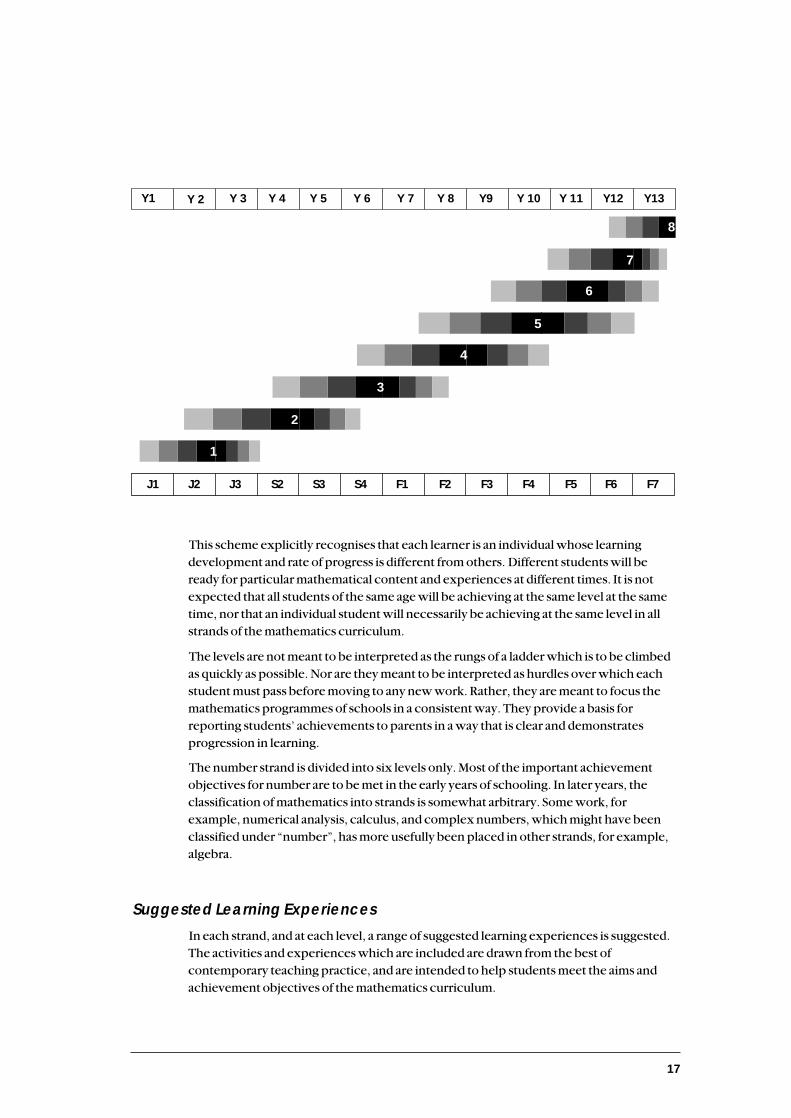
The number of levels has been chosen for consistency with the New Zealand CurriculumFramework. The division of the school mathematics curriculum into eight levels does notmean that there are eight well-identified stages, which learners pass through in thedevelopment of mathematical understanding. However, it is accepted that someconcepts are better introduced to older students, and that the effective learning of someideas depends on a prior understanding of other ideas. The judgment of experiencedteachers as to what students can do at various ages has been combined with recentresearch into mathematical learning to place material into levels. The generalrelationship between the levels and years at school is described in the diagram on thefollowing page.
17
3
5
8
J1 J2 J3 S2 S3 S4 F1 F2 F3 F4 F5 F6 F7
Y1 Y 2 Y 3 Y 4 Y 5 Y 6 Y 7 Y 8 Y9 Y 10 Y 11 Y12 Y13
1
2
4
6
7
8
This scheme explicitly recognises that each learner is an individual whose learningdevelopment and rate of progress is different from others. Different students will beready for particular mathematical content and experiences at different times. It is notexpected that all students of the same age will be achieving at the same level at the sametime, nor that an individual student will necessarily be achieving at the same level in allstrands of the mathematics curriculum.
The levels are not meant to be interpreted as the rungs of a ladder which is to be climbedas quickly as possible. Nor are they meant to be interpreted as hurdles over which eachstudent must pass before moving to any new work. Rather, they are meant to focus themathematics programmes of schools in a consistent way. They provide a basis forreporting students’ achievements to parents in a way that is clear and demonstratesprogression in learning.
The number strand is divided into six levels only. Most of the important achievementobjectives for number are to be met in the early years of schooling. In later years, theclassification of mathematics into strands is somewhat arbitrary. Some work, forexample, numerical analysis, calculus, and complex numbers, which might have beenclassified under “number”, has more usefully been placed in other strands, for example,algebra.
Suggested Learning ExperiencesIn each strand, and at each level, a range of suggested learning experiences is suggested.The activities and experiences which are included are drawn from the best ofcontemporary teaching practice, and are intended to help students meet the aims andachievement objectives of the mathematics curriculum.
18
There is not necessarily an exact match between the suggested learning experiences andthe achievement objectives at each level. In some cases, this is because the learningexperiences described contribute to concepts and skills which will take considerabletime to develop, and appropriate achievement objectives are not described until laterlevels. At the same time, all of the suggested learning experiences contribute to thedevelopment of the broader aims of the curriculum and thus, for some, there may not bespecifically associated achievement objectives.
The suggested learning experiences are, nevertheless, pointers only. It is not intendedthat the activities described in this document should limit the way teachers choose toteach mathematics. Indeed, teachers are encouraged to use their own judgment indesigning courses to provide their students with mathematical experiences which willenable the students to achieve the broader aims and achievement objectives of thecurriculum. Teachers in, for example, bilingual schools or Kura Kaupapa Maori maychoose to offer mathematics in contexts which provide quite different activities andexperiences.
The suggested learning experiences are carefully worded in active terms. This is toemphasise that mathematics is most effectively learned through students’ activeparticipation in mathematical situations, rather than through passive acceptance andrepetition of knowledge.
Sample Assessment ActivitiesTraditionally, assessment in mathematics has been focused on a quite narrow range ofprocedures. Procedures such as pencil and paper tests of algorithmic skills do not alwaysreveal students’ difficulties, nor do they allow assessment of the full range of students’achievements.
This curriculum statement provides, at each level in each strand, examples of activities inwhich teachers might engage students to assess their current level of achievement. Anassessment programme modelled on these examples will help teachers to plan the nextstages of learning for their students.
The models illustrate tasks that can be used to assess a full range of accomplishments,including, for example, the ability to collect and summarise data, the ability tocommunicate findings, the ability to present an argument, and the ability to exploit anintuitive approach to a problem. The suggestions include multiple assessmenttechniques including written, oral, and demonstration formats, which should be used inaddition to more traditional tests and assignments. Suggestions for group and teamassessments are included.
The activities illustrate assessment techniques which are not disruptive to normalclassroom activities — they could be carried out as an integral part of the teachingprogramme rather than at times specifically set aside for “tests”. Assessment andevaluation strategies of this kind require teachers to make systematic observations ofstudents at work, and to record their observations carefully.
19
As each achievement objective in this statement is capable of being achieved at a range ofstandards, teachers should choose assessment and reporting methods which reveal astudent’s degree of attainment of the objectives.
The few assessment activities suggested in the statement are exemplars which teacherscould imitate in developing their own assessment programme. They provide for teachersa selection of activities which allow for observations of various manifestations ofstudents’ achievement. While it is expected that teachers will use the tasks described asmodels for developing their own assessment tasks and procedures, they are free to usedifferent assessment methods if they wish, and are encouraged to do so. For example,teachers in bilingual schools or Kura Kaupapa Maori may decide to use alternativemethods to assess students’ progress towards the achievement objectives.
The examples do not cover all of the objectives of the curriculum. A comprehensiveassessment programme remains the responsibility of the teacher.✽
Development BandSome students develop faster in all aspects of mathematics than most of their peer group.Other students reach a particular achievement level in one strand or topic sooner orfaster than most of their peer group without necessarily being equally competent in allother strands at the same level. A levels structure may be thought to imply that fasterstudents should automatically be accelerated to the next level. This is not necessarily so,nor is it the aim of this curriculum. Teachers should carefully appraise the experienceand needs of students before deciding to move them to the next level.
It is very important, however, that students do not have their mathematical developmentinhibited by, for example, repeating work which they have clearly mastered.
The mathematics contained in the suggested learning experiences at any level is only asubset of the mathematics which students could possibly learn. Faster students can beextended in their mathematical experience without necessarily accelerating them to ahigher level, which for many students may itself limit the extent of their learning.
The intention of the development band is to encourage teachers to offer broader, richer,and more challenging mathematical experiences to faster students. Work from thedevelopment band should allow better students to investigate whole new topics whichwould not otherwise be studied and to work at a higher conceptual level. Talentedstudents should have their interest in mathematical ideas further stimulated and theirunderstanding of the nature of mathematics deepened. Teaching approaches which maybuild on the interest of students include: allowing students themselves to select the topicor content they wish to pursue and to set their own goals; allowing the opportunity forindividual and independent study, perhaps using a contract plan; and encouraging accessto a broader range of higher level resources.
✽ Each example is accompanied by one or more objectives which could be assessed by the activity described.
Because the assessable objectives may come from any strand or lower level their origin is indicated. Forexample, (N5) signifies “Number, Level 5”. Equally, the entire objective may not be applicable for eachexample. In such cases, an ellipsis (…) replaces the inappropriate text.
20
The development band must not be considered as an optional extra or simply a rewardfor good work. Students have a right to the opportunity to extend their mathematicalknowledge and power. Accordingly, teachers have a responsibility to provideenrichment opportunities to students, and a responsibility to report to parents in a waythat acknowledges the students’ accomplishments.
This statement suggests some development band activities — students and teachers willidentify many more fields worth pursuing. A valid development band activity is asignificant new piece of work, not merely an extra “extension example” or set ofexamples. Teachers of senior secondary students will need to establish clear criteria forthe evaluation of development band work and a system which allows some basis forcomparability between the work of different students. Students might undertake “units”of development band work, for example.
Development band activities should include a measure of self-assessment. Studentsshould be encouraged to set their own goals in this work and to be self-critical. Theyshould keep a portfolio of their development activities, including the goals they had set,their assessments, and their teachers’ assessments, as a record of their extendedprogress. Possession of the portfolio should, among other things, ensure that students donot repeat development work in later years.
21
Courses for Senior Secondary School
The motivations of students studying mathematics in senior secondary school range fromthe necessity to consolidate more basic mathematical skills, through the requirement toestablish vocationally oriented mathematical skills, to the intention to go on to tertiarystudies involving some form of mathematics. It is expected that schools will constructcourses according to the particular needs of these diverse groups of students.
The School Certificate examination will be based on objectives up to level 6.
The New Zealand Qualifications Authority is expected to credit units of learning forNational Certificate Qualification based on the level 6, level 7, and level 8 objectives inthis statement. Units based on objectives at level 6 and lower will cater for senior schoolstudents for whom an academic course of study based on levels 7 and 8 is notappropriate.
The Universities Bursary examinations will be based on appropriate subsets of theobjectives up to level 8.✽
It is not expected that all sixth and seventh form students will do all of the mathematicssuggested for levels 7 and 8 in this statement.
✽ The prescriptions for the Universities Bursary examinations are published by the New Zealand Qualifications
Authority.

22
23
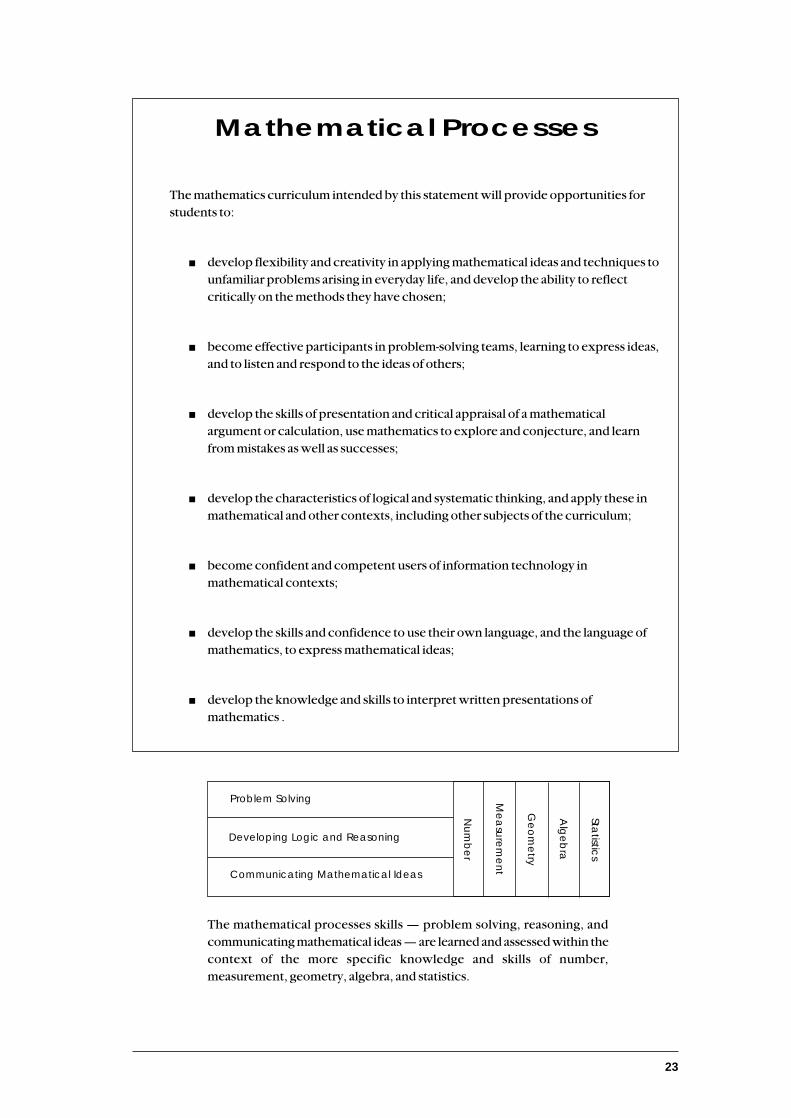
Mathematical Processes
The mathematics curriculum intended by this statement will provide opportunities forstudents to:
■ develop flexibility and creativity in applying mathematical ideas and techniques tounfamiliar problems arising in everyday life, and develop the ability to reflectcritically on the methods they have chosen;
■ become effective participants in problem-solving teams, learning to express ideas,and to listen and respond to the ideas of others;
■ develop the skills of presentation and critical appraisal of a mathematicalargument or calculation, use mathematics to explore and conjecture, and learnfrom mistakes as well as successes;
■ develop the characteristics of logical and systematic thinking, and apply these inmathematical and other contexts, including other subjects of the curriculum;
■ become confident and competent users of information technology inmathematical contexts;
■ develop the skills and confidence to use their own language, and the language ofmathematics, to express mathematical ideas;
■ develop the knowledge and skills to interpret written presentations ofmathematics .
Statistic
s
Alg
eb
ra
Ge
om
etry
Me
asu
rem
en
t
Nu
mb
er
Developing Logic and Reasoning
The mathematical processes skills — problem solving, reasoning, andcommunicating mathematical ideas — are learned and assessed within thecontext of the more specific knowledge and skills of number,measurement, geometry, algebra, and statistics.
Communicating Mathematical Ideas
Problem Solving
24
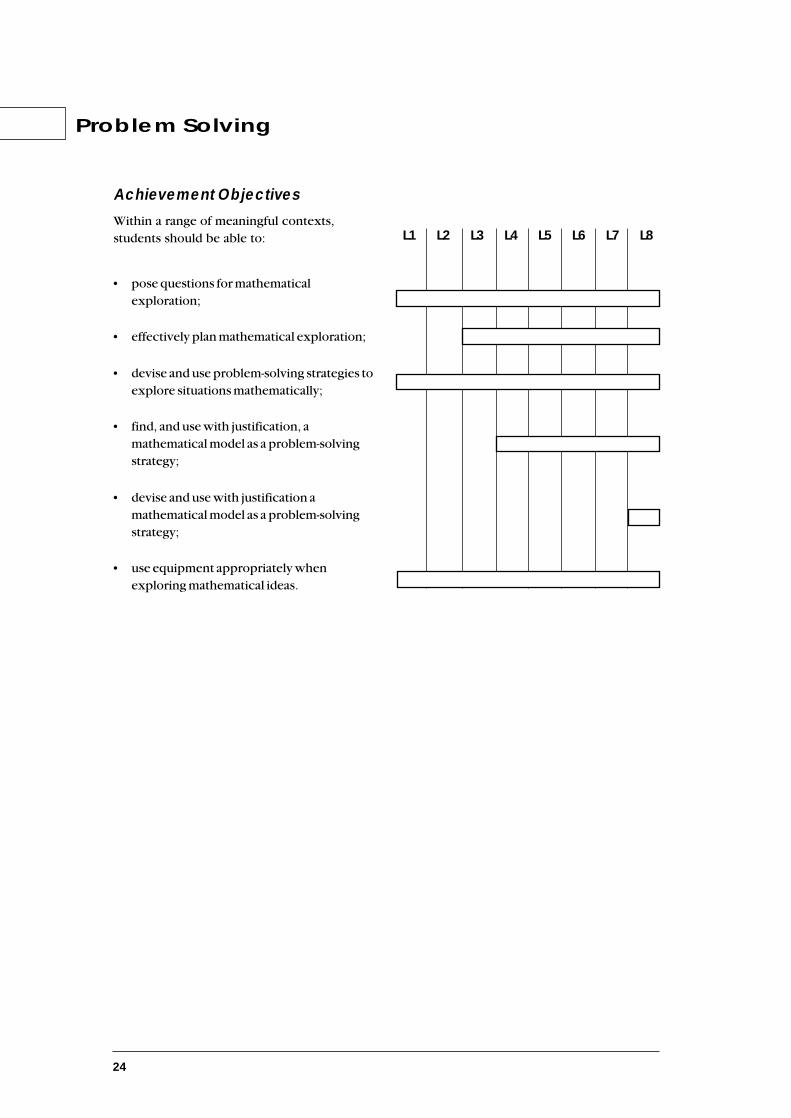
Achievement ObjectivesWithin a range of meaningful contexts,students should be able to:
Problem Solving
• pose questions for mathematicalexploration;
• effectively plan mathematical exploration;
• devise and use problem-solving strategies toexplore situations mathematically;
• find, and use with justification, amathematical model as a problem-solvingstrategy;
• devise and use with justification amathematical model as a problem-solvingstrategy;
• use equipment appropriately whenexploring mathematical ideas.
L1 L2 L3 L4 L5 L6 L7 L8
25
L1 L2 L3 L4 L5 L6 L7 L8
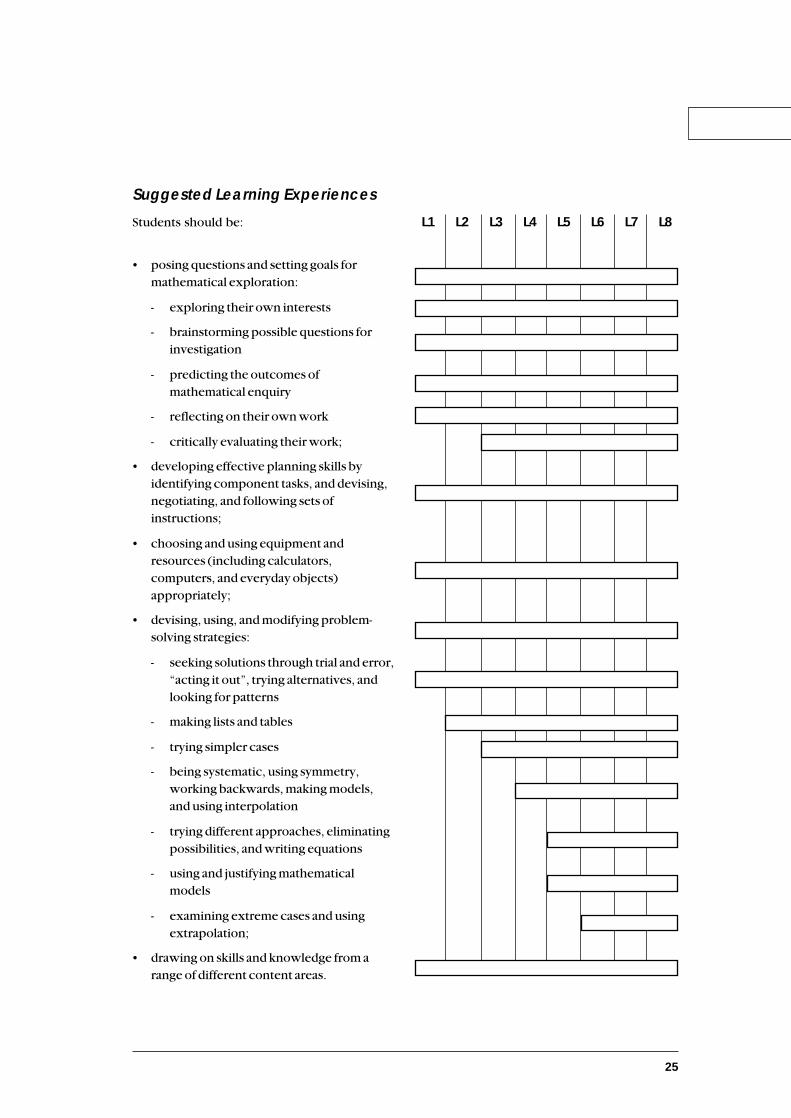
Suggested Learning Experiences
Students should be:
• posing questions and setting goals formathematical exploration:
- exploring their own interests
- brainstorming possible questions forinvestigation
- predicting the outcomes ofmathematical enquiry
- reflecting on their own work
- critically evaluating their work;
• developing effective planning skills byidentifying component tasks, and devising,negotiating, and following sets ofinstructions;
• choosing and using equipment andresources (including calculators,computers, and everyday objects)appropriately;
• devising, using, and modifying problem-solving strategies:
- seeking solutions through trial and error,“acting it out”, trying alternatives, andlooking for patterns
- making lists and tables
- trying simpler cases
- being systematic, using symmetry,working backwards, making models,and using interpolation
- trying different approaches, eliminatingpossibilities, and writing equations
- using and justifying mathematicalmodels
- examining extreme cases and usingextrapolation;
• drawing on skills and knowledge from arange of different content areas.

26
L1 L2 L3 L4 L5 L6 L7 L8
Developing Logic and Reasoning
Achievement Objectives
Within a range of meaningful contexts,students should be able to:
• classify objects;
• classify objects, numbers, and ideas;
• interpret information and results in context;
• make conjectures in a mathematicalcontext;
• generalise mathematical ideas andconjectures;
• prove or refute mathematical conjectures;
• critically follow a chain of reasoning;
• use words and symbols to describe andcontinue patterns;
• use words and symbols to describe andgeneralise patterns.
27
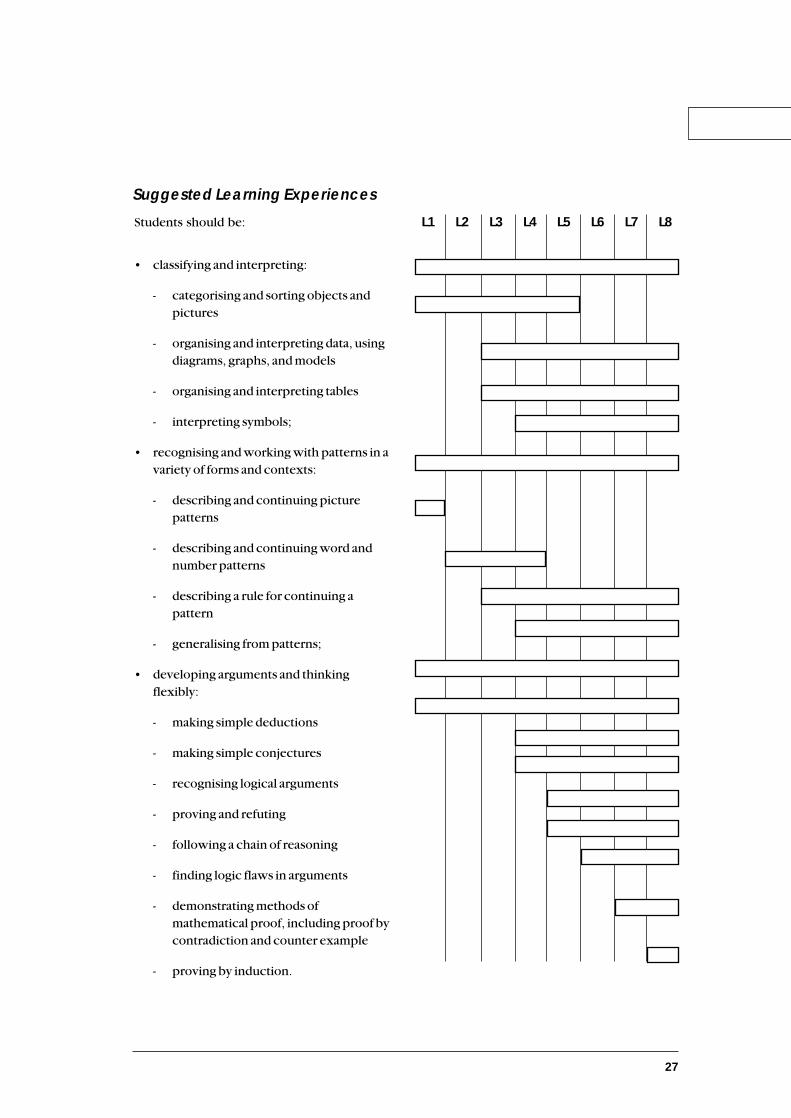
Suggested Learning Experiences
Students should be:
• classifying and interpreting:
- categorising and sorting objects andpictures
- organising and interpreting data, usingdiagrams, graphs, and models
- organising and interpreting tables
- interpreting symbols;
• recognising and working with patterns in avariety of forms and contexts:
- describing and continuing picturepatterns
- describing and continuing word andnumber patterns
- describing a rule for continuing apattern
- generalising from patterns;
• developing arguments and thinkingflexibly:
- making simple deductions
- making simple conjectures
- recognising logical arguments
- proving and refuting
- following a chain of reasoning
- finding logic flaws in arguments
- demonstrating methods ofmathematical proof, including proof bycontradiction and counter example
- proving by induction.
L1 L2 L3 L4 L5 L6 L7 L8

28
L1 L2 L3 L4 L5 L6 L7 L8Within a range of meaningful contexts,students should be able to:
• use their own language, and mathematicallanguage and diagrams, to explainmathematical ideas;
• devise and follow a set of instructions tocarry out a mathematical activity;
• record and talk about the results ofmathematical exploration;
• record, in an organised way, and talk aboutthe results of mathematical exploration;
• record information in ways that are helpfulfor drawing conclusions and makinggeneralisations;
• report the results of mathematicalexplorations concisely and coherently.
Communicating Mathematical Ideas
Achievement Objectives

29
Students should be:
• recording in words, pictures, and concretematerials:
- presenting diagrams (charts and graphs)
- using symbols appropriately
- displaying data in tables;
• presenting mathematical ideas and results toothers:
- explaining results in words and pictures
- reporting in words and diagrams
- making written and oral reports
- reporting in formal mathematicallanguage;
• explaining, discussing, and presentingarguments:
- making clear statements
- making logical and concise statementsand deductions;
• working co-operatively as part of a group bylistening attentively, generating ideas, andparticipating in reflective discussion.
Suggested Learning ExperiencesL1 L2 L3 L4 L5 L6 L7 L8

30
31
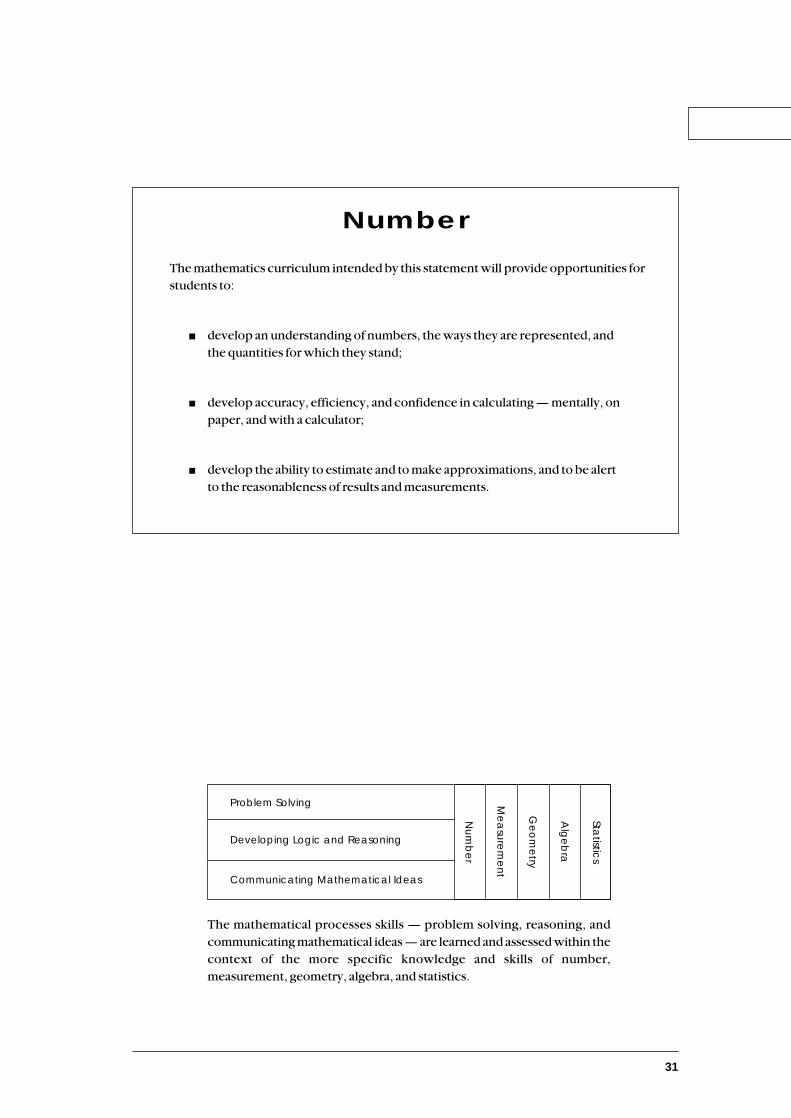
Number
The mathematics curriculum intended by this statement will provide opportunities forstudents to:
■ develop an understanding of numbers, the ways they are represented, andthe quantities for which they stand;
■ develop accuracy, efficiency, and confidence in calculating — mentally, onpaper, and with a calculator;
■ develop the ability to estimate and to make approximations, and to be alertto the reasonableness of results and measurements.
The mathematical processes skills — problem solving, reasoning, andcommunicating mathematical ideas — are learned and assessed within thecontext of the more specific knowledge and skills of number,measurement, geometry, algebra, and statistics.
Statistic
s
Alg
eb
ra
Ge
om
etry
Me
asu
rem
en
t
Nu
mb
er
Developing Logic and Reasoning
Communicating Mathematical Ideas
Problem Solving
32
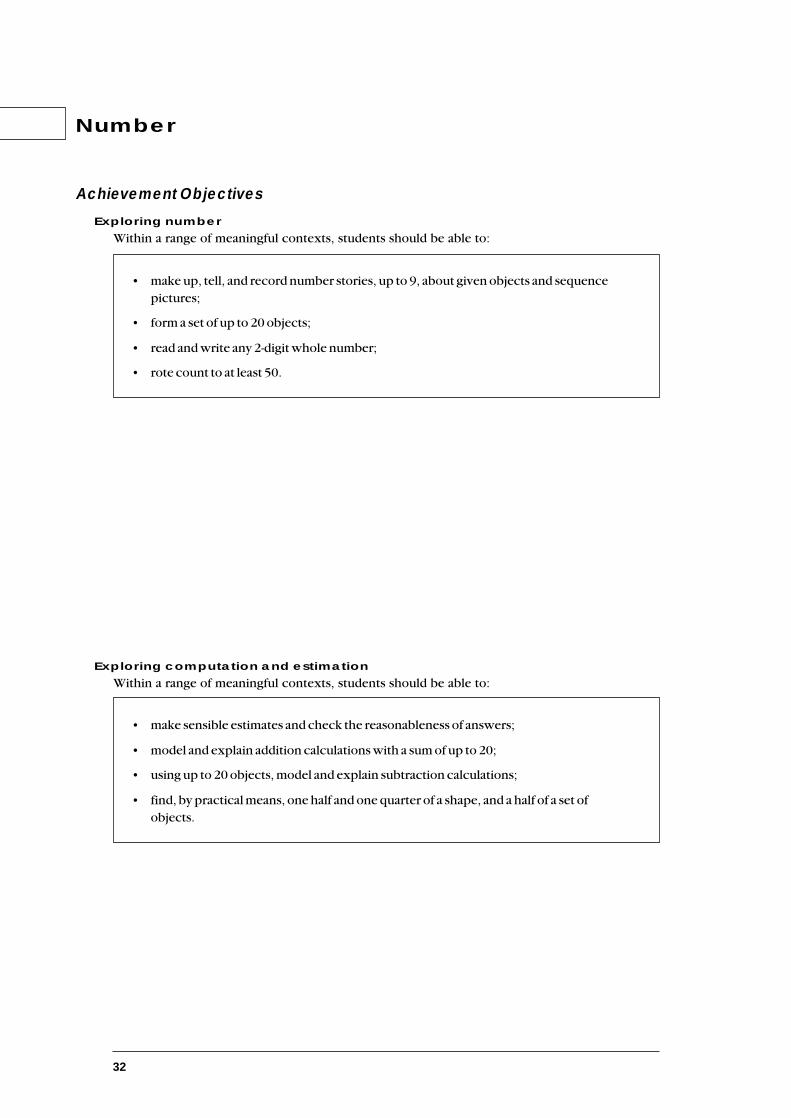
Number
Achievement Objectives
Exploring number
Within a range of meaningful contexts, students should be able to:
• make up, tell, and record number stories, up to 9, about given objects and sequencepictures;
• form a set of up to 20 objects;
• read and write any 2-digit whole number;
• rote count to at least 50.
Exploring computation and estimation
Within a range of meaningful contexts, students should be able to:
• make sensible estimates and check the reasonableness of answers;
• model and explain addition calculations with a sum of up to 20;
• using up to 20 objects, model and explain subtraction calculations;
• find, by practical means, one half and one quarter of a shape, and a half of a set ofobjects.
33
Level 1
Suggested Learning ExperiencesExploring number
Students should be:
• developing a number sense by exploring number in the contexts of their ownexperiences and the world around them;
• finding examples of numbers in their everyday lives and developing numeralrecognition;
• counting, ordering, and comparing numbers up to 5 (and later up to 9, and then up to20);
• making and talking about sets up to 5 (and later up to 9, and then up to 20);
• exploring the number system from zero to 99 and beyond;
• rote counting to 99 and counting forwards and backwards to and from 99 in 1s, 2s, 5s,and 10s (both orally and using a calculator);
• exploring the idea of place value through comparing number patterns in 10s. Forexample: 3, 13, 23, 33, ... 93 in English, Maori,✽ and symbols;
• using money ($10 notes and $1 coins) and structured materials to represent numbers;
• exploring the meaning of digits in any 2-digit whole number;
• exploring the idea of a fraction;
• finding halves and quarters of everyday objects, common shapes, and sets of objects,using practical methods.
Exploring computation and estimation
Students should be:• developing number sense by exploring estimation and computation, in the context of
their own experiences and the world around them, using concrete materials, mentalstrategies, and calculators;
• joining 2 or more sets with a combined total of up to 9, and later 20;
• separating a set of up to 9 objects (later up to 20 objects) into two or more parts;
• making up, telling, and recording number stories about objects and sequencepictures;
• developing mental strategies for adding numbers of objects up to a total of 9 and later20;†
• developing mental strategies for subtracting numbers of objects from up to 20;†
• making sensible estimates and checking the reasonableness of answers.
✽ The Maori representations of 2-digit numbers are particularly useful for reinforcing place-value notions. Forexample, “rua tekau ma wha” translates to “two tens and four” (24).† It is not suggested that students rote-learn standard algorithms for addition or subtraction at this level.
34
Number
Sample Assessment ActivitiesThese assessment activities are examples of the kinds of tasks which teachers could devisefor their own assessment programme.
• Students make up and record in a variety of ways (with models, charts, displays)number stories which may arise from given sets of objects or “sequence pictures”and talk about each recording they make.
Using this example, teachers could assess students’ ability to:- make up, tell, and record number stories, up to 9, about given objects and
sequence pictures (N1);- collect everyday objects, sort them into categories, count the number of objects in
each category, and display and discuss the results (S1);- use their own language, and mathematical language and diagrams, to explain
mathematical ideas (MP1).
• Students:
- model 2-digit numbers, using grouped discrete objects, place-value blocks (tensand ones), and money ($10 notes and $1 coins);
- say or read, in English and in Maori, number words for a variety of 2-digitnumbers;
- use both pencil and paper, and a calculator, to show 2-digit numbers presented
orally.
Using this example, teachers could assess students’ ability to:- read and write any 2-digit whole number (N1);- interpret information and results in context (MP1);
- devise and use problem-solving strategies to explore situations mathematically(MP1).
• Students:
- working in a group of four, share a lunch of a piece of fruit and a sandwich bydividing them into halves and quarters, and share packets of raisins andcontainers of fruit drink. They record their lunch menu, using the terms halfand quarter;
- show a half and a quarter on a geoboard in as many ways as possible, andrecord the results on dot paper;
- fold paper shapes — squares, oblongs (non-square rectangles), circles, and soon — into halves and quarters. Talk about the fractions.
Using this example, teachers could assess students’ ability to:- find, by practical means, one half and one quarter of a shape and half of a set of
objects (N1);
- record and talk about the results of mathematical exploration (MP1).

35
Sample Development Band Activities• Students record numbers they notice in their environment within a set time, for
example, a school day. Students should make up a diary record of such discoveries,including where the number was found and any information concerning the numberor its associated set.
• Students create their own number stories and record them in as many different waysas they can. They comment on the advantages/disadvantages of different ways ofrecording.
• Students devise practical number games involving estimation to share with others.For example, one partner gives two numbers and the other states the sum ordifference and then explains the method used. They check the answer, usingequipment.
• Given answers, students suggest appropriate questions.
Level 1
36
Number
Achievement Objectives
Exploring number
Within a range of meaningful contexts, students should be able to:
• read any 3-digit whole number;
• explain the meaning of the digits in 2- or 3-digit whole numbers;
• order any set of three or more whole numbers (up to 99);
• write and solve comparison problems;
• write and solve story problems which involve halves, quarters, thirds, and fifths.
Exploring computation and estimation
Within a range of meaningful contexts, students should be able to:
• make sensible estimates and check the reasonableness of answers;
• recall the basic addition and subtraction facts;
• mentally perform calculations involving addition and subtraction;
• demonstrate the ability to use the multiplication facts;
• write and solve story problems which involve whole numbers, using addition,subtraction, multiplication, or division;
• write and solve story problems which require a choice of any combination of the fourarithmetic operations.
37
Suggested Learning ExperiencesExploring number
Students should be:
• developing a number sense by exploring number in the context of their everydayexperiences and the world around them;
• counting, recording, ordering, and comparing numbers;
• investigating number patterns with and without the aid of a calculator;
• exploring the number system from 0 to 1000 and beyond, using a calculator,structured materials, money, and measurement;
• exploring place value by using grouped discrete objects, structured materials,measurement, money, and a calculator, and by counting in Maori✽;
• exploring the place of number within their own cultures;
• investigating odd and even numbers;
• investigating ways (including using a calculator) to rename numbers. For example:
10 = 6 + 4 53 = 50 + 3 167 = 100 + 67
= 2 + 2 + 2 + 2 + 2 = 40 + 13 = 100 + 60 + 7
= 1 + 2 + 3 + 4, etc. = 33 + 15 + 5, etc. = 150 + 17, etc.;
• exploring number patterns showing multiples;
• exploring fractions (halves, quarters, thirds, fifths).
Level 2
Exploring computation and estimation
Students should be:• exploring estimation and computation in the context of their everyday lives;
• working with numbers 0 to 1000 and beyond;
• performing additions and subtractions, using pencil and paper, and calculator, andmaking up and telling number stories about their calculations;
• investigating the special properties of 0, under addition and subtraction, and of 1,under multiplication and division;
• devising strategies to help the memorising of the addition, subtraction,multiplication, and division facts;
• developing instant recall of basic addition and subtraction facts through a programmeof regular maintenance;
• devising and refining strategies for estimating and checking the reasonableness ofaddition, subtraction, multiplication, and division calculations;
• devising and extending mental strategies for addition, subtraction, multiplication,and division;
✽ The Maori representations of 2-digit numbers are particularly useful for reinforcing place-value notions. Forexample, “rua tekau ma wha” translates to “two tens and four” (24).
38
Number
• solving comparison problems (how many more than or less than) in a story context;
• adding and subtracting money and measurements;
• exploring division as sharing;
• using a calculator and concrete materials to develop the meaning of multiplication asrepeated addition, and division as repeated subtraction;
• developing recall of multiplication facts through a programme of regularmaintenance;
• using a calculator to investigate answers to division problems;
• writing and solving story problems (including those involving money andmeasurements) which involve combinations of the 4 operations, using a calculatorwhere necessary;
• recognising that taking a fraction of a set is a sharing (dividing) operation.
Sample Assessment ActivitiesThese assessment activities are examples of the kinds of tasks which teachers could devisefor their own assessment programme.
• Students report on an investigation of number and operations, using a calculator.For example, given three digits, say 6, 7, and 9, and one multiplication sign, use acalculator to determine which arrangement gives the largest product(for example, 6, 7, 9 gives 67 x 9, 97 x 6, etc.).
Using this example, teachers could assess students’ ability to:- explain the meaning of the digits in 2- or 3-digit whole numbers (N2);- devise and use problem-solving strategies to explore situations mathematically
(MP2);
- record and talk about the results of mathematical exploration (MP2).
• Students resolve comparison problems arising in familiar contexts. For example,they:
- investigate the number of pets per household in the class, graph the results,and answer questions such as, “Marama has 4 pets. One of her pets had babiesand Marama now has 7 pets. How many babies did her pet have?”, “Peta has 7pets. Alice has 11. How many fewer does Peta have than Alice?”, “Ripeka has 9pets. This is 6 fewer than Olivia’s number of pets. How many pets has Olivia?”“Toni has 13 pets. She has 5 more than Jenny. How many pets does Jennyhave?”;
- compare numbers of people in families using the words “more than”, “fewerthan”, and “difference”, and record the findings on posters.
Using this example, teachers could assess students’ ability to:- write and solve comparison problems (N2);- devise and use problem-solving strategies to explore situations mathematically
(MP2);

39
- record and talk about the results of mathematical exploration (MP2).
• Students use a calculator to solve story problems such as the following:
- Huia is 8 years old today. She knows that there are 365 days in a year. Howmany days old is Huia? How many weeks old (hours? minutes?) is Huia?
- Make up multiplication stories with an answer (product) of, for example, 24.
- Write division stories with an answer of, for example, 2.
Using this example, teachers could assess students’ ability to:
- write and solve story problems which involve whole numbers, using addition,subtraction, multiplication, or division (N2);
- make sensible estimates and check the reasonableness of answers (N2);- devise and use problem-solving strategies to explore situations mathematically
(MP2);- record and talk about the results of mathematical exploration (MP2).
• Students estimate and calculate in unfamiliar contexts. For example, if A is worth1, B is worth 2, etc., find the word with fewer than 5 letters where the sum of theletters has the greatest value.
Using this example, teachers could assess students’ ability to:- devise and use problem-solving strategies to explore situations mathematically
(MP2);
- interpret information and results in context (MP2).
• Students solve simple fraction problems such as “A third of a class of 27 go to aculture group practice. How many is this?”
Using this example, teachers could assess students’ ability to:- write and solve story problems which involve halves, quarters, thirds, and fifths
(N2);- devise and use problem-solving strategies to explore situations mathematically
(MP2);- record and talk about the results of mathematical exploration (MP2).
Sample Development Band Activities• Students invent, and make up rules for, games based on a set of numeral cards or a
calculator.
• Students document and explain how the use of Maori language supports the idea ofplace value.
• Students explore numbers in other bases, say base 2.
Level 2
40
Number
Achievement ObjectivesExploring number
Within a range of meaningful contexts, students should be able to:
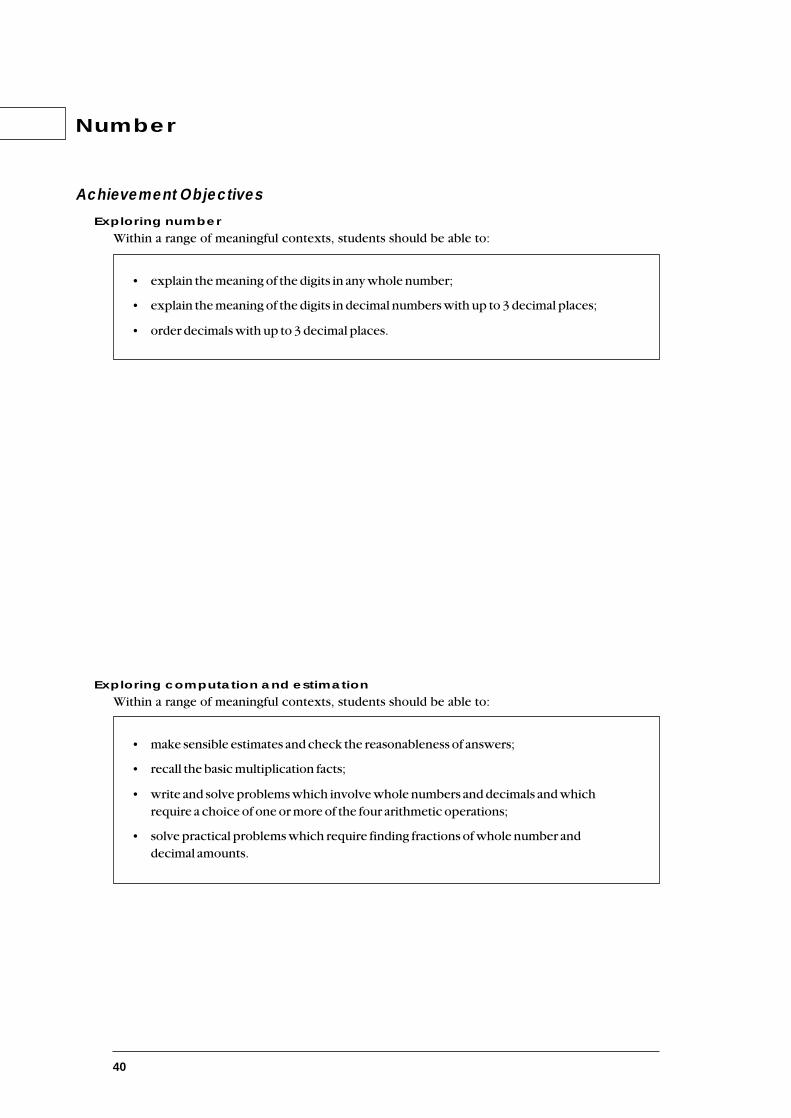
• explain the meaning of the digits in any whole number;
• explain the meaning of the digits in decimal numbers with up to 3 decimal places;
• order decimals with up to 3 decimal places.
Exploring computation and estimation
Within a range of meaningful contexts, students should be able to:
• make sensible estimates and check the reasonableness of answers;
• recall the basic multiplication facts;
• write and solve problems which involve whole numbers and decimals and whichrequire a choice of one or more of the four arithmetic operations;
• solve practical problems which require finding fractions of whole number anddecimal amounts.

41
Level 3
Suggested Learning ExperiencesExploring number
Students should be:
• developing a number sense by exploring number in the context of their everydayexperiences and the world around them, and using numbers to explore events intheir own lives;
• extending their understanding of the number system;
• using calculators to develop an understanding of whole numbers beyond 1000;
• exploring the use of fractions and decimals in society;
• developing meaning for decimal place values, using concrete models and a calculator,for example, using place-value blocks, repeated division by 2 leading to 4, 2, 1, 0.5,0.25, 0.125, 0.0625, ...
• saying decimals, for example, 1.25 is one and twenty-five hundredths, or one and twotenths and five hundredths, or one hundred and twenty-five hundredths; 1.25 is read“one point two five”, not “one point twenty-five”;
• writing decimals in words and symbols;
• using calculators and number lines (rulers and other linear scales) to compare andorder decimals;
• exploring number patterns which involve both whole numbers and decimals;
• investigating possible ways of renaming numbers using decimals. For example,
1 = 0.4 + 0.6= 0.2 + 0.2 + 0.2 + 0.2 + 0.2= 0.12 + 0.88= 0.346 + 0.237 + 0.417= ...
Exploring computation and estimation
Students should be:• developing a number and computation sense by exploring estimation and
computation in the context of their everyday lives;
• maintaining addition and subtraction facts;
• demonstrating the instant recall of basic multiplication facts;
• working with whole numbers and decimals;
• using a calculator and mental methods to add or subtract numbers;
• making sensible estimates and checking the reasonableness of answers;
• writing and solving story problems involving one or more of the four arithmeticoperations;
• using calculators, concrete materials, and mental methods to find fractions of wholenumber and decimal amounts (including money and measurements).
42
Number
Sample Assessment ActivitiesThese assessment activities are examples of the kinds of tasks which teachers could devisefor their own assessment programme.
• Students:
- explain in their own words which four in 0.444 has the greatest value;
- working in groups, measure their heights in metres (to 2 decimal places) andorder the group from tallest to shortest;
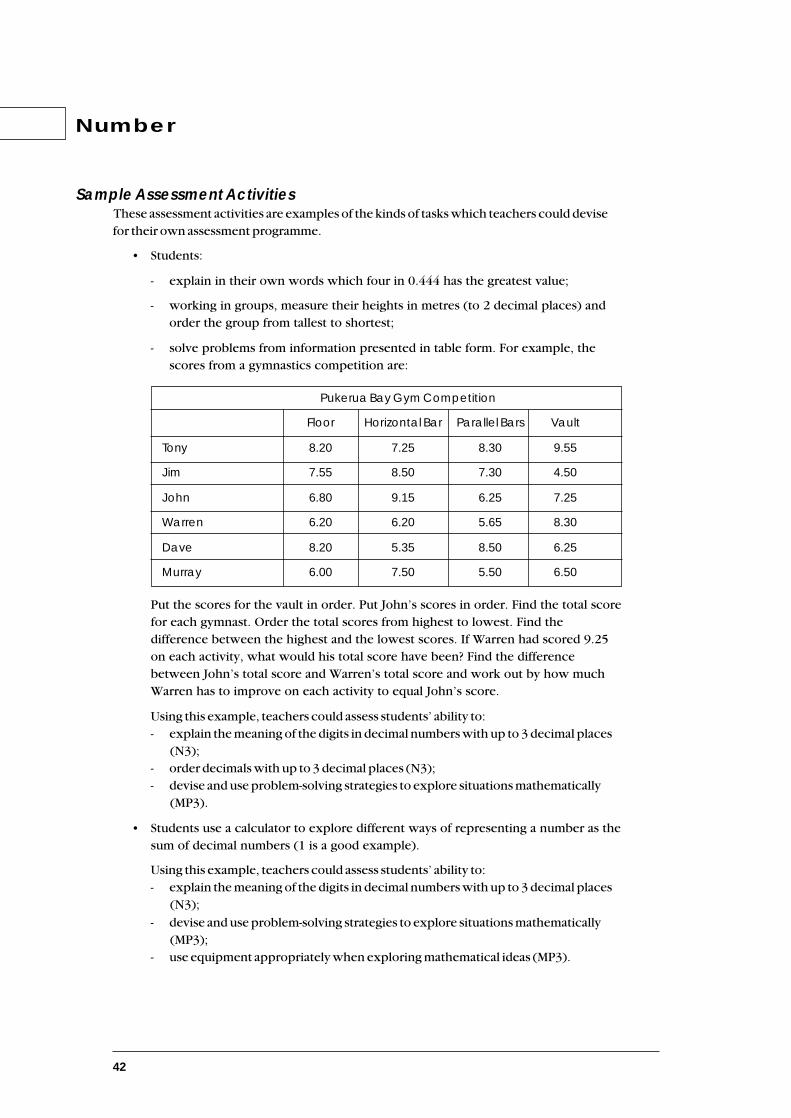
- solve problems from information presented in table form. For example, thescores from a gymnastics competition are:
Pukerua Bay Gym Competition
Floor Horizontal Bar Parallel Bars Vault
Tony 8.20 7.25 8.30 9.55
Jim 7.55 8.50 7.30 4.50
John 6.80 9.15 6.25 7.25
Warren 6.20 6.20 5.65 8.30
Dave 8.20 5.35 8.50 6.25
Murray 6.00 7.50 5.50 6.50
Put the scores for the vault in order. Put John’s scores in order. Find the total scorefor each gymnast. Order the total scores from highest to lowest. Find thedifference between the highest and the lowest scores. If Warren had scored 9.25on each activity, what would his total score have been? Find the differencebetween John’s total score and Warren’s total score and work out by how muchWarren has to improve on each activity to equal John’s score.
Using this example, teachers could assess students’ ability to:- explain the meaning of the digits in decimal numbers with up to 3 decimal places
(N3);- order decimals with up to 3 decimal places (N3);- devise and use problem-solving strategies to explore situations mathematically
(MP3).
• Students use a calculator to explore different ways of representing a number as thesum of decimal numbers (1 is a good example).
Using this example, teachers could assess students’ ability to:- explain the meaning of the digits in decimal numbers with up to 3 decimal places
(N3);
- devise and use problem-solving strategies to explore situations mathematically(MP3);
- use equipment appropriately when exploring mathematical ideas (MP3).

43
• Students calculate fractions of decimal amounts. for example, six children decide
to save 25 of their pocket money each week. How much will each save?
Pocket Money List
Nani $2.00
Hana $2.50
Ben $2.60
Rhonda $3.00
Diane $2.80
Sarah $3.20
Using this example, teachers could assess students’ ability to:- solve practical problems which require finding fractions of whole number and
decimal amounts (N3);
- devise and use problem-solving strategies to explore situations mathematically(MP3);
- use equipment appropriately when exploring mathematical ideas (MP3).
Sample Development Band Activities
• Students compare the appeal and mathematical content of a number of“mathematical” games.
• Having solved number problems, such as those below, students invent other numberproblems based on the same theme and draw generalisations.
- How many ways can you arrive at a sum of 10, using two dice?- Which combination of numbers that add up to 12 produces the greatest product?
• Students investigate numbers associated with the planetary system, for example, howmany planets there are, their masses, and their greatest distances from the sun.
• Students find divisibility tests for all numbers under 12 (except 7).
• Students explore arithmetic in, say, base 3.
Level 3

44
Number
Achievement ObjectivesExploring number
Within a range of meaningful contexts, students should be able to:
• explain the meaning of negative numbers;
• explain the meaning and evaluate powers of whole numbers;
• find fractions equivalent to one given;
• express a fraction as a decimal, and vice versa;
• express a decimal as a percentage, and vice versa;
• express quantities as fractions or percentages of a whole.
Exploring computation and estimation
Within a range of meaningful contexts, students should be able to:
• make sensible estimates and check the reasonableness of answers;
• write and solve problems involving decimal multiplication and division;
• find a given fraction or percentage of a quantity;
• explain satisfactory algorithms for addition, subtraction, and multiplication;
• demonstrate knowledge of the conventions for order of operations.
45
Suggested Learning ExperiencesExploring number
Students should be:
• developing their number sense by exploring number in the context of the worldaround them;
• using number to explore events in their own lives and cultures;
• extending their understanding of the number system;
• investigating the use of the calculator memory key;
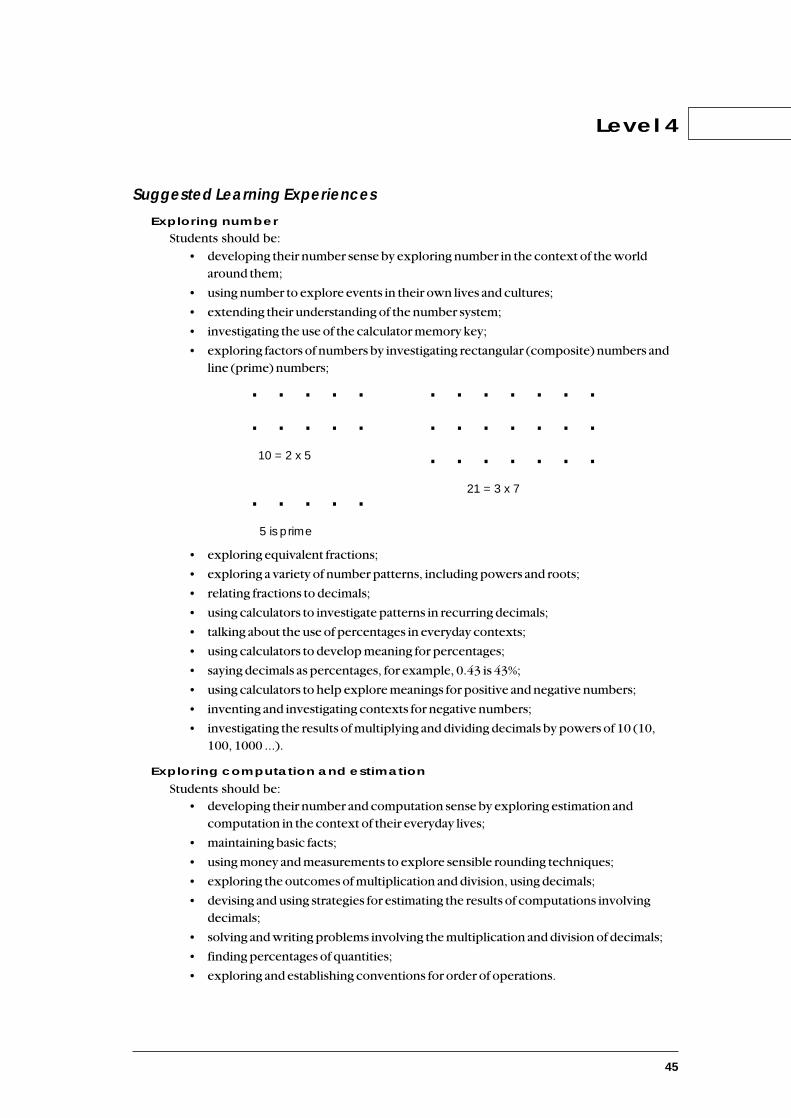
• exploring factors of numbers by investigating rectangular (composite) numbers andline (prime) numbers;
• exploring equivalent fractions;
• exploring a variety of number patterns, including powers and roots;
• relating fractions to decimals;
• using calculators to investigate patterns in recurring decimals;
• talking about the use of percentages in everyday contexts;
• using calculators to develop meaning for percentages;
• saying decimals as percentages, for example, 0.43 is 43%;
• using calculators to help explore meanings for positive and negative numbers;
• inventing and investigating contexts for negative numbers;
• investigating the results of multiplying and dividing decimals by powers of 10 (10,100, 1000 ...).
Level 4
Exploring computation and estimation
Students should be:• developing their number and computation sense by exploring estimation and
computation in the context of their everyday lives;
• maintaining basic facts;
• using money and measurements to explore sensible rounding techniques;
• exploring the outcomes of multiplication and division, using decimals;
• devising and using strategies for estimating the results of computations involvingdecimals;
• solving and writing problems involving the multiplication and division of decimals;
• finding percentages of quantities;
• exploring and establishing conventions for order of operations.
. . . . . . .
. . . . . . .
. . . . . . .
. . . . .
. . . . .
. . . . .
10 = 2 x 5
21 = 3 x 7
5 is prime

46
Number
Sample Assessment ActivitiesThese assessment activities are examples of the kinds of tasks which teachers could devisefor their own assessment programme.
• Students estimate proportions in surveys before making detailed analyses. Forexample, a survey of interests among the class indicates that television watching isthe most common. They survey favourite television programmes, and thenestimate proportions, expressing them as fractions, decimals, and percentages.
Using this example, teachers could assess students’ ability to:- make sensible estimates and check the reasonableness of answers (N4);- express a decimal as a percentage, and vice versa (N4);- find a given fraction or percentage of a quantity (N4);
- find fractions equivalent to one given (N4);- express a fraction as a decimal, and vice versa (N4);- make statements about implications and possible actions consistent with the
results of a statistical investigation (S4);- estimate the relative frequencies of events and mark them on a scale (S4).
• Students translate measurements taken from everyday activities into proportions.For example, students might use a calculator and a road map of New Zealand tofind decimal proportions of the total distance covered at various stages on ajourney. For example, on a journey from Hamilton to Wellington, what proportionof the trip has been covered by the time the traveller reaches Bulls?
Using this example, teachers could assess students’ ability to:
- express quantities as fractions or percentages of a whole (N4);- read ... a variety of … timetables and charts (M4).
• Students make a presentation to the class involving an explanation of negativenumbers. For example, a group investigates and reports to the class on the dailytemperatures at the Hermitage (near Mt Cook) and clearly explains the meaningand relationship of the negative numbers involved.
Using this example, teachers could assess students’ ability to:- explain the meaning of negative numbers (N4);- interpret information and results in context (MP4).
• Students perform calculations in practical contexts. For example, a runner can run100 metres in 10.7 seconds. How long would the runner take to cover 1500metres at the same rate? Compare the answer with realistic times for the 1500metres.
Using this example, teachers could assess students’ ability to:- write and solve problems involving decimal multiplication and division (N4);
- use their own language, mathematical language, and diagrams to explainmathematical ideas (MP4);
- perform calculations with time ... (M4).
47
• Students demonstrate understanding of the correct order of arithmetic operationsby, for example, inserting brackets where necessary to make true statements, suchas in 7 + 2 x 3 = 27, 7 + 2 x 3 = 13.
Using this example, teachers could assess students’ ability to:
- demonstrate knowledge of the conventions for order of operations (N4).
• Students work in pairs to categorise the numbers 1 to 40 by their factors, using thenotion of rectangular numbers.
Using this example, teachers could assess students’ ability to:- write and solve problems which involve whole numbers and decimals and which
require a choice of one or more of the four arithmetic operations (N3);- use words and symbols to describe and generalise patterns (MP4);- make conjectures in a mathematical context (MP4).
• Students explore, analyse, and describe a numerical investigation. For example, acontainer of rods contains only 5 cm and 7 cm lengths. If they are placed end toend, what lengths cannot be made?
Using this example, teachers could assess students’ ability to:- write and solve problems which involve whole numbers and decimals and which
require a choice of one or more of the four arithmetic operations (N3);
- devise and use problem-solving strategies to explore situations mathematically(MP4).
Sample Development Band Activities
• Students solve magic squares. They then create their own, for example, all 3 x 3 magicsquares with the sum of 15. They investigate how magic squares are constructed andexplore the history of them. In addition, they could explore magic cubes.
• Students investigate and report on properties of “special” numbers. For example:
- they make and test conjectures arising from observing the sequence4 = 3+1, 6 = 3+3, 8 = 5+3, 10 = 5+5, ...;
- they explore the properties of palindromic numbers ( 373, 2882, and 62126 arepalindromes);
- they explore “twin primes”, for example, they make and test conjectures aboutthe sequence of even numbers generated by an ordered sequence of twin primes.(5 6 7, 11 12 13, 17 18 19, ...).
• Students investigate and report on modulo (clock) arithmetic.
• Students explore cryptography.
Level 4

48
Number
Achievement ObjectivesExploring number
Within a range of meaningful contexts, students should be able to:
• convert numbers expressed in standard form to ordinary form, and vice versa;
• round numbers sensibly;
• express the values of square roots in approximate and exact forms.
Exploring computation and estimation
Within a range of meaningful contexts, students should be able to:
• make sensible estimates and check the reasonableness of results;
• solve practical problems involving decimals and percentages;
• solve problems involving positive and negative numbers, using practical activities ormodels if needed;
• express one quantity as a percentage of another;
• increase and decrease quantities by given percentages, including mark up, discount,and GST;
• share quantities in given ratios.
49
Level 5
Exploring computation and estimation
Students should be:• developing their number and computation sense by exploring estimation and
computation in the context of their everyday lives;
• making sensible estimates and checking the reasonableness of answers to problemsset in practical contexts;
• showing that they are aware when the answer shown by a calculator is not sensible;
• exploring and using rounding techniques, including significant figure and decimalplace rounding;
• developing mental strategies for adding, subtracting, multiplying, and dividingpositive and negative numbers, using a calculator, a variety of models, and otherapproaches;
• solving problems involving positive and negative numbers;
• finding percentages of quantities, and one quantity as a percentage of another, using acalculator where appropriate;
• increasing and decreasing quantities by given percentages;
• investigating profit and loss related to cost price and selling price;
• sharing quantities in given ratios;
• writing and solving their own computational problems;
• developing and using strategies for adding and subtracting fractions.
Suggested Learning ExperiencesExploring number
Students should be:
• developing their number sense by exploring number in the context of the worldaround them;
• expressing numbers in index form;
• exploring the use of standard form in practical contexts;
• converting numbers from ordinary form to standard form, and vice versa;
• exploring the use of ratio in everyday contexts;
• developing meaning for ratio by comparing two like quantities;
• investigating equivalent ratios;
• recording ratios as ab and a:b.
50
Sample Assessment ActivitiesThese assessment activities are examples of the kinds of tasks which teachers could devisefor their own assessment programme.
• Students convert correctly to and from standard form, using examples taken fromother studies. For example:
- The speed of light is approximately 299 800 000 m/s. Express this in standardform.
- The mass of an electron is approximately 9.11 x 10¯31 kg. Write this as anordinary number.
Using this example, teachers could assess students’ ability to:- convert numbers expressed in standard form to ordinary form, and vice versa
(N5).
• Students round numbers which arise from practical situations. For example, 7people have a restaurant meal. They decide to share the bill of $187.45 equally.How much does each person pay? Students explain their rounding.
Using this example, teachers could assess students’ ability to:- solve practical problems involving decimals and percentages (N5);- round numbers sensibly (N5).
• Students use positive and negative numbers to write questions that result innegative answers, for example, -4 could be written as -1 + -3, -7 – -3, -2 x 2, etc.
Using this example, teachers could assess students’ ability to:- solve problems involving positive and negative numbers, using practical activities
or models if needed (N5);- pose questions for mathematical exploration (MP5).
• Students carry out calculations involving percentages, ratios, and proportionsderived from everyday situations. For example:
- Pene wants to buy a motor bike. She needs to borrow $1200. The bank charges9.5% interest per year. How much interest does she pay if the loan is repaid in alump at the end of the year? Students report on an investigation of other waysof calculating interest and repayment options.
- While on holiday in Hawaii, Reina bought a surfboard for US $456. Useexchange rates from a newspaper or teletext to calculate how much she willhave to pay in NZ dollars.
- Two families buy 15 cubic metres of firewood and split it in the ratio 3:2. Howmuch will each family receive?
Using this example, teachers could assess students’ ability to:- solve practical problems involving decimals and percentages (N5);- increase and decrease quantities by given percentages, including mark up,
discount, and GST (N5);
- share quantities in given ratios (N5);- interpret information and results in context (MP5);- pose questions for mathematical exploration (MP5).
Number

51
• Students generalise their findings from number problems. For example, devise aquick method for adding a set of consecutive whole numbers. Find a methodwhich works and explain why.
Using this example, teachers could assess students’ ability to:
- solve problems involving positive (and negative) numbers, using practicalactivities or models if needed (N5);
- devise and use problem-solving strategies to explore situations mathematically(MP5);
- make conjectures in a mathematical context (MP5);- use their own language, mathematical language, and diagrams to explain
mathematical ideas (MP5).
Sample Development Band Activities• Students make up flow charts for numerical applications, such as an algorithm for
calculating tax payable. Students could write a computer program or use aspreadsheet to generate tax tables.
• Students investigate number problems. For example, given access to 3 cent and7 cent stamps only, what amounts of postage could be made up exactly? What about acent and b cent stamps?
• Students investigate the representation of any integer as a product of primes, andshow how to use this property in determining greatest common divisors, and lowestcommon multiples.
• 1089 x 9 = 9801. Explore.
Level 5

52
Number
Achievement ObjectivesExploring computation and estimation
Within a range of meaningful contexts, students should be able to:
• perform basic operations on fractions and mixed numbers;
• classify numbers as whole, integer, rational, or irrational;
• devise a strategy to solve a number problem;
• estimate and calculate answers, making efficient use of a calculator, whereappropriate, as part of solving a problem;
• discuss the reasonableness and meaning of the answers obtained in solving aproblem.
53
Level 6
Suggested Learning ExperiencesExploring computation and estimation
Students should be:
• continuing the development of their number knowledge, estimation, andcomputation skills while investigating and solving everyday problems;
• investigating surds and other irrational numbers;
• using a calculator efficiently;
• reaching sensible decisions in making approximations and roundings;
• judging reasonableness of answers obtained;
• interpreting the meaning of the answers obtained;
• developing and using strategies for multiplication and division of fractions.
54
Number
Sample Assessment ActivitiesThese assessment activities are examples of the kinds of tasks which teachers could devisefor their own assessment programme.
• Students work through problems derived from everyday situations which involve arange of number skills. For example:
- They adapt a recipe for 3 people to provide enough for 8 people.
- They plan a discotheque to raise $100, estimating costs and a reasonable ticketprice. Then they make graphs of costs ($) vs number of people, and on thesame axes graph income ($) vs number of people. They use the graph todetermine how many tickets need to be sold (a) to break even (b) to make$100.
- Students investigate the calculation of savings interest.
Using this example, teachers could assess students’ ability to:
- perform basic operations on fractions and mixed numbers (N6);- devise a strategy to solve a number problem (N6);- estimate and calculate answers, making efficient use of a calculator, where
appropriate, as part of solving a problem (N6);- discuss the reasonableness and meaning of the answers obtained in solving a
problem (N6).
• Students solve optimisation problems. For example, as part of a fundraising effort,the class is to make 200 pizzas for sale. The bases cost $90, cheese costs $62,sauce and toppings cost $68 altogether. It costs 5.4c per five pizzas to cook them.At $1.50 a pizza, all the pizzas will sell, but for every 50c increase in selling pricethere will be a 20% reduction in sales. The students calculate the best selling pricefor maximum profit.
Using this example, teachers could assess students’ ability to:- devise a strategy to solve a number problem (N6);
- estimate and calculate answers, making efficient use of a calculator, whereappropriate, as part of solving a problem (N6);
- pose questions for mathematical exploration (MP6);- devise and use problem-solving strategies to explore situations mathematically
(MP6).
• Students report an investigation of Pythagorean triples: (i) 3, 4, 5 (ii) 5, 12, 13 (iii)7, 24, 25.
Using this example, teachers could assess students’ ability to:- devise a strategy to solve a number problem (N6);- estimate and calculate answers, making efficient use of a calculator, where
appropriate, as part of solving a problem (N6);
- make conjectures in a mathematical context (MP6);- prove or refute mathematical conjectures (MP6);
55
- report the results of mathematical explorations concisely and coherently (MP6).
• Students use fraction manipulation in context. For example, a punch for a party
has 4 litres of ginger ale, 2 litres of orange juice, and 12 litre of cold tea. How much
extra orange juice would need to be added to bring it to 40% of the total mixture?
Using this example, teachers could assess students’ ability to:- perform basic operations on fractions and mixed numbers (N6);- devise a strategy to solve a number problem (N6).
Sample Development Band Activities
• Students investigate the calculation of interest in mortgage and loan repayments, andinvestment dividends.
• Students devise algorithms for calculating values of surds to a large number of decimalplaces. They should implement their algorithm, using a calculator or computer.
• Students design and implement an efficient algorithm for sorting a list of randomnumbers into order.

56
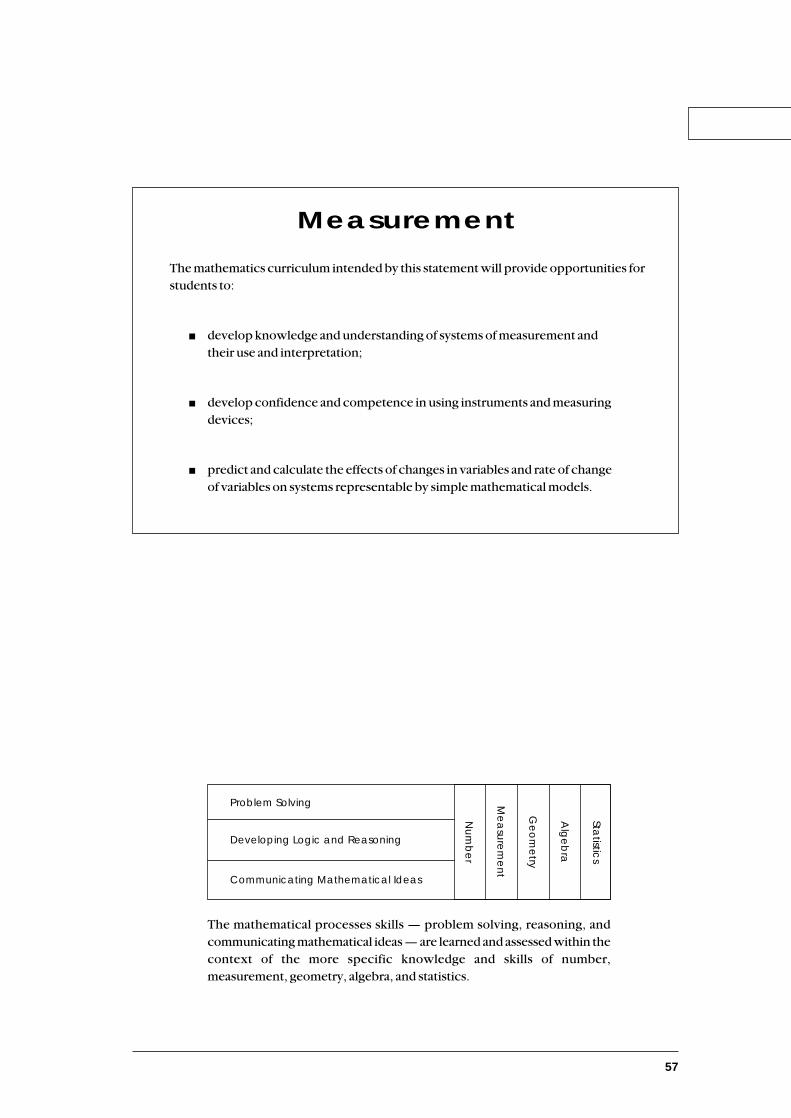
57
The mathematical processes skills — problem solving, reasoning, andcommunicating mathematical ideas — are learned and assessed within thecontext of the more specific knowledge and skills of number,measurement, geometry, algebra, and statistics.
Statistic
s
Alg
eb
ra
Ge
om
etry
Me
asu
rem
en
t
Nu
mb
er
Developing Logic and Reasoning
Communicating Mathematical Ideas
Problem Solving
Measurement
The mathematics curriculum intended by this statement will provide opportunities forstudents to:
■ develop knowledge and understanding of systems of measurement andtheir use and interpretation;
■ develop confidence and competence in using instruments and measuringdevices;
■ predict and calculate the effects of changes in variables and rate of changeof variables on systems representable by simple mathematical models.

58
Measurement
Achievement ObjectivesEstimating and measuring
Within a range of meaningful contexts, students should be able to:
• order and compare lengths, masses, and volumes (capacities), and describe thecomparisons, using measuring language;
• measure by counting non-standard units;
• compare the values of coins and notes;
• read prices.
Developing concepts of time, rate, and change
Within a range of meaningful contexts, students should be able to:
• read aspects of time, including days of the week and clocks (to hours and half hours).
59
Suggested Learning ExperiencesEstimating and measuring
Students should be:
• exploring how measurements are made in a variety of cultural situations, andexperiencing situations where values are put on measured quantities. For example,250 ml of sauce, $2.75 for a carton of milk, 2 metres of curtain material;
• investigating length, mass, volume, temperature, and money, and makingcomparisons, using appropriate language, for example, longer, hotter, heavier, more;
• estimating and measuring with non-standard units to find length, area, mass, andvolume;
• using a variety of measures in everyday situations, for example, in following simplerecipes.
Level 1
Developing concepts of time, rate, and change
Students should be:• exploring time, for example, using a calendar, and using the language of time,
growth, change, and speed such as, faster, slower, before, after, bigger, smaller,newer, older.

60
Measurement
Sample Assessment ActivitiesThese assessment activities are examples of the kinds of tasks which teachers could devisefor their own assessment programme.
• Students arrange in order, from lightest to heaviest, a set of similar containers filledwith different objects: buttons, blocks, shells, corks, bottle tops, and so on.Estimate first and then check, using a balance. Write and talk about the results, anddraw pictures to illustrate the ordering.
Using this example, teachers could assess students’ ability to:- order and compare lengths, masses, and volumes (capacities) and describe the
comparisons, using measuring language (M1);- record and talk about the results of mathematical exploration (MP1).
• Students measure short lengths from a baseline, using different children’s shoesgoing heel to toe. Talk about why the end points are different and makestatements about who has the longest shoes; the shortest shoes; the middle-sizedshoes.
Using this example, teachers could assess students’ ability to:- order and compare lengths, masses, and volumes (capacities) and describe the
comparisons, using measuring language (M1);
- measure by counting non-standard units (M1);- interpret information and results in context (MP1);- record and talk about the results of mathematical exploration (MP1).
• Students make a chart to illustrate the weather on each day of a week. Talk aboutthe weather during the week, focusing on the sequence of days. For example,“What was the weather like on Tuesday ?”, “What was it like on the day afterWednesday?”
Using this example, teachers could assess students’ ability to:- read aspects of time, including days of the week and clocks (to hours and half
hours) (M1);
- record and talk about the results of mathematical exploration (MP1).

61
Sample Development Band Activities• Students explore methods for comparing the capacities of containers of different
shapes. They discuss the appropriateness of their methods.
• Students plant fast-growing seeds. They measure and describe their growth over time,and record the information in their own way.
• Children classify and record classroom items in terms of the devices they wouldchoose to measure them. They explain their classification.
• Children track a situation every quarter of an hour during the day, and keep a recordof their results.
Level 1
62
Measurement
Achievement ObjectivesEstimating and measuring
Within a range of meaningful contexts, students should be able to:
• carry out practical measuring tasks, using appropriate metric units for length, mass,and capacity;
• give change for sums of money;
• represent a sum of money by two or more different combinations of notes and coins.
Developing concepts of time, rate, and change
Within a range of meaningful contexts, students should be able to:
• read time and know the units of time — minute, hour, day, week, month, and year.

63
Suggested Learning ExperiencesEstimating and measuring
Students should be:
• learning about a variety of measuring devices and units by talking with others, forexample, grandparents;
• investigating the uses of measurement;
• exploring the representation of qualitative data, such as feelings and opinions, on asimple scale;
• comparing lengths, masses, volumes (capacities), and temperature, using phrasessuch as “is less than”, “is greater than”, and “is equal to”, and using standard and non-standard units;
• solving measurement problems involving length, mass, and volume (capacity), incontext, by estimating measurements, and counting with non-standard units andmetric units (metre, centimetre, kilogram, gram, litre, and millilitre);
• solving measurement problems involving area and volume, in context, by estimatingand counting with non-standard units (regular and irregular shapes);
• developing an understanding of the size of a metre, kilogram, and litre by workingwith these measurements in a variety of contexts;
• reading scales, for example, kitchen scales, or a parking meter;
• solving problems in context, and naming upper and lower values for estimates;
• investigating shopping problems and prices, including giving change in shopping.
Level 2
Developing concepts of time, rate, and change
Students should be:• making and using unconventional instruments to measure time, such as a water clock,
a candle-timer, a sand-timer, and a sundial;
• estimating time intervals and working with units of time (minute, hour, day, week,month, year), including telling time on digital and analogue clocks;
• exploring ideas of growth, speed, and change.
64
Measurement
Sample Assessment ActivitiesThese assessment activities are examples of the kinds of tasks which teachers could devisefor their own assessment programme.
• Students working in pairs measure body parts. For example, they measure armlength, distance around wrist, distance around head, and present theirmeasurements on a graph (for example, a “body garden” graph where lengths arerepresented by the vertical stems of flowers). Talk about the graph to others.
Using this example, teachers could assess students’ ability to:- carry out practical measuring tasks, using appropriate metric units for length,
mass, and capacity (M2);- collect and display category data and whole number data in pictograms, tally
charts, and bar charts, as appropriate (S2);- talk about the features of their own data displays (S2);
- interpret information and results in context (MP2);- use their own language, mathematical language, and diagrams to explain
mathematical ideas (MP2).
• Students, working in groups, make a time chart showing the sequence ofimportant events that happen during their day.
Using this example, teachers could assess students’ ability to:- read time and know the units of time — minute, hour, day, week, month, and year
(M2);- record in an organised way and talk about the results of mathematical exploration
(MP2).
65
Sample Development Band Activities • Children select and time the duration of various tasks, and record, compare, and
comment on the results.
• Children seek out as many time devices as they can within, for example, a 24-hourperiod. They record the type of device and the time shown at discovery. They presentand discuss their findings.
• Children create their own calendar and record differences between theirs and thestandard calendar.
• Students explore the measurement units used in recipes, for example, abbreviations,comparisons of specific and non-specific measurement (pinch of salt, knob of butter,tsp baking powder, 30 g sugar), and translations from one measure to another. Theyrecord and share their findings.
• Students explore the “drinking problem”. What amounts of liquid can be accuratelymeasured out, using only a 3-litre and a 5-litre jug?
Level 2

66
Measurement
Achievement ObjectivesEstimating and measuring
Within a range of meaningful contexts, students should be able to:
• demonstrate knowledge of the basic units of length, mass, area, volume (capacity),and temperature by making reasonable estimates;
• perform measuring tasks, using a range of units and scales.
Developing concepts of time, rate, and change
Within a range of meaningful contexts, students should be able to:
• read and interpret everyday statements involving time;
• show analogue time as digital time, and vice versa.
67
Suggested Learning ExperiencesEstimating and measuring
Students should be:
• comparing the uses of measurement in different families, cultures, societies, and eras;
• exploring timetables and charts, and discussing the use of electronic measuringdevices, for example, supermarket scales;
• measuring qualitative data, such as feelings and opinions, using a simple scale;
• developing an understanding of measurement and solving measurement problems;
• estimating measurements and using units of length, mass, and volume (including mm,tonne, ml), and checking by reading scales;
• developing an understanding of length, mass, and volume for everyday situations, forexample, the height and mass of a nine-year-old person is about 120 cm and 40 kgrespectively;
• exploring, estimating, and checking units for area (square cm, square m) andtemperature (° C);
• using calculations in practical tasks, including mixing and interchanging units;
• describing the result of a measurement task as coming between a lower and an uppervalue.
Level 3
Developing concepts of time, rate, and change
Students should be:• using analogue and digital clocks to measure time, converting between analogue and
digital expressions of time, and using seconds in practical contexts, for example,fitness circuits;
• exploring and comparing change, for example, growth, temperature, heartbeats.
68
Measurement
Sample Assessment ActivitiesThese assessment activities are examples of the kinds of tasks which teachers could devisefor their own assessment programme.
• Students, working in pairs, prepare a set of instructions for an orienteering trailindicating distance and direction and designed for participants to reach a specificdestination in the school grounds.
Using this example, teachers could assess students’ ability to:- demonstrate knowledge of the basic units of length, mass, area, volume
(capacity), and temperature by making reasonable estimates (M3);- perform measuring tasks, using a range of units and scales (M3);- devise and follow a set of instructions to carry out mathematical activity (MP3).
• Students investigate how much boys’ shoes are bigger than girls’ shoes, using ideasof length, width, perimeter (distance around), area, and capacity.
Using this example, teachers could assess students’ ability to:
- demonstrate knowledge of the basic units of length, mass, area, volume(capacity), and temperature by making reasonable estimates (M3);
- perform measuring tasks, using a range of units and scales (M3);- devise and use problem-solving strategies to explore situations mathematically
(MP3);- record in an organised way and talk about the results of mathematical exploration
(MP3).
• Students investigate the statement that tall people have a higher pulse rate(number of heartbeats per minute) than short people.
Using this example, teachers could assess students’ ability to:
- perform measuring tasks, using a range of units and scales (M3);- read and interpret everyday statements involving time (M3);- write and solve story problems which involve whole numbers, using addition,
subtraction, multiplication, or division (N2);- devise and use problem-solving strategies to explore situations mathematically
(MP3);- interpret information and results in context (MP3);
- record in an organised way, and talk about, the results of mathematicalexploration (MP3).
69
Sample Development Band Activities• Students create a measuring system or device to measure, for example, the thickness
of a hair, the distance a pen travels before it runs out, the distance a student walks in aday. They present their system and discuss its effectiveness.
• Students create a “favourite recipes” book by selecting, testing, and recording recipeswhich appeal to them. They devise a classification system for their recipes, includinga “healthy food” category, and make a cross-referenced table of contents.
• Students investigate capacities in unusual situations, for example, how many 1-metrecubes would fit into the classroom?
Level 3
70
Measurement
Achievement ObjectivesEstimating and measuring
Within a range of meaningful contexts, students should be able to:
• carry out measuring tasks involving reading scales to the nearest gradation;
• calculate perimeters of circles, rectangles, and triangles, areas of rectangles, andvolumes of cuboids from measurements of length;
• read and construct a variety of scales, timetables, and charts;
• design and use a simple scale to measure qualitative data.
Developing concepts of time, rate, and change
Within a range of meaningful contexts, students should be able to:
• perform calculations with time, including 24-hour clock times.

71
Suggested Learning ExperiencesEstimating and measuring
Students should be:
• exploring the uses of measurement in work, sport, at home, and in leisure, anddiscussing the need for measurement in our world, for example, the measurement ofglobal warming and pollution, and measurement in dressmaking and in construction;
• developing an understanding of measurement and solving measurement problems incontext;
• exploring the approximate nature of measurement, and the need for rounding to givesensible results;
• estimating and selecting appropriate units for measurement tasks involving length,mass, volume, time, area, and temperature;
• exploring the relationship between perimeter and area for figures such as rectangles,and exploring the relationship between the circumference and the diameter of acircle;
• consolidating an understanding of the concepts of area and volume, and using hectareand cubic metre;
• investigating the areas of squares, leading to squaring and finding square roots;
• understanding equivalence of units, for example, that 1 cubic decimetre of water,1 litre of water, and 1 kg of water are equivalent quantities;
• recording measurements and making conversions between units within the metricsystem, using decimals and calculators where appropriate;
• constructing and using timetables and charts, and exploring the use of measuringdevices which use newer technologies (lasers, decibel meters, and so on);
• interpreting diagrams involving the reading of scales, maps, plans, and so on;
• measuring qualitative data, such as attitudes, feelings, opinions, and behaviours, onsimple scales, and discussing the limitations of this form of measurement.
Level 4
Developing concepts of time, rate, and change
Students should be:• reading and interpreting a 24-hour clock, and discussing the differences between
12-hour and 24-hour time and the reasons for using 24-hour time;
• exploring concepts of change, including the use of units, for example, pulse rate,birth rate, power consumption, phone charges, speed.

72
Measurement
Sample Assessment ActivitiesThese assessment activities are examples of the kinds of tasks which teachers could devisefor their own assessment programme.
• Students:
- time and cost a toll call by using toll call price charts and maps, or
- construct a fishing calendar, using resources such as a Maori lunar calendar, ortide charts, or
- plan an overseas trip which involves changing aircraft and time zones, usingairline timetables.
Using this example, teachers could assess students’ ability to:
- read and construct a variety of scales, timetables, and charts (M4);- perform calculations with time, including 24-hour clock times (M4);- write and solve problems involving decimal multiplication and division (N4);- interpret information and results in context (MP4).
• Students investigate the effect of changing the mass or length of a pendulum on itsperiod (time for a complete back and forth swing).
Using this example, teachers could assess students’ ability to:- carry out measuring tasks involving reading scales to the nearest gradation (M4);
- record information in ways that are helpful for drawing conclusions and makinggeneralisations (MP4);
- report the results of mathematical explorations concisely and coherently (MP4).
• Students design and construct, using card, a 1-litre container and a 12 -litre
container.
Using this example, teachers could assess students’ ability to:- carry out measuring tasks involving reading scales to the nearest gradation (M4);- calculate perimeters of circles, rectangles, and triangles, areas of rectangles, and
volumes of cuboids from measurements of length (M4);
- design the net and make a simple polyhedron to specified dimensions (G4);- write and solve problems involving whole numbers and decimals, and requiring a
choice of one or more of the four arithmetic operations (N3);- devise and use problem-solving strategies to explore situations mathematically
(MP4);- use equipment appropriately when exploring mathematical ideas (MP4).

73
Sample Development Band Activities• Students develop methods for estimating with reasonable accuracy the quantities
used in everyday situations, for example, the number of bricks used in a building.
• Students investigate the history and the uses of π. They investigate relationships inwhich π is involved and algorithms which have been used to establish approximatevalues for π.
• Students investigate and report on systems for measuring astronomical distances.
• Students invent and construct a novel device to measure time. They present a reporton the effectiveness and usefulness of the device.
• Students produce a quantitative report on a practical conservation theme, forexample, they might research the amount of water commonly used by households,then calculate the savings to be made by fixing a dripping tap, showering rather thanbathing, or placing a brick in the cistern.
Level 4
74
Measurement
Achievement ObjectivesEstimating and measuring
Within a range of meaningful contexts, students should be able to:
• find perimeters, areas, and volumes of everyday objects (including irregular andcomposite shapes), and state the precision (limits) of the answer;
• design and use models to solve measuring problems in practical contexts.
Developing concepts of time, rate, and change
Within a range of meaningful contexts, students should be able to:
• interpret and use information about rates presented in a variety of ways, for example,graphically, numerically, or in tables.
75
Suggested Learning ExperiencesEstimating and measuring
Students should be:
• investigating measurement within areas of interest, for example, technology, culturalexpressions of art forms, architecture, music, dance, the human body, sport,environmental issues, and exploring the use of a range of measuring devices andscales, for example, the Richter scale, and electronic and non-electronic devices;
• exploring the use of 2-dimensional scales to measure qualitative data such asattitudes, feelings, opinions, and behaviours, and discussing the limitations of thisform of measurement;
• developing the understanding needed to be able to solve measurement problems incontext;
• consolidating the concepts of area, volume, and mass;
• further exploring the equivalence of units, for example, that 1 millilitre of water, 1cubic centimetre of water, and 1 gram of water represent the same quantity;
• solving problems in practical contexts involving irregular and composite areas andvolumes, and using appropriate models, for example, by using a cylinder to model atree to estimate the volume of wood, and naming upper and lower limits for theresults;
• using investigations to develop formulae for perimeters and areas (rectangles,triangles, parallelograms, trapezia, and circles) and volumes (cuboids and otherprisms, cylinders, cones, pyramids, and spheres);
• finding π as the ratio of the circumference to the diameter of a circle; and discoveringthat shapes with a given perimeter do not necessarily enclose the same area, and viceversa;
• designing and using scale representations of everyday situations, for example, sewingpatterns or garage plans.
Level 5
Developing concepts of time, rate, and change
Students should be:• using techniques such as graphing and averaging to explore rates and rates of change.
For example, tax rates, pollution rates measured in parts per million, acceleration,inflation, stocking rates, and unit pricing.

76
Measurement
Sample Assessment ActivitiesThese assessment activities are examples of the kinds of tasks which teachers could devisefor their own assessment programme.
• Students write a report on an investigation, using mathematical formulae. Forexample, do all boxes made from A4 paper, by removing a square from eachcorner and folding up the edges, hold the same amount? Investigate how thevolume of the box varies with the size of the squares cut out, by drawingdiagrams, making a table of dimensions, and using a spreadsheet. Use interpolationand successive approximations to find the maximum volume to a reasonable orderof precision.
Using this example, teachers could assess students’ ability to:- interpret and use information about rates presented in a variety of ways, for
example, graphically, numerically, or in tables (M5);- record information in ways that are helpful for drawing conclusions and making
generalisations (MP5);- report the results of mathematical explorations concisely and coherently (MP5).
• Students use formulae for calculating perimeter, area, and volume in practicalcontexts (rectangles, triangles, parallelograms, trapezia, circles, prisms, pyramids,and spheres). For example, they:
- find the perimeter and area of a basketball court, hockey field, pathway, pieceof land;
- find the approximate volume of the trunk of a tree, the human body, a pile ofsand;
- estimate and calculate capacities in a practical context such as the volume ofthe school pool, and then calculate how much chemical is needed to treat it,given the quantity per litre required.
Using this example, teachers could assess students’ ability to:- find perimeters, areas, and volumes of everyday objects (including irregular and
composite shapes), and state the precision (limits) of the answer (M5);- design and use models to solve measuring problems in practical contexts (M5).
• Students construct a scale diagram of, for example, a wharenui or a house, and useit for appropriate calculations, such as the cost of floor coverings.
Using this example, teachers could assess students’ ability to:
- find perimeters, areas, and volumes of everyday objects (including irregular andcomposite shapes), and state the precision (limits) of the answer (M5);
- recognise when 2 shapes are similar, find the scale factor, and use this to find anunknown dimension (G5).

77
• Students collect data on the price and volume of three sizes of a commodity suchas shampoo. They determine which size gives the best value by calculating unitprices.
Using this example, teachers could assess students’ ability to:
- interpret and use information about rates presented in a variety of ways, forexample, graphically, numerically, or in tables (M5);
- write and solve problems involving decimal multiplication and division (N4);- record information in ways that are helpful for drawing conclusions and making
generalisations (MP5).
• Students model a physical situation and draw conclusions. For example, lizards canhardly move when they are cold. A big lizard and a small lizard are lying on a rockas the sun comes up. Which lizard moves first? Students explore the relationshipbetween surface area and volume by investigating the use of cubes as a model forthe situation, and deduce the result. They explain the result to the class anddeduce further general results about the ratios of surface area and volume.
Using this example, teachers could assess students’ ability to:- find perimeters, areas, and volumes of everyday objects (including irregular and
composite shapes), and state the precision (limits) of the answer (M5);- design and use models to solve measuring problems in practical contexts (M5);
- devise and use problem-solving strategies to explore situations mathematically(MP5);
- report the results of mathematical investigations concisely and coherently (MP5).
Sample Development Band Activities• Students determine optimal shapes within given constraints. For example, they:
- calculate the largest rectangular area that can be enclosed by a given length ofwire, then generalise to other shapes;
- determine the most efficient cross-section shape for spouting;- explore ways of minimising cost when producing 375-ml cans.
• Students invent formulae which describe properties (edge length, surface area,volume) of regular solid figures, for example, prisms (including cuboids andcylinders), pyramids of various bases, cones, tetrahedra, and spheres. They explainthe derivation of each formula.
• Students explore life on another planet. For example, what are the implications ofdifferent gravitational forces for measurement?
Level 5

78
Measurement
Achievement ObjectivesEstimating and measuring
Within a range of meaningful contexts, students should be able to:
• demonstrate the knowledge and skills necessary to plan, implement, and evaluatepractical measuring tasks;
• design and use a 2-dimensional scale to represent data.
Developing concepts of rate and change
Within a range of meaningful contexts, students should be able to:
• explain the relationship between the gradient of a graph and the rate of change;
• interpret and use information about rates presented in a variety of ways, for example,graphically, or in tables.

79
Suggested Learning ExperiencesEstimating and measuring
Students should be:
• solving measurement problems, in practical contexts, which involve estimatingresults, selecting appropriate units, measuring appropriately, using the language ofmeasurement, calculating measurements, evaluating and reporting results, statinglevels of accuracy;
• measuring qualitative data such as attitudes, feelings, opinions, and behaviours, using2-dimensional scales;
• consolidating previous work on measurement, and extending it where appropriate;
• discovering that objects with a given surface area do not necessarily enclose the samevolume, and vice versa.
Level 6
Developing concepts of rate and change
Students should be:• using, calculating, and interpreting rates in a variety of contexts, for example,
retention rates, staffing ratios, and the half-life of nicotine, coffee, alcohol, andradioactive materials;
• establishing the relationship between the gradient of a graph and the rate of change,and interpreting this in context, using technology where appropriate.

80
Measurement
Sample Assessment ActivitiesThese assessment activities are examples of the kinds of tasks which teachers could devisefor their own assessment programme.
• Students use a 2-dimensional scale of their own design to record and comparequalitative data. For example, they compare the attitudes and behaviours of asample of secondary school pupils.
Using this example, teachers could assess students’ ability to:
- design and use a 2-dimensional scale to represent data (M6);- record information in ways that are helpful for drawing conclusions and making
generalisations (MP6);- sketch and interpret graphs which represent everyday situations (A5).
• Students interpret a straight-line graph, explaining what the slopes represent in agiven context, and suggest reasons for changes in slopes. For example, thediagram shows the graph used by a used-car salesperson to estimate the sellingprice of a particular brand of car. They explain what the slopes of the straight-linesections represent in this context and suggest reasons for the change in slope.
$24000
$4000
'82 '84 '86 '88 '90
Pric
e
Year
TV watching is harmful
TV watching is beneficial
I never watch TV
I watch TV constantly
81
Level 6
Using this example, teachers could assess students’ ability to:- explain the relationship between the gradient of a graph and the rate of change
(M6);- interpret and use information about rates presented in a variety of ways, for
example, graphically, or in tables (M6);- interpret information and results in context (MP6);
- graph linear rules and interpret the slope and intercepts on an integer co-ordinatesystem (A5).
• Students plan, implement, and evaluate a practical task by using knowngeometrical shapes to model everyday objects. For example, by choosing anappropriate geometric solid to model a pile of sand tipped by a truck, studentscalculate whether or not there is sufficient sand in a pile to fill a cuboid-shapedsand pit (after taking approximate measurements). Students estimate upper andlower limits for the volumes, and discuss, in general terms, the inaccuraciesinherent in their model.
Using this example, teachers could assess students’ ability to:- demonstrate the knowledge and skills necessary to plan, implement, and evaluate
practical measuring tasks (M6);- find perimeters, areas, and volumes of everyday objects (including irregular and
composite shapes), and state the precision (limits) of the answer (M5);- devise and use problem-solving strategies to explore situations mathematically
(MP6).
Sample Development Band Activities• By writing their own computer program, or in some other way, students construct a
sequence of fractals, such as the Koch (simple snowflake) curve, and investigatefactors which determine the perimeter and area of a fractal.
• Students use a computer or calculator to find the area of an interval under a curve bysubdividing the area into smaller and smaller sub-intervals, approximating them totrapezia, and adding their areas.
• Students plan nets for, and construct, a number of regular-shaped solids withspecified parameters, for example, a regular tetrahedron with a volume of 1 litre.

82
Measurement and Calculus
Achievement ObjectivesEstimating and measuring
Within a range of meaningful contexts, students should be able to:
• model a given situation, using trigonometry (including radian measure) to find andinterpret measures in context, and evaluate their findings.
Developing concepts of rate and change
Within a range of meaningful contexts, students should be able to:
• sketch the graph of a gradient function from the graph of a function and explain therelationship between them;
• determine and use an expression for the rate of change of a variable and apply it topractical situations such as maximum, minimum, velocity, and acceleration;
• use integration and anti-differentiation in real and simulated situations.

83
Suggested Learning ExperiencesEstimating and measuring
Students should be:
• exploring angle measure, including circular measure, and applying it to practicalsituations;
• using trigonometric functions to calculate distances, angles, and areas, including theuse of sine rule, cosine rule, and area of triangle formula.
Level 7
Developing concepts of rate and change
Students should be:• exploring the historical development of calculus and its notations;
• investigating the relationship between a variable and its rate of change throughexperimental and practical work;
• investigating and interpreting the relationship between a graph and its slope from arate of change point of view, for example, by using a graphics calculator or suitablegraphing package to “zoom in” on a point on a graph until the curve appears to be astraight line, and then find the gradient;
• discussing applications of differentiation, including practical problems on maximaand minima;
• calculating areas under curves by a variety of means such as counting squares,drawing trapezia or rectangles, or by methods of their own choice;
• discovering a relationship between anti-differentiation and integration;
• applying integration, including its use in finding areas under polynomial curves.
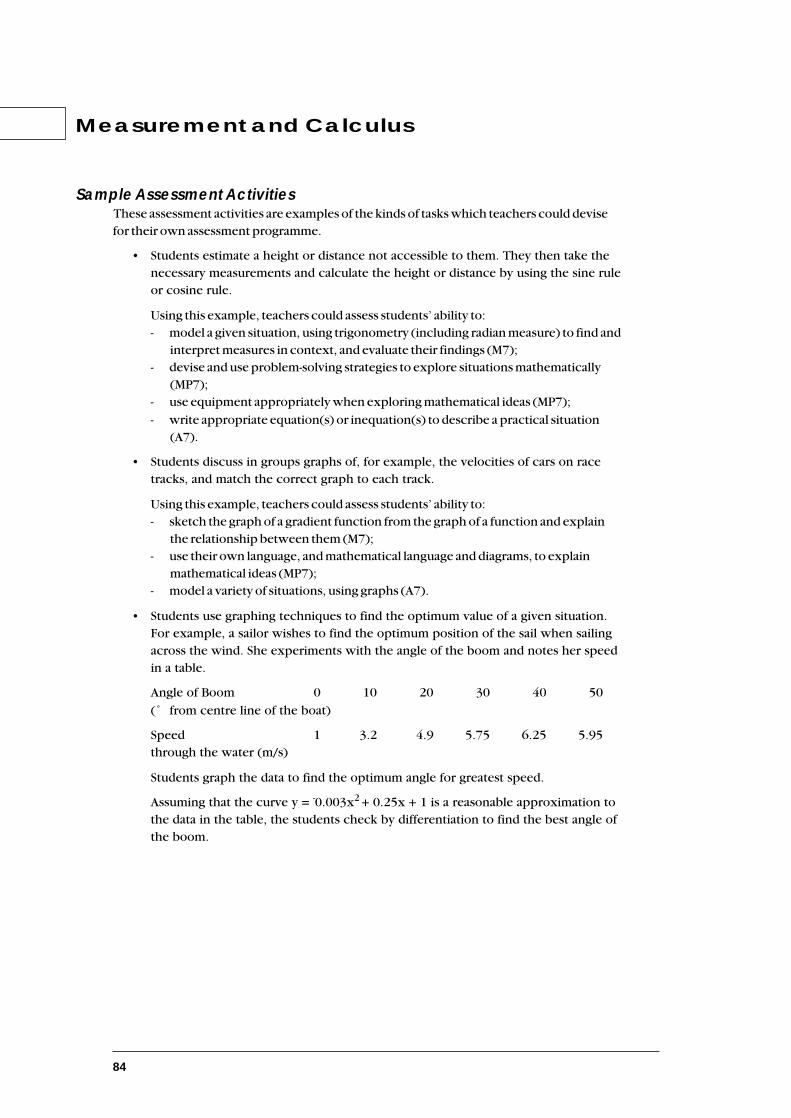
84
Measurement and Calculus
Sample Assessment ActivitiesThese assessment activities are examples of the kinds of tasks which teachers could devisefor their own assessment programme.
• Students estimate a height or distance not accessible to them. They then take thenecessary measurements and calculate the height or distance by using the sine ruleor cosine rule.
Using this example, teachers could assess students’ ability to:- model a given situation, using trigonometry (including radian measure) to find and
interpret measures in context, and evaluate their findings (M7);- devise and use problem-solving strategies to explore situations mathematically
(MP7);- use equipment appropriately when exploring mathematical ideas (MP7);
- write appropriate equation(s) or inequation(s) to describe a practical situation(A7).
• Students discuss in groups graphs of, for example, the velocities of cars on racetracks, and match the correct graph to each track.
Using this example, teachers could assess students’ ability to:- sketch the graph of a gradient function from the graph of a function and explain
the relationship between them (M7);- use their own language, and mathematical language and diagrams, to explain
mathematical ideas (MP7);- model a variety of situations, using graphs (A7).
• Students use graphing techniques to find the optimum value of a given situation.For example, a sailor wishes to find the optimum position of the sail when sailingacross the wind. She experiments with the angle of the boom and notes her speedin a table.
Angle of Boom 0 10 20 30 40 50
(˚ from centre line of the boat)
Speed 1 3.2 4.9 5.75 6.25 5.95through the water (m/s)
Students graph the data to find the optimum angle for greatest speed.
Assuming that the curve y = -0.003x2 + 0.25x + 1 is a reasonable approximation tothe data in the table, the students check by differentiation to find the best angle ofthe boom.

85
Using this example, teachers could assess students’ ability to:- determine and use an expression for the rate of change of a variable and apply it to
practical situations such as maximum, minimum, velocity, and acceleration (M7);- interpret information and results in context (MP7);- use graphical methods to investigate a pattern in data and, where appropriate,
identify its algebraic form (A7);
- find by inspection, and interpret, maxima, minima, points of inflexion,asymptotes, and discontinuities for given graphs (A7).
• Students write a report outlining different methods, including integration, offinding approximate areas under a given curve and a curve of their choice, anddiscuss the advantages and disadvantages of the various methods.
Using this example, teachers could assess students’ ability to:- use integration and anti-differentiation in real and simulated situations (M7).
Sample Development Band Activities• Students conduct a quantitative exploration of, for example, a local or global
environmental issue, and use the information collected to present a report and theirconclusions. Students might, for example, investigate the rate of pollution in a river asa function of its distance from the source and its relationship to the densities of animaland plant life in the water.
Level 7

86
Measurement and Calculus
Achievement ObjectivesEstimating and measuring
Within a range of meaningful contexts, students should be able to:
• compute the cumulative effect of uncertainties of measurement on quantities whichare calculated using measured values;
• evaluate uncertainties in a real context and describe their sources, generation, andpropagation;
• interpret and evaluate algorithms for practical tasks and calculations.
Developing concepts of rate and change
Within a range of meaningful contexts, students should be able to:
• identify any discontinuity of a given function and find the limit (if it exists);
• choose and apply appropriate differentiation techniques in context;
• identify situations where the rate of change is proportional to the value of thefunction and use the exponential function in associated problems;
• form a differential equation model of a practical or simulated situation and use it tointerpret and draw conclusions about the situation;
• use a variety of methods, including integration, Simpson’s rule, and the trapeziumrule for finding areas;
• use a variety of methods for finding volumes;
• use a variety of integration techniques to solve real and simulated problems.

87
Suggested Learning ExperiencesEstimating and measuring
Students should be:
• investigating uncertainties arising from practical situations involving measurementand subsequent computation;
• using and constructing a range of algorithms of varying structures for computation,including repetition, summation, and decision making.
Level 8
Developing concepts of rate and change
Students should be:• investigating the concepts of continuity and the limit of a function;
• formalising the derivative as lim
h➝0 f(x+h) - f(x)
h
• differentiating sums, products, quotients, and composite functions (using the chainrule), and finding second and higher order derivatives and functions definedparametrically;
• finding derivatives of trigonometric functions, logarithmic functions, andexponential functions;
• solving real and simulated problems involving variable rates of change, including theuse of exponential and logarithmic functions;
• investigating differentiation and integration, including using differential equations tosolve real and simulated problems;
• solving differential equations, using a variety of techniques, including separation ofvariables and numerical methods;
• establishing integration as the limit of a sum and its relationship to anti-differentiation;
• exploring practical situations of summation, including area under a curve andvolumes of revolution, using a balance of numerical, non-numerical, calculator, andcomputer methods;
• integrating polynomial, exponential, trigonometric functions, and rational functions
of the type ax + bcx + d using substitution as appropriate.

88
Measurement and Calculus
Sample Assessment ActivitiesThese assessment activities are examples of the kinds of tasks which teachers could devisefor their own assessment programme.
• Students investigate the discontinuities of x2 - 4x - 2 and
x + 2x - 2 and evaluate the limits at
discontinuities if they exist. State any generalisations about limits at discontinuitieson rational functions.
Using this example, teachers could assess students’ ability to:- identify any discontinuity of a given function and find the limit (if it exists) (M8);- generalise mathematical ideas and conjectures (MP8);
- use graphical techniques to explore and illustrate y = xa , y = ax + bcx + d , and piece-
wise functions (A8);- find by inspection, and interpret, maxima, minima, points of inflection,
asymptotes, and discontinuities for given graphs (A7).
• Working in groups, students investigate and report on practical problemsinvolving rates of change. For example, a lake contains 106 litres of water, and afactory begins dumping a chemical at the rate of 1 litre per hour. The lake is fed bya fresh stream at 39 litres per hour and keeps a constant level. If the chemical levelreaches 0.1%, then the lake is too polluted for drinking.
Using this example, teachers could assess students’ ability to:
- form a differential equation model of a practical or simulated situation and use it tointerpret and draw conclusions about the situation (M8);
- devise and use problem-solving strategies to explore situations mathematically(MP8);
- report the results of mathematical investigations concisely and coherently (MP8);- choose an appropriate model for real data, including the use of log-log and semi-
log techniques, and analyse and interpret the results (A8).
• Students use numerical methods to find the approximate value of * dx1x
between 1 and other values, and from this show that, for example, the sum of thearea from 1 to 2 and the area from 1 to 3 is equal to the area from 1 to 6. Theypredict similar results.
Using this example, teachers could assess students’ ability to:
- use a variety of methods, including integration, Simpson’s rule, and the trapeziumrule for finding areas (M8);
- make conjectures in a mathematical context (MP8).
89
• Students investigate and report on the design and construction of a 400-metre all-weather athletics track, including effects of precision of measurement on lanedistances, and on required volumes of surface materials.
Using this example, teachers could assess students’ ability to:
- evaluate uncertainties in a real context and describe their sources, generation, andpropagation (M8);
- interpret information and results in context (MP8);- use their own language, and mathematical language and diagrams, to explain
mathematical ideas (MP8).
Sample Development Band Activities• Students develop proofs for standard mathematical results, for example, the limit
definition of the derivative: f'(x) = lim
h➝0 f(x+h) - f(x)
h
• Students find problems which can be modelled appropriately by calculus. Forexample, they might investigate a range of optimisation problems, such as the idealdistance from a rugby try line from which to take a conversion kick, given that thekick must be in line with the position that the try was scored. Students would have toexplain and justify their assumptions.
• Students undertake a project on an application of calculus in economics,demography, physics, or geography. For example, students are given a contour mapof a river valley. A dam is to be built at a certain point across the valley. What volume ofwater can the dam hold? How would the output of the dam be related to the height ofthe dam? What assumptions about the water catchment, and so on, have been made?
• Students design a tidal power station.
• A model for the spread of an infectious disease assumes that the rate at which thedisease spreads through the community is proportional to the product of the numberof the people infected and the number of people who have not yet been infected. In acommunity of 50 000, investigate how many infected people will cause the rate ofspread to be greatest.
• Consider taking a medicine by mouth. The drug passes to your stomach andintestines. There, it is gradually absorbed into your bloodstream, which carries itthrough the body. However, as the blood passes through your kidneys, the drug isremoved along with other impurities. So, the drug is absorbed into the body from theintestines at one rate, and removed from the body by the kidneys at another rate. Setup mathematical models of drug concentrations in the form of equations involvingrates of change. The problem is to work out what dose is required, and how often itneeds to be administered, to maintain the required concentration of the drug in thepatient’s body.
• Discuss how it is possible for birth rates to remain high for some years even if eachmother has few children.
Level 8

90

91
The mathematical processes skills — problem solving, reasoning, andcommunicating mathematical ideas — are learned and assessed within thecontext of the more specific knowledge and skills of number,measurement, geometry, algebra, and statistics.
Statistic
s
Alg
eb
ra
Ge
om
etry
Me
asu
rem
en
t
Nu
mb
er
Developing Logic and Reasoning
Communicating Mathematical Ideas
Problem Solving
Geometry
The mathematics curriculum intended by this statement will provide opportunities forstudents to:
■ gain a knowledge of geometrical relations in two and three dimensions, andrecognise and appreciate their occurrence in the environment;
■ develop spatial awareness and the ability to recognise and make use of thegeometrical properties and the symmetries of everyday objects;
■ develop the ability to use geometrical models as aids to solving practicalproblems in time and space.
92
Geometry
Achievement ObjectivesExploring shape and space
Within a range of meaningful contexts, students should be able to:
• identify, and describe in their own language, the following 2-dimensional and 3-dimensional shapes: triangle, square, oblong (non-square rectangle), circle, oval,pentagon, hexagon, diamond, box, cylinder, and sphere;
• classify objects by shape attributes;
• follow and give a sequence of instructions related to movement and position.
Exploring symmetry and transformations
Within a range of meaningful contexts, students should be able to:
• create and talk about symmetrical and repeating patterns;
• rotate their body and other objects through quarter and half turns.
93
Level 1
Suggested Learning ExperiencesExploring shape and space
Students should be:
• exploring a variety of shapes and objects by touching, observing, and talking aboutthem;
• sorting, classifying and comparing shapes and objects, using words such as: curved/straight, smooth/rough, flat/bumpy, thick/thin, bottom/top, edge/face/side/corner,and colour names;
• making objects from everyday junk materials and then talking about the shapes usedin the construction;
• exploring objects which stack, pack, and roll;
• locating objects and people in space, using words such as:on after inside under before outsideover beside middle underneath between behindforwards next to in front of backwards on top alongsidewards above around towards near far
away from
• exploring the construction of simple everyday packages;
• describing the changing appearances of shapes and objects when viewed fromdifferent places.
Exploring symmetry and transformations
Students should be:• experiencing and exploring rolling, spinning, twisting, and turning (quarter and half
turns);
• designing and talking about patterns which involve transformations: turning over(reflecting), turning around (rotating), moving without turning (translating),enlarging (for example, writing on a balloon and blowing it up);
• exploring ways of fitting shapes together to cover surfaces (tessellating);
• making and talking about pairs of objects, where one is an enlargement of the other.
94
Geometry
Sample Assessment ActivitiesThese assessment activities are examples of the kinds of tasks which teachers could devisefor their own assessment programme.
• While students are working in pairs:
- one describes a shape which can be found among a collection of shapes. Theother locates it;
- they find sets of specified objects in a “feely” bag and talk about theirsimilarities and differences;
- one describes the attributes of an object in a “feely” bag, and the other guesseswhat it is.
Using this example, teachers could assess students’ ability to:
- classify objects by shape attributes (G1);- classify objects (MP1);- record and talk about the results of mathematical exploration (MP1).
• While students are sitting back to back in pairs:
- one draws a simple picture and describes it in geometric terms. (“I have a largecircle. I have two small circles inside that circle near the top.”) The partnerdraws it ;
- using mosaic shapes, one partner builds a simple model or geometric patternand describes it. (“I have a red square next to a blue triangle.”) The partnermakes the model or pattern.
Using this example, teachers could assess students’ ability to:- identify, and describe in their own language, the following 2-dimensional and 3-
dimensional shapes: triangle, square, oblong (non-square rectangle), circle, oval,pentagon, hexagon, diamond, box, cylinder, and sphere (G1);
- classify objects (MP1);
- record and talk about the results of mathematical exploration (MP1).
• Students play “Simon Says”, incorporating instructions involving 1, 2, 3, or 4quarter and half turns;
Using this example, teachers could assess students’ ability to:- follow and give a sequence of instructions related to movement and position
(G1);- rotate their body and other objects through quarter and half turns (G1);- find, by practical means, one half and one quarter of a shape, and a half of a set of
objects (N1);
95
- devise and follow a set of instructions to carry out a mathematical activity (MP1).
• Students follow a sequence of three or four instructions (in English or Maori)involving movement, using words such as “towards”, “turn”, and “beside”. Forexample, they move a toy car around a simple road map.
Using this example, teachers could assess students’ ability to:- follow and give a sequence of instructions related to movement and position
(G1);- devise and follow a set of instructions to carry out a mathematical activity (MP1).
Sample Development Band Activities• Students seek out, record, and share any symmetrical or repeating patterns they
discover throughout a week.
• Students create a sequence of instructions for an original dance, picture, or pattern,try it, and modify it if necessary.
• Students make up sets of instructions to re-create a given dance or pegboard pattern.They test them and, if necessary, modify the instructions.
• Students compare different 2- and then 3-dimensional shapes to find similarities anddifferences. They record the findings in their own way and share them.
• Having explored tessellating shapes, students experiment with their own createdshapes to discover any that tessellate.
Level 1

96
Geometry
Achievement ObjectivesExploring shape and space
Within a range of meaningful contexts, students should be able to:
• make, name, and describe, using their own language and the language of geometry,everyday shapes and objects ;
• describe and interpret position, using the language of direction and distance.
Exploring symmetry and transformations
Within a range of meaningful contexts, students should be able to:
• create and talk about geometric patterns which repeat (show translation), or whichhave rotational or reflection symmetry;
• make clockwise and anticlockwise turns.

97
Suggested Learning ExperiencesExploring shape and space
Students should be:
• making, talking about, and classifying shapes and objects from their own and othercultures
- plane shapes (with paper, geoboards, Logo, and so on)
- models of spheres, cuboids and other prisms, cylinders, cones, and pyramids (byusing playdough, for example);
• exploring tangrams;
• exploring common cardboard boxes and packages and the nets (patterns) used tomake them;
• describing the features of objects which have been felt but not seen;
• describing the changing appearances of objects when viewed from different places;
• describing the shape of the cross-section when objects are sliced (carrots, apples, andso on);
• giving and following directions using “clockwise”, “anticlockwise”, “left”, and“right”;
• drawing and reading maps by making use of the four points of the compass (North,South, East, and West);
• describing paths found in the environment, for example, the flight paths of balls
Level 2
thrown in the air, the stream of water from a fountain.
Exploring symmetry and transformations
Students should be:• exploring and recording the results of turning plane shapes over (reflecting) and
around (rotating, both clockwise and anticlockwise);
• exploring and creating geometrical patterns involving translation, reflection, androtational symmetry;
• exploring ways of covering surfaces with regular shapes (tessellating);
• exploring enlargement of shapes and objects using the overhead projector andby making models, for example, making a model house with playdough.

98
Geometry
Sample Assessment ActivitiesThese assessment activities are examples of the kinds of tasks which teachers could devisefor their own assessment programme.
• Students play “Simon Says”, incorporating instructions involving 1, 2, 3, or 4quarter and half turns and directions, “clockwise”, “anticlockwise”, “to the left”,and “to the right”.
Using this example, teachers could assess students’ ability to:- describe and interpret position, using the language of direction and distance (G2);- make clockwise and anticlockwise turns (G2);- find, by practical means, one half and one quarter of a shape, and a half of a set of
objects (N1);
- devise and follow a set of instructions to carry out a mathematical activity (MP2).
• Students use the language of geometry to describe the distinguishing features ofconstructions they have made using “junk” material.
Using this example, teachers could assess students’ ability to:- make, name, and describe, using their own language and the language of
geometry, everyday shapes and objects (G2);- use their own language, and mathematical language and diagrams, to explain
mathematical ideas (MP2).
• Students:
- rotate an attribute block in a template and explain how many different waysthe shape fits;
- use a shape template attached to a piece of paper by a drawing pin to create adesign which has rotational symmetry;
- identify symmetry in shapes they make while playing whai (string games);
- identify shapes that have both rotational and reflection symmetry.
Using this example, teachers could assess students’ ability to:
- create and talk about geometric patterns which repeat (show translation) orwhich have rotational or reflection symmetry (G2);
- use their own language, and mathematical language and diagrams, to explainmathematical ideas (MP2).
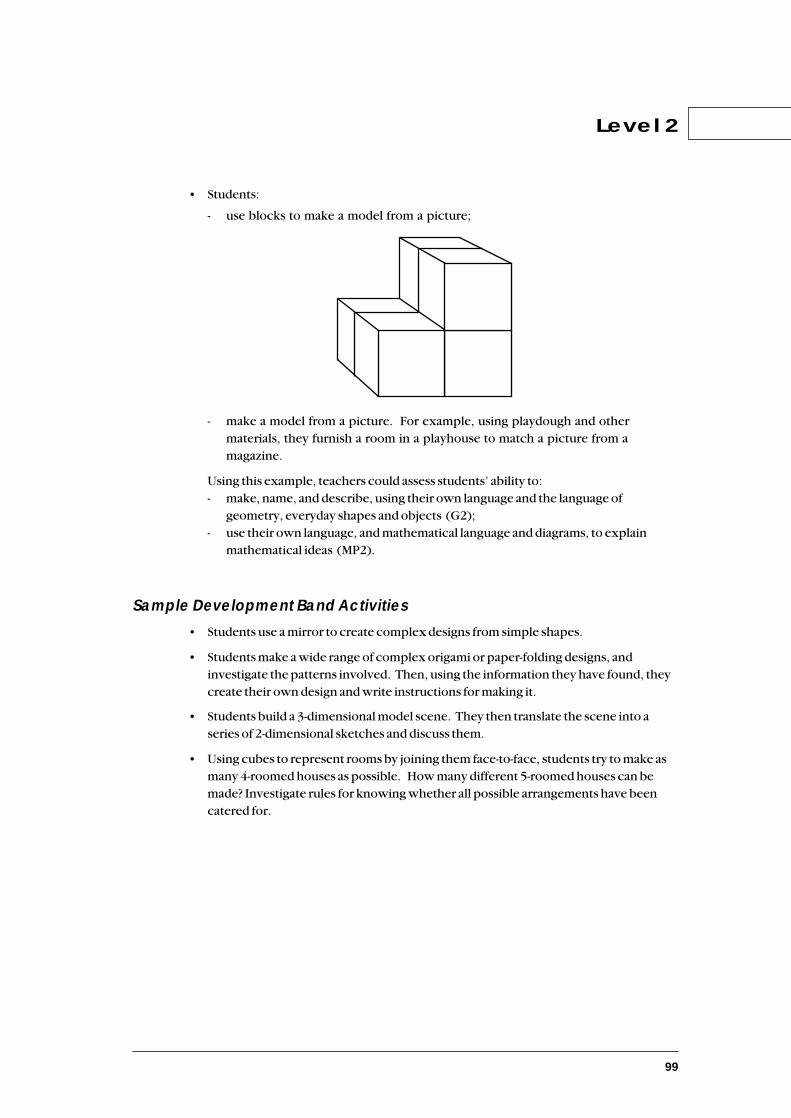
99
Level 2
• Students:
- use blocks to make a model from a picture;
- make a model from a picture. For example, using playdough and othermaterials, they furnish a room in a playhouse to match a picture from amagazine.
Using this example, teachers could assess students’ ability to:- make, name, and describe, using their own language and the language of
geometry, everyday shapes and objects (G2);- use their own language, and mathematical language and diagrams, to explain
mathematical ideas (MP2).
Sample Development Band Activities• Students use a mirror to create complex designs from simple shapes.
• Students make a wide range of complex origami or paper-folding designs, andinvestigate the patterns involved. Then, using the information they have found, theycreate their own design and write instructions for making it.
• Students build a 3-dimensional model scene. They then translate the scene into aseries of 2-dimensional sketches and discuss them.
• Using cubes to represent rooms by joining them face-to-face, students try to make asmany 4-roomed houses as possible. How many different 5-roomed houses can bemade? Investigate rules for knowing whether all possible arrangements have beencatered for.
100
Geometry
Achievement ObjectivesExploring shape and space
Within a range of meaningful contexts, students should be able to:
• describe the features of 2-dimensional and 3-dimensional objects, using the languageof geometry;
• design and make containers to specified requirements;
• model and describe 3-dimensional objects illustrated by diagrams or pictures;
• draw pictures of simple 3-dimensional objects;
• draw and interpret simple scale maps.
Exploring symmetry and transformations
Within a range of meaningful contexts, students should be able to:
• describe patterns in terms of reflection and rotational symmetry, and translations;
• design and make a pattern which involves translation, reflection, or rotation;
• enlarge, on grid paper, simple shapes to a specified scale.
101
Suggested Learning ExperiencesExploring shape and space
Students should be:
• making simple shapes and objects found in their environment using, for example,paper-folding methods, geoboards, compasses, and Logo;
• making models of objects and scenes represented in photographs and drawings;
• drawing pictures of simple geometric objects;
• talking about simple shapes and objects, using the language of geometry — sides,edges, faces, triangle, rectangle, right angle, parallel, radius;
• exploring tangrams;
• designing simple containers to hold sets of objects such as beans or sweets;
• predicting and checking the shapes of different cross-sections through everydayobjects (for example, an ice cream cone);
• giving and following instructions to follow shortest/longest paths between positions(in mazes, maps, Logo);
• drawing and interpreting simple scale maps;
• exploring the idea of locus, for example, the path followed by a small object as itmoves on playground equipment, such as a merry-go-round or swing.
Level 3
Exploring symmetry and transformations
Students should be:• using mirrors and cutting out shapes defined by creases in folded paper to explore
reflection and rotational symmetry;
• designing patterns which involve translation, reflection, or rotation, for example, byusing Logo;
• tessellating quadrilaterals, triangles, and regular polygons;
• enlarging or reducing shapes on grid paper, and objects made from cubes, to a
specified scale (for example, 12 , 2).

102
Geometry
Sample Assessment ActivitiesThese assessment activities are examples of the kinds of tasks which teachers could devisefor their own assessment programme.
• Students design and make a container to hold, for example, an Easter egg orsweets for sale at a school fair.
Using this example, teachers could assess students’ ability to:- design and make containers to specified requirements (G3);- devise and use problem-solving strategies to explore situations mathematically
(MP3).
• Students make a square by devising and following a series of Logo instructions.
Using this example, teachers could assess students’ ability to:- describe the features of 2-dimensional and 3-dimensional objects, using the
language of geometry (G3);
- use equipment appropriately when exploring mathematical ideas (MP3);- devise and follow a set of instructions to carry out mathematical activity (MP3).
• Students demonstrate translation, reflection, or rotation by making a pattern usinga traced image, perhaps a favourite character from a story book.
Using this example, teachers could assess students’ ability to:- describe patterns in terms of reflection and rotational symmetry, and translations
(G3);- design and make a pattern which involves translation, reflection, or rotation (G3);- use their own language, and mathematical language and diagrams, to explain
mathematical ideas (MP3).
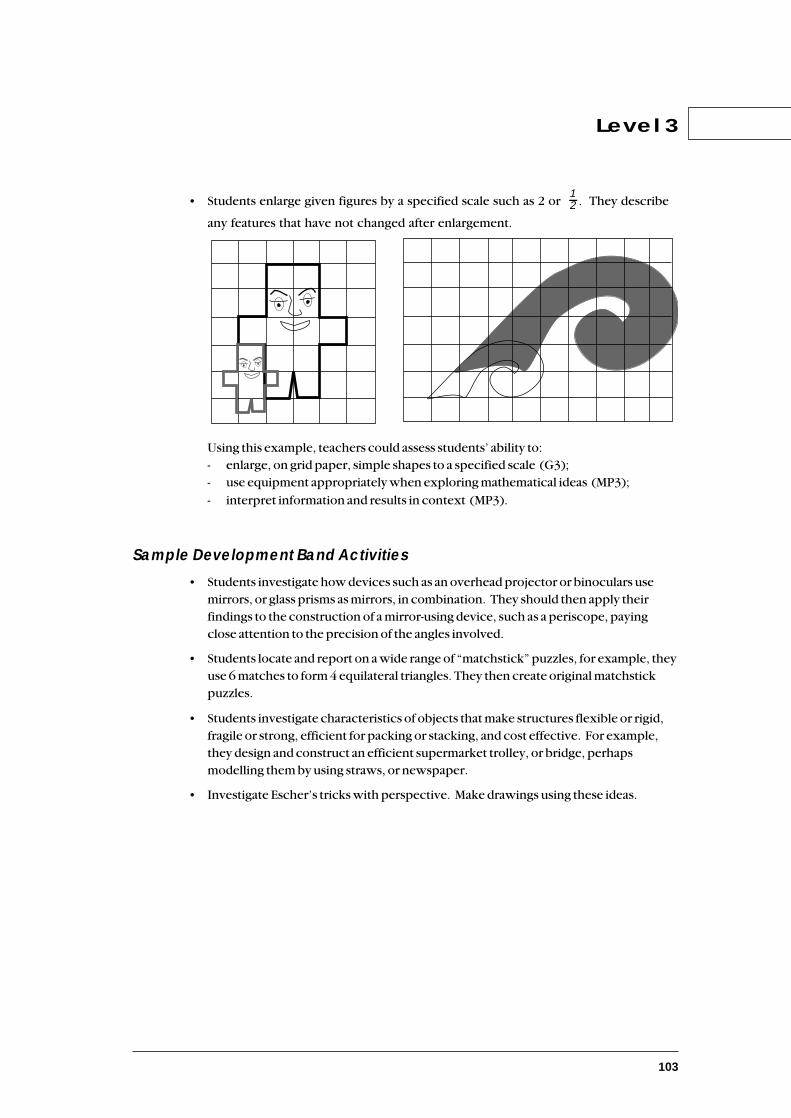
103
• Students enlarge given figures by a specified scale such as 2 or 12 . They describe
any features that have not changed after enlargement.
Using this example, teachers could assess students’ ability to:- enlarge, on grid paper, simple shapes to a specified scale (G3);- use equipment appropriately when exploring mathematical ideas (MP3);
- interpret information and results in context (MP3).
Sample Development Band Activities
• Students investigate how devices such as an overhead projector or binoculars usemirrors, or glass prisms as mirrors, in combination. They should then apply theirfindings to the construction of a mirror-using device, such as a periscope, payingclose attention to the precision of the angles involved.
• Students locate and report on a wide range of “matchstick” puzzles, for example, theyuse 6 matches to form 4 equilateral triangles. They then create original matchstickpuzzles.
• Students investigate characteristics of objects that make structures flexible or rigid,fragile or strong, efficient for packing or stacking, and cost effective. For example,they design and construct an efficient supermarket trolley, or bridge, perhapsmodelling them by using straws, or newspaper.
• Investigate Escher’s tricks with perspective. Make drawings using these ideas.
Level 3
104
Geometry
Achievement ObjectivesExploring shape and space
Within a range of meaningful contexts, students should be able to:
• construct triangles and circles, using appropriate drawing instruments;
• design the net and make a simple polyhedron to specified dimensions;
• make a model of a solid object from diagrams which show views from the top, front,side, and back;
• draw diagrams of solid objects made from cubes;
• specify location, using bearings or grid references.
Exploring symmetry and transformations
Within a range of meaningful contexts, students should be able to:
• apply the symmetries of regular polygons;
• describe the reflection or rotational symmetry of a figure or object;
• enlarge and reduce a 2-dimensional shape and identify the invariant properties.
105
Suggested Learning ExperiencesExploring shape and space
Students should be:
• designing shapes comprising circles, rectangles, triangles, and other polygons, andtalking about shapes they make using the language of geometry including words suchas sector, arc, perimeter, circumference, semicircle, scalene, equilateral, isosceles,pyramid, vertical, horizontal;
• drawing solids (cuboids and solids made from cuboids) viewed from differentpositions by first sketching, then using isometric paper, and later squared paper;
• building solids from diagrams which show views from the top, front, back, and side;
• investigating the construction and use of packaging and containers (including regularpolyhedra) in the commercial world, for example, to minimise wastage, and forstacking (tessellating end faces);
• estimating, measuring, and drawing angles, including vertically opposite angles,adjacent angles on a straight line, and angles at a point, using a protractor and Logo;
• constructing polygons to given specifications, using paper folding, ruler, compassesand protractor, and Logo;
• using a compass to indicate directions (orienteering, weather directions);
• exploring and using a variety of 2-dimensional grids to specify location (seating plans,maps);
• investigating different pathways, including the shortest path between two locationson a map;
• drawing loci (the paths of objects moving in space) including the flight path of balls,the locus of points which are a fixed distance from a given point (circle), a givenstraight line (a parallel line), and a circle (a concentric circle).
Level 4
Exploring symmetry and transformations
Students should be:• describing the symmetry (reflection and rotational) in patterns, objects, and designs
(frieze patterns, kowhaiwhai, wrapping paper, stained-glass window designs);
• exploring the three regular, and the eight semi-regular, tessellations constructed fromregular polygons (equilateral triangles, squares, pentagons, hexagons, octagons, anddodecagons);
• investigating the geometry of distortion, using a variety of grids;
• investigating properties of shapes and objects that are or are not changed byenlargement (length, area, volume, angle size, shape, and orientation).
106
Geometry
Sample Assessment ActivitiesThese assessment activities are examples of the kinds of tasks which teachers could devisefor their own assessment programme.
• Students:
- use drawing instruments to design a stained glass window or a quilt coverwhich incorporates squares, triangles, and circles;
- design a net for, and then construct, a rectangular box to hold a delicatespherical object of known dimensions;
- design a space-age cycle which makes use of circular and triangular shapes.
Using this example, teachers could assess students’ ability to:
- construct triangles and circles, using appropriate drawing instruments (G4);- design the net and make a simple polyhedron to specified dimensions (G4);- use equipment appropriately when exploring mathematical ideas (MP4);- use their own language, and mathematical language and diagrams, to explain
mathematical ideas (MP4).
• Students design and make:
- a tipare (head band), describing any translations or symmetry it possesses;
- Christmas wrapping paper involving rotational symmetry of order 3, as well astranslation;
- a kowhaiwhai pattern, involving translations and reflections and using, forexample, the mango (hammerhead shark) as the basic motif.
Using this example, teachers could assess students’ ability to:- describe the reflection or rotational symmetry of a figure or object (G4);- use equipment appropriately when exploring mathematical ideas (MP4);- use their own language, and mathematical language and diagrams, to explain
mathematical ideas (MP4).
• Students draw all possible pentominoes, decide which ones will fold to give a boxwithout a lid, and then decide which of the pentominoes will tessellate in orderthat a manufacturer can cut out nets from large sheets of cardboard to ensureminimum wastage.
Using this example, teachers could assess students’ ability to:
- design the net and make a simple polyhedron to specified dimensions (G4);- use equipment appropriately when exploring mathematical ideas (MP4);- devise and use problem-solving strategies to explore situations mathematically
(MP4);- use their own language, and mathematical language and diagrams, to explain
mathematical ideas (MP4).

107
• Students use cubes to:
- construct a 3-dimensional object from drawings of the different faces. Forexample:
- build a shape, like the one illustrated below, and then use squared paper todraw top, front, back, and side views.
Using this example, teachers could assess students’ ability to:- make a model of a solid object from diagrams which show views from the top,
front, side, and back (G4);- draw diagrams of solid objects made from cubes (G4);
- use equipment appropriately when exploring mathematical ideas (MP4);- use their own language, and mathematical language and diagrams, to explain
mathematical ideas (MP4).
• Students working in groups:
- design and construct a model of the school and grounds, to a scale of 1:200;
- draw a map of the school grounds and use co-ordinates to find a specifiedlocation on the map.
Using this example, teachers could assess students’ ability to:- specify location, using bearings or grid references (G4);- draw diagrams of solid objects made from cubes (G4);- enlarge and reduce a 2-dimensional shape and identify the invariant properties
(G4);
- devise and use problem-solving strategies to explore situations mathematically(MP4).
Level 4
Top Front Back Left Right
108
Sample Development Band Activities• Students investigate the “Knight’s Tour”. For example, is it possible for a knight to
visit every square on a chess board once and once only?
• Students design an original board game which requires the use of co-ordinates.
• Students design and construct a detailed scale model of their house.
• Students locate, solve, and explore the mathematics in spatial puzzles such as a Somacube, or a Greek cross, and use the information they gain to devise an original 3-dimensional puzzle based on a mathematical idea.
• Students research and report on the use of geometrical ideas in art. for example:- Escher’s use of tessellations;
- Mitsumasa Anno and “optical illusion”;- the occurrences of the golden section in art and architecture.
• Construct a kitchen or bathroom from a scale plan. Cost the design.
Geometry

109

110
Geometry
Achievement ObjectivesExploring shape and space
Within a range of meaningful contexts, students should be able to:
• use the angle properties of parallel lines and explain the reasoning involved;
• apply the symmetry and angle properties of polygons;
• use the angle between a tangent and radius property, and the angle-in-a-semicircleproperty;
• construct right angles, parallel and perpendicular lines, circles, simple polygons,medians, mediators, altitudes, and angle bisectors;
• find an unknown side in a right-angled triangle, using scale drawing, Pythagoras’theorem, or an appropriate trigonometric ratio;
• make isometric drawings of 3-dimensional objects built out of blocks;
• solve practical problems which can be modelled, using vectors.
Exploring symmetry and transformations
Within a range of meaningful contexts, students should be able to:
• recognise when 2 shapes are similar, find the scale factor, and use this to find anunknown dimension;
• use the symmetry and angle properties of polygons to solve practical problems;
• use and interpret vectors which describe translations;
• identify and use invariant properties under transformations.
111
Suggested Learning ExperiencesExploring shape and space
Students should be:
• exploring the relationships between geometry and a range of art forms;
• exploring paper folding and the use of drawing instruments to construct parallel andperpendicular lines, tangents to a circle, using the radius to the point of contact, anglebisectors, mediators, specified angles, and finding centres of circles;
• exploring, talking about, and making the shapes around them, including:
- traditional Maori patterns, for example, kowhaiwhai, taniko, tukutuku, whakairo;- circles, ellipses, and spirals;- precise designs requiring drawing instruments.
• investigating, and applying in practical contexts, Pythagoras’ Theorem, and the angle-in-the-semicircle property;
• exploring the properties of polygons, including the relationships between thenumber of sides of regular and irregular polygons (triangles, quadrilaterals,pentagons, hexagons) and the sum of the interior and exterior angles;
• exploring the relationships between angles (corresponding, alternate, and co-interiorangles) when two or more parallel lines are cut by another line;
• further exploring the concept of “locus”, for example:
- the points equidistant from two points, the locus of points equidistant from apoint and a line;
- points equidistant from pairs of vertices and sides in triangles (leading to thecircum-circle and in-circle, although these terms are not expected to be known).Compare and contrast with the intersections of medians and altitudes.
• making skeleton models of 3-dimensional objects in order to identify the internalright-angled triangles;
• drawing 3-dimensional objects, using isometric or squared paper.
Level 5
Exploring symmetry and transformations
Students should be:• finding, in practical contexts, the scale factors for similar objects in 2 dimensions and
3 dimensions, and calculating unknown measurements;
• enlarging and reducing simple shapes, given the centre of enlargement and scalefactor (integral or simple fraction) in 2 and 3 dimensions, and exploring therelationship between the scale factors for length, area, and volume;
• investigating applications of rotation;
• investigating mathematical descriptions of transformations (including vectors todescribe translations);
• identifying all the properties of a figure that do and do not change under standardtransformations;
• exploring transformations of shapes on non-square grids.
112
Geometry
Sample Assessment ActivitiesThese assessment activities are examples of the kinds of tasks which teachers could devisefor their own assessment programme.
• Students produce and describe drawings and constructions involving parallel lines.For example, they construct drawings of practical situations such as for diagonalbracing, quilting patterns, or a tipare (headband). They produce a reportdescribing symmetries and indicating angle relationships in the patterns. Thereport may be presented verbally.
Using this example, teachers could assess students’ ability to:- use the angle properties of parallel lines and explain the reasoning involved (G5);- construct right angles, parallel and perpendicular lines, circles, simple polygons,
medians, mediators, altitudes, and angle bisectors (G5);- describe the reflection or rotational symmetry of a figure or object (G4);
- report the results of mathematical explorations concisely and coherently (MP5).
• Students design and draw a model for an object which has a shape based on aregular polygon, for example, a merry-go-round, and discuss the symmetries andangles involved.
Using this example, teachers could assess students’ ability to:- construct right angles, parallel and perpendicular lines, circles, simple polygons,
medians, mediators, altitudes, and angle bisectors (G5);- apply the symmetry and angle properties of polygons (G5).
• Students find the centre of a circular piece of material by as many methods aspossible, and compare the methods. (A practical context might involve theconstruction of a model clock.)
Using this example, teachers could assess students’ ability to:- use the angle between a tangent and radius property, and the angle-in-a-semicircle
property (G5);
- construct right angles, parallel and perpendicular lines, circles, simple polygons,medians, mediators, altitudes, and angle bisectors (G5);
- describe the reflection or rotational symmetry of a figure or object (G4);- devise and use problem-solving strategies to explore situations mathematically
(MP5);- report the results of mathematical explorations concisely and coherently (MP5).
• Students prepare a poster explaining the construction of the golden rectangle andthe subsequent constructions to produce spirals found in nature.
Using this example, teachers could assess students’ ability to:- construct right angles, parallel and perpendicular lines, circles, simple polygons,
medians, mediators, altitudes, and angle bisectors (G5);
- recognise when 2 shapes are similar, find the scale factor, and use this to find anunknown dimension (G5);
- devise and follow a set of instructions to carry out mathematical activity (MP5).
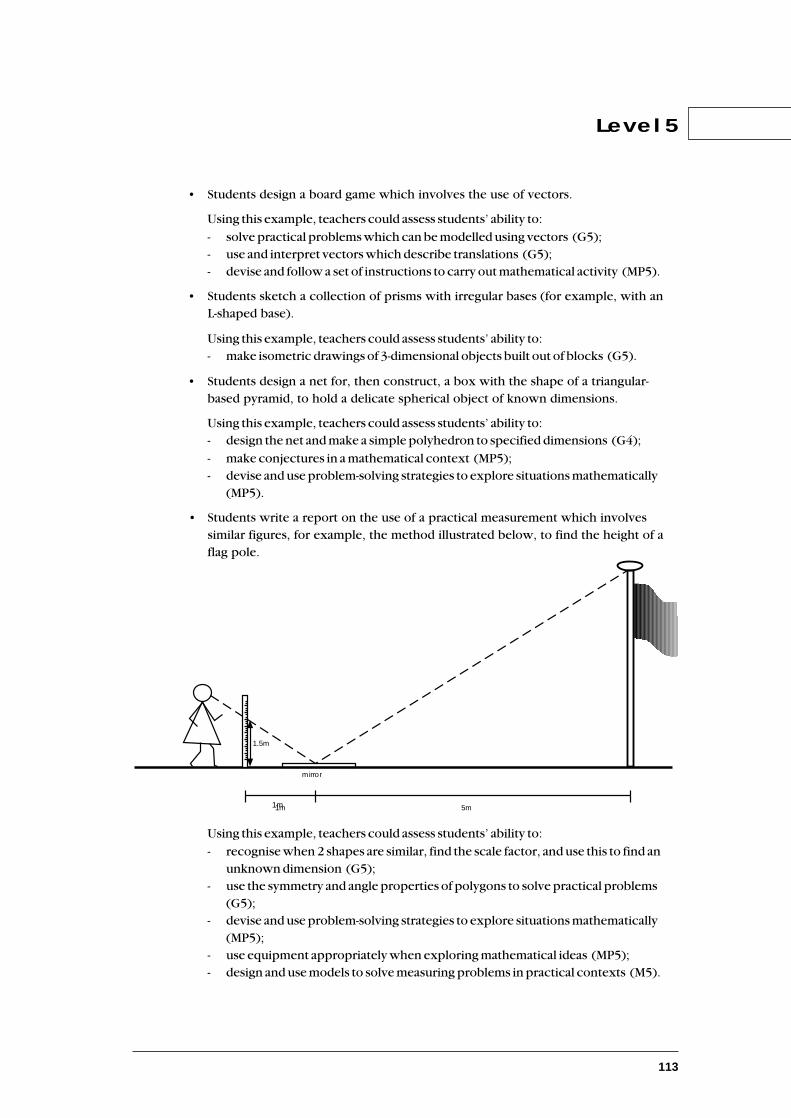
113
• Students design a board game which involves the use of vectors.
Using this example, teachers could assess students’ ability to:
- solve practical problems which can be modelled using vectors (G5);- use and interpret vectors which describe translations (G5);- devise and follow a set of instructions to carry out mathematical activity (MP5).
• Students sketch a collection of prisms with irregular bases (for example, with anL-shaped base).
Using this example, teachers could assess students’ ability to:- make isometric drawings of 3-dimensional objects built out of blocks (G5).
• Students design a net for, then construct, a box with the shape of a triangular-based pyramid, to hold a delicate spherical object of known dimensions.
Using this example, teachers could assess students’ ability to:- design the net and make a simple polyhedron to specified dimensions (G4);
- make conjectures in a mathematical context (MP5);- devise and use problem-solving strategies to explore situations mathematically
(MP5).
• Students write a report on the use of a practical measurement which involvessimilar figures, for example, the method illustrated below, to find the height of aflag pole.
Using this example, teachers could assess students’ ability to:
- recognise when 2 shapes are similar, find the scale factor, and use this to find anunknown dimension (G5);
- use the symmetry and angle properties of polygons to solve practical problems(G5);
- devise and use problem-solving strategies to explore situations mathematically(MP5);
- use equipment appropriately when exploring mathematical ideas (MP5);- design and use models to solve measuring problems in practical contexts (M5).
Level 5
1.5m
mirror
1m 5m1m

114
Geometry
• Students test conjectures. For example, they might investigate the followingproposition: “You cannot draw a circle touching all 3 vertices of a 3, 4, 5 triangle.”Students explain their reasoning. They then make a more general conjecture andtest it.
Using this example, teachers could assess students’ ability to:
- make conjectures in a mathematical context (MP5);- use their own language, and mathematical language and diagrams, to explain
mathematical ideas (MP5).
Sample Development Band Activities
• Students investigate the applicability of Pythagoras’ Theorem for geometric shapesother than right-angled triangles, and propose and test their own theorems for otherregular figures.
• Students investigate and report on applications of geometry in architecture.
• Students present a report on a series of investigations on the theme of inscribingfigures within other figures. For example, what is the biggest square that can bedrawn within a given triangle? If the area of the triangle is fixed, what shape allowsthe biggest square? Make, test, and report on conjectures about higher-order shapeswithin other figures.
• Students investigate other geometries, for example, rubber sheet topology.
• Invent a tool for producing right angles to be used by a clothing manufacturer,draftsperson, or builder.

115

116
Geometry
Achievement ObjectivesExploring shape and space
Within a range of meaningful contexts, students should be able to:
• draw and interpret 2-dimensional representations of 3-dimensional objects;
• find unknown angles and lengths in practical problems which can be modelled bytriangles, using scale drawing, angle properties of triangles, Pythagoras’ theorem,trigonometric ratios, the sine rule, or the cosine rule;
• identify and solve right-angled triangles within 3-dimensional objects and drawings;
• explore and describe a locus formed in a practical situation.
Exploring symmetry and transformations
Within a range of meaningful contexts, students should be able to:
• apply the relationship between the scale factors for length, area, and volume;
• explain the effect of negative scale factors for enlargement;
• describe the net effect of combining two or more transformations (reflections,rotations, or translations).
117
Level 6
Suggested Learning ExperiencesExploring shape and space
Students should be:
• calculating unknown lengths and angles in triangles generated in practical problems;
• describing the sections of 3-dimensional objects, exploring the angles and planesfound in them, and identifying and using right-angled triangles to calculatedimensions;
• finding measures of circles such as arc lengths, area of sector, and further angleproperties in circles, including those associated with chords, and exploring therelationships between them;
• Solving practical problems, using co-ordinate systems on a sphere (latitude andlongitude) to extend ideas of circle geometry and trigonometry;
• investigating further loci, for example, methods of drawing conic sections;
• investigating loci which are dependent on frame of reference, for example, the pathmade by a person walking from the centre to the outside of a moving merry-go-round,the path of a newspaper thrown from a moving car.
Exploring symmetry and transformations
Students should be:• investigating combinations of two transformations and, where possible, describing
the single transformation with the same result;
• finding the centre and angle of rotation on figures involving rotation;
• investigating symmetry transformations of frieze patterns;
• exploring further the scale factors for area, surface area, and volume, using them inpractical situations, and exploring negative scale factors;
• exploring the images when simple geometric shapes are rotated or reflected,including the generation of solids of revolution;
• using a calculator or computer to explore transformations of graphs of functions, andof 2-dimensional and 3-dimensional objects.
118
Geometry
Sample Assessment ActivitiesThese assessment activities are examples of the kinds of tasks which teachers could devisefor their own assessment programme.
• Students construct a 3-dimensional object and calculate its angles and dimension.For example, they construct a right pyramid with a rectangular base 20 cm by 30cm and a height of 25 cm, and calculate the slant height and the angles the slopingedges and the sloping sides make with the base.
Using this example, teachers could assess students’ ability to:- identify and solve right-angled triangles within 3-dimensional objects and
drawings (G6);- design the net and make a simple polyhedron to specified dimensions (G4);- use equipment appropriately when exploring mathematical ideas (MP5).
• Students accurately mark out a scale drawing of a playing court or field, andinvestigate situations such as horizontal distances traversed by players or balls, oroptimum angles for certain plays. For example, how far does the first pass in net-ball travel if the receiver is standing on the intersection of the side line and the“third line”?
Using this example, teachers could assess students’ ability to:
- construct right angles, parallel and perpendicular lines, circles, simple polygons,medians, mediators, altitudes, and angle bisectors (G5);
- find unknown angles and lengths in practical problems which can be modelled bytriangles, using scale drawing, angle properties of triangles, Pythagoras’ theorem,trigonometric ratios, the sine rule, or the cosine rule (G6);
- demonstrate the knowledge and skills necessary to plan, implement, and evaluatepractical measuring tasks (M6);
- design and use a 2-dimensional scale to represent data (M6);
- pose questions for mathematical exploration (MP6).
• Students investigate applications relating to length, area, volume, and profit. Forexample, a baker makes a certain-sized birthday cake for $25 and agrees to makeanother one, with all the dimensions doubled, for $50. Students might investigate,for example, the amount of icing, the length of frilly paper edging, the number ofcalories, and the profit.
Using this example, teachers could assess students’ ability to:- apply the relationship between the scale factors for length, area, and volume
(G6);- pose questions for mathematical exploration (MP6);- devise a strategy to solve a number problem (N6);- estimate and calculate answers, making efficient use of a calculator, where
appropriate, as part of solving a problem (N6);
- find perimeters, areas, and volumes of everyday objects (including irregular andcomposite shapes), and state the precision (limits) of the answer (M5).
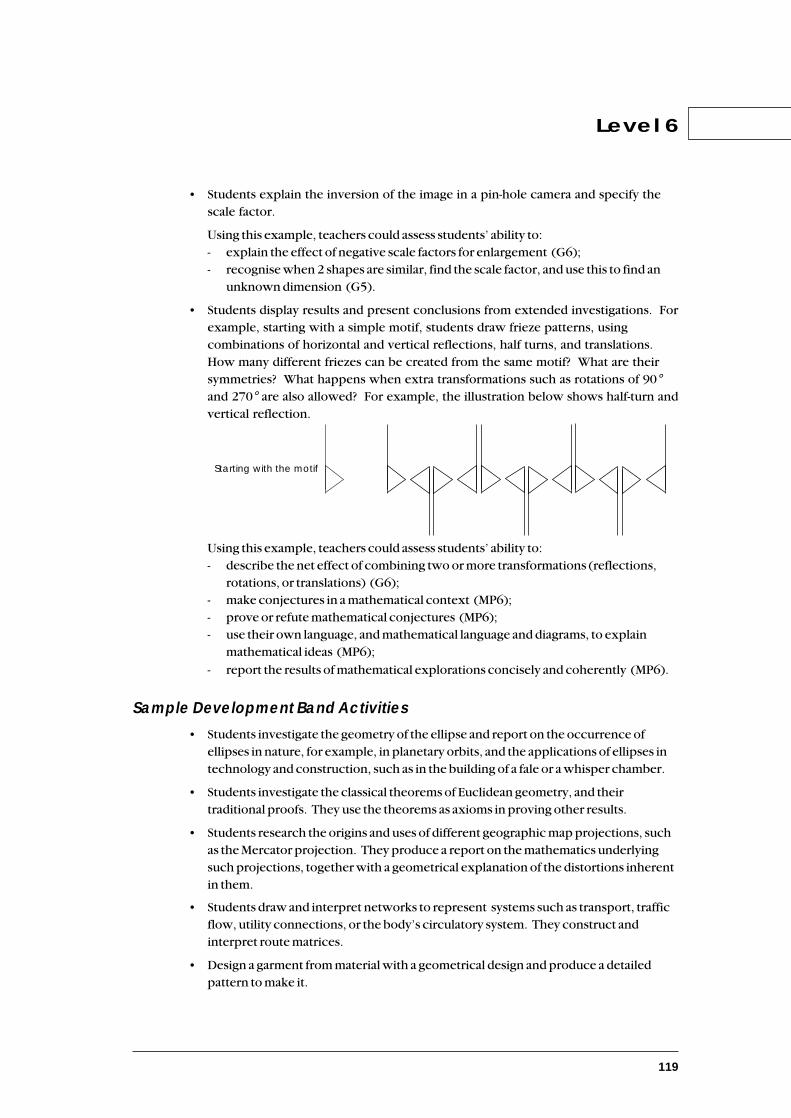
119
• Students explain the inversion of the image in a pin-hole camera and specify thescale factor.
Using this example, teachers could assess students’ ability to:- explain the effect of negative scale factors for enlargement (G6);- recognise when 2 shapes are similar, find the scale factor, and use this to find an
unknown dimension (G5).
• Students display results and present conclusions from extended investigations. Forexample, starting with a simple motif, students draw frieze patterns, usingcombinations of horizontal and vertical reflections, half turns, and translations.How many different friezes can be created from the same motif? What are theirsymmetries? What happens when extra transformations such as rotations of 90°and 270° are also allowed? For example, the illustration below shows half-turn andvertical reflection.
Using this example, teachers could assess students’ ability to:- describe the net effect of combining two or more transformations (reflections,
rotations, or translations) (G6);- make conjectures in a mathematical context (MP6);- prove or refute mathematical conjectures (MP6);- use their own language, and mathematical language and diagrams, to explain
mathematical ideas (MP6);
- report the results of mathematical explorations concisely and coherently (MP6).
Sample Development Band Activities• Students investigate the geometry of the ellipse and report on the occurrence of
ellipses in nature, for example, in planetary orbits, and the applications of ellipses intechnology and construction, such as in the building of a fale or a whisper chamber.
• Students investigate the classical theorems of Euclidean geometry, and theirtraditional proofs. They use the theorems as axioms in proving other results.
• Students research the origins and uses of different geographic map projections, suchas the Mercator projection. They produce a report on the mathematics underlyingsuch projections, together with a geometrical explanation of the distortions inherentin them.
• Students draw and interpret networks to represent systems such as transport, trafficflow, utility connections, or the body’s circulatory system. They construct andinterpret route matrices.
• Design a garment from material with a geometrical design and produce a detailedpattern to make it.
Level 6
Starting with the motif
120
Geometry
Achievement ObjectivesExploring co-ordinate geometry
Within a range of meaningful contexts, students should be able to:
• find the distance between 2 points on a co-ordinate plane;
• given an equation representing a straight line in 2 dimensions, find its gradient;
• write and use equations of straight lines in 2 dimensions, given necessary andsufficient information (including a point and the equation of a parallel orperpendicular line);
• find the co-ordinates of the intersection of a straight line and a curve, given theirequations;
• convert between rectangular and polar co-ordinates in 2 dimensions.
Exploring networks
Within a range of meaningful contexts, students should be able to:
• choose an appropriate network to organise and visually represent information;
• systematically develop, and critically evaluate, optimal solutions using networks.
121
Suggested Learning ExperiencesExploring co-ordinate geometry
Students should be:
• using the language and techniques of co-ordinate geometry to investigate, describe,and derive properties of 2- and 3-dimensional shapes (using computer softwarewhere appropriate);
• investigating properties of lines, including conditions for parallel and perpendicularlines, and recognising common features associated with the forms y = mx + c,
ax + by + c = 0, y - y1x - x1
= = m;
• investigating the intersection of pairs of straight lines and a straight line and a curve
(including curves such as a circle with centre (0,0), y = ax2, y = ax , using both
algebraic and graphical techniques;
• solving practical problems involving lines, distances, and angles;
• exploring co-ordinate systems, including equivalences between rectangular andpolar co-ordinates, using appropriate technology.
Level 7
Exploring networks
Students should be:• investigating shortest paths in networks, for example, using a skeleton map of a town
to find the shortest path between two places;
• investigating the minimum spanning tree of a network, for example, using a skeletonmap of a town to find the minimum length of wire required to connect given places inthe town to a telephone service;
• exploring traversability in networks, for example, the postie problem, or theKönigsberg bridge problem;
• using networks to model and investigate activities such as simple manufacturingprocesses, simple project management, and time-management schedules.Appropriate contexts for this study could include preparing meals, or mounting aschool drama production.
y2 - y
1x
2 - x
1
122
Geometry
Sample Assessment ActivitiesThese assessment activities are examples of the kinds of tasks which teachers could devisefor their own assessment programme.
• Students apply co-ordinate geometry techniques in mathematically rich contexts.For example:
- Given the co-ordinates of the vertices of a triangle (or the equations of thethree sides), students find the co-ordinates of the circum-centre.
- Find the centre of mass of a triangular object by modelling the triangle usingco-ordinate geometry, and checking answers by experimentation.
Using this example, teachers could assess students’ ability to:- find the distance between 2 points on a co-ordinate plane (G7);- given an equation representing a straight line in 2 dimensions, find its gradient
(G7);- write and use equations of straight lines in 2 dimensions given necessary and
sufficient information (including a point and the equation of a parallel orperpendicular line) (G7);
- form and solve linear equations, simultaneous equations… (A6);- devise and use problem-solving strategies to explore situations mathematically
(MP7).
• Students investigate and report on the application of co-ordinate geometry to thesolution of practical problems. For example, investigate and report on trends infinance which are modelled by two lines which intersect.
Using this example, teachers could assess students’ ability to:- interpret information and results in context (MP7);- find the co-ordinates of the intersection of a straight line and a curve, given their
equations (G7).
• Students devise and/or analyse a board game using both polar and rectangular co-ordinates, and report.
Using this example, teachers could assess students’ ability to:
- convert between rectangular and polar co-ordinates in two dimensions (G7);- pose questions for mathematical exploration (MP7);- report the results of mathematical investigations concisely and coherently (MP7).
123
Level 7
• Students working in groups plan a venture involving network analysis for processplanning and optimisation. For example, a class “business” plans to make anddistribute pizzas to customers in the town.
Using this example, teachers could assess students’ ability to:
- choose an appropriate network to organise and visually represent information(G7);
- systematically develop, and critically evaluate, optimal solutions using networks(G7);
- use their own language, and mathematical language and diagrams, to explainmathematical ideas (MP7);
- devise and use problem-solving strategies to explore situations mathematically(MP7).
Sample Development Band Activities• Students investigate other geometries such as geometry on a sphere, cylinder, or
rubber sheet (topology).
• Students investigate navigation on the earth’s surface.
• Students investigate the use of triangulation in surveying and then, for example, inlocating satellites.
• Through a process of conjecture and justification, students find minimum sets ofconditions for which two triangles are congruent. They then use congruenceconditions for triangles as axioms in order to test the congruence of any two triangles.Students should then investigate conditions for congruence of quadrilaterals and3-dimensional figures such as tetrahedra.
• Construct geodesic domes.

124
Geometry
Achievement ObjectivesExploring co-ordinate geometry
Within a range of meaningful contexts, students should be able to:
• describe the nature of conic sections and sketch graphs of them;
• find equations of conic sections from given conditions and find the equations oftangents and normals to them;
• sketch and describe mathematically curves which occur in the environment.
125
Suggested Learning ExperiencesExploring co-ordinate geometry
Students should be:
• investigating (for example, by using drawing software) the curves formed from conicsections, exploring a variety of ways of drawing them, and investigating theiroccurrence in society and in nature;
• forming and investigating equations of the circle, ellipse, parabola, and hyperbola,including standard and parametric forms and conditions for tangents and normals;
• experiencing and investigating, for example, by using Logo, other real and artificialcurves such as fractals, snowflake curves, envelopes of curves, helixes, spirals,3-dimensional curves, and others.
Level 8
126
Geometry
Sample Assessment ActivitiesThese assessment activities are examples of the kinds of tasks which teachers could devisefor their own assessment programme.
• Students present a report that outlines the occurrence of conic sections, thefeatures of their graphs, and the transformation of one to another, anddemonstrate a variety of methods of drawing them.
Using this example, teachers could assess students’ ability to:- describe the nature of conic sections and sketch graphs of them (G8);- find equations of conic sections from given conditions and find the equations of
tangents and normals to them (G8);- use and interpret vectors which describe translations (G5);
- describe the relationship between members of families of curves in terms oftransformations (A7);
- effectively plan mathematical exploration (MP8).
• Students find the equation of the tangent and normal to the ellipse: x2 y2
a2 b2 = 1+
at the point (acos t, bsin t).
Using this example, teachers could assess students’ ability to:- find equations of conic sections from given conditions and find the equations of
tangents and normals to them (G8);- choose and apply appropriate differentiation techniques in context (M8);
- generalise mathematical ideas and conjectures (MP8).
• Students use CAD software (or other) to explore designs and geometric propertiesof objects in 3 dimensions.
Using this example, teachers could assess students’ ability to:- describe the nature of conic sections and sketch graphs of them (G8);- use equipment appropriately when exploring mathematical ideas (MP8);- classify objects, numbers, and ideas (MP8).
• Students investigate and report on the generation of fractals or Hilbert curves,using software such as Logo.
Using this example, teachers could assess students’ ability to:- sketch and describe mathematically curves which occur in the environment (G8);
- effectively plan mathematical exploration (MP8);- report the results of mathematical investigations concisely and coherently (MP8).
127
Sample Development Band Activities• Students explore vector analysis and use vector geometry to prove the classical
theorems of Euclidean geometry.
• Students investigate the geometry of shapes used as reflectors. For example:
- They investigate the light-focusing property of a parabolic curve.- They investigate what happens to light emitted from one focus of an ellipse.
Level 8

128

129
The mathematical processes skills — problem solving, reasoning, andcommunicating mathematical ideas — are learned and assessed within thecontext of the more specific knowledge and skills of number,measurement, geometry, algebra, and statistics.
Statistic
s
Alg
eb
ra
Ge
om
etry
Me
asu
rem
en
t
Nu
mb
er
Developing Logic and Reasoning
Communicating Mathematical Ideas
Problem Solving
Algebra
The mathematics curriculum intended by this statement will provide opportunities forstudents to:
■ recognise patterns and relationships in mathematics and the real world,and be able to generalise from these;
■ develop the ability to think abstractly and to use symbols, notation, andgraphs and diagrams to represent and communicate mathematicalrelationships, concepts, and generalisations;
■ use algebraic expressions confidently to solve practical problems.

130
Algebra
Achievement ObjectivesExploring patterns and relationships
Within a range of meaningful contexts, students should be able to:
• make and describe repeating and sequential patterns;
• continue a repeating and sequential pattern;
• illustrate and talk about relationships.
Exploring equations and expressions
Within a range of meaningful contexts, students should be able to:
• write number sentences, using = , from story contexts.

131
Level 1
Suggested Learning ExperiencesExploring patterns and relationships
Students should be:
• exploring repeating and sequential patterns by making and discussing them, usingcalculators to generate them, looking at how they continue, and predicting newterms;
• illustrating and talking about relationships, using pictures, arrows, and othermethods.
Exploring equations and expressions
Students should be:• exploring different ways to show the same number;
• telling number stories involving equals, less than, and greater than; writing andexplaining number sentences using =, <, >; and using calculators and concretematerial to make statements involving = and the operations (for example,2 + 3 = 3 + 2).

132
Algebra
Sample Assessment ActivitiesThese assessment activities are examples of the kinds of tasks which teachers coulddevise for their own assessment programme.
• Students:
- create a 4-member repeating pattern with physical objects, and describe wherethe pattern repeats;
- continue a 4-member repeating pattern (a pattern in a circle could beincluded);
- explain the rules for repeating “people” patterns. For example, who should benext in the pattern: boy, boy, girl, boy, boy, girl, ... and why?
- create and draw a repeating pattern.
Using this example, teachers could assess students’ ability to:
- make and describe repeating and sequential patterns (A1);- continue a repeating and sequential pattern (A1);- devise and use problem-solving strategies to explore situations mathematically
(MP1).
• Students illustrate and talk about relationships between two sets, for example, therelationship “likes” between a group of students and their pets (cats, dogs, turtles,canaries).
Using this example, teachers could assess students’ ability to:- illustrate and talk about relationships (A1);- use their own language … and diagrams to explain mathematical ideas (MP1).
....

133
• Students, working in groups, find out and record the number of different ways toget dressed, given four different coloured shirts and three different coloured hats.
Using this example, teachers could assess students’ ability to:
- illustrate and talk about relationships (A1);- devise and use problem-solving strategies to explore situations mathematically
(MP1);- use their own language … and diagrams to explain mathematical ideas (MP1).
• Students write a number sentence for a story. For example, Genna collected 4shells from one place on the beach and 2 shells from another place. She has 6shells altogether.
Using this example, teachers could assess students’ ability to:- write number sentences, using = , from story contexts (A1);- make up, tell, and record number stories, up to 9, about given objects and
sequence pictures (N1).
Sample Development Band Activities• Students arrange and re-arrange a number of objects to show different ways of
representing the number. They read and record each arrangement and explain the
result.
• Students make a chart showing the relationships they have sorted from a set of picturecards.
• Students make a number story book and share their entries with others. An entrymight be: Mum had three potatoes and Dad had seven. 7+3=10. Dad ate more thanMum. He had 4 more. 7 is 4 more than 3.
• Students explore, record, and describe a variety of number patterns, for example, byusing a hundreds board.
Level 1

134
Algebra
Achievement ObjectivesExploring patterns and relationships
Within a range of meaningful contexts, students should be able to:
• continue a sequential pattern and describe a rule for this;
• use graphs to illustrate relationships.
Exploring equations and expressions
Within a range of meaningful contexts, students should be able to:
• use the mathematical symbols =, <, > for the relationships “is equal to”, “is less than”,and “is greater than”.

135
Suggested Learning ExperiencesExploring patterns and relationships
Students should be:
• exploring, creating, describing, and continuing spatial and numerical sequentialpatterns, using calculators where appropriate, and developing the idea that somepatterns continue without end;
• using a variety of diagrams to show relationships, drawn from familiar situations, forexample,
• talking about and acting out ideas represented in their own and other graphs.
Level 2
Exploring equations and expressions
Students should be:• writing and talking about number sentences using =, <, >;
• using calculators and concrete materials to make statements involving = and the 4operations, for example, 3 + 4 = 4 + 3, and 3 x (4 + 5) = 3 x 4 + 3 x 5 and emphasisingthat these are alternative ways of expressing the same number;
• exploring the special properties of zero in the context of addition, and 1 in thecontext of multiplication.
Wake up
Breakfast Arrive at school
Playtime Lunch Going home
Tired
Full of energy
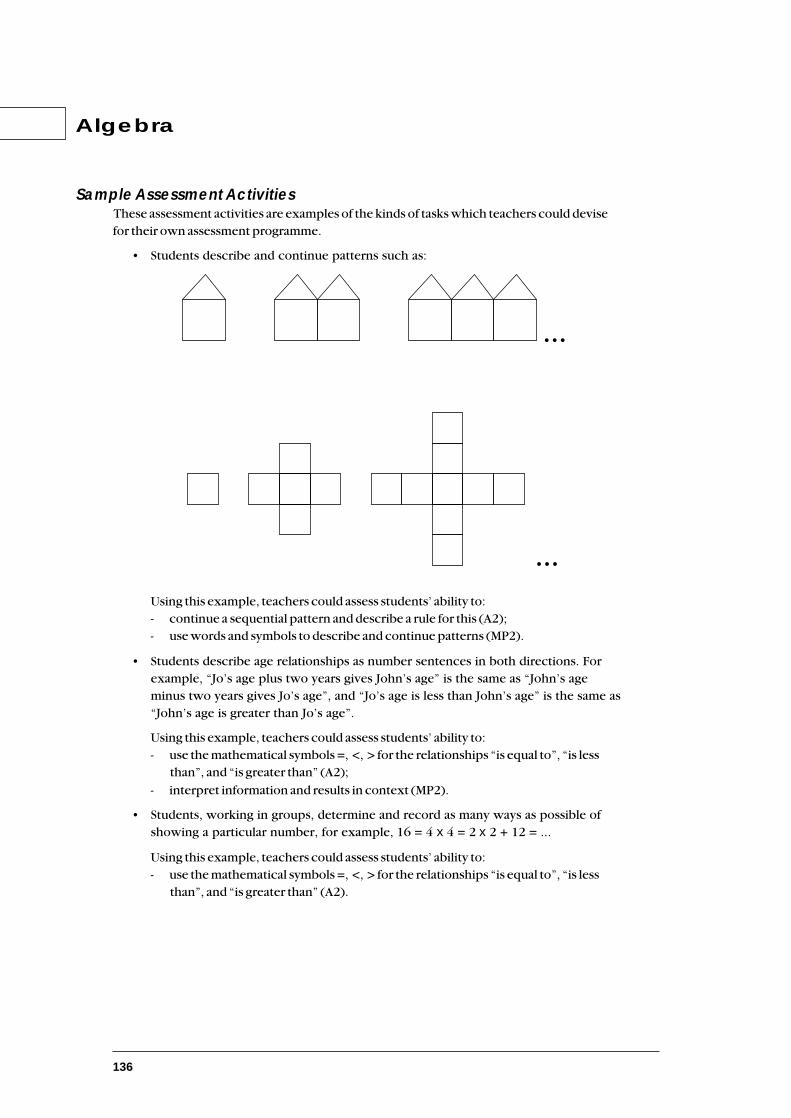
136
Algebra
Sample Assessment ActivitiesThese assessment activities are examples of the kinds of tasks which teachers could devisefor their own assessment programme.
• Students describe and continue patterns such as:
Using this example, teachers could assess students’ ability to:- continue a sequential pattern and describe a rule for this (A2);- use words and symbols to describe and continue patterns (MP2).
• Students describe age relationships as number sentences in both directions. Forexample, “Jo’s age plus two years gives John’s age” is the same as “John’s ageminus two years gives Jo’s age”, and “Jo’s age is less than John’s age” is the same as“John’s age is greater than Jo’s age”.
Using this example, teachers could assess students’ ability to:- use the mathematical symbols =, <, > for the relationships “is equal to”, “is less
than”, and “is greater than” (A2);
- interpret information and results in context (MP2).
• Students, working in groups, determine and record as many ways as possible ofshowing a particular number, for example, 16 = 4 x 4 = 2 x 2 + 12 = ...
Using this example, teachers could assess students’ ability to:- use the mathematical symbols =, <, > for the relationships “is equal to”, “is less
than”, and “is greater than” (A2).
...
...

137
• Students explain how to get the next numbers in a sequence. For example, whatare the next two numbers in the sequence 3, 10, 17 ...? What is the rule?
Using this example, teachers could assess students’ ability to:
- continue a sequential pattern and describe a rule for this (A2);- devise and use problem-solving strategies to explore situations mathematically
(MP2).
Sample Development Band Activities
• Students investigate and report on number patterns resulting from operations theyhave chosen. For example, what happens when numbers are doubled, odd (or even)numbers are added, 4 is added to numbers ending in 7 ?
• Given sequences of objects, students predict what the 10th, 20th, etc., objects wouldbe. They describe the starting sequence, write their prediction, and explain theirreasoning.
• Students explore attribute games. For example:
- They make a line which has a difference of three attributes between successiveblocks.
- They make lines in which the attribute differences between successive blocksvary according to a pattern.
Level 2

138
Algebra
Achievement ObjectivesExploring patterns and relationships
Within a range of meaningful contexts, students should be able to:
• describe in words, rules for continuing number and spatial sequential patterns;
• make up and use a rule to create a sequential pattern;
• state the general rule for a set of similar practical problems;
• use graphs to represent number, or informal, relations.
Exploring equations and expressions
Within a range of meaningful contexts, students should be able to:
• solve problems of the type □ + 15 = 39
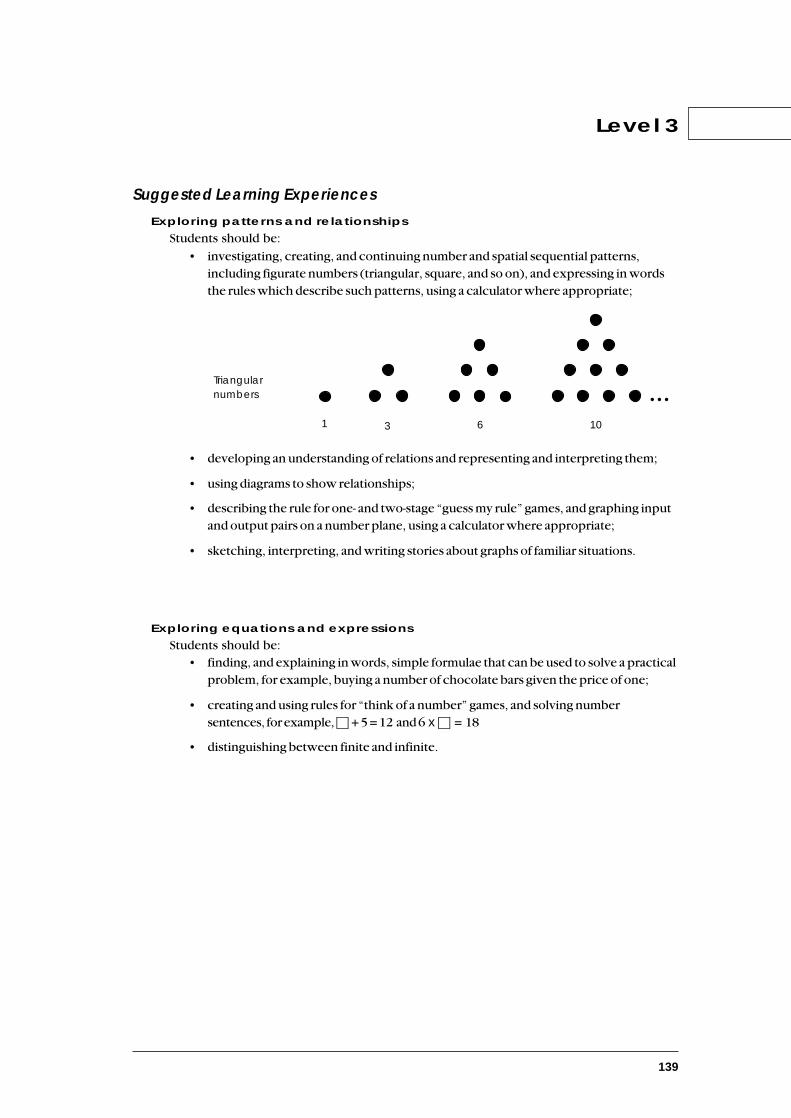
139
Suggested Learning ExperiencesExploring patterns and relationships
Students should be:
• investigating, creating, and continuing number and spatial sequential patterns,including figurate numbers (triangular, square, and so on), and expressing in wordsthe rules which describe such patterns, using a calculator where appropriate;
• developing an understanding of relations and representing and interpreting them;
• using diagrams to show relationships;
• describing the rule for one- and two-stage “guess my rule” games, and graphing inputand output pairs on a number plane, using a calculator where appropriate;
• sketching, interpreting, and writing stories about graphs of familiar situations.
Level 3
Exploring equations and expressions
Students should be:• finding, and explaining in words, simple formulae that can be used to solve a practical
problem, for example, buying a number of chocolate bars given the price of one;
• creating and using rules for “think of a number” games, and solving numbersentences, for example, □ + 5 = 12 and 6 x □ = 18
• distinguishing between finite and infinite.
Triangular numbers
1 3 6 10
...
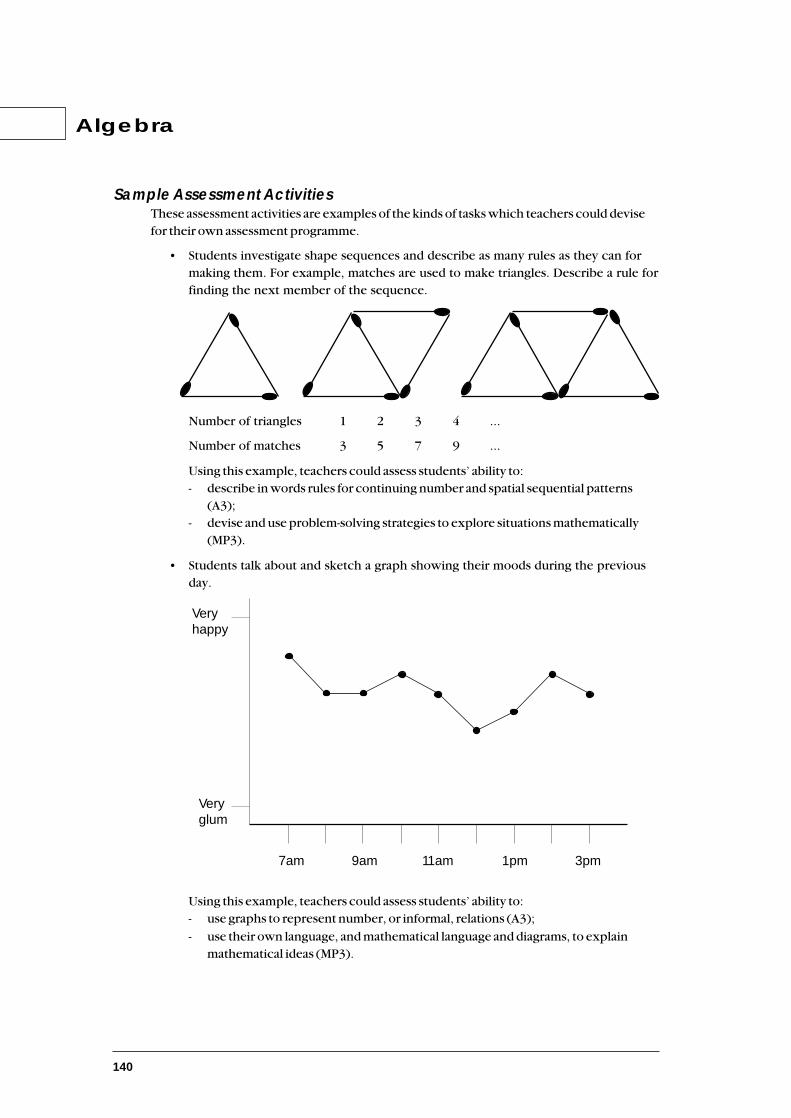
140
Sample Assessment ActivitiesThese assessment activities are examples of the kinds of tasks which teachers could devisefor their own assessment programme.
• Students investigate shape sequences and describe as many rules as they can formaking them. For example, matches are used to make triangles. Describe a rule forfinding the next member of the sequence.
Number of triangles 1 2 3 4 ...
Number of matches 3 5 7 9 ...
Using this example, teachers could assess students’ ability to:- describe in words rules for continuing number and spatial sequential patterns
(A3);- devise and use problem-solving strategies to explore situations mathematically
(MP3).
• Students talk about and sketch a graph showing their moods during the previousday.
Using this example, teachers could assess students’ ability to:- use graphs to represent number, or informal, relations (A3);
- use their own language, and mathematical language and diagrams, to explainmathematical ideas (MP3).
Algebra
7am 9am 11am 1pm 3pm
Very glum
Very happy
141
• Students solve problems of the type: Judy has some marbles. She wins 17 more ina game from her friend Bruce. She then has 35 marbles. How many did she have atthe start?
Using this example, teachers could assess students’ ability to:
- solve problems of the type □ + 15 = 39 (A3);- write and solve problems which involve whole numbers and decimals and which
require a choice of one or more of the four arithmetic operations (N3);- devise and use problem-solving strategies to explore situations mathematically
(MP3).
Sample Development Band Activities• Students investigate number patterns, then explore related situations for other
patterns. For example:
- What patterns can be found in the multiplication table of 9? Do similar patternsoccur in other multiplication tables?
- After investigating triangular and square numbers, they explore the possibility ofdefining 3-dimensional figurate numbers, such as tetrahedral or cubic numbers.
- Observing that 1+3 = 4, 1+3+5=9, 1+3+5+7=16, they generalise and predict(then test) the sum of the first 10 odd numbers, then the first 20, then the first200 odd numbers.
Level 3

142
Algebra
Achievement ObjectivesExploring patterns and relationships
Within a range of meaningful contexts, students should be able to:
• find a rule to describe any member of a number sequence and express it in words;
• use a rule to make predictions;
• sketch and interpret graphs on whole number grids which represent simple everydaysituations.
Exploring equations and expressions
Within a range of meaningful contexts, students should be able to:
• find and justify a word formula which represents a given practical situation;
• solve simple linear equations such as 2 □ + 4 = 16.

143
Suggested Learning ExperiencesExploring patterns and relationships
Students should be:
• finding, and continuing, linear number patterns from practical contexts and findingand justifying the rules which describe them;
• developing an understanding of relations and representing and interpreting them;
• sketching graphs which represent familiar situations;
• interpreting a relationship illustrated by points on a graph, for example,
• representing a relationship by a point on a graph;
• writing stories and talking about graphs representing familiar situations;
• generating and graphing sequences from rules expressed in a variety of ways;
• developing strategies for finding rules for linear patterns arising in practical contexts,and using symbols to express these rules.
Level 4
Exploring equations and expressions
Students should be:• using, creating, and describing formulae derived from practical contexts, using words
and symbols;
• solving number puzzles with whole number solutions which can be represented bysimple linear equations such as 2 □ + 4 = 16.
Volume
Co
st
A
B

144
Sample Assessment ActivitiesThese assessment activities are examples of the kinds of tasks which teachers could devisefor their own assessment programme.
• Students describe in words suitable rules to represent sequential patterns. Forexample, suitable descriptions for the following pattern would be “To get thenumber of lines in any drawing, multiply the number of squares by 3 and add 1.”“To get from one value to the next just add 3.”
Number of squares 1 2 3 4
Number of lines 4 7 10 13 ...
Predict the number of lines needed for 20 squares, and then graph the sequence.
Using this example, teachers could assess students’ ability to:
- find a rule to describe any member of a number sequence and express it in words(A4);
- use a rule to make predictions (A4);- devise and use problem-solving strategies to explore situations mathematically
(MP4);- use words and symbols to describe and generalise patterns (MP4).
• Students:
- solve informally problems based on relations and explain their reasoning. Forexample, one band for the school dance charges $150 plus $90 per hour andanother charges $60 plus $105 per hour. If $375 has been budgeted for theband, how long would each band play for and which will play longer?
- find a word formula for problems such as the following: The class is going tothe pictures in town. It costs $8.50 per person and $50 for the bus. What is thetotal cost for the class? What if 5 people are absent?
Using this example, teachers could assess students’ ability to:- find and justify a word formula which represents a given practical situation (A4);
- devise and use problem-solving strategies to explore situations mathematically(MP4);
- report the results of mathematical explorations concisely and coherently (MP4).
Algebra
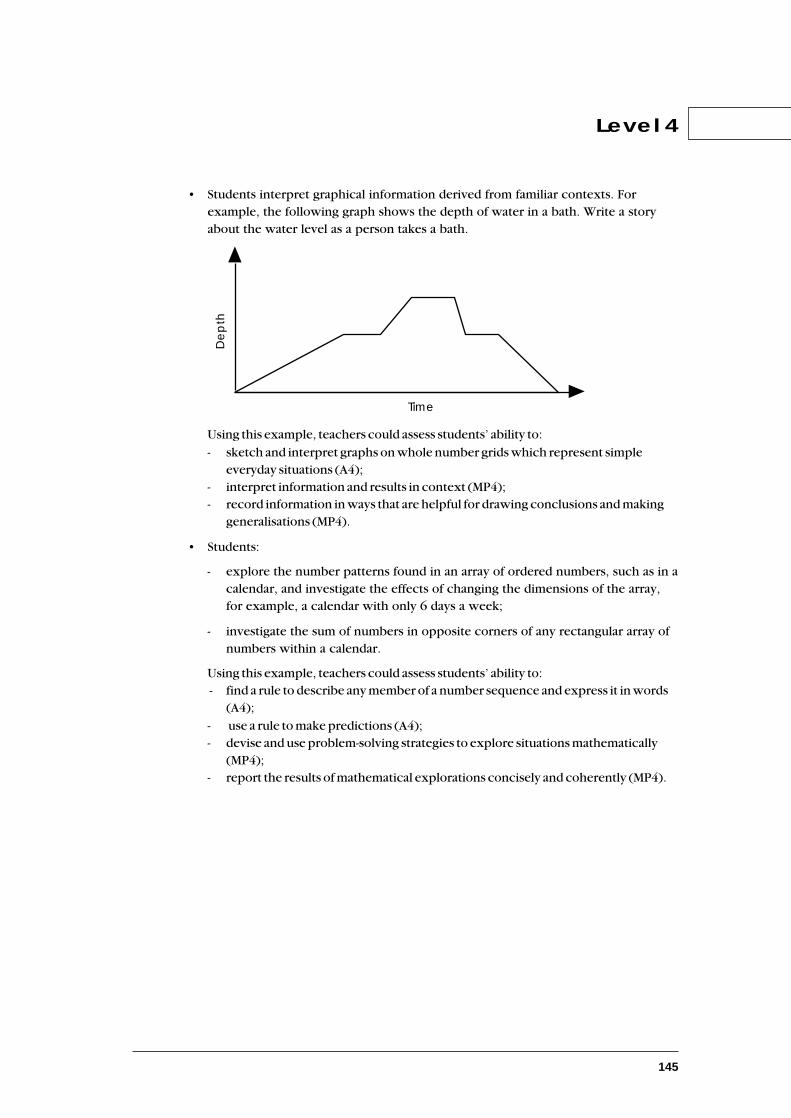
145
• Students interpret graphical information derived from familiar contexts. Forexample, the following graph shows the depth of water in a bath. Write a storyabout the water level as a person takes a bath.
Using this example, teachers could assess students’ ability to:
- sketch and interpret graphs on whole number grids which represent simpleeveryday situations (A4);
- interpret information and results in context (MP4);- record information in ways that are helpful for drawing conclusions and making
generalisations (MP4).
• Students:
- explore the number patterns found in an array of ordered numbers, such as in acalendar, and investigate the effects of changing the dimensions of the array,for example, a calendar with only 6 days a week;
- investigate the sum of numbers in opposite corners of any rectangular array ofnumbers within a calendar.
Using this example, teachers could assess students’ ability to: - find a rule to describe any member of a number sequence and express it in words
(A4);
- use a rule to make predictions (A4);- devise and use problem-solving strategies to explore situations mathematically
(MP4);- report the results of mathematical explorations concisely and coherently (MP4).
Level 4
Time
De
pth
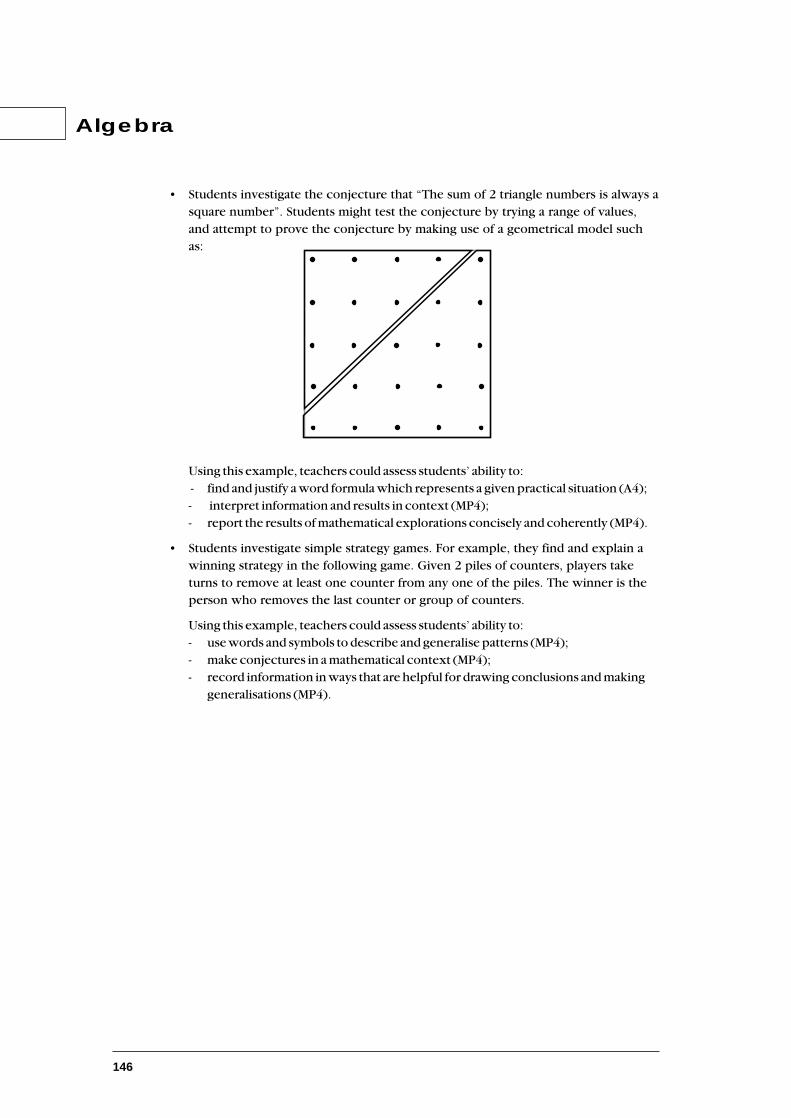
146
• Students investigate the conjecture that “The sum of 2 triangle numbers is always asquare number”. Students might test the conjecture by trying a range of values,and attempt to prove the conjecture by making use of a geometrical model suchas:
Using this example, teachers could assess students’ ability to: - find and justify a word formula which represents a given practical situation (A4);- interpret information and results in context (MP4);- report the results of mathematical explorations concisely and coherently (MP4).
• Students investigate simple strategy games. For example, they find and explain awinning strategy in the following game. Given 2 piles of counters, players taketurns to remove at least one counter from any one of the piles. The winner is theperson who removes the last counter or group of counters.
Using this example, teachers could assess students’ ability to:- use words and symbols to describe and generalise patterns (MP4);- make conjectures in a mathematical context (MP4);- record information in ways that are helpful for drawing conclusions and making
generalisations (MP4).
Algebra

147
Sample Development Band Activities• Students investigate and report on a number of different games of strategy. For
example:
- How many different games of noughts and crosses are possible? They coulddiscuss the concept of isomorphism in this context, and perhaps extend the ideato other contexts.
- They find a winning strategy for “Nim” or “21 or Bust” on a calculator.
Level 4

148
Algebra
Achievement ObjectivesExploring patterns and relationships
Within a range of meaningful contexts, students should be able to:
• generate patterns from a structured situation, find a rule for the general term, andexpress it in words and symbols;
• generate a pattern from a rule;
• sketch and interpret graphs which represent everyday situations;
• graph linear rules and interpret the slope and intercepts on an integer co-ordinatesystem.
Exploring equations and expressions
Within a range of meaningful contexts, students should be able to:
• evaluate linear expressions by substitution;
• solve linear equations;
• combine like terms in algebraic expressions;
• simplify algebraic fractions;
• factorise and expand algebraic expressions;
• use equations to represent practical situations.
149
Suggested Learning ExperiencesExploring patterns and relationships
Students should be:
• developing an understanding of relations, and representing and interpreting them;
• interpreting relationships illustrated by points on a graph and representing suchrelationships in other ways;
• sketching and interpreting graphs which represent everyday situations;
• using rules given in words, symbols, flow charts, or graphs, for example, calculatingthe dose of medication needed for children of varying ages;
• generating, in practical contexts, linear, quadratic, and other patterns, and findingand justifying the graphs and rules which describe them;
• generating sequences from rules expressed in words and algebraically;
• investigating practical situations that are approximated by linear functions, andinvestigating the interpretation of the slope and intercept of lines drawn frompractical contexts.
Exploring equations and expressions
Students should be:
• talking about the different ways rules can be expressed, for example,6n + 24 = (n + 4) x 6 = 6 x (4 + n).
• using algebraic expressions to generalise from numerical instances arising in apractical context, for example, generalising the fact that the diagonal corners of anyrectangular array on a calendar have the same sum, and expressing it in algebraicterms;
• developing an ability to solve equations in a problem context by:- exploring a variety of strategies for solving equations, for example, trial and
improvement, forming patterns, balancing, and reversing flow charts;
- exploring equations which have either no solution or multiple solutions;- representing problem constraints as algebraic inequalities;
• developing confidence in re-arranging and simplifying algebraic expressions by:- simplifying expressions by making tables, and by using the “rules of algebra”,
leading to simplifications such as x3 x x5 = x3+5 = x8 and a11 ÷ a4 = a 11-4 = a7.Examples might be:
x6x2x
1 32 33 3. .. .
- re-arranging linear equations and changing the subject of a formula in practicalcontexts;
- using number experience, geometric models, and so on, to develop skills infactorising, and expanding them.
Level 5
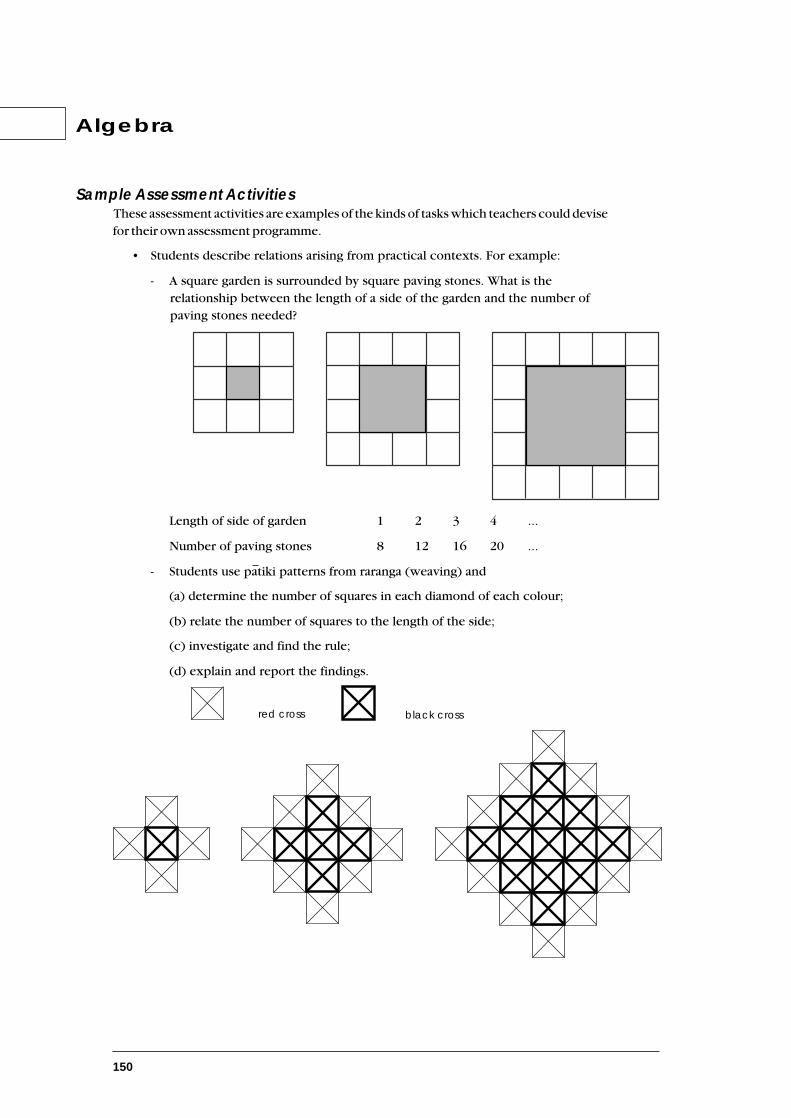
150
black cross
Algebra
Sample Assessment ActivitiesThese assessment activities are examples of the kinds of tasks which teachers could devisefor their own assessment programme.
• Students describe relations arising from practical contexts. For example:
- A square garden is surrounded by square paving stones. What is therelationship between the length of a side of the garden and the number ofpaving stones needed?
Length of side of garden 1 2 3 4 ...
Number of paving stones 8 12 16 20 ...
- Students use patiki patterns from raranga (weaving) and
(a) determine the number of squares in each diamond of each colour;
(b) relate the number of squares to the length of the side;
(c) investigate and find the rule;
(d) explain and report the findings.
black crossred cross

151
Level 5
Using this example, teachers could assess students’ ability to:- generate patterns from a structured situation, find a rule for the general term, and
express it in words and symbols (A5);- use words and symbols to describe and generalise patterns (MP5);- record information in ways that are helpful for drawing conclusions and making
generalisations (MP5).
• Students simplify expressions such as 3aa and
a2
a
Using this example, teachers could assess students’ ability to:- simplify algebraic fractions (A5).
• Students expand and factorise expressions such as 4y(2y + 5) and 3a + a2.
Using this example, teachers could assess students’ ability to:
- factorise and expand algebraic expressions (A5).
• Students draw and interpret graphs of practical situations in context. For example:
- The graph illustrates a flag being raised on a flag pole. Write a description ofthe way the flag moves.
- Draw the height vs time graph for a sky diver from the time she leaves theground in a plane until the time she reaches the ground again with a parachute.
- Students interpret a graph of New Zealand’s sheep-meat export earnings overtime. Do higher earnings necessarily mean higher prices are being paid?
Using this example, teachers could assess students’ ability to:
- sketch and interpret graphs which represent everyday situations (A5);- use their own language, and mathematical language and diagrams, to explain
mathematical ideas (MP5).
• Students write equations for practical situations and then solve them. For example,the band for the school dance charges $100 plus $80 per hour. $350 has been
Time
He
igh
t o
f fla
g
152
Algebra
allocated to pay the band. Students find an equation and solve it to find how longthe band would play for.
Using this example, teachers could assess students’ ability to:
- solve linear equations (A5);- use equations to represent practical situations (A5);- devise and use problem-solving strategies to explore situations mathematically
(MP5).
• Students graph equations and interpret the gradient and “intercept” in relation tothe equation and/or the practical situation represented. For example, the “QuickFix” clothing company calculates the cost ($C) of repairs, using the formulaC = 10 + 15n where n is the number of hours needed for a job. Find the cost of a
repair job taking (a) 3 hours (b) 514 hours. Graph data for the “Quick Fix” clothing
company and interpret the constants 10 and 15 in context. Explain the effect ofchanging the values of the constants.
Using this example, teachers could assess students’ ability to:- graph linear rules and interpret the slope and intercepts on an integer co-ordinate
system (A 5);
- interpret information and results in context (MP5);- make conjectures in a mathematical context (MP5).

153
Sample Development Band Activities• Students investigate and report on the algebra of 2 x 2 matrices. They could extend
the investigation to the applications of 2 x 2 matrices to transformations of planefigures in 2-dimensional co-ordinate geometry, or to the solution of pairs ofsimultaneous equations.
Level 5
154
Algebra
Achievement ObjectivesExploring patterns and relationships
Within a range of meaningful contexts, students should be able to:
• form and interpret a graph;
• generate linear and quadratic patterns and find and justify the rule;
• generate a pattern from a rule;
• graph linear, quadratic, and exponential functions, and relations of the formx2 + y2 = r2 and xy = c
Exploring equations and expressions
Within a range of meaningful contexts, students should be able to:
• form and solve linear equations, simultaneous equations, and simple quadraticequations;
• substitute values into formulae.
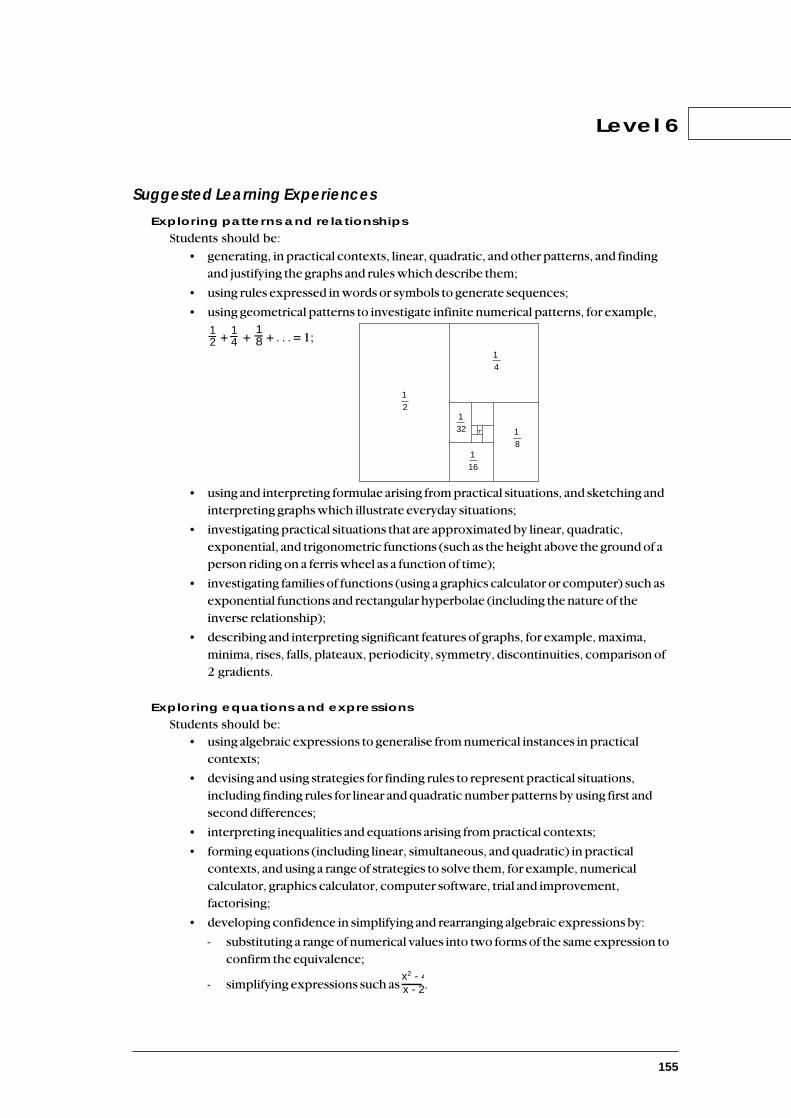
155
Level 6
Suggested Learning ExperiencesExploring patterns and relationships
Students should be:
• generating, in practical contexts, linear, quadratic, and other patterns, and findingand justifying the graphs and rules which describe them;
• using rules expressed in words or symbols to generate sequences;
• using geometrical patterns to investigate infinite numerical patterns, for example,12 +
14 +
18 + . . . = 1;
• using and interpreting formulae arising from practical situations, and sketching andinterpreting graphs which illustrate everyday situations;
• investigating practical situations that are approximated by linear, quadratic,exponential, and trigonometric functions (such as the height above the ground of aperson riding on a ferris wheel as a function of time);
• investigating families of functions (using a graphics calculator or computer) such asexponential functions and rectangular hyperbolae (including the nature of theinverse relationship);
• describing and interpreting significant features of graphs, for example, maxima,minima, rises, falls, plateaux, periodicity, symmetry, discontinuities, comparison of2 gradients.
Exploring equations and expressions
Students should be:• using algebraic expressions to generalise from numerical instances in practical
contexts;
• devising and using strategies for finding rules to represent practical situations,including finding rules for linear and quadratic number patterns by using first andsecond differences;
• interpreting inequalities and equations arising from practical contexts;
• forming equations (including linear, simultaneous, and quadratic) in practicalcontexts, and using a range of strategies to solve them, for example, numericalcalculator, graphics calculator, computer software, trial and improvement,factorising;
• developing confidence in simplifying and rearranging algebraic expressions by:
- substituting a range of numerical values into two forms of the same expression toconfirm the equivalence;
- simplifying expressions such as x2 - 4x - 2.
12
14
18
116
132
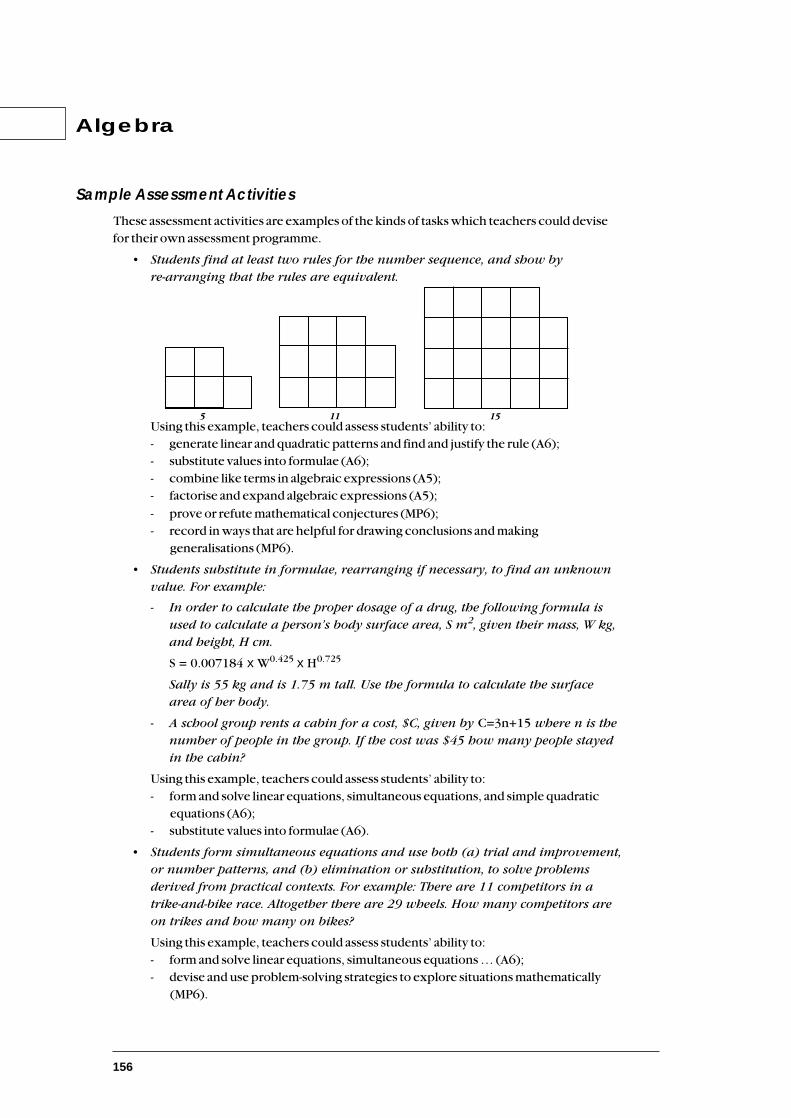
156
Algebra
Sample Assessment ActivitiesThese assessment activities are examples of the kinds of tasks which teachers could devisefor their own assessment programme.
• Students find at least two rules for the number sequence, and show by
re-arranging that the rules are equivalent.
Using this example, teachers could assess students’ ability to:- generate linear and quadratic patterns and find and justify the rule (A6);- substitute values into formulae (A6);- combine like terms in algebraic expressions (A5);- factorise and expand algebraic expressions (A5);
- prove or refute mathematical conjectures (MP6);- record in ways that are helpful for drawing conclusions and making
generalisations (MP6).
• Students substitute in formulae, rearranging if necessary, to find an unknown
value. For example:
- In order to calculate the proper dosage of a drug, the following formula is
used to calculate a person’s body surface area, S m2, given their mass, W kg,
and height, H cm.
S = 0.007184 x W0.425 x H0.725
Sally is 55 kg and is 1.75 m tall. Use the formula to calculate the surface
area of her body.
- A school group rents a cabin for a cost, $C, given by C=3n+15 where n is the
number of people in the group. If the cost was $45 how many people stayed
in the cabin?
Using this example, teachers could assess students’ ability to:- form and solve linear equations, simultaneous equations, and simple quadratic
equations (A6);- substitute values into formulae (A6).
• Students form simultaneous equations and use both (a) trial and improvement,
or number patterns, and (b) elimination or substitution, to solve problems
derived from practical contexts. For example: There are 11 competitors in a
trike-and-bike race. Altogether there are 29 wheels. How many competitors are
on trikes and how many on bikes?
Using this example, teachers could assess students’ ability to:- form and solve linear equations, simultaneous equations … (A6);- devise and use problem-solving strategies to explore situations mathematically
(MP6).

157
• Students sketch graphs of given functions or relations. For example:y = (2x-3)(x+1)y = 3x2
x2 + y2 = 25
Using this example, teachers could assess students’ ability to:- graph linear, quadratic, and exponential functions, and relations of the form
x2 + y2 = r2 and xy = c (A6).
• Students make conjectures about relationships. For example, in geometry, theyexplore the relationship between angles subtended by arcs at the centre and at thecircumference of a circle, and propose a general rule.
Using this example, teachers could assess students’ ability to:
- make conjectures in a mathematical context (MP6);- prove or refute mathematical conjectures (MP6);- generate patterns from a structured situation, find a rule for the general term, and
express it in words and symbols (A5).
• Working in groups, students devise systematic and efficient strategies to help todeduce results from unfamiliar problems. For example, if a bee in a honeycombcan travel from cell to cell only in the directions east or northeast, how manydifferent paths to a particular cell are possible?
Using this example,teachers could assess students’ ability to:- devise and use problem-solving strategies to explore situations mathematically
(MP6);- record in ways that are helpful for drawing conclusions and making
generalisations (MP6).
Sample Development Band Activities• Students investigate and report on mathematical structures, beginning with groups of
order up to 5. The investigation should include the concept of isomorphism, andcould include applications of group theory.
Level 6

158
Algebra
Achievement ObjectivesExploring patterns and relationships
Within a range of meaningful contexts, students should be able to:
• use sequences and series to model real problems and interpret their solutions;
• describe and use arithmetic or geometric sequences or series in common situations;
• model a variety of situations, using graphs;
• sketch graphs and investigate the graph of a function, using a calculator and plottingpoints if necessary;
• use graphical methods to investigate a pattern in data and, where appropriate,identify its algebraic form;
• find by inspection, and interpret, maxima, minima, points of inflection, asymptotes,and discontinuities for given graphs;
• describe the relationship between members of families of curves in terms oftransformations.
Exploring equations and expressions
Within a range of meaningful contexts, students should be able to:
• write appropriate equation(s) or inequation(s) to describe a practical situation;
• choose suitable strategies (graphic, numeric, algebraic, and trigonometric) forfinding solutions to equations or inequations, and interpret the results;
• carry out appropriate manipulation and simplification of algebraic expressions.
159
Suggested Learning ExperiencesExploring patterns and relationships
Students should be:
• investigating geometric and number patterns;
- using designs from other cultures- using numerical approaches- modelling
- using spreadsheets or computer software
• using graphs to illustrate and investigate sequences and series;
• investigating the underlying patterns in everyday situations;
• modelling real and simulated situations;
• exploring the use of algebra to express patterns in sequences and series, includingarithmetic and geometric progressions;
• using calculators and computer graphing packages to plot accurately the graph of ageneral function from a given formula;
• investigating observed or given data to discover relationships;
• exploring the connections (including transformations) between types of graphs andtheir equations;
- linear, quadratic, cubic polynomials- circles, rectangular hyperbolae- exponential functions of the form y = ax
- logarithmic functions of the form y =logax
- trigonometric functions of the form y = a sin(bx+c), y = tan x
• investigating families of curves by considering such things as symmetry, periodicbehaviour, maxima, minima, behaviour for large values of x and y, discontinuities,and asymptotes.
Exploring equations and expressions
Students should be:• investigating real and simulated situations using graphical, algebraic, geometric, and
technological techniques, including:
- the manipulation and simplification of algebraic expressions, including rationalexpressions;
- the solution of linear and quadratic equations, and pairs of simultaneousequations, one of which may be non-linear;
- the solution of polynomial equations and the nature of their roots;- the solution of trigonometric equations such as sin(x+a) = b, cos(ax) = b ;
- the manipulation of exponents, including fractional and negative exponents;- the concept, properties, and manipulation of logarithms.
Level 7
160
Algebra
Sample Assessment ActivitiesThese assessment activities are examples of the kinds of tasks which teachers could devisefor their own assessment programme.
• Students find unknown terms and sums in sequences and series derived frompractical contexts. For example:
- The half life of caffeine in the body is three hours. Students model the amountof caffeine in a person’s body with a sequence and explore the effects ofhaving successive cups of coffee throughout the day.
- Students use a strip of paper to investigate the relationship between thenumber of times the strip is folded in half and the number of creases formed.They find at least two ways of describing the resulting sequence and orallypresent their investigation. (Does the direction of successive folds make adifference?)
Using this example, teachers could assess students’ ability to:- use sequences and series to model real problems and interpret their solutions
(A7);- effectively plan mathematical exploration (MP7);- devise and use problem-solving strategies to explore situations mathematically
(MP7);
- make conjectures in a mathematical context (MP7);- use words and symbols to describe and generalise patterns (MP7).
• Students form and apply an algebraic relation for data arising from an experiment.For example, given a table showing distance and time for a ball rolling down asmooth ramp, students write an equation for the distance-time relation and use itto calculate further distances or times.
Using this example, teachers could assess students’ ability to:- sketch graphs and investigate the graph of a function, using a calculator and
plotting points if necessary (A7);- use graphical methods to investigate a pattern in data and, where appropriate,
identify its algebraic form (A7).
161
• Students write and solve simultaneous equations involving at least one non-linearequation, arising from practical situations. For example, write a pair of equationsfor the amount each employee receives, and find the number of workersemployed and the amount each gets, from a company which budgets to pay allemployees equally from a total of $10 000. Each employee is paid a retainer of$300 plus an amount equal to four times the number of employees.
Using this example, teachers could assess students’ ability to:
- write appropriate equation(s) or inequation(s) to describe a practical situation(A7);
- choose suitable strategies (graphic, numeric, algebraic, and trigonometric) forfinding solutions to equations or inequations, and interpret the results (A7).
• Students manipulate and simplify expressions such as:
x2 + 2x + 1x2-1
n 3
n + 1 n-2
Using this example, teachers could assess students’ ability to:- carry out appropriate manipulation and simplification of algebraic expressions
(A7).
• Students use their own methods to find the zeros of equations such asy = 5x3 - 12x2 - 16x + 8 and discuss the nature of the roots. (Satisfactory methodscould include a table-building program or graphing software to isolate the rootsbetween pairs of integers, or a successive approximation method, or a “zoom in”function on a calculator or computer.)
Using this example, teachers could assess students’ ability to:
- choose suitable strategies (graphic, numeric, algebraic, and trigonometric) forfinding solutions to equation(s) or inequation(s), and interpret the results (A7);
- effectively plan mathematical exploration (MP7);- devise and use problem-solving strategies to explore situations mathematically
(MP7).
Level 7
162
Algebra
• Students develop mathematical models to describe familiar practical situations. Forexample, a ferris wheel has a radius of 8 m and makes a complete revolution in 12seconds. Students develop a mathematical model that describes the relationshipbetween the height, h, of a rider above the bottom of the ferris wheel (1 m abovethe ground) and time, t, seconds.
Using this example, teachers could assess students’ ability to:
- model a variety of situations, using graphs (A7);- write appropriate equation(s) or inequation(s) to describe a practical situation
(A7);- devise and use problem-solving strategies to explore situations mathematically
(MP7);- record in ways that are helpful for drawing conclusions and making
generalisations (MP7).
• Using a graphing package, or otherwise, students identify significant features of agraph and explain them.
Using this example, teachers could assess students’ ability to:- find by inspection, and interpret, maxima, minima, points of inflection,
asymptotes, and discontinuities for given graphs (A7);
- sketch graphs and investigate the graph of a function ... (A7);- use equipment appropriately when exploring mathematical ideas (MP7).
• Students present proofs and/or analyse other students’ early attempts at proving aproposition, and identify weaknesses in the arguments. For example:
- They prove that for any number x, 6x - 10 - x2 is always negative.
- They prove or refute the statement, “There is only one value of n for which thepositive integers n, n + 2, and n + 4 are all prime.”
- They prove or refute that n2 - n + 41 is prime for all n e W.
Using this example, teachers could assess students’ ability to:
- substitute values into formulae (A6);- generalise mathematical ideas and conjectures (MP7);- prove or refute mathematical conjectures (MP7).

163
Sample Development Band Activities• Students research and report on paradoxes in algebra, number, statistics, geometry,
and logic.
• Students investigate practical situations where mathematical modelling is used andreport on the model used, its usefulness, and limitations. The investigation couldproceed from an examination of a simple example, such as the proposed use of aFibonacci sequence to model the growth of a rabbit population.
Level 7
164
Algebra
Achievement ObjectivesExploring patterns and relationships
Within a range of meaningful contexts, students should be able to:
• use sequences and series to model real or simulated situations and interpret thefindings;
• investigate and interpret convergence of sequences and series;
• choose and carry out appropriate manipulation and graphical representation ofcomplex numbers;
• model real and simulated situations, using linear programming techniques, and obtainand interpret optimal solutions;
• use graphical techniques to explore and illustrate y = xa, y = ax + bcx + d and piece-wise
functions;
• choose an appropriate model for real data, including the use of log-log and semi-logtechniques, and analyse and interpret the results;
• sketch the graphs of inverse and/or reciprocal functions and explain relationshipsbetween them and the original functions.
Exploring equations and expressions
Within a range of meaningful contexts, students should be able to:
• investigate and find numbers of arrangements and selections from a number ofobjects;
• expand and use binomial expressions for small positive integral exponents;
• use simultaneous equations to model real and simulated situations, and interpret theirsolutions in a given context;
• use appropriate numerical methods and technology to solve non-linear equations;
• use and prove the factor and remainder theorems;
• solve any quadratic equation and equations of the form zn = a (for n a positiveinteger) and z = r cisø
• carry out the manipulation necessary to use trigonometric expressions in other areasof mathematics;
• find solutions, including the general solution, for trigonometric equations.
165
Suggested Learning ExperiencesExploring patterns and relationships
Students should be:
• using graphing, modelling, and calculator techniques to explore a range of divergent,convergent, and oscillating sequences and series (including exponential andlogarithmic series);
• investigating graphing, using sketching, plotting, computers, and calculators;
• modelling practical situations from science, commerce, and the social sciences;
• using piece-wise functions arising from practical contexts;
• using graphical and algebraic techniques to explore and illustrate reciprocal andinverse functions and the relationships between them, including exponential,logarithmic, and trigonometric functions.
Level 8
Exploring equations and expressions
Students should be:• making selections and arrangements leading to permutations and combinations and
the binomial theorem for positive integral index;
• investigating and modelling real and simulated situations using graphical, algebraic,geometrical, and technological techniques, including:
- the concept of 3-space related to 3 dimensions;- considering the consistency and uniqueness of solutions, including 2 x 2 and 3 x 3
simultaneous equations;- the use and proof of remainder and factor theorems;
• exploring the extension of the number system to include complex numbers;
• working with complex numbers in the form a + ib and in polar form to solve quadraticand other equations, including those in the form zn = a (for n a positive integer) andz= r cisø, and using De Moivre’s Theorem;
• exploring relationships between trigonometric expressions and situations that giverise to them.
166
Algebra
Sample Assessment ActivitiesThese assessment activities are examples of the kinds of tasks which teachers could devisefor their own assessment programme.
• Using a calculator (or a computer program), students investigate the convergence
of the sequences such as f(n) = 1n and g(n) = (1 +
1n )n and estimate values of limits
where they exist. Other suitable sequences could be:
n 1 1 5n 1n+1 , n2 , n3 , 2n+1 , n!
Using this example, teachers could assess students’ ability to:
- investigate and interpret convergence of sequences and series (A8).
• Students calculate possible permutations and combinations in context. Forexample, typical car registration plate numbers are A 657 HDC (Britain), MPQ 049(Victoria), UN 5367 (New Zealand). How many unique licence plate numbers arepossible in the various states?
Using this example, teachers could assess students’ ability to:- investigate and find numbers of arrangements and selections from a number of
objects (A8).
• Students solve simultaneous equations in 3 variables by elimination. For example,they:
- solve by elimination
x +y2 +
z3 = 1
x2 +
y3 +
z4 = 0.75
x3 +
y4 +
z5 = 0.55
- solve exactly by elimination
x + 0.5y + 0.33z = 1
0.5x + 0.33y + 0.25z = 0.75
0.33x + 0.25y + 0.2z = 0.55
- explain the differences in the solutions to the two sets of equations.
Using this example, teachers could assess students’ ability to:
- use simultaneous equations to model real and simulated situations, and interprettheir solutions in a given context (A8);
- interpret information and results in context (MP8);- make conjectures in a mathematical context (MP8);- use their own language, and mathematical language and diagrams, to explain
mathematical ideas (MP8).
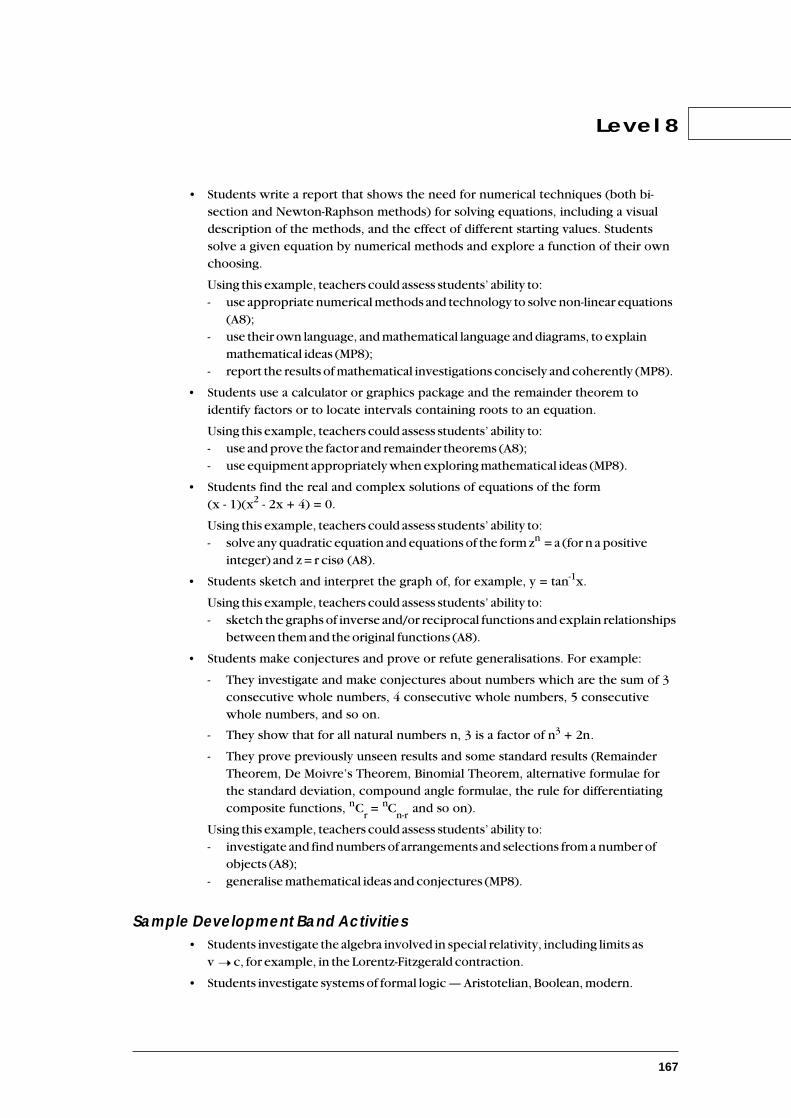
167
• Students write a report that shows the need for numerical techniques (both bi-section and Newton-Raphson methods) for solving equations, including a visualdescription of the methods, and the effect of different starting values. Studentssolve a given equation by numerical methods and explore a function of their ownchoosing.
Using this example, teachers could assess students’ ability to:- use appropriate numerical methods and technology to solve non-linear equations
(A8);- use their own language, and mathematical language and diagrams, to explain
mathematical ideas (MP8);- report the results of mathematical investigations concisely and coherently (MP8).
• Students use a calculator or graphics package and the remainder theorem toidentify factors or to locate intervals containing roots to an equation.
Using this example, teachers could assess students’ ability to:- use and prove the factor and remainder theorems (A8);- use equipment appropriately when exploring mathematical ideas (MP8).
• Students find the real and complex solutions of equations of the form(x - 1)(x2 - 2x + 4) = 0.
Using this example, teachers could assess students’ ability to:- solve any quadratic equation and equations of the form zn = a (for n a positive
integer) and z = r cisø (A8).
• Students sketch and interpret the graph of, for example, y = tan-1x.
Using this example, teachers could assess students’ ability to:- sketch the graphs of inverse and/or reciprocal functions and explain relationships
between them and the original functions (A8).
• Students make conjectures and prove or refute generalisations. For example:
- They investigate and make conjectures about numbers which are the sum of 3consecutive whole numbers, 4 consecutive whole numbers, 5 consecutivewhole numbers, and so on.
- They show that for all natural numbers n, 3 is a factor of n3 + 2n.
- They prove previously unseen results and some standard results (RemainderTheorem, De Moivre’s Theorem, Binomial Theorem, alternative formulae forthe standard deviation, compound angle formulae, the rule for differentiatingcomposite functions, nC
r = nC
n-r and so on).
Using this example, teachers could assess students’ ability to:- investigate and find numbers of arrangements and selections from a number of
objects (A8);- generalise mathematical ideas and conjectures (MP8).
Sample Development Band Activities• Students investigate the algebra involved in special relativity, including limits as
v ➝ c, for example, in the Lorentz-Fitzgerald contraction.
• Students investigate systems of formal logic — Aristotelian, Boolean, modern.
Level 8
➝

168
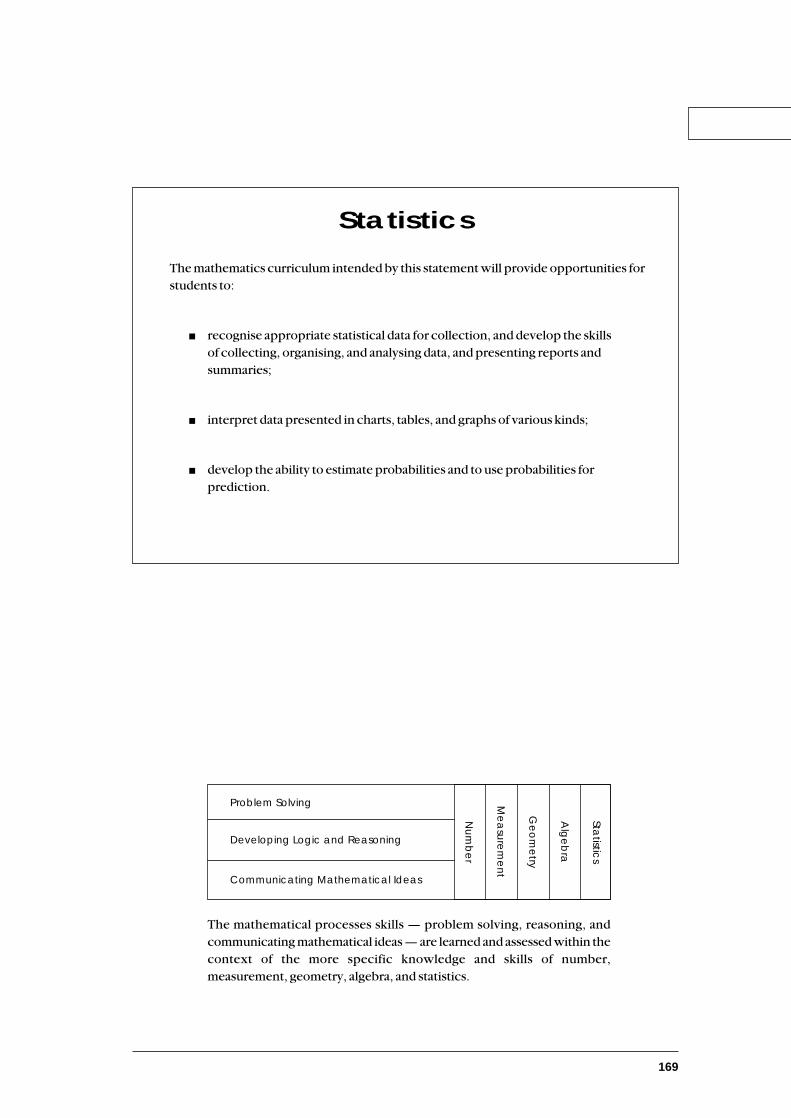
169
The mathematical processes skills — problem solving, reasoning, andcommunicating mathematical ideas — are learned and assessed within thecontext of the more specific knowledge and skills of number,measurement, geometry, algebra, and statistics.
Statistic
s
Alg
eb
ra
Ge
om
etry
Me
asu
rem
en
t
Nu
mb
er
Developing Logic and Reasoning
Communicating Mathematical Ideas
Problem Solving
Statistics
The mathematics curriculum intended by this statement will provide opportunities forstudents to:
■ recognise appropriate statistical data for collection, and develop the skillsof collecting, organising, and analysing data, and presenting reports andsummaries;
■ interpret data presented in charts, tables, and graphs of various kinds;
■ develop the ability to estimate probabilities and to use probabilities forprediction.
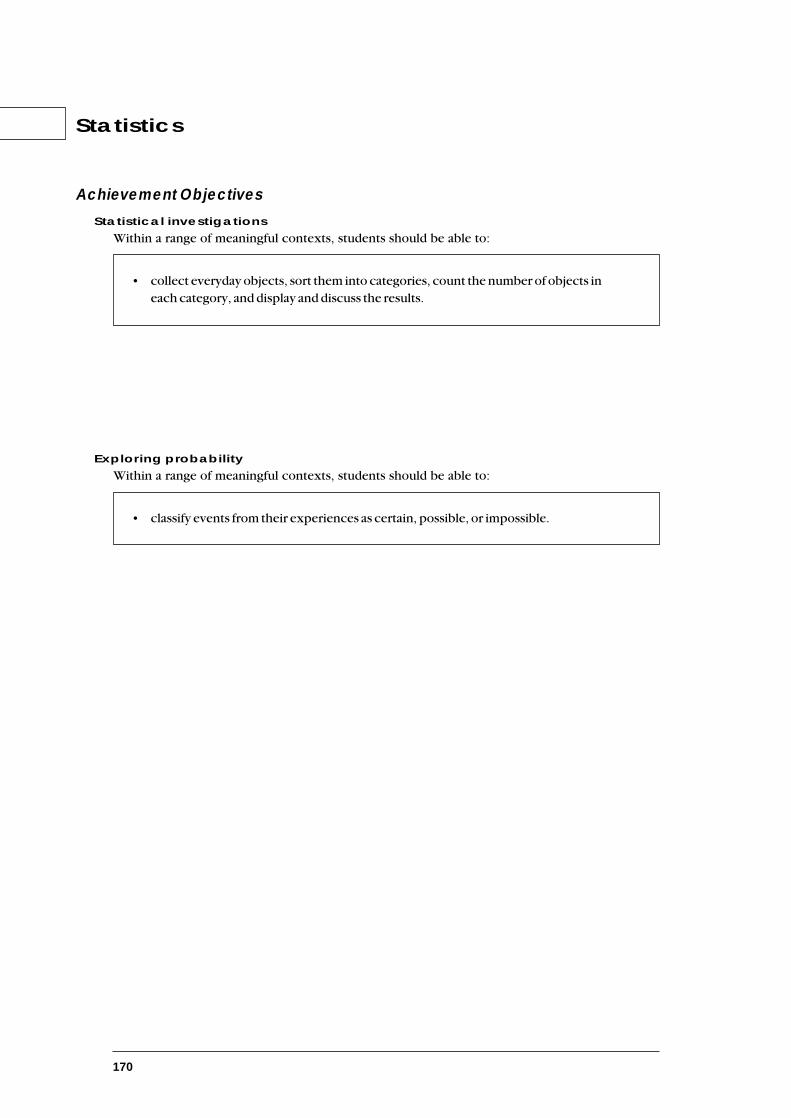
170
Statistics
Achievement ObjectivesStatistical investigations
Within a range of meaningful contexts, students should be able to:
• collect everyday objects, sort them into categories, count the number of objects ineach category, and display and discuss the results.
Exploring probability
Within a range of meaningful contexts, students should be able to:
• classify events from their experiences as certain, possible, or impossible.
171
Level 1
Suggested Learning ExperiencesStatistical investigations
Students should be:
• working with category variables, for example, kinds of shoes, colours of clothing,types of material;
• talking about experiences and situations such as aspects of their environment, theirfamilies, their friends, which can be investigated statistically;
• collecting data and displaying it in ways that tell a story;
• talking about their displays, for example, saying which of the shell types occurredmost often in a container full of shells collected from a beach.
Exploring probability
Students should be:• talking about the likely occurrence of familiar events when using their own language.
For example, they should be using language such as will, won’t, and might whentalking about the likelihood of tomorrow being a sunny day; of it raining on Saturday;of the sun rising tomorrow; of their house being in the same street next week.
172
Sample Assessment ActivitiesThese assessment activities are examples of the kinds of tasks which teachers could devisefor their own assessment programme.
• Students discuss questions such as, “Why do people wear shoes?” “Do they wearthe same shoes in winter as they do in summer?” “What shoes do we wear?” Thestudents, working as a class, might choose to check the last question. They makea display, using their own shoes, then draw a picture graph of shoe types. Theythen discuss their graph.
Using this example, teachers could assess students’ ability to:- collect everyday objects, sort them into categories, count the number of objects in
each category, and display and discuss the results (S1);- pose questions for mathematical exploration (MP1);- classify objects (MP1);
- interpret information in context (MP1).
• Students use the language of certainty, possibility, and impossibility to makestatements such as, “Dad might give me cheese sandwiches tomorrow.” “Thispencil can’t be a crayon tomorrow.”
Using this example, teachers could assess students’ ability to:- classify events from their experiences as certain, possible, or impossible (S1);- use their own language … and diagrams to explain mathematical ideas (MP1).
Statistics

173
Sample Development Band Activities• Students devise a maze or a road map with a given number of pathways from one
point to another.
• Students could collect data related to an everyday classroom activity, for example,who is ordering what for lunch today. They could translate the data onto apictograph and interpret the results for classroom action.
• Students make or write a large number of statements that could be classifiedaccording to probability — might, can’t, always, never, and sometimes. They inviteothers in the class to classify the statements, and discuss their classifications.
Level 1
174
Statistics
Achievement ObjectivesStatistical investigations
Within a range of meaningful contexts, students should be able to:
• collect and display category data and whole number data in pictograms, tally charts,and bar charts, as appropriate.
Interpreting statistical reports
Within a range of meaningful contexts, students should be able to:
• talk about the features of their own data displays;
• make sensible statements about the situation represented by a statistical data displaydrawn by others.
Exploring probability
Within a range of meaningful contexts, students should be able to:
• compare familiar or imaginary, but related, events and order them on a scale fromleast likely to most likely.
175
Level 2
Suggested Learning ExperiencesStatistical investigations
Students should be:
• working with objects or whole number variables (for example, ages of children inyears);
• talking about situations they have experienced and posing questions forinvestigation;
• collecting data in a planned way;
• devising ways of displaying their data to show its significant features, and usingconventional displays such as pictographs, block graphs, bar graphs, stem-and-leafgraphs, and tally charts.
Interpreting statistical reports
Students should be:• talking about and interpreting the displays, for example, interpreting the difference
between the smallest and the largest values, and explaining in their own language themeaning of clusters or holes in the data display;
• comparing the findings with the expected results;
• reporting to others;
• looking at and talking about the ways others present data.
Exploring probability
Students should be:• developing a concept of chance, for example, ordering statements and pictures
related to their experiences, using words such as certain, likely, unlikely, impossible,and possible;
• exploring ways of finding all possible outcomes of simple events by using concretematerials or pictures of objects.

176
Statistics
Sample Assessment ActivitiesThese assessment activities are examples of the kinds of tasks which teachers could devisefor their own assessment programme.
• Students pose questions related to a topic, decide which to investigate, and workin groups to collect and display data on a stem-and-leaf graph. For example, if thetopic is age, the students may pose the questions “How old are our grandparents?”“How old are our parents?”
Using this example, teachers could assess students’ ability to:- collect and display category data and whole number data in pictograms, tally
charts, and bar charts, as appropriate (S2);- pose questions for mathematical exploration (MP2);- record, in an organised way, and talk about the results of mathematical
exploration (MP2).
• Students collect the birth dates (day of the month) of the class, and record the datain a stem-and-leaf graph. Supposing that the data collected in the investigation is asbelow, students talk about the features of the data displayed, such as the mostcommon number, and the spread of numbers.
3 0
2 3 4 4 5 6 9
1 1 1 2 4 5 5 7 9 9
0 1 4 7 7 8
Using this example, teachers could assess students’ ability to:- interpret information and results in context (MP2);- talk about the features of their own data displays (S2);- explain the meaning of the digits in 2- or 3-digit whole numbers (N2).
• Working in pairs or groups, students make up situations about themselves, andrank them from least likely to most likely, for example, “Tomorrow I will be agrown-up.” “Tomorrow I will still be a child.” “Tomorrow it will rain.”
Using this example, teachers could assess students’ ability to:- compare familiar or imaginary, but related, events and order them on a scale from
least likely to most likely (S2).

177
Level 2
Sample Development Band Activities• Students explore possible combinations, for example, they select 3 different items
and state 2 different possible classifications for each. They then count and record thetotal possible combinations of items and classifications. Students could repeat theactivity with a greater number of items and classifications.
• Students collect as many different graphs, charts, and tables as they can from printmedia, and present the information shown by each in another way. They commenton the advantage or disadvantage of the original presentation.

178
Statistics
Achievement ObjectivesStatistical investigations
Within a range of meaningful contexts, students should be able to:
• plan a statistical investigation of an assertion about a situation;
• collect and display discrete numeric data in stem-and-leaf graphs, dot plots, and stripgraphs, as appropriate.
Exploring probability
Within a range of meaningful contexts, students should be able to:
• use a systematic approach to count a set of possible outcomes;
• predict the likelihood of outcomes on the basis of a set of observations.
Interpreting statistical reports
Within a range of meaningful contexts, students should be able to:
• use their own language to talk about the distinctive features, such as outliers andclusters, in their own and others’ data displays;
• make sensible statements about an assertion on the basis of the evidence of astatistical investigation.

179
Level 3
Suggested Learning ExperiencesStatistical investigations
Students should be:
• talking about situations they have experienced, posing questions for investigation,and presenting a plan for a statistical experiment (which could include the use ofcomputers);
• collecting and presenting data in a variety of ways, including strip graphs, dot plots,bar graphs, picture graphs, stem-and-leaf graphs, and tally charts;
• talking about and considering the features of displays of number data, including theoverall shape of the data distribution, clusters, middle, and spread;
• organising measurement data to the nearest whole number, using informalapproaches and displaying such data;
• reporting on statistical investigations, using pictures and words;
• collecting and graphing simple time-series data such as the height of a classroom-grown bean plant at midday each day.
Exploring probability
Students should be:• developing a concept of probability by investigating games and activities which
involve chance, using computers where appropriate;
• using language associated with chance, for example, certain, good chance, evenchance, poor chance, impossible;
• considering frequency tables, drawing informal inferences about the populations, forexample, “three out of ten cars are white”;
• finding all possible outcomes of an event, using systematic approaches including treediagrams.
Interpreting statistical reports
Students should be:• considering data displays, and making sensible statements about the significant
features of the display, and making informal inferences based on them;
• evaluating statements and assertions about a situation represented in a data display;
• developing an awareness of the ways in which statistical information can bepresented.

180
Statistics
Sample Assessment ActivitiesThese assessment activities are examples of the kinds of tasks which teachers could devisefor their own assessment programme.
• Students consider an assertion, for example, boys’ handspans are larger than girls’handspans. The students must devise a plan to measure and record the handspansof boys and girls in their class, then display and talk about the distinctive featuresof their data, and draw conclusions relating to the assertion.
Using this example, teachers could assess students’ ability to:- plan a statistical investigation of an assertion about a situation (S3);- collect and display discrete numeric data in stem-and-leaf graphs, dot plots, and
strip graphs as appropriate (S3);- use their own language to talk about the distinctive features, such as outliers and
clusters, in their own and others’ data displays (S3);
- make sensible statements about an assertion on the basis of the evidence of astatistical investigation (S3);
- pose questions for mathematical exploration (MP3);- interpret information and results in context (MP3).
• Students conduct an experiment and discuss the outcomes. For example, thespinner below is to be spun 100 times. Predict how many times it will land onred.
Using this example, teachers could assess students’ ability to:- use a systematic approach to count a set of possible outcomes (S3);- predict the likelihood of outcomes on the basis of a set of observations (S3);
- pose questions for mathematical exploration (MP3);- record, in an organised way, and talk about the results of mathematical
exploration (MP3).
181
Level 3
• Students solve combination problems and explain the method that they have used.For example, Telesia has 4 T shirts and 3 pairs of shorts. How many differentoutfits can she wear?
Using this example, teachers could assess students’ ability to:
- use a systematic approach to count a set of possible outcomes (S3);- devise and use problem-solving strategies to explore situations mathematically
(MP3);- use their own language and the language of mathematics and diagrams to explain
mathematical ideas (MP3).
Sample Development Band Activities
• Students plan and implement a comprehensive survey. For example, what are thelunch-buying habits of students at the school? They develop a survey form, select asurvey sample, collect data, and analyse the results. They formulate a proposal for theprincipal or board of trustees as a result of the survey.
• Students investigate probabilities in everyday games, such as board, card, or dicegames. They should devise and report on experiments to support their conclusions.
• Students investigate assertions such as “Snakes and Ladders is an unfair game”.Working in groups, students devise a systematic way to examine the game. They giveoral presentations containing an evaluation of such things as the number of snakes vsthe number of ladders, the total number of squares gained by going up on ladders vsthe total number of squares lost by going down on snakes, and so on.
182
Statistics
Achievement ObjectivesStatistical investigations
Within a range of meaningful contexts, students should be able to:
• plan a statistical investigation arising from the consideration of an issue or anexperiment of interest ;
• collect appropriate data;
• choose and construct quality data displays (frequency tables, bar charts, andhistograms) to communicate significant features in measurement data;
• collect and display time-series data.
Exploring probability
Within a range of meaningful contexts, students should be able to:
• estimate the relative frequencies of events and mark them on a scale;
• find all possible outcomes for a sequence of events, using tree diagrams.
Interpreting statistical reports
Within a range of meaningful contexts, students should be able to:
• report the distinctive features (outliers, clusters, and shape of data distribution) ofdata displays;
• evaluate others’ interpretations of data displays;
• make statements about implications and possible actions consistent with the resultsof a statistical investigation.
183
Level 4
Suggested Learning ExperiencesStatistical investigations
Students should be:
• discussing environmental or social issues and posing questions for statisticalinvestigation;
• planning manageable and relevant statistical investigations, using strategies such asplan, do, check, and act (Deming cycle);
• talking about samples and sampling, including limitations, and discussing anddevising ways of obtaining a representative sample;
• discussing sources of error, including question design and bias, and exploring theinfluence of question design;
• collecting and presenting discrete data in a variety of ways, for example, pictographs,bar graphs, strip graphs, pie graphs, and presenting displays which compare data, forexample, back-to-back stem-and-leaf graphs, and 2 x 2 arrays;
• organising measurement data into classes and presenting it in frequency tables andhistograms;
• carrying out simple experiments requiring repeated measurements over time tocollect time-series data, and displaying it on appropriate graphs, for example,recording the temperature at 10 a.m. every day, or the height of a pot-grown silverbeet plant each day.
Exploring probability
Students should be:• finding relative frequencies from frequency tables, finding the proportion of the
sample in a given category, and recording them on different scales;
• using relative frequencies to make predictions in both words (such as “very likely”,“less likely”) and numbers (such as “nine times out of ten” or 90%);
• displaying and describing sets of possible outcomes, using tree diagrams.
Interpreting statistical reports
Students should be:• considering features of data displays, including the number of clusters and outliers,
and identifying the mode; estimating mean and median; using technology whereappropriate;
• reporting on statistical investigations, using diagrams, words, and numbers;
• developing an awareness of the ways in which statistical information is used.
184
Statistics
Sample Assessment ActivitiesThese assessment activities are examples of the kinds of tasks which teachers could devisefor their own assessment programme.
• Students discuss an issue of interest or concern, for example:
- Are there trends which would indicate that global warming is taking place?
- Is their a need for more rubbish or recycling bins to be placed around ourschool? Students make up questions related to this issue, such as “What typesof litter are prevalent in our school?” “Which areas in our school areproblems?” “What are some possible solutions?” For example, working ingroups students decide how to categorise rubbish, collect and count items ofrubbish, summarise their data on an appropriate display, and present theirfindings to the board of trustees.
Using this example, teachers could assess students’ ability to:- plan a statistical investigation arising from the consideration of an issue or an
experiment of interest (S4);- collect appropriate data (S4);- choose and construct quality data displays (frequency tables, bar charts, and
histograms) to communicate significant features in measurement data (S4);
- report the distinctive features (outliers, clusters, and shape of data distribution) ofdata displays (S4);
- make statements about implications and possible actions consistent with theresults of a statistical investigation (S4);
- pose questions for mathematical exploration (MP4);- interpret information and results in context (MP4).
• Working in groups, students conduct and report on investigations, for example, asweets investigation. Without opening the packet of sweets, what mathematicalquestions can one ask about the sweets? Choose questions for further explorationsuch as “Do all packets have the same number of sweets?” Predict and recordpossible answers to the questions. Open the packets and record the number ofsweets in each packet. Students choose how to display the results. They discussthe original predictions in the light of the actual data.
Using this example, teachers could assess students’ ability to:
- choose and construct quality data displays (frequency tables, bar charts, andhistograms) to communicate significant features in measurement data (S4);
- report the distinctive features (outliers, clusters, and shape of data distribution) ofdata displays (S4);
- interpret information and results in context (MP4).
185
Level 4
• Students use a tree diagram to solve a problem. For example, given three types ofdrink, two types of bread, and four types of spread, how many different breakfastsare possible?
Using this example, teachers could assess students’ ability to:
- find all possible outcomes for a sequence of events using tree diagrams (S4);- use their own language, and the language of mathematics and diagrams, to explain
mathematical ideas (MP4).
Sample Development Band Activities
• Students collect as many different graphs, charts, and tables as they can and classifythe data presentations on a scale from “clear and helpful” to “unclear and misleading”.In cases where the classification is “unclear” they should re-present the data in aclearer or more accurate way, and comment on the way in which their presentation ismore informative.
• Students undertake a probability experiment related to an extra-curricular activity inwhich they are involved. For example, students might present an analysis of theirteam’s goal-scoring record over the season, and draw up probability tables to predictthe likelihood of certain players scoring at their next appearance.
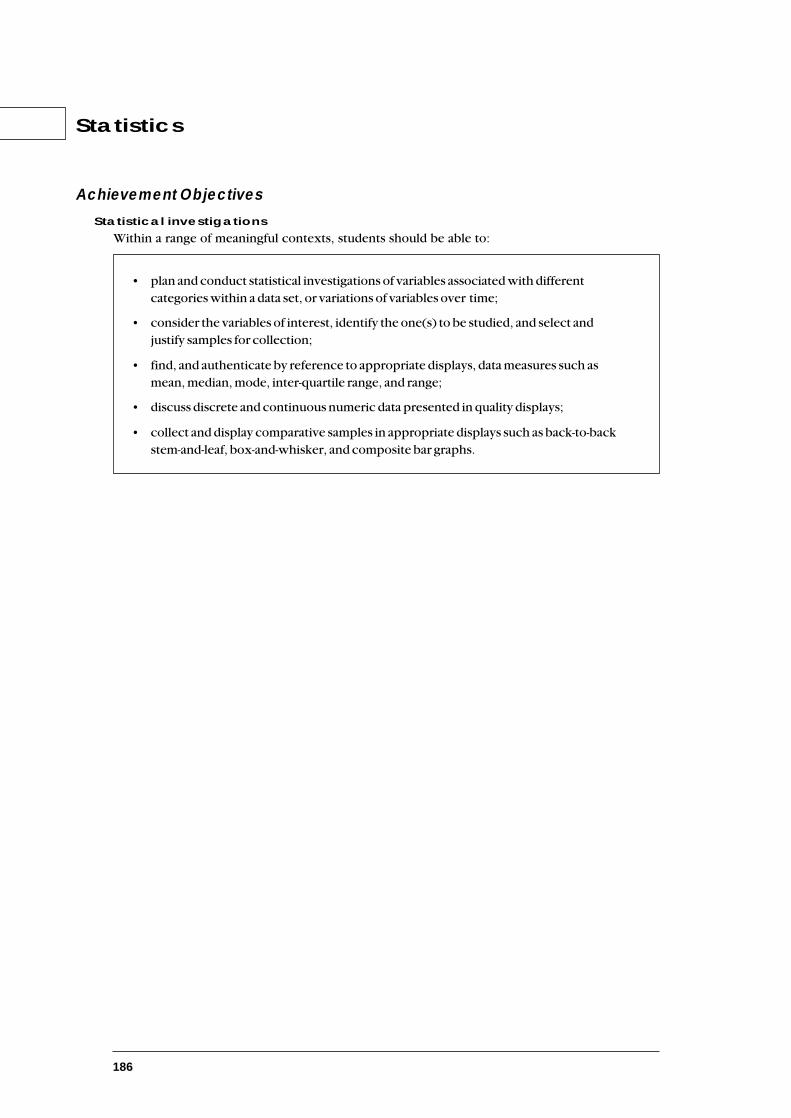
186
Statistics
Achievement ObjectivesStatistical investigations
Within a range of meaningful contexts, students should be able to:
• plan and conduct statistical investigations of variables associated with differentcategories within a data set, or variations of variables over time;
• consider the variables of interest, identify the one(s) to be studied, and select andjustify samples for collection;
• find, and authenticate by reference to appropriate displays, data measures such asmean, median, mode, inter-quartile range, and range;
• discuss discrete and continuous numeric data presented in quality displays;
• collect and display comparative samples in appropriate displays such as back-to-backstem-and-leaf, box-and-whisker, and composite bar graphs.

187
Level 5
Suggested Learning ExperiencesStatistical investigations
Students should be:
• talking about and formulating statistical questions, including those arising fromconsideration of graphs and calculations and those that involve comparisons ofdifferent, but related, data, and variation over time;
• planning investigations, taking into consideration different sampling methods andappropriate technology, and exploring different sample choices and theirimplications;
• collecting, classifying, and organising data, including using published data such asyear books, meteorological records, medical records, Department of Statisticsrecords, and sports statistics;
• matching appropriate displays to data type;
• presenting data in a variety of appropriate ways, including picture graphs, dot plots,bar graphs, stem-and-leaf graphs, strip graphs, pie graphs, tally charts, frequencytables, and histograms;
• devising ways to display data showing comparisons of variables in related categoriesand using conventional displays such as composite bar graphs, back-to-back stem-and-leaf graphs, composite dot plots, and paired box-and-whisker graphs;
• devising ways to display data showing variations of variables over time and usingconventional time-series displays;
• talking about and considering the features of data displays and selecting theappropriate data measures for calculation;
• analysing and interpreting data (using technology such as spreadsheets and statisticssoftware, where appropriate), finding and using measures of central tendency (mean,median, mode), and spread (quartiles, range), and using their own language to discussfeatures of the shape (for example, clustered, symmetrical, skewed, and bi-modal);
• preparing and presenting oral and written reports, using computer software, whereappropriate.

188
Statistics
Achievement ObjectivesInterpreting statistical reports
Within a range of meaningful contexts, students should be able to:
• use data displays and measures to compare data associated with different categories;
• make statements about time-related variation as a result of a statistical investigation;
• report on possible sources of error and limitations of an investigation.
Exploring probability
Within a range of meaningful contexts, students should be able to:
• determine probabilities of events based on observations of long-run relativefrequency;
• determine the theoretical probabilities of the outcomes of an event such as the rollingof a die or drawing a card from a deck;
• predict the outcome of a simple probability experiment, test it, and explain theresults;
• find the probability of a given sequence of events, using tree diagrams.
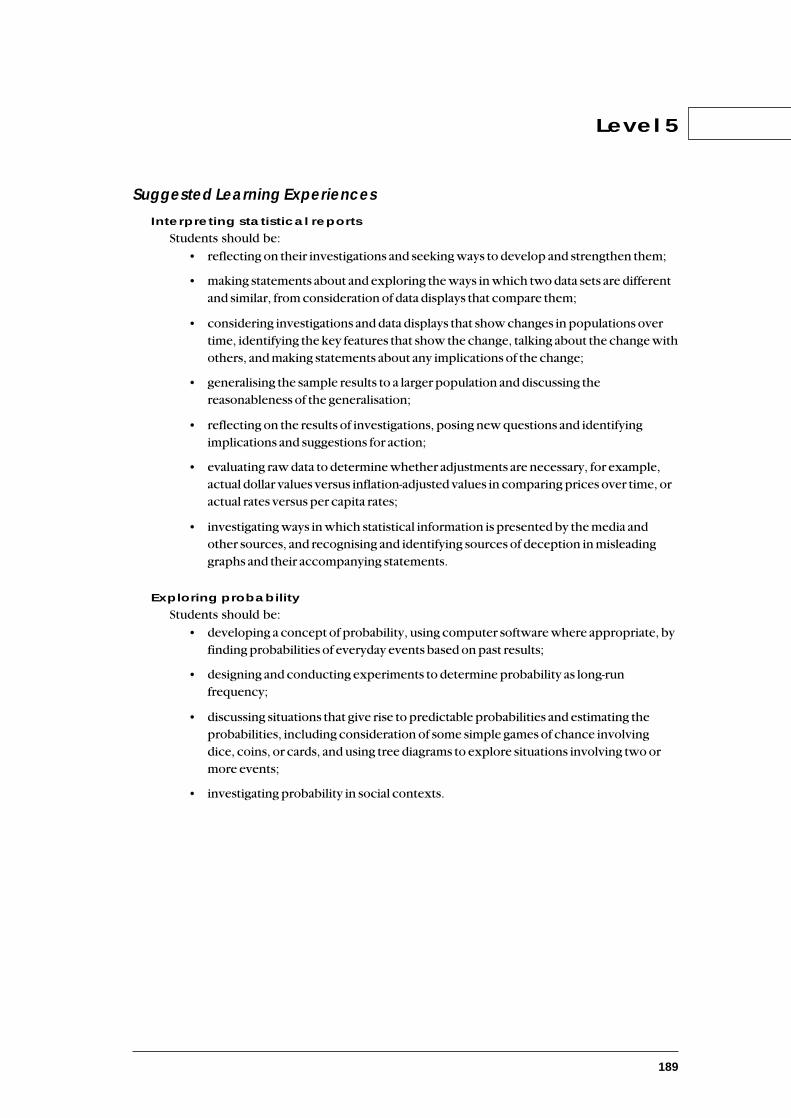
189
Level 5
Suggested Learning ExperiencesInterpreting statistical reports
Students should be:
• reflecting on their investigations and seeking ways to develop and strengthen them;
• making statements about and exploring the ways in which two data sets are differentand similar, from consideration of data displays that compare them;
• considering investigations and data displays that show changes in populations overtime, identifying the key features that show the change, talking about the change withothers, and making statements about any implications of the change;
• generalising the sample results to a larger population and discussing thereasonableness of the generalisation;
• reflecting on the results of investigations, posing new questions and identifyingimplications and suggestions for action;
• evaluating raw data to determine whether adjustments are necessary, for example,actual dollar values versus inflation-adjusted values in comparing prices over time, oractual rates versus per capita rates;
• investigating ways in which statistical information is presented by the media andother sources, and recognising and identifying sources of deception in misleadinggraphs and their accompanying statements.
Exploring probability
Students should be:
• developing a concept of probability, using computer software where appropriate, byfinding probabilities of everyday events based on past results;
• designing and conducting experiments to determine probability as long-runfrequency;
• discussing situations that give rise to predictable probabilities and estimating theprobabilities, including consideration of some simple games of chance involvingdice, coins, or cards, and using tree diagrams to explore situations involving two ormore events;
• investigating probability in social contexts.

190
Statistics
Sample Assessment ActivitiesThese assessment activities are examples of the kinds of tasks which teachers could devisefor their own assessment programme.
• Students organise, analyse, summarise, interpret, and display data from an attitudesurvey. For example, they might investigate their own attitudes and opinionsabout parenting by completing starter statements such as “The hardest thing aboutbeing a parent is . . . .” and “The thing I value most about my parent(s) is . . . .”Students complete each starter and record their responses on a slip of paper.Students devise a scheme for categorising responses then collect, categorise,interpret, and display the responses.
Using this example, teachers could assess students’ ability to:- consider the variables of interest and identify the one(s) to be studied, and select
and justify samples for collection (S5);- use data displays and measures to compare data associated with different
categories (S5);- report on possible sources of error and limitations of an investigation (S5);
- pose questions for mathematical exploration (MP5);- interpret information and results in context (MP5).
• Students explain why a game is unfair and suggest ways it could be made fair. Forexample, a coin is tossed. If the outcome is heads, player A wins. If the outcomeis tails, the coin is tossed again. If the second toss is heads, player A wins; if tails,player B wins. Show this situation, using a tree diagram, and calculate theprobability of A winning.
Using this example, teachers could assess students’ ability to:- determine the theoretical probabilities of the outcomes of an event such as the
rolling of a die or drawing a card from a deck (S5);- find the probability of a given sequence of events, using tree diagrams (S5).
• Students carry out a simple probability experiment. For example, they determinethe probability of a tossed coin landing within a square on a square grid. Studentspredict the probability, decide on the number of trials, carry out the experiment,record and graph results, and then present their conclusions, including ajustification of the number of trials used.
Using this example, teachers could assess students’ ability to:
- determine probabilities of events based on observations of long-run relativefrequency (S5);
- choose and construct quality data displays (frequency tables, bar charts, andhistograms) to communicate significant features in measurement data (S4).

191
Level 5
• Students analyse data and present data displays from two or more populations oftheir own choice, such as the comparative achievement in mathematics by malesand females, or the length of fibres from the fleeces of two breeds of sheep.
Using this example, teachers could assess students’ ability to:
- plan and conduct statistical investigations of variables associated with differentcategories within a data set, or variations of variables over time (S5);
- collect and display comparative samples in appropriate displays such as back-to-back stem-and-leaf, box-and-whisker, and composite bar graphs (S5);
- use distinctive features of data displays and measures to compare data associatedwith different data (S5);
- pose questions for mathematical exploration (MP5);- make conjectures in a mathematical context (MP5).
• Students examine and compare categories within a data set. For example, havingclassified and counted all the students at their form level by their eye colour, theychoose an appropriate method to display the comparison between the numbers ofblue-eyed students and brown-eyed students in each class.
Using this example, teachers could assess students’ ability to:
- find, and authenticate by reference to appropriate displays, data measures such asmean, median, mode, inter-quartile range, and range (S5);
- collect and display comparative samples in appropriate displays such as back-to-back stem-and-leaf, box-and-whisker, and composite bar graphs (S5);
- use data displays and measures to compare data associated with differentcategories (S5);
- interpret information and results in context (MP5);- record in ways that are helpful for drawing conclusions and making
generalisations (MP5).
Sample Development Band Activities
• Students analyse games of chance to determine whether they are fair or whether, forexample, they are loaded in favour of the “banker”. They could invent games basedon tossing coins or rolling dice and determine and explain each player’s probability ofwinning, or their expected winnings in the long term.
• Students investigate random walks.

192
Statistics
Achievement ObjectivesStatistical investigations
Within a range of meaningful contexts, students should be able to:
• formulate statistical questions about situations involving possible relationshipsbetween variables;
• formulate questions about variations over time in continuous processes;
• identify data collection methodology;
• collect bi-variate measurement and discrete number data, and clearly and conciselycommunicate the significant features in appropriate displays, including scatter plots.
Interpreting statistical reports
Within a range of meaningful contexts, students should be able to:
• make and justify statements about relationships between variables in a sample as aresult of a statistical investigation;
• identify long-term and short-term features in time-series data;
• suggest improvements in the investigation, design, data collection, or display, wherepossible inferences are inconclusive.
Exploring probability
Within a range of meaningful contexts, students should be able to:
• use tables of multi-variate data from social contexts to find the probabilities ofeveryday events or the proportion of outcomes in a given category;
• determine the theoretical probabilities of the outcomes of both exclusive andindependent events such as the rolling of a die followed by the drawing of a card froma deck;
• use probability trees to calculate conditional probabilities.
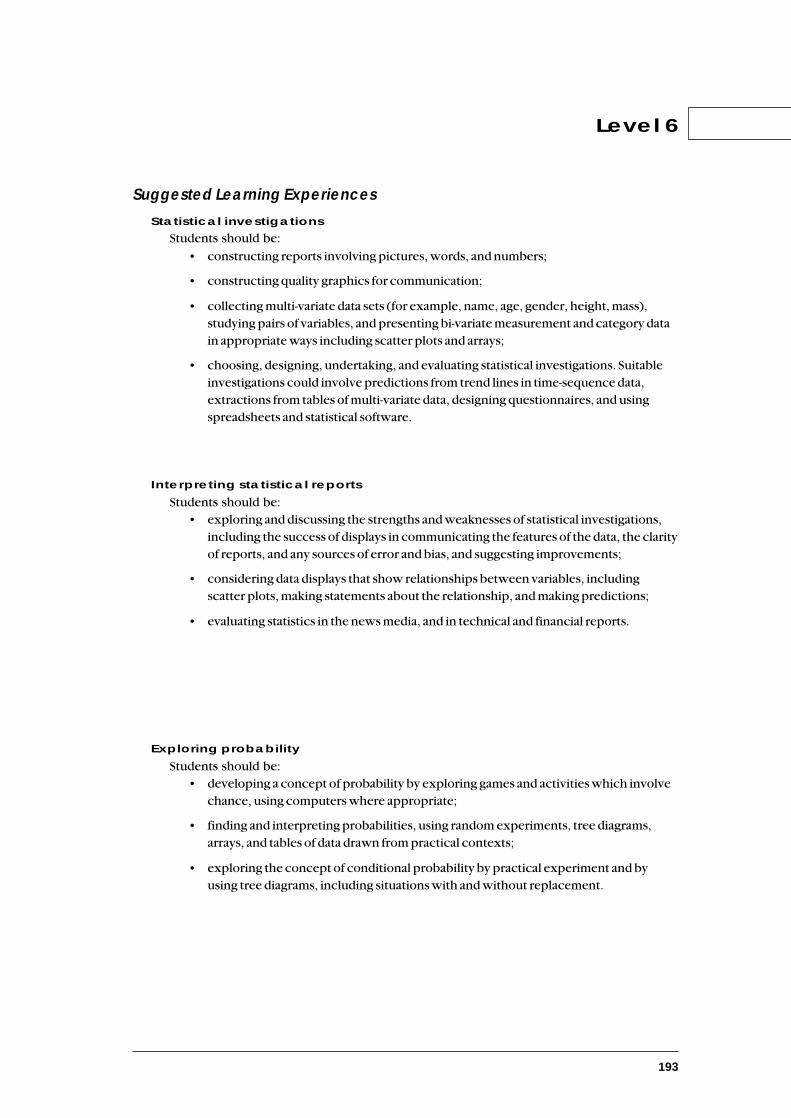
193
Level 6
Suggested Learning ExperiencesStatistical investigations
Students should be:
• constructing reports involving pictures, words, and numbers;
• constructing quality graphics for communication;
• collecting multi-variate data sets (for example, name, age, gender, height, mass),studying pairs of variables, and presenting bi-variate measurement and category datain appropriate ways including scatter plots and arrays;
• choosing, designing, undertaking, and evaluating statistical investigations. Suitableinvestigations could involve predictions from trend lines in time-sequence data,extractions from tables of multi-variate data, designing questionnaires, and usingspreadsheets and statistical software.
Interpreting statistical reports
Students should be:• exploring and discussing the strengths and weaknesses of statistical investigations,
including the success of displays in communicating the features of the data, the clarityof reports, and any sources of error and bias, and suggesting improvements;
• considering data displays that show relationships between variables, includingscatter plots, making statements about the relationship, and making predictions;
• evaluating statistics in the news media, and in technical and financial reports.
Exploring probability
Students should be:• developing a concept of probability by exploring games and activities which involve
chance, using computers where appropriate;
• finding and interpreting probabilities, using random experiments, tree diagrams,arrays, and tables of data drawn from practical contexts;
• exploring the concept of conditional probability by practical experiment and byusing tree diagrams, including situations with and without replacement.
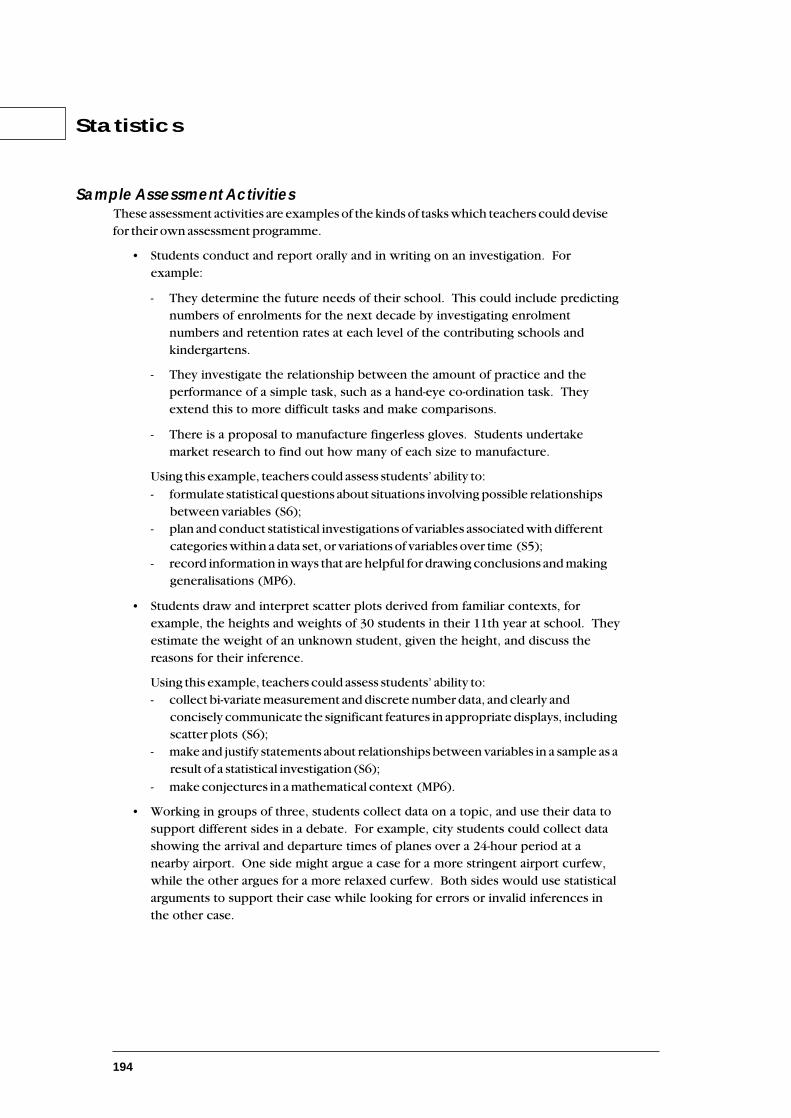
194
Statistics
Sample Assessment ActivitiesThese assessment activities are examples of the kinds of tasks which teachers could devisefor their own assessment programme.
• Students conduct and report orally and in writing on an investigation. Forexample:
- They determine the future needs of their school. This could include predictingnumbers of enrolments for the next decade by investigating enrolmentnumbers and retention rates at each level of the contributing schools andkindergartens.
- They investigate the relationship between the amount of practice and theperformance of a simple task, such as a hand-eye co-ordination task. Theyextend this to more difficult tasks and make comparisons.
- There is a proposal to manufacture fingerless gloves. Students undertakemarket research to find out how many of each size to manufacture.
Using this example, teachers could assess students’ ability to:
- formulate statistical questions about situations involving possible relationshipsbetween variables (S6);
- plan and conduct statistical investigations of variables associated with differentcategories within a data set, or variations of variables over time (S5);
- record information in ways that are helpful for drawing conclusions and makinggeneralisations (MP6).
• Students draw and interpret scatter plots derived from familiar contexts, forexample, the heights and weights of 30 students in their 11th year at school. Theyestimate the weight of an unknown student, given the height, and discuss thereasons for their inference.
Using this example, teachers could assess students’ ability to:- collect bi-variate measurement and discrete number data, and clearly and
concisely communicate the significant features in appropriate displays, includingscatter plots (S6);
- make and justify statements about relationships between variables in a sample as aresult of a statistical investigation (S6);
- make conjectures in a mathematical context (MP6).
• Working in groups of three, students collect data on a topic, and use their data tosupport different sides in a debate. For example, city students could collect datashowing the arrival and departure times of planes over a 24-hour period at anearby airport. One side might argue a case for a more stringent airport curfew,while the other argues for a more relaxed curfew. Both sides would use statisticalarguments to support their case while looking for errors or invalid inferences inthe other case.

195
Level 6
Using this example, teachers could assess students’ ability to:- formulate statistical questions about situations involving possible relationships
between variables (S6);- make and justify statements about relationships between variables in a sample as a
result of a statistical investigation (S6);- identify long-term and short-term features in time-series data (S6);
- pose questions for mathematical exploration (MP6);- prove or refute mathematical conjectures (MP6);- report the results of mathematical explorations concisely and coherently (MP6).
• Students present statistical information collected from published data. Forexample, they collect a table of multi-variate social data that interests them. Theypose questions, suggest implications and possible action, analyse the data to testtheir questions, and then write a letter suitable for publication in a newspaper,explaining and justifying their conclusions.
Using this example, teachers could assess students’ ability to:- use tables of multi-variate data from social contexts to find the probabilities of
everyday events or the proportion of outcomes in a given category (S6);- make and justify statements about relationships between variables in a sample as a
result of a statistical investigation (S6);
- interpret information and results in context (MP6).
• Students calculate probabilities (a) using a spinner to simulate the situation, and(b) using a tree diagram. For example, the results of many games of tennisbetween 2 players suggest that player A has a 0.6 chance of winning a set againstplayer B. The first player to win 2 sets, wins. Find the probability that player Awins the match.
Using this example, teachers could assess students’ ability to:- determine the theoretical probabilities of the outcomes of both exclusive and
independent events such as the rolling of a die followed by the drawing of a cardfrom a deck (S6);
- use probability trees to calculate conditional probabilities (S6);- solve practical problems involving decimals and percentages (N5).
0.4
0.6

196
Statistics
Sample Development Band Activities• Students use a simulation to model the inoculation of a population and investigate
what is needed to ensure success for the programme.
• Students investigate the role of statistics in describing and shaping aspects of publiclife, for example, forecasting economic trends, forecasting election results,describing or influencing consumer taste, developing public perception, anddeveloping policy on controversial issues.
• Students investigate the derivation and use of standard measures of correlation fortesting the strength of the relationship in sets of bi-variate data. For example:
- They might use Spearman’s formula for rank correlation to determine whethermale and female form 5 students rank their subject preferences similarly.
- They might collect data to compare armspan with height, hair length with height,hair length with armspan. They graph the data on scatterplots and discuss whatthese show about the relationships between the pairs of variables, then calculatePearson’s correlation co-efficient for each set of data, and discuss how thesecorrespond to the relationships shown by the graphs.

197
198
Statistics
Achievement ObjectivesStatistical investigations
Within a range of meaningful contexts, students should be able to:
• plan a statistical investigation to make inferences about a population or experimentalsituation;
• design and justify sample selection and data collection methods;
• collect data, present it visually, and discuss prominent features of the data;
• calculate sample statistics, including mean and standard deviation, and verify these byreference to a data distribution;
• highlight features in time-series graphs by simple algebraic transformations.
Exploring probability
Within a range of meaningful contexts, students should be able to:
• simulate situations using dice or random number generators to calculate probabilitiesof outcomes;
• recognise situations where the normal distribution is a suitable mathematical modeland use this model to solve problems;
• reduce a normal distribution to standard normal form and use tables of normalprobabilities.
Interpreting statistical reports
Within a range of meaningful contexts, students should be able to:
• analyse and discuss statistically-based inferences about populations or experiments;
• identify causes of long-term and short-term trends in time-series data extracted fromreference sources or experiments.
199
Level 7
Suggested Learning ExperiencesStatistical investigations
Students should be:
• designing, undertaking, and evaluating statistical investigations involving randomsampling, systematic sampling, and non-representative sampling; considering bias;and using different methods of data collection;
• justifying choice of samples to represent populations;
• using technology, such as spreadsheets and graphing software, where appropriate, toinvestigate and display data;
• analysing their findings, using sample statistics, including the standard deviation, andreporting their findings;
• investigating the features of time-series graphs by moving averages, for example,dividing one series by another.
Exploring probability
Students should be:• investigating the generation and properties of random numbers;
• investigating and solving problems about a variety of populations that can bemodelled by the normal distribution;
• using tree diagrams and tables to model situations where outcomes are notnecessarily equally likely;
• simulating situations which can be modelled by tossing coins or throwing dice.
Interpreting statistical reports
Students should be:• investigating graphs of time-series data, identifying inherent (for example, seasonal)
and assignable (abrupt changes or drift) variability, and discussing possible causes forassignable variability;
• evaluating statistics presented in the news media, and in technical and financialreports, and confidently expressing reasoned opinions on them.

200
Statistics
Sample Assessment ActivitiesThese assessment activities are examples of the kinds of tasks which teachers could devisefor their own assessment programme.
• Students carry out a practical survey and make a presentation of their findings. Forexample:
- They might investigate the local community’s need for a skate board ramp.They could survey the use of skate boards, design and cost a ramp, and make apresentation to the local council.
- They investigate learning in mathematics by interviewing younger people aboutthe strategies they use when solving mathematical tasks, and by reflecting ontheir own approaches to topics in mathematics. They explore the level ofretention in each case, trial the effects of alternative approaches to the learningof mathematics, and present their conclusions to the class.
Using this example, teachers could assess students’ ability to:- plan a statistical investigation to make inferences about a population or
experimental situation (S7);- collect data, present it visually, and discuss prominent features of the data (S7);- effectively plan mathematical exploration (MP7);
- record information in ways that are helpful for drawing conclusions and makinggeneralisations (MP7).
• Having gathered data on a situation of interest, the students use calculators, and/orspreadsheets or other appropriate software, to analyse the data, calculateappropriate sample statistics, and draw graphics. They present their conclusionsto the class visually and orally.
Using this example, teachers could assess students’ ability to:- calculate sample statistics including mean and standard deviation and verify these
by reference to a data distribution (S7);- use equipment appropriately when exploring mathematical ideas (MP7).
• Students critically evaluate time-series data presented in media reports orreferences such as The New Zealand Year Book, and discuss the statisticalsignificance of trends which may be evident. They present reasoned opinions onthe causes and likely long-term impact of variations and trends.
Using this example, teachers could assess students’ ability to:- identify long-term and short-term trends in time-series data (S6);
- identify causes of long-term and short-term trends in time-series data extractedfrom reference sources or experiments (S7);
- interpret information and results in context (MP7);- report the results of mathematical investigations concisely and coherently (MP7).
201
Level 7
• Students simulate a situation by rolling dice, using random number tables,spreadsheets, or other methods. For example, students use simulation to find howmany cereal packets they should buy in order to get a complete set of six cards.
Using this example, teachers could assess students’ ability to:
- simulate situations, using dice or random number generators to calculateprobabilities of outcomes (S7);
- use equipment appropriately when exploring mathematical ideas (MP7).
• Students model a situation for which they have a large sample of data by a normaldistribution. For example, a sample of 500 concrete trucks, each supposedlydelivering 3 cubic metres of concrete, has been weighed. The net mass ofconcrete in the trucks appears to be normally distributed about a mean of2 700 kg with a standard deviation of 150 kg. Students apply the properties of anormal distribution to calculate and apply probabilities that the mass of concretein a truck measured at random will or will not lie within or beyond certain limits,or, for example, the probability that three trucks in a row would deliver too littleconcrete for a job.
Using this example, teachers could assess students’ ability to:- recognise situations where the normal distribution is a suitable mathematical
model and use this model to solve problems (S7);- reduce a normal distribution to standard normal form and use tables of normal
probabilities (S7).
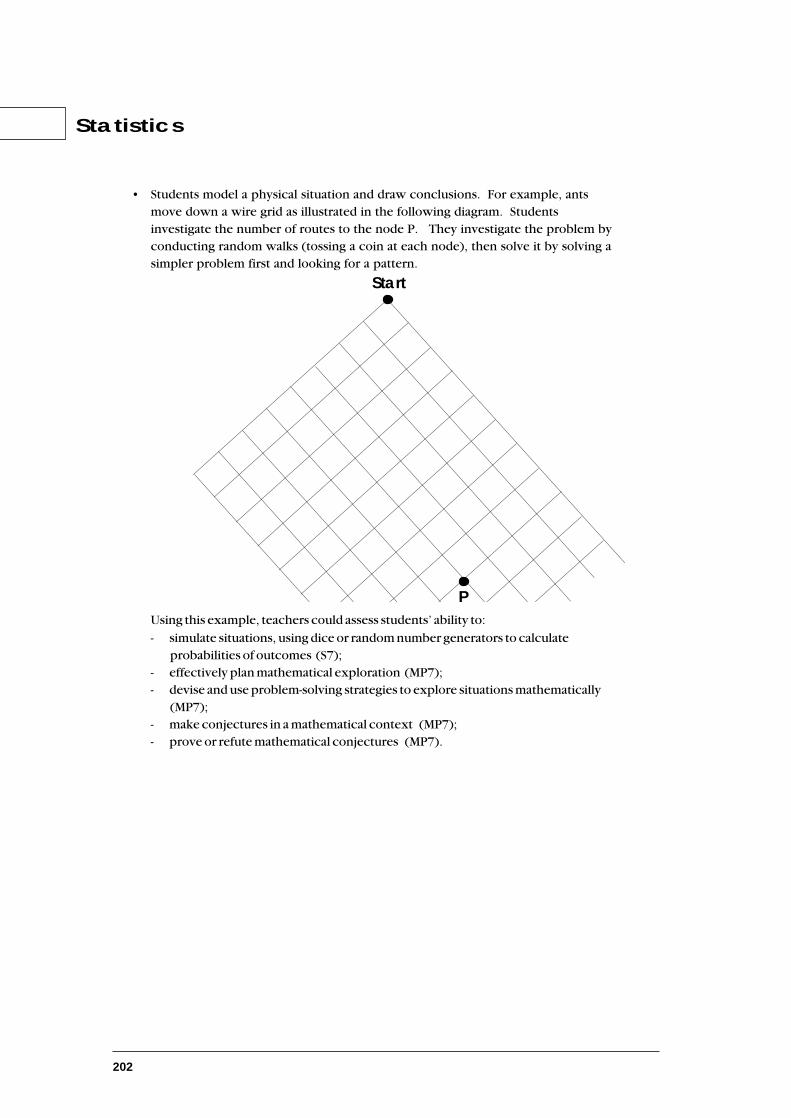
202
P
Start
Statistics
• Students model a physical situation and draw conclusions. For example, antsmove down a wire grid as illustrated in the following diagram. Studentsinvestigate the number of routes to the node P. They investigate the problem byconducting random walks (tossing a coin at each node), then solve it by solving asimpler problem first and looking for a pattern.
Using this example, teachers could assess students’ ability to:
- simulate situations, using dice or random number generators to calculateprobabilities of outcomes (S7);
- effectively plan mathematical exploration (MP7);- devise and use problem-solving strategies to explore situations mathematically
(MP7);- make conjectures in a mathematical context (MP7);- prove or refute mathematical conjectures (MP7).
203
Level 7
Sample Development Band Activities• Students investigate the use of statistical techniques in, for example, market research
and life insurance.
• Students investigate questionnaire design. They develop and trial interviewschedules to see if they serve their intended purpose. They investigate how differentforms of questions affect responses.
• Students develop probability distributions for discrete random variables, such as theproduct obtained when 2 dice are rolled.

204
Statistics
Achievement ObjectivesStatistical investigations
Within a range of meaningful contexts, students should be able to:
• plan a statistical investigation to estimate (2s) confidence intervals (margins of error)for the estimation of population parameters;
• report on a statistical experiment to investigate the consistency of samples in aprocess which is continuous over time.
Interpreting statistical reports
Within a range of meaningful contexts, students should be able to:
• explain differences between sample means and the population mean;
• recognise and explain sources of bias and unreliability in sampling situations;
• evaluate and explain the meaning of confidence intervals in estimating populationparameters and in using samples for quality control;
• identify situations where the sample may not have come from a clearly definedpopulation, and discuss the relevance of the findings.
205
Level 8
Suggested Learning ExperiencesStatistical investigations
Students should be:
• discussing the sensible use of location, spread, and visual displays of data in a widevariety of applications, and interpreting their use in the news media, and in technical,business, and their own reports;
• performing practical experiments to verify sampling distributions and discussing thecentral limit theorem;
• using sample statistics:
- as estimates of population parameters;- to calculate standard error and apply to confidence intervals using the 2-standard
error rule;- to investigate large sample confidence intervals for the population mean,
population proportion, and the difference between the means of twopopulations;
- to consider bias and sampling error;
• simulating a continuous process, for example, by cutting pieces of string to aspecified length, then analysing samples to determine the consistency of the process;
• investigating industrial applications of sampling to quality and/or process control.
Interpreting statistical reports
Students should be:
• investigating “margins of error” in survey reports and opinion polls;
• critically analysing data and reports to determine the point of view of the author, andre-presenting data for different target audiences;
• using appropriate technology to interpret data which does not assume any particulardistribution.
206
Statistics
Achievement ObjectivesExploring probability
Within a range of meaningful contexts, students should be able to:
• solve problems, using techniques which simulate a probability situation;
• define and use the basic terms and concepts of probability;
• choose the appropriate distribution (binomial, Poisson, or normal) to model a givensituation, calculate probabilities and expected values, and make predictions using themodel;
• calculate and interpret expected values for practical situations.

207
Level 8
Suggested Learning ExperiencesExploring probability
Students should be:
• using simulations to model real or imaginary situations;
• exploring the basic concepts of probability (trial, outcome, sample space, event)including disjoint (exclusive) events, complementary events, and exhaustive events,and should be calculating probabilities of combined events, conditional probabilities,and independent events;
• exploring discrete random variables and their use in, for example, life insurance,games of chance, events involving risk;
• formalising the expected value and variance of a linear function of a random variableand of sums of independent random variables;
• discussing, and experimenting with different probability distributions (rectangular,binomial, Poisson, normal), exploring their applications, developing criteria for theapplication of each and the relationships between them, and using tables ofprobabilities for these distributions;
• creating probability distributions for given variables and using them to solveproblems;
• exploring the use of probability models in simulations. For example, they couldinvestigate the use of a spreadsheet to apply the Poisson distribution in a simulationof queuing at a supermarket checkout during various time periods in a day.
208
Sample Assessment ActivitiesThese assessment activities are examples of the kinds of tasks which teachers could devisefor their own assessment programme.
• Students investigate the application of confidence limits in Quality Management.For example, they simulate a canning operation by filling a large number ofidentical containers (for example, paper cups) with sand. The net mass of sand ineach can is measured and the data analysed to establish parameters for the mass ofsand in a can. Using this data, they produce average and range charts for theprocess of canning sand. To carry out the simulation they could repeatedly fillsamples of cans and measure their statistics, comparing variations with the charts.They pose questions about the process. For example, are there noticeablevariations when new “fillers” are employed?
Using this example, teachers could assess students’ ability to:- plan a statistical investigation to estimate (2s) confidence intervals (margins of
error) for the estimation of population parameters (S8);- report on a statistical experiment to investigate the consistency of samples in a
process which is continuous over time (S8);- evaluate and explain the meaning of confidence intervals in estimating
population parameters and in using samples for quality control (S8);
- identify causes of long-term and short-term trends in time-series data extractedfrom reference sources or experiments (S7).
• Students devise and test a mathematical model of a practical problem. Forexample, it is claimed that if all cars at a traffic light stopped 2 metres apart andmoved simultaneously at the same speed when the lights turned green, then 4times as many cars would get through the lights on each phase. They investigatethis, using methods such as simulation and on-site analysis, and report withrecommendations.
Using this example, teachers could assess students’ ability to:- solve problems, using techniques which simulate a probability situation (S8);- choose the appropriate distribution (binomial, Poisson, or normal) to model a
given situation, calculate probabilities and expected values, and make predictionsusing the model (S8).
Statistics

209
• Students decide which distribution is the best model for a given situation and usean appropriate strategy to solve a problem. For example, a pest-eradication expertclaims she can remove cockroaches from any house 80% of the time. The healthinspector decides to test this claim by monitoring 120 houses, and 79 houses arefound to be free of cockroaches. Students decide which distribution is the bestmodel, giving reasons, and test the expert’s claim.
Using this example, teachers could assess students’ ability to:
- choose the appropriate distribution (binomial, Poisson, or normal) to model agiven situation, calculate probabilities and expected values, and make predictionsusing the model (S8);
- evaluate and explain the meaning of confidence intervals in estimatingpopulation parameters and in using samples for quality control (S8).
Sample Development Band Activities
• Students develop theoretical probability distributions. For example, they usesimulation and model building to develop the binomial distribution.
• Students investigate the use of other probability distributions such as Student’st-distribution.
• Students investigate probability in a number of complex situations. For example:
- As part of a recycling campaign, they are to design a fruit machine that will acceptaluminium cans instead of money and that will give prizes. Design the machine onthe assumption that it is to be non-profit making and that each can is worth $0.01.What changes would need to be made if the machine is to make a 20% profit andcans are worth $0.015?
- Students find the probability that at least 2 people in a group have the samebirthday.
- Students investigate situations where the normal distribution, with an appropriatecontinuity correction, can be used as an approximation for situations moreprecisely modelled by the Poisson distribution or the binomial distribution.
Level 8
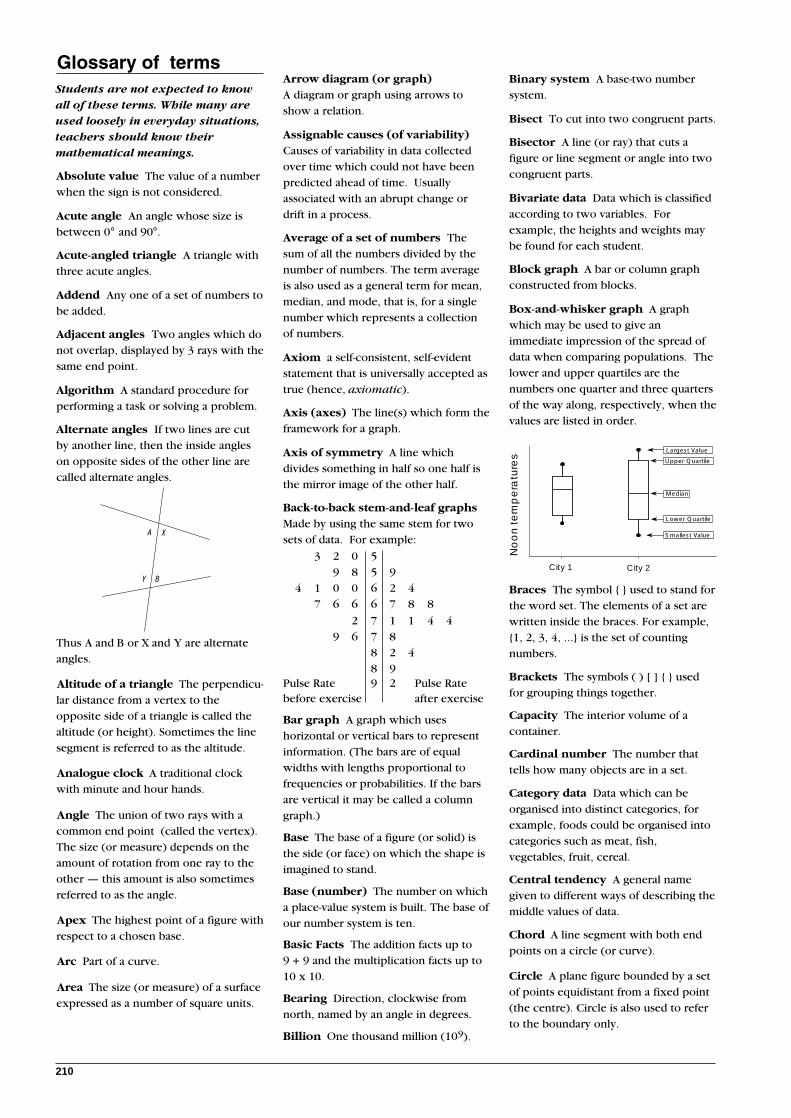
210
Binary system A base-two numbersystem.
Bisect To cut into two congruent parts.
Bisector A line (or ray) that cuts afigure or line segment or angle into twocongruent parts.
Bivariate data Data which is classifiedaccording to two variables. Forexample, the heights and weights maybe found for each student.
Block graph A bar or column graphconstructed from blocks.
Box-and-whisker graph A graphwhich may be used to give animmediate impression of the spread ofdata when comparing populations. Thelower and upper quartiles are thenumbers one quarter and three quartersof the way along, respectively, when thevalues are listed in order.
Braces The symbol { } used to stand forthe word set. The elements of a set arewritten inside the braces. For example,{1, 2, 3, 4, ...} is the set of countingnumbers.
Brackets The symbols ( ) [ ] { } usedfor grouping things together.
Capacity The interior volume of acontainer.
Cardinal number The number thattells how many objects are in a set.
Category data Data which can beorganised into distinct categories, forexample, foods could be organised intocategories such as meat, fish,vegetables, fruit, cereal.
Central tendency A general namegiven to different ways of describing themiddle values of data.
Chord A line segment with both endpoints on a circle (or curve).
Circle A plane figure bounded by a setof points equidistant from a fixed point(the centre). Circle is also used to referto the boundary only.
Arrow diagram (or graph)A diagram or graph using arrows toshow a relation.
Assignable causes (of variability)Causes of variability in data collectedover time which could not have beenpredicted ahead of time. Usuallyassociated with an abrupt change ordrift in a process.
Average of a set of numbers Thesum of all the numbers divided by thenumber of numbers. The term averageis also used as a general term for mean,median, and mode, that is, for a singlenumber which represents a collectionof numbers.
Axiom a self-consistent, self-evidentstatement that is universally accepted astrue (hence, axiomatic).
Axis (axes) The line(s) which form theframework for a graph.
Axis of symmetry A line whichdivides something in half so one half isthe mirror image of the other half.
Back-to-back stem-and-leaf graphsMade by using the same stem for twosets of data. For example:
3 2 0 59 8 5 9
4 1 0 0 6 2 47 6 6 6 7 8 8
2 7 1 1 4 49 6 7 8
8 2 48 9
Pulse Rate 9 2 Pulse Ratebefore exercise after exercise
Bar graph A graph which useshorizontal or vertical bars to representinformation. (The bars are of equalwidths with lengths proportional tofrequencies or probabilities. If the barsare vertical it may be called a columngraph.)
Base The base of a figure (or solid) isthe side (or face) on which the shape isimagined to stand.
Base (number) The number on whicha place-value system is built. The base ofour number system is ten.
Basic Facts The addition facts up to9 + 9 and the multiplication facts up to10 x 10.
Bearing Direction, clockwise fromnorth, named by an angle in degrees.
Billion One thousand million (109).
Glossary of termsStudents are not expected to knowall of these terms. While many areused loosely in everyday situations,teachers should know theirmathematical meanings.
Absolute value The value of a numberwhen the sign is not considered.
Acute angle An angle whose size isbetween 0° and 90°.
Acute-angled triangle A triangle withthree acute angles.
Addend Any one of a set of numbers tobe added.
Adjacent angles Two angles which donot overlap, displayed by 3 rays with thesame end point.
Algorithm A standard procedure forperforming a task or solving a problem.
Alternate angles If two lines are cutby another line, then the inside angleson opposite sides of the other line arecalled alternate angles.
Thus A and B or X and Y are alternateangles.
Altitude of a triangle The perpendicu-lar distance from a vertex to theopposite side of a triangle is called thealtitude (or height). Sometimes the linesegment is referred to as the altitude.
Analogue clock A traditional clockwith minute and hour hands.
Angle The union of two rays with acommon end point (called the vertex).The size (or measure) depends on theamount of rotation from one ray to theother — this amount is also sometimesreferred to as the angle.
Apex The highest point of a figure withrespect to a chosen base.
Arc Part of a curve.
Area The size (or measure) of a surfaceexpressed as a number of square units.
A X
BY
Largest Value
Upper Quartile
Smallest Value
Lower Quartile
Median
Cit 1 Cit 2
No
on
te
mp
era
ture
s
City 1 City 2
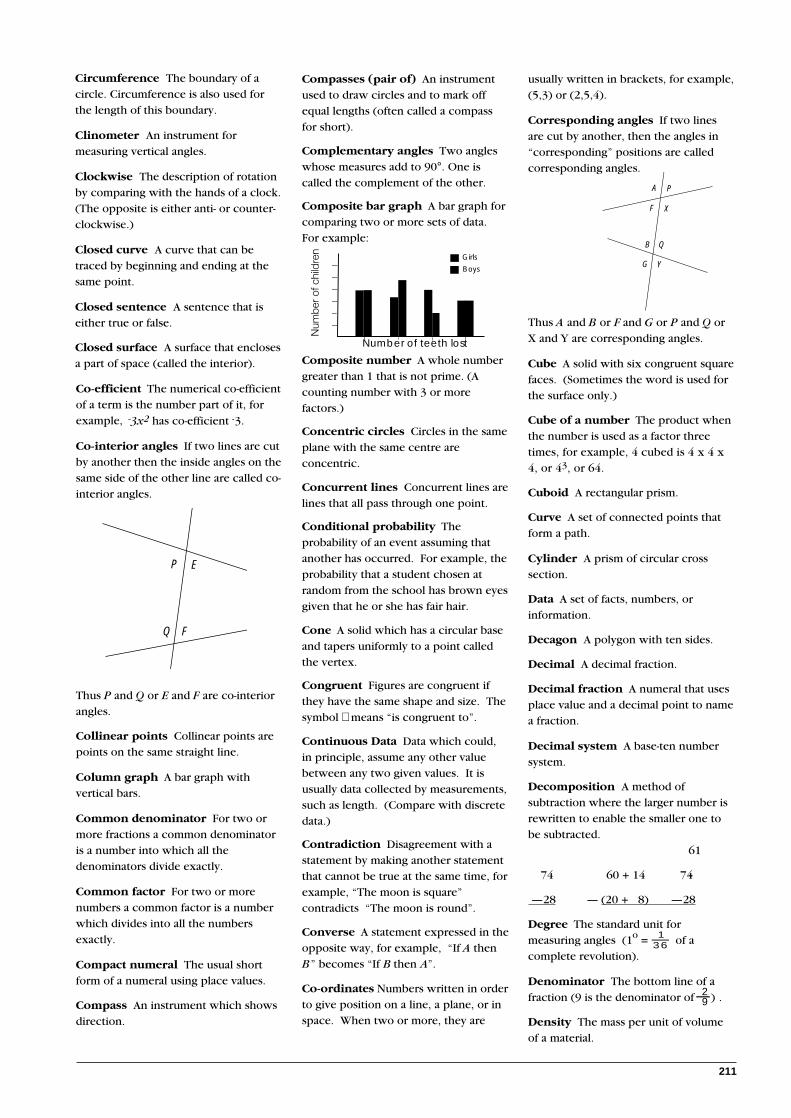
211
usually written in brackets, for example,(5,3) or (2,5,4).
Corresponding angles If two linesare cut by another, then the angles in“corresponding” positions are calledcorresponding angles.
Thus A and B or F and G or P and Q orX and Y are corresponding angles.
Cube A solid with six congruent squarefaces. (Sometimes the word is used forthe surface only.)
Cube of a number The product whenthe number is used as a factor threetimes, for example, 4 cubed is 4 x 4 x4, or 43, or 64.
Cuboid A rectangular prism.
Curve A set of connected points thatform a path.
Cylinder A prism of circular crosssection.
Data A set of facts, numbers, orinformation.
Decagon A polygon with ten sides.
Decimal A decimal fraction.
Decimal fraction A numeral that usesplace value and a decimal point to namea fraction.
Decimal system A base-ten numbersystem.
Decomposition A method ofsubtraction where the larger number isrewritten to enable the smaller one tobe subtracted.
61
74 60 + 14 74
—28 — (20 + 8) —28
Degree The standard unit formeasuring angles (1o = 360
1 of a
complete revolution).
Denominator The bottom line of afraction (9 is the denominator of
29 ) .
Density The mass per unit of volumeof a material.
Compasses (pair of) An instrumentused to draw circles and to mark offequal lengths (often called a compassfor short).
Complementary angles Two angleswhose measures add to 90°. One iscalled the complement of the other.
Composite bar graph A bar graph forcomparing two or more sets of data.For example:
Composite number A whole numbergreater than 1 that is not prime. (Acounting number with 3 or morefactors.)
Concentric circles Circles in the sameplane with the same centre areconcentric.
Concurrent lines Concurrent lines arelines that all pass through one point.
Conditional probability Theprobability of an event assuming thatanother has occurred. For example, theprobability that a student chosen atrandom from the school has brown eyesgiven that he or she has fair hair.
Cone A solid which has a circular baseand tapers uniformly to a point calledthe vertex.
Congruent Figures are congruent ifthey have the same shape and size. Thesymbol ≅ means “is congruent to”.
Continuous Data Data which could,in principle, assume any other valuebetween any two given values. It isusually data collected by measurements,such as length. (Compare with discretedata.)
Contradiction Disagreement with astatement by making another statementthat cannot be true at the same time, forexample, “The moon is square”contradicts “The moon is round”.
Converse A statement expressed in theopposite way, for example, “If A thenB” becomes “If B then A”.
Co-ordinates Numbers written in orderto give position on a line, a plane, or inspace. When two or more, they are
Circumference The boundary of acircle. Circumference is also used forthe length of this boundary.
Clinometer An instrument formeasuring vertical angles.
Clockwise The description of rotationby comparing with the hands of a clock.(The opposite is either anti- or counter-clockwise.)
Closed curve A curve that can betraced by beginning and ending at thesame point.
Closed sentence A sentence that iseither true or false.
Closed surface A surface that enclosesa part of space (called the interior).
Co-efficient The numerical co-efficientof a term is the number part of it, forexample, -3x2 has co-efficient -3.
Co-interior angles If two lines are cutby another then the inside angles on thesame side of the other line are called co-interior angles.
Thus P and Q or E and F are co-interiorangles.
Collinear points Collinear points arepoints on the same straight line.
Column graph A bar graph withvertical bars.
Common denominator For two ormore fractions a common denominatoris a number into which all thedenominators divide exactly.
Common factor For two or morenumbers a common factor is a numberwhich divides into all the numbersexactly.
Compact numeral The usual shortform of a numeral using place values.
Compass An instrument which showsdirection.
Num
ber
of c
hild
ren
Girls
Boys
F X
QB
A P
G Y
Number of teeth lost
P E
FQ

212
Dot plot Represents outcomes as dotson a scale. For example:
Time students take to get to school
Edge The intersection of two planes.
Element (member) of a set An itemin a set.
Ellipse A figure bounded by a curve inwhich the sum of the distances fromany point on the curve to two particularpoints is always the same.
Empty set The set that has nomembers. (Its cardinal number is 0.) Itis written as φ or { }.
Equation An open number sentencestating that two quantities are equal.
Equilaterial triangle A triangle inwhich all three sides are congruent.
Equivalent fractions Fractions thatname the same fractional number.
Equivalent sentences (equations)Sentences (equations) with the samesolution set.
Equivalent sets Sets that contain thesame number of members.
Estimation An approximatecalculation or a judgement of what aresult will be.
Euler’s relation V + F - E =2 Where Vis the number of vertices (or nodes), Fthe number of faces (or regions), and Ethe number of edges (or arcs) on apolyhedron (or network).
Expanded numeral A numeralwritten as the sum of the total value ofits digits, for example, 800 + 40 + 2.
Exponent A numeral written aboveand to the right of another numeral toshow how many times the base numeralis used as a factor, for example, in 53, 3is the exponent, 53 = 5 x 5 x 5 = 125.Another word for exponent is index.
Exponentiation The act of expressinga number as a base number with anexponent.
Exterior angle An angle formedbetween a side of a figure and theextension outside the figure of anadjacent side.
Extrapolation An approximatecalculation from known data of otherswhich lie outside the range of the data.
Face A plane surface of a polyhedron.
Face value The value of the numberthat a digit names. For example, in 57,5 has face value five.
Factor A number that is multiplied byanother number to name a product, forexample, 3 x 2 = 6 so 3 and 2 are factorsof 6.
Figurate numbers Numbers that canbe represented by dots arranged in afigure:
Finite set A set whose members can allbe listed or counted.
Flow-chart A set of instructions inchart form.
Fractal A shape formed by an iterativeprocess giving an infinite perimeter fora finite area. For example:
Fraction A numeral naming a fractionalnumber, usually written in the form 2
5 .
Fractional number A number used tocompare a subset and its set or a part tothe whole.
Frequency The number of times anitem appears.
Frequency table A table showing thefrequencies of data items in categoriesor intervals.
Function A set of ordered pairs whereeach first element of the pairs occursonce only, for example,{(0,2),(1,3),(2,4)...}.
Geodesic Built of short struts along theshortest possible lines on a surface.
Golden section The ratio ba = when
Diagonal A line segment that joins twovertices of a polygon, but is not a side.
Diameter of a circle A diameter of acircle is a chord that passes through thecentre. (Diameter is sometimes used torefer to the length of the diameter.)
Difference The amount by which onenumber is greater than another. Thedifference is found by subtraction.
Digit A symbol used to writenumerals.
Digital clock A clock that displays thetime in numbers.
Dilation An enlargement or reductionof a shape in which all the linearmeasures are multiplied by the samenumber (called the scale factor).
Discount A reduction from the regularprice.
Discount rate A discount rate of 20%means the regular price is reduced by20 per cent of itself.
Discrete data Data which can takeonly certain values, such as the numberof legs on animals. (Compare withcontinuous data.)
Disjoint sets Sets are disjoint if theirintersection is empty, that is, they haveno common members.
Distance from a point to a line Thelength of the perpendicular linesegment from the point to the line.
Distortion A transformation whichchanges the shape, rather than only thesize, of a figure.
Dividend If the one number is beingdivided by a second, then the firstnumber is the dividend, for example, in12 ÷ 3 = 4, 12 is the dividend.
Divisible One number is divisible byanother if the first is a multiple of thesecond.
Divisor If one number is being dividedby a second, then the second number isthe divisor, for example, in 12 ÷ 3 = 4, 3is the divisor.
Dodecahedron A polyhedron withtwelve faces.
Domain See Mapping.
5 10 15 20 25 30
Time students take to get to school
(a+b)b
ab
=
1 3 6 10
s
1 4 9
s
16
triangular
numbers
square
numbers
y
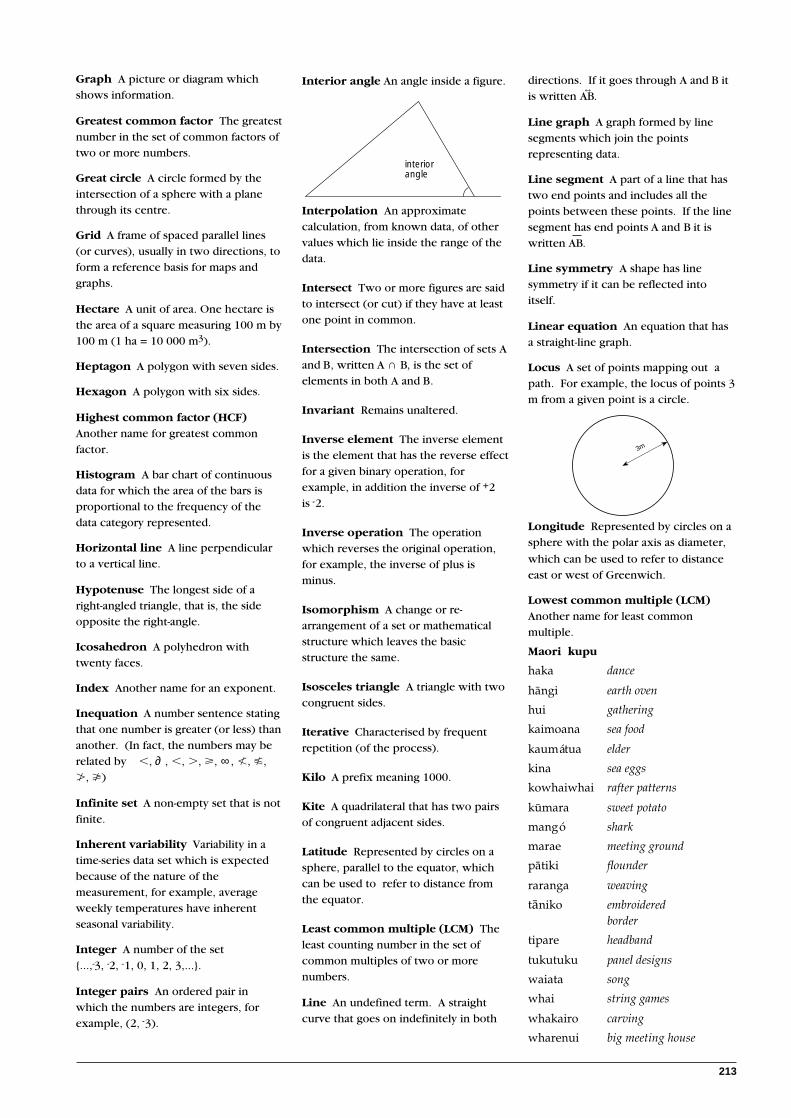
213
Interior angle An angle inside a figure.
Interpolation An approximatecalculation, from known data, of othervalues which lie inside the range of thedata.
Intersect Two or more figures are saidto intersect (or cut) if they have at leastone point in common.
Intersection The intersection of sets Aand B, written A ∩ B, is the set ofelements in both A and B.
Invariant Remains unaltered.
Inverse element The inverse elementis the element that has the reverse effectfor a given binary operation, forexample, in addition the inverse of +2is -2.
Inverse operation The operationwhich reverses the original operation,for example, the inverse of plus isminus.
Isomorphism A change or re-arrangement of a set or mathematicalstructure which leaves the basicstructure the same.
Isosceles triangle A triangle with twocongruent sides.
Iterative Characterised by frequentrepetition (of the process).
Kilo A prefix meaning 1000.
Kite A quadrilateral that has two pairsof congruent adjacent sides.
Latitude Represented by circles on asphere, parallel to the equator, whichcan be used to refer to distance fromthe equator.
Least common multiple (LCM) Theleast counting number in the set ofcommon multiples of two or morenumbers.
Line An undefined term. A straightcurve that goes on indefinitely in both
directions. If it goes through A and B itis written AB.
Line graph A graph formed by linesegments which join the pointsrepresenting data.
Line segment A part of a line that hastwo end points and includes all thepoints between these points. If the linesegment has end points A and B it iswritten AB.
Line symmetry A shape has linesymmetry if it can be reflected intoitself.
Linear equation An equation that hasa straight-line graph.
Locus A set of points mapping out apath. For example, the locus of points 3m from a given point is a circle.
Longitude Represented by circles on asphere with the polar axis as diameter,
which can be used to refer to distanceeast or west of Greenwich.
Lowest common multiple (LCM)Another name for least commonmultiple.
Maori kupu
haka dance
hàngi earth oven
hui gathering
kaimoana sea food
kaumátua elder
kina sea eggs
kowhaiwhai rafter patterns
kùmara sweet potato
mangó shark
marae meeting ground
pàtiki flounder
raranga weaving
tàniko embroideredborder
tipare headband
tukutuku panel designs
waiata song
whai string games
whakairo carving
wharenui big meeting house
Graph A picture or diagram whichshows information.
Greatest common factor The greatestnumber in the set of common factors oftwo or more numbers.
Great circle A circle formed by theintersection of a sphere with a planethrough its centre.
Grid A frame of spaced parallel lines(or curves), usually in two directions, toform a reference basis for maps andgraphs.
Hectare A unit of area. One hectare isthe area of a square measuring 100 m by100 m (1 ha = 10 000 m3).
Heptagon A polygon with seven sides.
Hexagon A polygon with six sides.
Highest common factor (HCF)Another name for greatest commonfactor.
Histogram A bar chart of continuousdata for which the area of the bars isproportional to the frequency of thedata category represented.
Horizontal line A line perpendicularto a vertical line.
Hypotenuse The longest side of aright-angled triangle, that is, the sideopposite the right-angle.
Icosahedron A polyhedron withtwenty faces.
Index Another name for an exponent.
Inequation A number sentence statingthat one number is greater (or less) thananother. (In fact, the numbers may berelated by ,, ∂ , ,, ., Ä, ∞ , ø, ÷,ù, À)
Infinite set A non-empty set that is notfinite.
Inherent variability Variability in atime-series data set which is expectedbecause of the nature of themeasurement, for example, averageweekly temperatures have inherentseasonal variability.
Integer A number of the set{...,-3, -2, -1, 0, 1, 2, 3,...}.
Integer pairs An ordered pair inwhich the numbers are integers, forexample, (2, -3).
interior angle
↔
3m

214
labelled by numbers.
Number plane A plane with pointslabelled by ordered number pairs.
Numeral A name or symbol used for anumber.
Numerator The top line of a fraction(2 is the numerator of
29
).
Obtuse angle An angle with sizebetween 90o and 180o.
Octagon A polygon with eight sides.
Octahedron A polyhedron with eightfaces.
Odds A gambling term for acomparison of probabilities.
Open number sentence A numbersentence that cannot be said to be trueor false.
Opposite numbers Two numberswhose sum is zero.
Order Numbers arranged in sequencefrom least to greatest, or vice versa, arein order.
Ordered pair A pair of numbers whereorder is important: (3,6) is not the sameas (6,3).
Order of symmetry The order ofrotational symmetry is the number ofways a shape can be rotated to fit onitself. The number of axes of symmetryis the number of ways it can bereflected into itself. The total order ofsymmetry is the order of rotationalsymmetry plus the number of axes ofsymmetry.
Outcome The result of an experiment.
Oval(a) An egg-shaped figure with 1 axis ofsymmetry.(b) Another name for an ellipse.
Palindrome A word, sentence, ornumber that reads the same backwardsor forwards, for example, madam,19691.
Parabola A curve in which every pointis the same distance from a particularpoint as from a particular line.
Mass The mass of an object is ameasure of the amount of matter in it.(The term weight is often used,imprecisely, for mass).
Mean The mean of a set of scores is thesum of the scores divided by thenumber of scores. (The term average issometimes used instead of mean.)
Median The number which comes inthe middle of a set of numbers whenthey are arranged in order.
Median of a triangle A line drawnfrom a vertex of a triangle to the mid-point of the opposite side.
Mediator Another name forperpendicular bisector.
Member of a set A member (orelement) of a set is an item in a set.
Metric system See SystémeInternationale d’Unites.
Mid-point of a line segment Thepoint on a line segment that is the samedistance from both end points.
Minute (angles) One minute (written1' ) equals 6 0
1 o.
Mirror line See axis of symmetry.
Mixed number A number which ispart whole and part fraction.
Mode The number that appears mostoften in a set of data.
Multi-layer time-sequence graphsTwo time-sequence curves plotted onthe same graph for the purpose ofcomparing the two situations.
Multiple A multiple of a number is aproduct of that number and a wholenumber (or natural number, accordingto the text being used).
Multivariate data Data which isclassified according to more than twovariables. For example, the heights,weights, and gender may be found foreach student.
Natural number One of the countingnumbers, {1,2,3,...}.
Net A pattern of polygons that can befolded to form (the surface of) apolyhedron.
Nomograph (or Nomogram) Adevice to find a third variable whengiven two others involved in a knownrelation, usually by placing a ruler acrossscales on a chart or graph.
Number line A line with points
Parallel lines Two (or more) lines thathave the same directions (if they are inthe same plane then they are lines thatnever intersect).
Parallelogram A quadrilateral withopposite sides parallel (and congruent).
Pentagon A polygon with five sides.
Per cent A numeral for a fractionalnumber whose denominator is 100, forexample, 37 percent = 37% =
3 7100 .
Percentage Another word for per cent.
Perimeter The boundary of a planefigure. Also the distance round thisboundary.
Perpendicular bisector A line thatbisects a line segment and isperpendicular to it.
Perpendicular lines Lines thatintersect to form a right angle.
Pi (π) For a circle, a number that equalsthe length of the circumference dividedby the length of the diameter. It isabout 3.
Pictograph A graph drawn withpictures.
Pie graph (or pie chart) A circlegraph cut into sectors.
Place value The value of the place adigit occupies, for example, in 57 the 5occupies the tens place.
Plane A flat surface that extendsindefinitely.
Point The intersection of two lines.
Polygon A plane figure bounded bythe union of three or more linesegments that form a simple closedcurve. (Sometimes polygon refers onlyto the boundary.)
Polyhedron A solid bounded bypolygons. (Sometimes polyhedron refersonly to the bounding surface.)
Polyomino A plane shape made ofsquares of the same size, each squarebeing connected to at least one other bya common edge. (Domino, tromino,tetromino, pentomino....)
Power A product shown by a basenumber and an exponent, for example,34 = 3 x 3 x 3 x 3 = 81 is the fourthpower of 3. (The index is sometimescalled the power.)
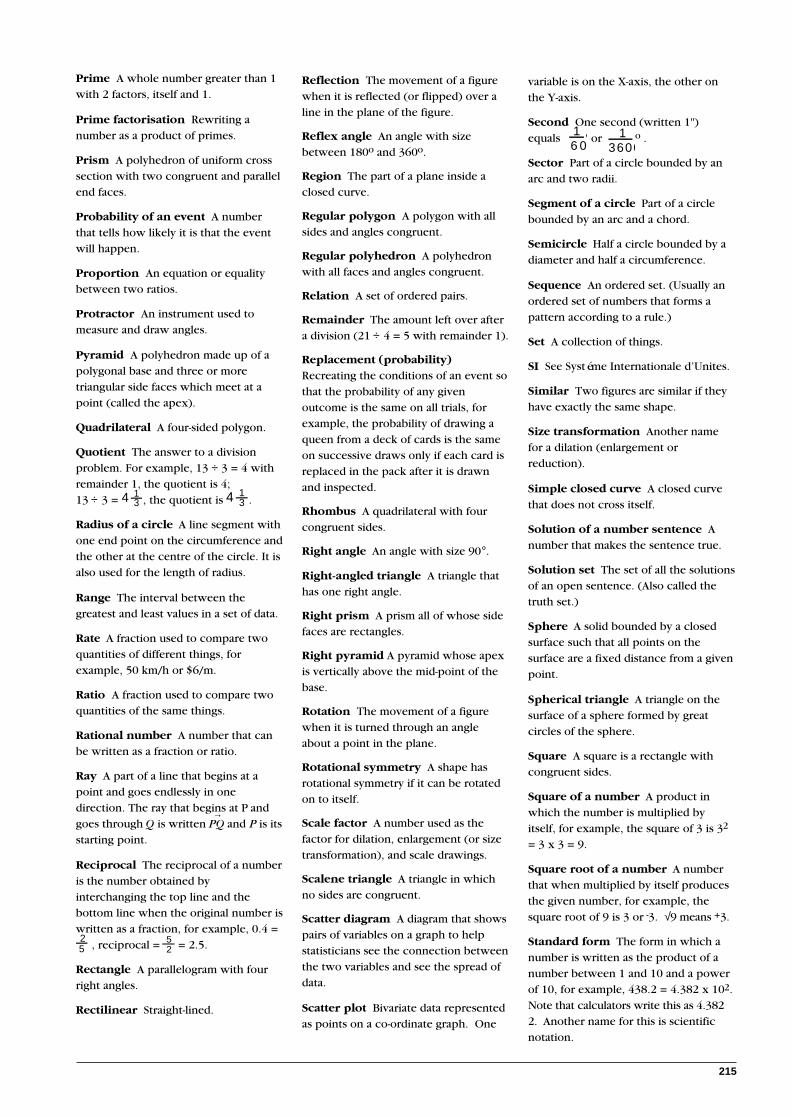
215
Prime A whole number greater than 1with 2 factors, itself and 1.
Prime factorisation Rewriting anumber as a product of primes.
Prism A polyhedron of uniform crosssection with two congruent and parallelend faces.
Probability of an event A numberthat tells how likely it is that the eventwill happen.
Proportion An equation or equalitybetween two ratios.
Protractor An instrument used tomeasure and draw angles.
Pyramid A polyhedron made up of apolygonal base and three or moretriangular side faces which meet at apoint (called the apex).
Quadrilateral A four-sided polygon.
Quotient The answer to a divisionproblem. For example, 13 ÷ 3 = 4 withremainder 1, the quotient is 4;13 ÷ 3 =
134 , the quotient is
134 .
Radius of a circle A line segment withone end point on the circumference andthe other at the centre of the circle. It isalso used for the length of radius.
Range The interval between thegreatest and least values in a set of data.
Rate A fraction used to compare twoquantities of different things, forexample, 50 km/h or $6/m.
Ratio A fraction used to compare twoquantities of the same things.
Rational number A number that canbe written as a fraction or ratio.
Ray A part of a line that begins at apoint and goes endlessly in onedirection. The ray that begins at P andgoes through Q is written PQ and P is itsstarting point.
Reciprocal The reciprocal of a numberis the number obtained byinterchanging the top line and thebottom line when the original number iswritten as a fraction, for example, 0.4 =25 , reciprocal = 5
2 = 2.5.
Rectangle A parallelogram with fourright angles.
Rectilinear Straight-lined.
Reflection The movement of a figurewhen it is reflected (or flipped) over aline in the plane of the figure.
Reflex angle An angle with sizebetween 180o and 360o.
Region The part of a plane inside aclosed curve.
Regular polygon A polygon with allsides and angles congruent.
Regular polyhedron A polyhedronwith all faces and angles congruent.
Relation A set of ordered pairs.
Remainder The amount left over aftera division (21 ÷ 4 = 5 with remainder 1).
Replacement (probability)Recreating the conditions of an event sothat the probability of any givenoutcome is the same on all trials, forexample, the probability of drawing aqueen from a deck of cards is the sameon successive draws only if each card isreplaced in the pack after it is drawnand inspected.
Rhombus A quadrilateral with fourcongruent sides.
Right angle An angle with size 90°.
Right-angled triangle A triangle thathas one right angle.
Right prism A prism all of whose sidefaces are rectangles.
Right pyramid A pyramid whose apexis vertically above the mid-point of thebase.
Rotation The movement of a figurewhen it is turned through an angleabout a point in the plane.
Rotational symmetry A shape hasrotational symmetry if it can be rotatedon to itself.
Scale factor A number used as thefactor for dilation, enlargement (or sizetransformation), and scale drawings.
Scalene triangle A triangle in whichno sides are congruent.
Scatter diagram A diagram that showspairs of variables on a graph to helpstatisticians see the connection betweenthe two variables and see the spread ofdata.
Scatter plot Bivariate data representedas points on a co-ordinate graph. One
variable is on the X-axis, the other onthe Y-axis.
Second One second (written 1")equals
16 0
' or 3600
1 o .
Sector Part of a circle bounded by anarc and two radii.
Segment of a circle Part of a circlebounded by an arc and a chord.
Semicircle Half a circle bounded by adiameter and half a circumference.
Sequence An ordered set. (Usually anordered set of numbers that forms apattern according to a rule.)
Set A collection of things.
SI See Systéme Internationale d’Unites.
Similar Two figures are similar if theyhave exactly the same shape.
Size transformation Another namefor a dilation (enlargement orreduction).
Simple closed curve A closed curvethat does not cross itself.
Solution of a number sentence Anumber that makes the sentence true.
Solution set The set of all the solutionsof an open sentence. (Also called thetruth set.)
Sphere A solid bounded by a closedsurface such that all points on thesurface are a fixed distance from a givenpoint.
Spherical triangle A triangle on thesurface of a sphere formed by greatcircles of the sphere.
Square A square is a rectangle withcongruent sides.
Square of a number A product inwhich the number is multiplied byitself, for example, the square of 3 is 32
= 3 x 3 = 9.
Square root of a number A numberthat when multiplied by itself producesthe given number, for example, thesquare root of 9 is 3 or -3. √9 means +3.
Standard form The form in which anumber is written as the product of anumber between 1 and 10 and a powerof 10, for example, 438.2 = 4.382 x 10².Note that calculators write this as 4.3822. Another name for this is scientificnotation.
←
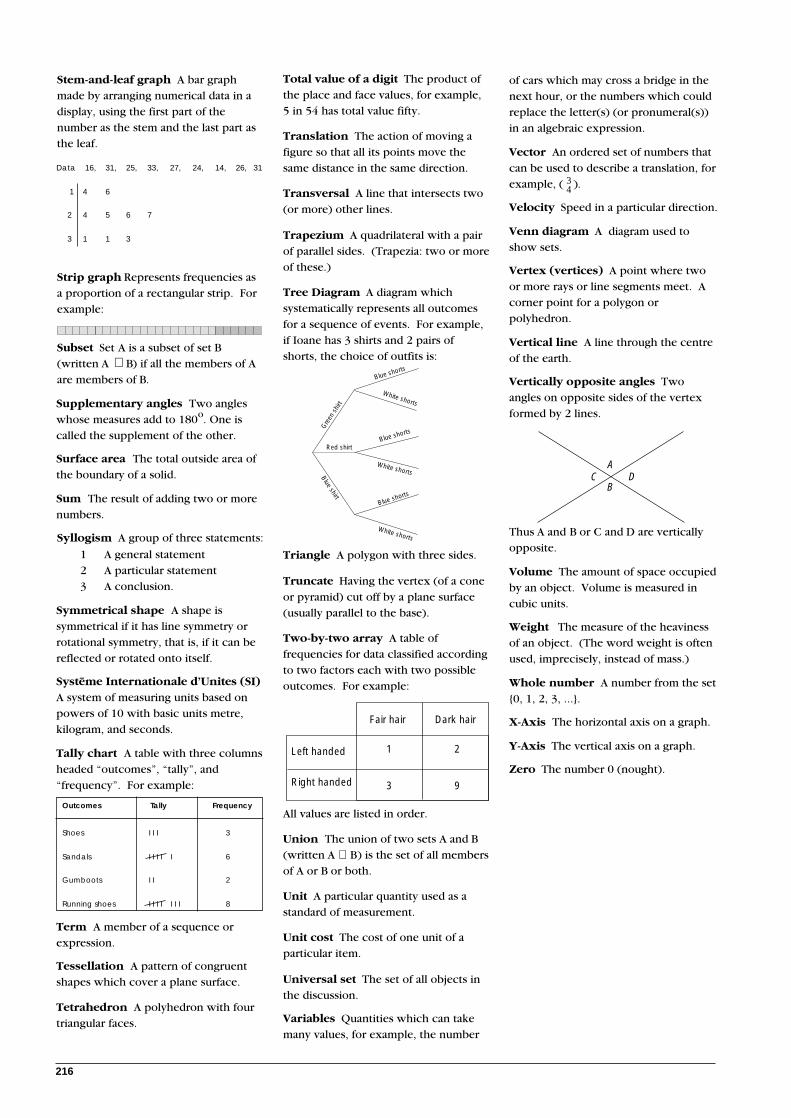
216
Stem-and-leaf graph A bar graphmade by arranging numerical data in adisplay, using the first part of thenumber as the stem and the last part asthe leaf.
Data 16, 31, 25, 33, 27, 24, 14, 26, 31
1 4 6
2 4 5 6 7
3 1 1 3
Strip graph Represents frequencies asa proportion of a rectangular strip. Forexample:
Subset Set A is a subset of set B(written A ⊃B) if all the members of Aare members of B.
Supplementary angles Two angleswhose measures add to 180o. One iscalled the supplement of the other.
Surface area The total outside area ofthe boundary of a solid.
Sum The result of adding two or morenumbers.
Syllogism A group of three statements:
1 A general statement2 A particular statement3 A conclusion.
Symmetrical shape A shape issymmetrical if it has line symmetry orrotational symmetry, that is, if it can bereflected or rotated onto itself.
Système Internationale d’Unites (SI)A system of measuring units based onpowers of 10 with basic units metre,kilogram, and seconds.
Tally chart A table with three columnsheaded “outcomes”, “tally”, and“frequency”. For example:
Term A member of a sequence orexpression.
Tessellation A pattern of congruentshapes which cover a plane surface.
Tetrahedron A polyhedron with fourtriangular faces.
of cars which may cross a bridge in thenext hour, or the numbers which couldreplace the letter(s) (or pronumeral(s))in an algebraic expression.
Vector An ordered set of numbers thatcan be used to describe a translation, forexample, ( 3
4 ).
Velocity Speed in a particular direction.
Venn diagram A diagram used toshow sets.
Vertex (vertices) A point where twoor more rays or line segments meet. Acorner point for a polygon orpolyhedron.
Vertical line A line through the centreof the earth.
Vertically opposite angles Twoangles on opposite sides of the vertexformed by 2 lines.
Thus A and B or C and D are verticallyopposite.
Volume The amount of space occupiedby an object. Volume is measured incubic units.
Weight The measure of the heavinessof an object. (The word weight is oftenused, imprecisely, instead of mass.)
Whole number A number from the set{0, 1, 2, 3, ...}.
X-Axis The horizontal axis on a graph.
Y-Axis The vertical axis on a graph.
Zero The number 0 (nought).
Total value of a digit The product ofthe place and face values, for example,5 in 54 has total value fifty.
Translation The action of moving afigure so that all its points move thesame distance in the same direction.
Transversal A line that intersects two(or more) other lines.
Trapezium A quadrilateral with a pairof parallel sides. (Trapezia: two or moreof these.)
Tree Diagram A diagram whichsystematically represents all outcomesfor a sequence of events. For example,if Ioane has 3 shirts and 2 pairs ofshorts, the choice of outfits is:
Triangle A polygon with three sides.
Truncate Having the vertex (of a coneor pyramid) cut off by a plane surface(usually parallel to the base).
Two-by-two array A table offrequencies for data classified accordingto two factors each with two possibleoutcomes. For example:
All values are listed in order.
Union The union of two sets A and B(written A ∪ B) is the set of all membersof A or B or both.
Unit A particular quantity used as astandard of measurement.
Unit cost The cost of one unit of aparticular item.
Universal set The set of all objects inthe discussion.
Variables Quantities which can takemany values, for example, the number
Outcomes Tally Frequency
Shoes I I I 3
Sandals I I I I I 6
Gumboots I I 2
Running shoes I I I I I I I 8
Gre
en s
hirt
Red shirt
White shorts
Blue shorts
White shorts
Blue shorts
Blue shirt
White shorts
Blue shorts
Fair hair Dark hair
Left handed
Right handed
1 2
3 9
AD
BC

1
Mathematics in the
New Zealand
Curriculum
Languageand
Languages
Mathematics
Science
Technology
Health and Physical Well-being
The Arts Social Sciences
Introductory Notes
Mathematics in the New Zealand Curriculum was pub-lished and released to schools in 1992. From 1995, math-ematics programmes at all levels except form 7 must in-clude the achievement objectives specified in the docu-ment. Mathematics in the New Zealand Curriculum willapply to all classes in mathematics from February 1996.
Since Mathematics in the New Zealand Curriculum waspublished there have been significant further develop-ments which need to be taken account of in the math-ematics education of senior students.
In light of these factors the Ministry of Education agreedto form a small working party to consider all of the abovefactors, and to draft an addendum to the national cur-riculum statement.
The working party also considered the need for schoolsto prepare students for a variety of unit standards lead-ing to qualifications, other than pre-university require-ments.
The working party recommended that a number of sup-plementary achievement objectives be added to Math-ematics in the New Zealand Curriculum. These werepublished earlier this year in the form of a draft adden-dum and distributed to secondary schools, relevant ter-tiary institutions, and other interested persons for re-sponse.
Responses to the draft addendum indicated a high levelof support for the inclusion of the achievement objec-tives listed. They also gave a number of suggestions forimproved wording which have generally been incorpo-rated. There was no call for significant change to thespirit and intention of the achievement objects.
Accordingly the achievement objectives, suggested learn-ing experiences, sample assessment activities, and de-velopment band material listed below should now beread in conjunction with and become part of the nationalcurriculum statement Mathematics in the New ZealandCurriculum.
The objectives are in three strands.
The Geometry StrandTwo achievement objectives are added covering the useof networks in critical path analysis. In Mathematics inthe New Zealand Curriculum, networks are introducedat level 7, but this topic was not followed up at level 8.Research pointed to the need for this to be included.
A further achievement objective extends the co-ordinategeometry of level 7 to three dimensions. This continuesthe earlier emphasis on three-dimensional geometry.
The Algebra StrandOne new achievement objective and associated learn-ing experiences relating to recurrence relations has beenadded.
Learning experiences and assessment examples to ex-pand the scope of applications of the other algebraachievement objectives already in Mathematics in theNew Zealand Curriculum are included.
The Statistics StrandThe additions reflect developments in the use of statis-tics in practice, particularly developments influenced byrecent advances in spreadsheet software, statistical soft-ware, and the data-graphic features of other data-han-dling software. The new achievement objectives covergreater use of exploratory data analysis techniques, moreon statistical aspects of experimental design, time-seriesinvestigations, and investigations using pairs of variables.
It is stressed that these additions do not require schoolsto amend programmes and do not imply additions tothe Bursary prescriptions. National Qualification unitstandards will be developed for all the objectives in theMathematics in the New Zealand Curriculum nationalcurriculum statement. Schools which wish to offercourses based on them may expect that qualificationscredits will be available for successful students.
ADDENDUM TO LEVEL 8

2
Additions to pages 124 to 127
Geometry Level 8Earlier levels in Mathematics in the New Zealand Curriculum place some emphasis ongeometry in three dimensions. The objective below is designed to build on the co-ordinategeometry introduced at level 7 and use it to continue that emphasis.
Achievement ObjectiveUsing co-ordinate geometry to explore shape and space
Within a range of meaningful contexts, students should be able to:
• describe and interpret points, directions, lengths, and planes in space using three-dimensional Cartesian co-ordinates.
Suggested Learning ExperiencesUsing co-ordinate geometry to explore shape and space
Students should be:
• using concrete models for plotting points and naming co-ordinates;
• using right-angled triangles in three dimensions and exploring ways of finding thedistance between two points;
• plotting sets of points which satisfy a linear equation in three variables and verifying thatthe points lie on a plane.
Sample Assessment Activity
This assessment activity is an example of the kind of task which teachers could devise for theirown assessment programme.
• Students investigate the values of variables that satisfy conditions of the type, x < a, y < b,z < c, and a general condition involving all three variables. This could be within thecontext of a linear programming problem, a physical problem in space, or some otherapplication.
Using this example, teachers could assess students’ ability to:
- describe and interpret points, directions, lengths, and planes in space using three-dimensional Cartesian co-ordinates (G8);
- interpret information and results in context (MP8).
Sample Development Band Activities
• Students explore matrix transformations of the unit cube, using appropriate technology,as extensions of two-dimensional transformations.
• Students investigate the variety of shapes formed when a slice is made through a cube, orthe variety of solids formed when similar pieces are removed from the corners of a cube.

3
The following achievement objectives allow the study of networks, started in level 7, to becontinued.
Achievement ObjectivesExploring networks
Within a range of meaningful contexts, students should be able to:
• construct, use, and interpret network diagrams and find solutions to schedulingproblems using the critical path algorithm;
• allocate resources using time charts.
Suggested Learning ExperiencesExploring networks
Students should be:
• constructing simple network diagrams (for example, for scheduling a construction projector replacing an organisation's computer network);
• investigating scheduling problems and network diagrams, including finding critical paths,and using the appropriate language (node, event, precedence dummy, critical path, slack(float) time, updating, time chart);
• using computer software to explore networks.
Sample Assessment Activity
This assessment activity is an example of the kind of task which teachers could devise for theirown assessment programme.
• Students could construct a project network for the organisation of the exhibition describedbelow which would include earliest and latest times of events and all listed tasks.
An exhibition of precious artefacts is going from the Auckland City Art Gallery to a Sydneymuseum. The Australian Government takes responsibility for the artefacts from the closureof the Auckland exhibition to the closing of the Sydney exhibition. Students list the tasks tobe performed and the time required for each. For example:
photographs taken for insurance and publicity purposes; insurance inspection;insurance policy issued; closing ceremony; packing; arrange contract for security fromclosing in Auckland to arrival in Sydney; contract security for Sydney; transport toSydney; unpack and set up; advertising; compile souvenir booklet; print souvenirbooklet.
The project plan could be required to include: the critical path and duration of the project;an example of a dummy in a network and an explanation of its purpose; the effects on theproject time and critical path caused by delays (such as a strike lasting four days, thebooklet taking three extra days to produce).
Using this example, teachers could assess students’ ability to:
- construct, use, and interpret network diagrams, and find solutions to scheduling problemsusing the critical path algorithm (G8);
- allocate resources using time charts (G8);
- devise and use problem-solving strategies to explore situations mathematically (MP8);
- interpret information and results in context (MP8);
- report the results of mathematical explorations concisely and coherently (MP8).

4
Sample Development Band Activities
• Students consider projects (such as building a bridge) where it is possible, by usingmore resources, to contract the duration of the tasks, assuming a linear relationshipbetween cost and duration. They try to minimise the cost of reducing the duration.They recalculate the minimum time in which the project can be completed, and find theminimum cost for completion in that time.
• Students use networks to begin discussion of “if . . . then” relationships and constructtruth tables for implication.
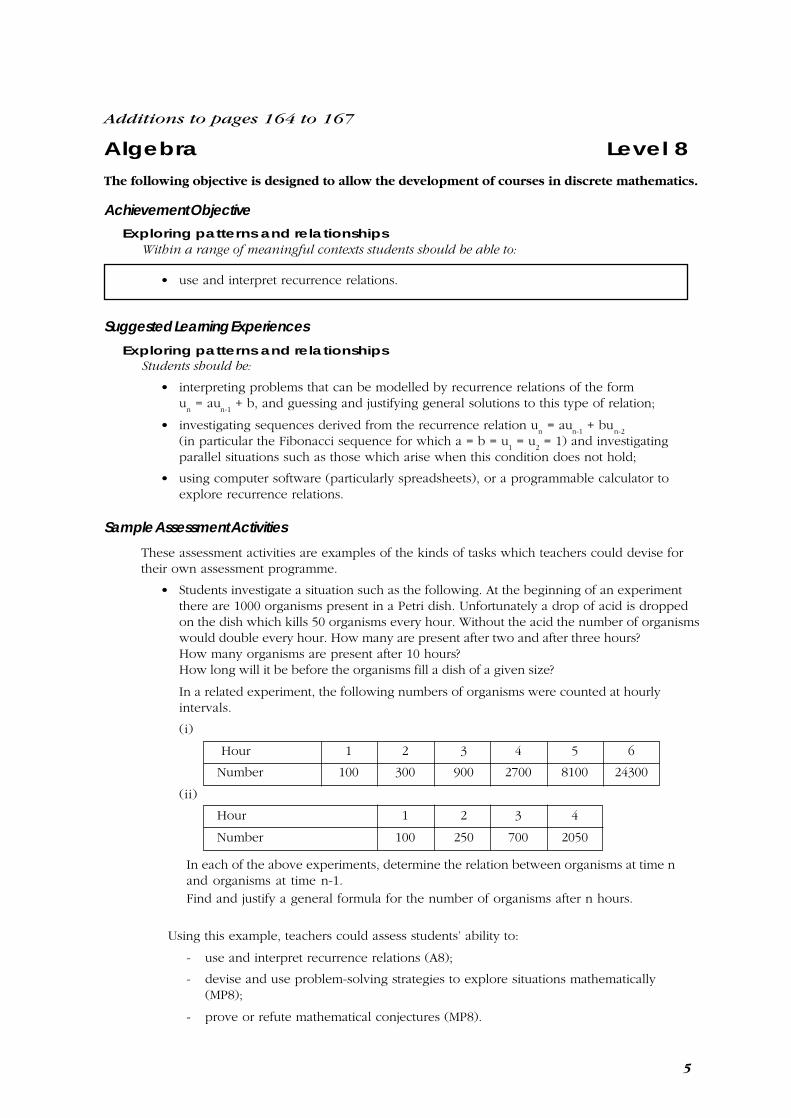
5
Algebra Level 8
Achievement ObjectiveExploring patterns and relationships
Within a range of meaningful contexts students should be able to:
• use and interpret recurrence relations.
Suggested Learning ExperiencesExploring patterns and relationships
Students should be:
• interpreting problems that can be modelled by recurrence relations of the formu
n = au
n-1 + b, and guessing and justifying general solutions to this type of relation;
• investigating sequences derived from the recurrence relation un = au
n-1 + bu
n-2
(in particular the Fibonacci sequence for which a = b = u1 = u
2 = 1) and investigating
parallel situations such as those which arise when this condition does not hold;
• using computer software (particularly spreadsheets), or a programmable calculator toexplore recurrence relations.
Sample Assessment Activities
These assessment activities are examples of the kinds of tasks which teachers could devise fortheir own assessment programme.
• Students investigate a situation such as the following. At the beginning of an experimentthere are 1000 organisms present in a Petri dish. Unfortunately a drop of acid is droppedon the dish which kills 50 organisms every hour. Without the acid the number of organismswould double every hour. How many are present after two and after three hours?How many organisms are present after 10 hours?How long will it be before the organisms fill a dish of a given size?
In a related experiment, the following numbers of organisms were counted at hourlyintervals.
(i)
Hour 1 2 3 4 5 6
Number 100 300 900 2700 8100 24300
(ii)
Hour 1 2 3 4
Number 100 250 700 2050
Additions to pages 164 to 167
In each of the above experiments, determine the relation between organisms at time nand organisms at time n-1.Find and justify a general formula for the number of organisms after n hours.
Using this example, teachers could assess students’ ability to:
- use and interpret recurrence relations (A8);
- devise and use problem-solving strategies to explore situations mathematically(MP8);
- prove or refute mathematical conjectures (MP8).
The following objective is designed to allow the development of courses in discrete mathematics.
6
• Students generate the first 15 terms of the Fibonacci sequence.They then investigate the truth or otherwise of relationships such as the following:(F
n is u
n = u
n-1 + u
n-2 with u
1=u
2 = 1)
F2 + F
4 + F
6 + . . . + F
2n = F
2n+1 - 1
(This could be proved by say (i) expanding F2r using recurrence relations
or (ii) mathematical induction.)
F1 + F3 + F5 + . . . + F2n-1 = F2n
F1 + F
4 + F
7 + . . . . + F
3n-2 = (F
3n)/2
Using this example, teachers could assess students’ ability to:
- use and interpret recurrence relations (A8);
- devise and use problem-solving strategies to explore situations mathematically(MP8);
- prove or refute mathematical conjectures (MP8).
Note: These are the kinds of results that students should generate for themselves.However, one or two of them can be used as an introduction to the topic.
Sample Development Band Activity
• Students investigate the solution of recurrence relations.
7
The learning experiences below relate to fitting functions or algebraic models to data asapplications of the sixth objective on page 164 of Algebra in Mathematics in the NewZealand Curriculum. Work based on it could include the use of regression techniques fromthe statistics strand.
Suggested Learning ExperienceExploring patterns and relationships
Students should be:
• using graphs to explore existing data or data collected from experiments orinvestigations, investigating possible models to describe relationships, and developingmethods for confirming the most appropriate model. This could involve the use ofspreadsheets and/or other computer software.
Sample Assessment Activities
These assessment activities are examples of the kinds of tasks which teachers could devise fortheir own assessment programme.
• Students investigate a situation in which 150 red beans are mixed with 50 white beansand the mixture stirred. Twenty beans are removed and the red beans are replaced withwhite beans before returning them to the mixture. The process is repeated and a recordis kept of the number of red beans in the mixture at each stage. Students find therelation between the number of red beans and the number of replacements made.
Using this example, teachers could assess the students’ ability to:
- choose an appropriate model for real data, including the use of log-log and semi-logtechniques, and analyse and interpret the results (A8);
- find and use with justification, a mathematical model as a problem-solving strategy(MP8).
• Students find the relation between the time elapsed and the counter number on a taperecorder. They set the counter to zero at the beginning of the tape and record the counternumber at five minute intervals.
Using this example, teachers could assess students’ ability to:
- choose an appropriate model for real data, including the use of log-log and semi-logtechniques, and analyse and interpret the results (A8);
- use equipment appropriately when exploring mathematical ideas (MP8).
Sample Development Band Activity
• For a variety of sports records, students investigate the relationship between the recordand its date to make predictions about when future improvements may occur. They coulduse a statistics package to do linear regression on transformed data and plot residuals toconfirm the appropriateness of the model.

8
The Suggested Learning Experience below applies to the first two objectives of Exploringpatterns and relationships, in the Algebra strand, on page 164 of Mathematics in the NewZealand Curriculum. It is intended to indicate possible applications to financial calculationsthat can be made using computer packages or programmable calculators.
Suggested Learning Experience
Exploring patterns and relationshipsStudents should be:
• using calculators and spreadsheets to explore the changing value of money over time,calculating present and future values of a cash flow, investigating the most desirableinvestment option, and applying compound interest and simple ordinary annuitymodels.
Sample Assessment Activity
• Students investigate a situation in which a person wishes to invest money to pay forfuture needs. It is estimated that she will need $50,000 in about 10 years’ time. Preparea report which investigates different investment options.
Using this example, teachers could assess students’ ability to:
- use sequences and series to model real or simulated situations and interpret thefindings (A8);
- devise and use a mathematical model as a problem-solving technique (MP8).
9
Additions to pages 204 to 209
Statistics Level 8The achievement objectives added to this strand are designed to further development inthree areas:
• the statistical aspects of experimental design
• time series
• the investigation of relationships in pairs of variables.
Achievement ObjectivesStatistical investigations
Within a range of meaningful contexts, students should be able to:
• use principles of experimental design to design an experiment, identifying aspectswhich must be considered, and conduct the experiment;
• use statistical methods and principles to analyse and report on experiments;
• use graphs, moving averages, separation into smooth and rough (with awareness ofadditive and multiplicative models) to explore time series;
• use indexes to deflate financial time series and to find inflation rate series;
• investigate relationships between two-category variables, using contingency tables,graphs and tables of percentages;
• investigate relationships between two continuous variables using graphs and modelfitting methods including regression;
• use graphs and correlation co-efficients to assess the linearity of relationships anddiscuss the appropriateness of any regression line or correlation co-efficient.
Suggested Learning ExperiencesStatistical investigations
Students should be:
• discussing approaches to experimentation using the language and terminology ofexperimental design (response and explanatory variables, control, placebo, single blindand double blind, replicate, treatment and level of treatment, randomisation, factor),considering ethical issues involved in experimentation;
• planning experiments; deciding on the questions to be investigated; planning datacollection methods and undertaking pilot studies; exploring initial data through graphs;using the results of a pilot study to finalise the design of the experiment;
• summarising, presenting, and interpreting the results of an experiment using graphs,tables, and written descriptions (including discussing any assumptions that were madeand reflecting on the purposes of the experiment and the extent to which they weremet);
• graphing time series and describing their features;
• investigating the use of commonly used index numbers (for example, the CPI, the SEForty, indices related to weather patterns such as the Southern Oscillation);

10
• discussing time-series data and using the appropriate language:
- index, base, inflation, rate, price relative, weighted mean;
- components of time series (smooth and rough, trend, cycles, seasonal effect,remainder), moving average, forecasts;
• constructing, using, and interpreting contingency tables from data-sets involvingcategory variables;
• using scatter plots, and scatter plots with regression lines and other models drawn in tofind the features of a relationship;
• using graphs to assess the appropriateness of linear regression and correlation;
• using software to calculate least squares regression equations and making predictionsfrom them;
• exploring the meaning of a correlation co-efficient using graphs, for example, thestrength of the relationship between people's golf handicaps and the length of time thegame has been played by those people;
• discussing the connection between correlation and causality.
Sample Assessment Activities
These assessment activities are examples of the kinds of tasks which teachers could devise fortheir own assessment programme.
• Students write a report to analyse and evaluate aspects of the methodology of a publishedstatistical experiment.
Using this example, teachers could assess students’ ability to:
- use statistical methods and principles to analyse and report on experiments (S8);
- report the results of mathematical explorations concisely and coherently (MP8).
• Students design and report on an experiment to determine if drinking a cup of coffeeincreases the pulse rate. This could involve prior research into how long it takes the coffeeto affect the system. Factors could include milk, sugar, temperature, gender, priorconsumption of coffee, age, or level of activity during the experiment. The need forcontrols should be considered, including the use of placebos (such as decaf). Ethicalissues such as consent, confidentiality, and effects on the subject could be discussed.
Using this example, teachers could assess students’ ability to:
- use principles of experimental design to design an experiment, identifying aspectswhich must be considered, and conduct the experiment (S8);
- report the results of mathematical explorations concisely and coherently (MP8).
• Students obtain data relating to the gender and smoking habits of persons over 20(whether or not the persons themselves classify themselves as smokers). They investigatewhether there is evidence that smoking and gender are related.
Using this example, teachers could assess students’ ability to:
- investigate relationships between two-category variables using contingency tables,graphs and tables of percentages (S8);
- use tables of multi-variate data from social contexts to find the probabilities ofeveryday events or the proportion of outcomes in a given category (S6);
- make conjectures in a mathematical context (MP8);
- confirm or refute mathematical conjectures (MP8).
11
• Students study the typical price of petrol over (say) a ten year period and construct aprice index series for petrol over this period. They decide if petrol is relatively better valuefor money at the end of the period compared with the beginning.
Using this example, teachers could assess students’ ability to:
- use graphs, moving averages, separation into smooth and rough (with awareness ofadditive and multiplicative models) to explore time series (S8);
- report the results of mathematical explorations concisely and coherently (MP8).
• Students use bivariate data, such as life expectancy and the number of doctors per capitafor different countries, to calculate the correlation co-efficient between the variables anddiscuss relationships within the data.
Using this example, teachers could assess students’ ability to:
- use graphs and correlation co-efficients to assess the linearity of relationships anddiscuss the appropriateness of any regression line or correlation co-efficient (S8).
Sample Development Band Activity
• Students investigate Simpson’s Paradox, that is, the reversal of the direction of acomparison or association when data from several groups are combined to form asingle group.
This addendum published for the Ministry of Education byLearning Media Limited, Box 3293, Wellington, New Zealand.
© Crown copyright 1995All rights reserved. Enquiries should be made to the publisher.
Dewey number 510ISBN 0 478 02847 4Item number 02847