Embed Size (px)
Citation preview

ADVANCED GCE
MATHEMATICS (MEI) 4767Statistics 2
QUESTION PAPER
Candidates answer on the printed answer book.
OCR supplied materials:
• Printed answer book 4767• MEI Examination Formulae and Tables (MF2)
Other materials required:
• Scientific or graphical calculator
Monday 24 January 2011
Morning
Duration: 1 hour 30 minutes
INSTRUCTIONS TO CANDIDATES
These instructions are the same on the printed answer book and the question paper.
• The question paper will be found in the centre of the printed answer book.
• Write your name, centre number and candidate number in the spaces provided on the printedanswer book. Please write clearly and in capital letters.
• Write your answer to each question in the space provided in the printed answer book.Additional paper may be used if necessary but you must clearly show your candidate number,
centre number and question number(s).
• Use black ink. Pencil may be used for graphs and diagrams only.• Read each question carefully. Make sure you know what you have to do before starting your
answer.
• Answer all the questions.• Do not write in the bar codes.
• You are permitted to use a scientific or graphical calculator in this paper.• Final answers should be given to a degree of accuracy appropriate to the context.
INFORMATION FOR CANDIDATES
This information is the same on the printed answer book and the question paper.
• The number of marks is given in brackets [ ] at the end of each question or part question on the
question paper.• You are advised that an answer may receive no marks unless you show sufficient detail of the
working to indicate that a correct method is being used.
• The total number of marks for this paper is 72.• The printed answer book consists of 12 pages. The question paper consists of 4 pages. Any blank
pages are indicated.
INSTRUCTION TO EXAMS OFFICER / INVIGILATOR
• Do not send this question paper for marking; it should be retained in the centre or destroyed.
© OCR 2011 [L/102/2657] OCR is an exempt Charity
2R–0E12 Turn over

2
1 The scatter diagram below shows the birth rates x, and death rates y, measured in standard units, in a
random sample of 14 countries in a particular year. Summary statistics for the data are as follows.
Σ x = 139.8 Σ y = 140.4 Σ x2 = 1411.66 Σ y2 = 1417.88 Σ xy = 1398.56 n = 14
y
x0 7 8 9 10 11 12 13
0
7
8
9
10
11
12
13
(i) Calculate the sample product moment correlation coefficient. [5]
(ii) Carry out a hypothesis test at the 5% significance level to determine whether there is any
correlation between birth rates and death rates. [6]
(iii) State the distributional assumption which is necessary for this test to be valid. Explain briefly in
the light of the scatter diagram why it appears that the assumption may be valid. [2]
(iv) The values of x and y for another country in that year are 14.4 and 7.8 respectively. If these
values are included, the value of the sample product moment correlation coefficient is −0.5694.
Explain why this one observation causes such a large change to the value of the sample product
moment correlation coefficient. Discuss whether this brings the validity of the test into question.
[4]
© OCR 2011 4767 Jan11
3
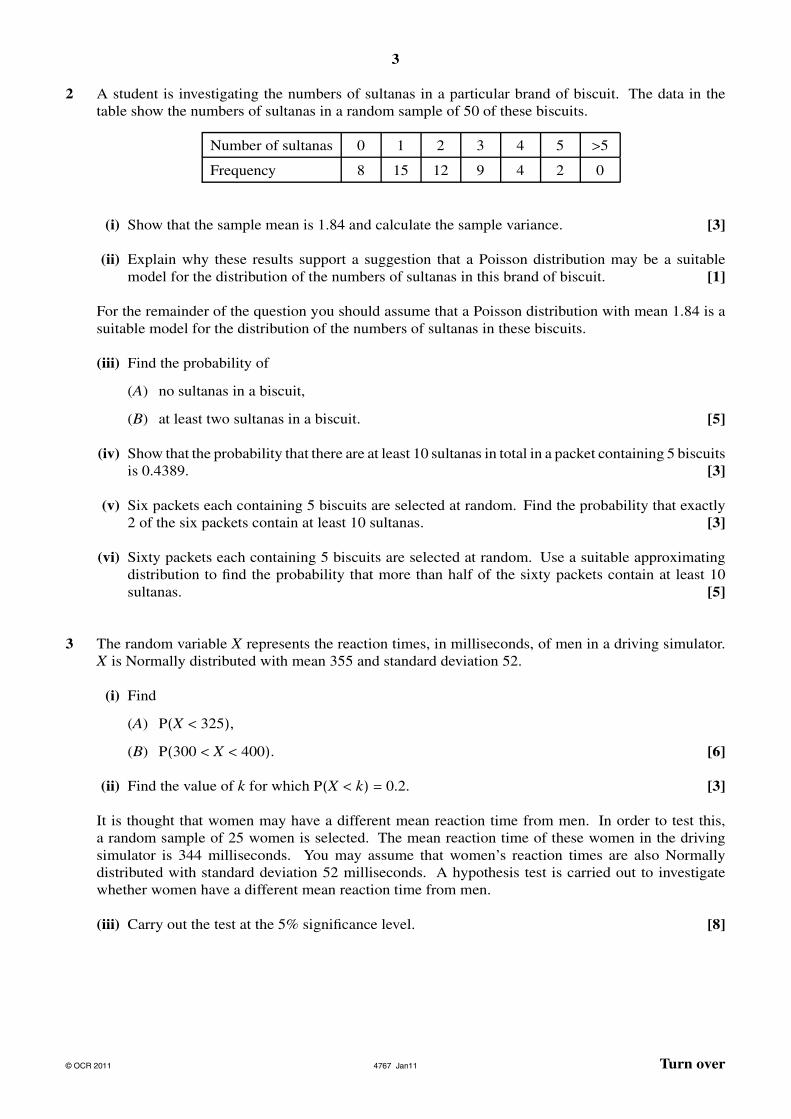
2 A student is investigating the numbers of sultanas in a particular brand of biscuit. The data in the
table show the numbers of sultanas in a random sample of 50 of these biscuits.
Number of sultanas 0 1 2 3 4 5 >5
Frequency 8 15 12 9 4 2 0
(i) Show that the sample mean is 1.84 and calculate the sample variance. [3]
(ii) Explain why these results support a suggestion that a Poisson distribution may be a suitable
model for the distribution of the numbers of sultanas in this brand of biscuit. [1]
For the remainder of the question you should assume that a Poisson distribution with mean 1.84 is a
suitable model for the distribution of the numbers of sultanas in these biscuits.
(iii) Find the probability of
(A) no sultanas in a biscuit,
(B) at least two sultanas in a biscuit. [5]
(iv) Show that the probability that there are at least 10 sultanas in total in a packet containing 5 biscuits
is 0.4389. [3]
(v) Six packets each containing 5 biscuits are selected at random. Find the probability that exactly
2 of the six packets contain at least 10 sultanas. [3]
(vi) Sixty packets each containing 5 biscuits are selected at random. Use a suitable approximating
distribution to find the probability that more than half of the sixty packets contain at least 10
sultanas. [5]
3 The random variable X represents the reaction times, in milliseconds, of men in a driving simulator.
X is Normally distributed with mean 355 and standard deviation 52.
(i) Find
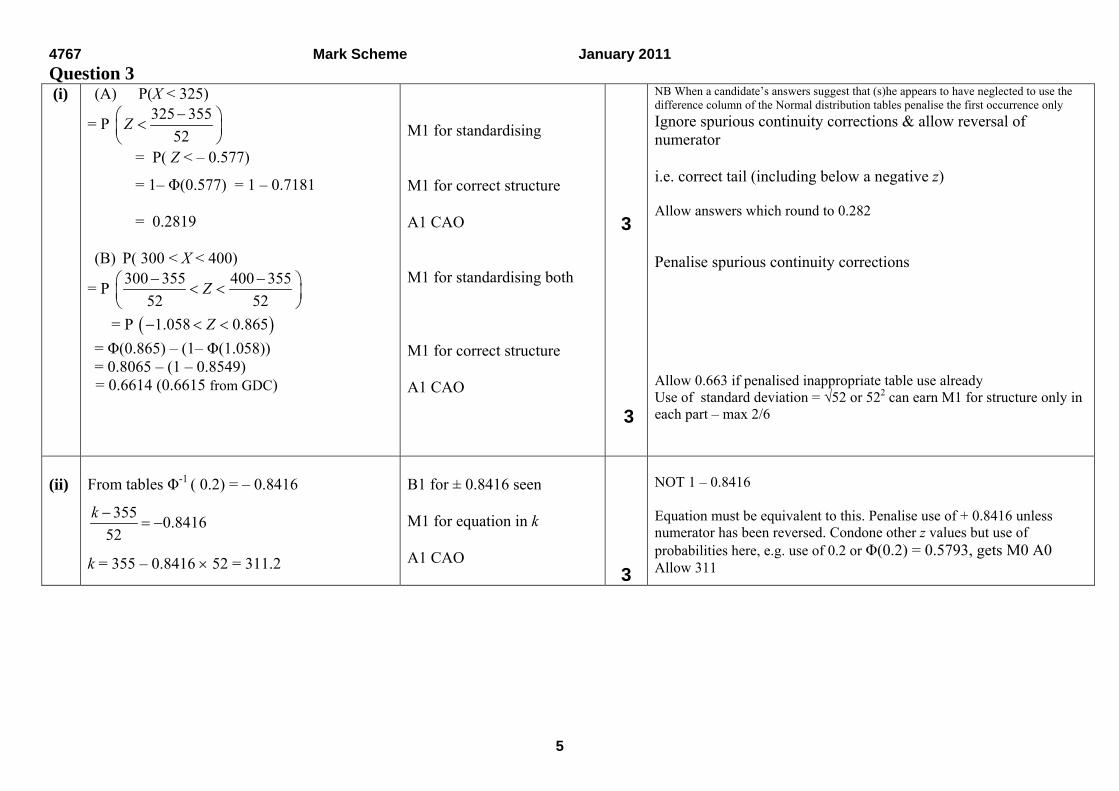
(A) P(X < 325),
(B) P(300 < X < 400). [6]
(ii) Find the value of k for which P(X < k) = 0.2. [3]
It is thought that women may have a different mean reaction time from men. In order to test this,
a random sample of 25 women is selected. The mean reaction time of these women in the driving
simulator is 344 milliseconds. You may assume that women’s reaction times are also Normally
distributed with standard deviation 52 milliseconds. A hypothesis test is carried out to investigate
whether women have a different mean reaction time from men.
(iii) Carry out the test at the 5% significance level. [8]
© OCR 2011 4767 Jan11 Turn over

4
4 A researcher is investigating the sizes of pebbles at various locations in a river. Three sites in the river
are chosen and each pebble sampled at each site is classified as large, medium or small. The results
are as follows.
Site Row
A B C totals
Large 15 12 10 37
PebbleMedium 28 17 45 90size
Small 47 33 36 116
Column totals 90 62 91 243
(i) Carry out a test at the 5% significance level to examine whether there is any association between
pebble size and site. Your working should include a table of the contributions of each cell to the
test statistic. [12]
(ii) By referring to each site, comment briefly on how the size of the pebbles compares with what
would be expected if there were no association. You should support your answers by referring
to your table of contributions. [6]
Copyright Information
OCR is committed to seeking permission to reproduce all third-party content that it uses in its assessment materials. OCR has attempted to identify and contact all copyright holders
whose work is used in this paper. To avoid the issue of disclosure of answer-related information to candidates, all copyright acknowledgements are reproduced in the OCR Copyright
Acknowledgements Booklet. This is produced for each series of examinations and is freely available to download from our public website (www.ocr.org.uk) after the live examination series.
If OCR has unwittingly failed to correctly acknowledge or clear any third-party content in this assessment material, OCR will be happy to correct its mistake at the earliest possible opportunity.
For queries or further information please contact the Copyright Team, First Floor, 9 Hills Road, Cambridge CB2 1GE.
OCR is part of the Cambridge Assessment Group; Cambridge Assessment is the brand name of University of Cambridge Local Examinations Syndicate (UCLES), which is itself a department
of the University of Cambridge.
© OCR 2011 4767 Jan11

ADVANCED GCE
MATHEMATICS (MEI) 4767Statistics 2
PRINTED ANSWER BOOK
Candidates answer on this printed answer book.
OCR supplied materials:
• Question paper 4767 (inserted)• MEI Examination Formulae and Tables (MF2)
Other materials required:
• Scientific or graphical calculator
Monday 24 January 2011
Morning
Duration: 1 hour 30 minutes
**
44
77
66
77
**
Candidateforename
Candidatesurname
Centre number Candidate number
INSTRUCTIONS TO CANDIDATES
These instructions are the same on the printed answer book and the question paper.
• The question paper will be found in the centre of the printed answer book.
• Write your name, centre number and candidate number in the spaces provided on the printedanswer book. Please write clearly and in capital letters.
• Write your answer to each question in the space provided in the printed answer book.Additional paper may be used if necessary but you must clearly show your candidate number,
centre number and question number(s).
• Use black ink. Pencil may be used for graphs and diagrams only.• Read each question carefully. Make sure you know what you have to do before starting your
answer.
• Answer all the questions.• Do not write in the bar codes.
• You are permitted to use a scientific or graphical calculator in this paper.• Final answers should be given to a degree of accuracy appropriate to the context.
INFORMATION FOR CANDIDATES
This information is the same on the printed answer book and the question paper.
• The number of marks is given in brackets [ ] at the end of each question or part question on the
question paper.• You are advised that an answer may receive no marks unless you show sufficient detail of the
working to indicate that a correct method is being used.
• The total number of marks for this paper is 72.• The printed answer book consists of 12 pages. The question paper consists of 4 pages. Any blank
pages are indicated.
© OCR 2011 [L/102/2657] OCR is an exempt Charity
2R–0E12 Turn over

2
1 (i)
© OCR 2011

3
1 (ii)
1 (iii)
© OCR 2011 Turn over

4
1 (iv)
© OCR 2011

5
2 (i)
2 (ii)
© OCR 2011 Turn over

6
2(iii)(A)
2(iii)(B)
2 (iv)
© OCR 2011

7
2 (v)
2 (vi)
© OCR 2011 Turn over

8
3 (i) (A)
3 (i) (B)
3 (ii)
© OCR 2011

9
3 (iii)
© OCR 2011 Turn over

10
4 (i)
© OCR 2011

11
4 (i) (continued)
4 (ii)
© OCR 2011 Turn over

12
4 (ii) (continued)
Copyright Information
OCR is committed to seeking permission to reproduce all third-party content that it uses in its assessment materials. OCR has attempted to identify and contact all copyright holders
whose work is used in this paper. To avoid the issue of disclosure of answer-related information to candidates, all copyright acknowledgements are reproduced in the OCR Copyright
Acknowledgements Booklet. This is produced for each series of examinations and is freely available to download from our public website (www.ocr.org.uk) after the live examination series.
If OCR has unwittingly failed to correctly acknowledge or clear any third-party content in this assessment material, OCR will be happy to correct its mistake at the earliest possible
opportunity.
For queries or further information please contact the Copyright Team, First Floor, 9 Hills Road, Cambridge CB2 1GE.
OCR is part of the Cambridge Assessment Group; Cambridge Assessment is the brand name of University of Cambridge Local Examinations Syndicate (UCLES), which is itself a
department of the University of Cambridge.
© OCR 2011

GCE
Oxford Cambridge and RSA Examinations
Advanced GCE
Unit 4767: Statistics 2
Mathematics (MEI)
Mark Scheme for January 2011

OCR (Oxford Cambridge and RSA) is a leading UK awarding body, providing a wide range of qualifications to meet the needs of pupils of all ages and abilities. OCR qualifications include AS/A Levels, Diplomas, GCSEs, OCR Nationals, Functional Skills, Key Skills, Entry Level qualifications, NVQs and vocational qualifications in areas such as IT, business, languages, teaching/training, administration and secretarial skills. It is also responsible for developing new specifications to meet national requirements and the needs of students and teachers. OCR is a not-for-profit organisation; any surplus made is invested back into the establishment to help towards the development of qualifications and support which keep pace with the changing needs of today’s society. This mark scheme is published as an aid to teachers and students, to indicate the requirements of the examination. It shows the basis on which marks were awarded by Examiners. It does not indicate the details of the discussions which took place at an Examiners’ meeting before marking commenced. All Examiners are instructed that alternative correct answers and unexpected approaches in candidates’ scripts must be given marks that fairly reflect the relevant knowledge and skills demonstrated. Mark schemes should be read in conjunction with the published question papers and the Report on the Examination. OCR will not enter into any discussion or correspondence in connection with this mark scheme. © OCR 2011 Any enquiries about publications should be addressed to: OCR Publications PO Box 5050 Annesley NOTTINGHAM NG15 0DL Telephone: 0870 770 6622 Facsimile: 01223 552610 E-mail: [email protected]

4767 Mark Scheme January 2011
Marking instructions for GCE Mathematics (MEI): Statistics strand 1. You are advised to work through the paper yourself first. Ensure you familiarise yourself with
the mark scheme before you tackle the practice scripts.
2. You will be required to mark ten practice scripts. This will help you to understand the mark scheme and will not be used to assess the quality of your marking. Mark the scripts yourself first, using the annotations. Turn on the comments box and make sure you understand the comments. You must also look at the definitive marks to check your marking. If you are unsure why the marks for the practice scripts have been awarded in the way they have, please contact your Team Leader.
3. When you are confident with the mark scheme, mark the ten standardisation scripts. Your Team Leader will give you feedback on these scripts and approve you for marking. (If your marking is not of an acceptable standard your Team Leader will give you advice and you will be required to do further work. You will only be approved for marking if your Team Leader is confident that you will be able to mark candidate scripts to an acceptable standard.)
4. Mark strictly to the mark scheme. If in doubt, consult your Team Leader using the messaging system within scoris, by email or by telephone. Your Team Leader will be monitoring your marking and giving you feedback throughout the marking period. An element of professional judgement is required in the marking of any written paper. Remember that the mark scheme is designed to assist in marking incorrect solutions. Correct solutions leading to correct answers are awarded full marks but work must not be judged on the answer alone, and answers that are given in the question, especially, must be validly obtained; key steps in the working must always be looked at and anything unfamiliar must be investigated thoroughly. Correct but unfamiliar or unexpected methods are often signalled by a correct result following an apparently incorrect method. Such work must be carefully assessed. When a candidate adopts a method which does not correspond to the mark scheme, award marks according to the spirit of the basic scheme; if you are in any doubt whatsoever (especially if several marks or candidates are involved) you should contact your Team Leader.
5. The following types of marks are available. M A suitable method has been selected and applied in a manner which shows that the method is essentially understood. Method marks are not usually lost for numerical errors, algebraic slips or errors in units. However, it is not usually sufficient for a candidate just to indicate an intention of using some method or just to quote a formula; the formula or idea must be applied to the specific problem in hand, eg by substituting the relevant quantities into the formula. In some cases the nature of the errors allowed for the award of an M mark may be specified. A Accuracy mark, awarded for a correct answer or intermediate step correctly obtained. Accuracy marks cannot be given unless the associated Method mark is earned (or implied). Therefore M0 A1 cannot ever be awarded. B Mark for a correct result or statement independent of Method marks.
1

4767 Mark Scheme January 2011
E A given result is to be established or a result has to be explained. This usually requires more working or explanation than the establishment of an unknown result. Unless otherwise indicated, marks once gained cannot subsequently be lost, eg wrong working following a correct form of answer is ignored. Sometimes this is reinforced in the mark scheme by the abbreviation isw. However, this would not apply to a case where a candidate passes through the correct answer as part of a wrong argument.
6. When a part of a question has two or more ‘method’ steps, the M marks are in principle independent unless the scheme specifically says otherwise; and similarly where there are several B marks allocated. (The notation ‘dep *’ is used to indicate that a particular mark is dependent on an earlier, asterisked, mark in the scheme.) Of course, in practice it may happen that when a candidate has once gone wrong in a part of a question, the work from there on is worthless so that no more marks can sensibly be given. On the other hand, when two or more steps are successfully run together by the candidate, the earlier marks are implied and full credit must be given.
7. The abbreviation ft implies that the A or B mark indicated is allowed for work correctly following on from previously incorrect results. Otherwise, A and B marks are given for correct work only — differences in notation are of course permitted. A (accuracy) marks are not given for answers obtained from incorrect working. When A or B marks are awarded for work at an intermediate stage of a solution, there may be various alternatives that are equally acceptable. In such cases, exactly what is acceptable will be detailed in the mark scheme rationale. If this is not the case please consult your Team Leader. Sometimes the answer to one part of a question is used in a later part of the same question. In this case, A marks will often be ‘follow through’. In such cases you must ensure that you refer back to the answer of the previous part question even if this is not shown within the image zone. You may find it easier to mark follow through questions candidate-by-candidate rather than question-by-question.
8. Wrong or missing units in an answer should not lead to the loss of a mark unless the scheme specifically indicates otherwise. Candidates are expected to give numerical answers to an appropriate degree of accuracy. 3 significant figures may often be the norm for this, but this always needs to be considered in the context of the problem in hand. For example, in quoting probabilities from Normal tables, we generally expect some evidence of interpolation and so quotation to 4 decimal places will often be appropriate. But even this does not always apply – quotations of the standard critical points for significance tests such as 1.96, 1.645, 2.576 (maybe even 2.58 – but not 2.57) will commonly suffice, especially if the calculated value of a test statistic is nowhere near any of these values. Sensible discretion must be exercised in such cases. Discretion must also be exercised in the case of small variations in the degree of accuracy to which an answer is given. For example, if 3 significant figures are expected (either because of an explicit instruction or because the general context of a problem demands it) but only 2 are given, loss of an accuracy ("A") mark is likely to be appropriate; but if 4 significant figures are given, this should not normally be penalised. Likewise, answers which are slightly deviant from what is expected in a very minor manner (for example a Normal probability given, after an attempt at interpolation, as 0.6418 whereas 0.6417 was expected) should not be penalised.
2

4767 Mark Scheme January 2011
However, answers which are grossly over- or under-specified should normally result in the loss of a mark. This includes cases such as, for example, insistence that the value of a test statistic is (say) 2.128888446667 merely because that is the value that happened to come off the candidate's calculator. Note that this applies to answers that are given as final stages of calculations; intermediate working should usually be carried out, and quoted, to a greater degree of accuracy to avoid the danger of premature approximation. The situation regarding any particular cases where the accuracy of the answer may be a marking issue should be detailed in the mark scheme rationale. If in doubt, contact your Team Leader.
9. Rules for crossed out and/or replaced work If work is crossed out and not replaced, examiners should mark the crossed out work if it is legible.
If a candidate attempts a question more than once, and indicates which attempt he/she wishes to be marked, then examiners should do as the candidate requests.
If two or more attempts are made at a question, and just one is not crossed out, examiners should ignore the crossed out work and mark the work that is not crossed out.
If there are two or more attempts at a question which have not been crossed out, examiners should mark what appears to be the last (complete) attempt and ignore the others. NB Follow these maths-specific instructions rather than those in the assessor handbook.
10. Genuine misreading (of numbers or symbols, occasionally even of text) occurs. If this results in the object and/or difficulty of the question being considerably changed, it is likely that all the marks for that question, or section of the question, will be lost. However, misreads are often such that the object and/or difficulty remain substantially unaltered; these cases are considered below. The simple rule is that all method ("M") marks [and of course all independent ("B") marks] remain accessible but at least some accuracy ("A") marks do not. It is difficult to legislate in an overall sense beyond this global statement because misreads, even when the object and/or difficulty remains unchanged, can vary greatly in their effects. For example, a misread of 1.02 as 10.2 (perhaps as a quoted value of a sample mean) may well be catastrophic; whereas a misread of 1.6748 as 1.6746 may have so slight an effect as to be almost unnoticeable in the candidate's work. A misread should normally attract some penalty, though this would often be only 1 mark and should rarely if ever be more than 2. Commonly in sections of questions where there is a numerical answer either at the end of the section or to be obtained and commented on (eg the value of a test statistic), this answer will have an "A" mark that may actually be designated as "cao" [correct answer only]. This should be interpreted strictly – if the misread has led to failure to obtain this value, then this "A" mark must be withheld even if all method marks have been earned. It will also often be the case that such a mark is implicitly "cao" even if not explicitly designated as such. On the other hand, we commonly allow "fresh starts" within a question or part of question. For example, a follow-through of the candidate's value of a test statistic is generally allowed (and
3

4767 Mark Scheme January 2011
4
often explicitly stated as such within the marking scheme), so that the candidate may exhibit knowledge of how to compare it with a critical value and draw conclusions. Such "fresh starts" are not affected by any earlier misreads. A misread may be of a symbol rather than a number – for example, an algebraic symbol in a mathematical expression. Such misreads are more likely to bring about a considerable change in the object and/or difficulty of the question; but, if they do not, they should be treated as far as possible in the same way as numerical misreads, mutatis mutandis. This also applied to misreads of text, which are fairly rare but can cause major problems in fair marking. The situation regarding any particular cases that arise while you are marking for which you feel you need detailed guidance should be discussed with your Team Leader. Note that a miscopy of the candidate’s own working is not a misread but an accuracy error.
11. Annotations should be used whenever appropriate during your marking. The A, M and B annotations must be used on your standardisation scripts for responses that are not awarded either 0 or full marks. It is vital that you annotate standardisation scripts fully to show how the marks have been awarded. For subsequent marking you must make it clear how you have arrived at the mark you have awarded.
12. For answers scoring no marks, you must either award NR (no response) or 0, as follows:
Award NR (no response) if: Nothing is written at all in the answer space There is a comment which does not in any way relate to the question being asked (“can’t
do”, “don’t know”, etc.) There is any sort of mark that is not an attempt at the question (a dash, a question mark,
etc.) The hash key [#] on your keyboard will enter NR. Award 0 if: There is an attempt that earns no credit. This could, for example, include the candidate
copying all or some of the question, or any working that does not earn any marks, whether crossed out or not.
13. The following abbreviations may be used in this mark scheme.
M1 method mark (M2, etc, is also used) A1 accuracy mark B1 independent mark E1 mark for explaining U1 mark for correct units G1 mark for a correct feature on a graph M1 dep* method mark dependent on a previous mark, indicated by * cao correct answer only ft follow through isw ignore subsequent working

4767 Mark Scheme January 2011
5
oe or equivalent rot rounded or truncated sc special case soi seen or implied www without wrong working
14. Annotating scripts. The following annotations are available:
and BOD Benefit of doubt FT Follow through ISW Ignore subsequent working (after correct answer obtained) M0, M1 Method mark awarded 0, 1 A0, A1 Accuracy mark awarded 0, 1 B0, B1 Independent mark awarded 0,1 SC Special case ^ Omission sign MR Misread Highlighting is also available to highlight any particular points on a script.
15. The comments box will be used by the Principal Examiner to explain his or her marking of the practice scripts for your information. Please refer to these comments when checking your practice scripts. Please do not type in the comments box yourself. Any questions or comments you have for your Team Leader should be communicated by the scoris messaging system, e-mail or by telephone.
16. Write a brief report on the performance of the candidates. Your Team Leader will tell you when this is required. The Assistant Examiner’s Report Form (AERF) can be found on the Cambridge Assessment Support Portal. This should contain notes on particular strengths displayed, as well as common errors or weaknesses. Constructive criticisms of the question paper/mark scheme are also appreciated.
17. Link Additional Objects with work relating to a question to those questions (a chain link appears by the relevant question number) – see scoris assessor Quick Reference Guide page 19-20 for instructions as to how to do this – this guide is on the Cambridge Assessment Support Portal and new users may like to download it with a shortcut on your desktop so you can open it easily! For AOs containing just formulae or rough working not attributed to a question, tick at the top to indicate seen but not linked. When you submit the script, scoris asks you to confirm that you have looked at all the additional objects. Please ensure that you have checked all Additional Objects thoroughly.
18. The schedule of dates for the marking of this paper is displayed under ‘OCR Subject Specific Details’ on the Cambridge Assessment Support Portal. It is vitally important that you meet these requirements. If you experience problems that mean you may not be able to meet the deadline then you must contact your Team Leader without delay.

4767 Mark Scheme January 2011
1
Question 1
(i) EITHER:
Sxy = 1
xy x yn
= 1398.56 – 1
14 139.8 140.4
= –3.434
Sxx = 22 1x x
n = 1411.66 – 1
14 139.82 = 15.657
Syy = 22 1y y
n = 1417.88 – 1
14 140.42 = 9.869
r = S
S S
xy
xx yy
= -3.434
15.657 9.869
= –0.276 OR:
cov (x,y) = xy
x yn
= 1398.56/14 – 9.9857 10.0286
= –0.2454
rmsd(x) = xxS
n= √(15.657/14) =√1.1184 = 1.0575
rmsd(y) = yyS
n= √(9.869/14) =√0.7049 = 0.8396
r = cov(x,y)
( ) ( )rmsd x rmsd y =
-0.2454
1.0575 0.8396
= –0.276 NB: using only 3dp in calculating and x y leads to answer of 0.284 which is still in the acceptable range
M1 for method for Sxy
M1 for method for at least one of Sxx or Syy A1 for at least one of
Sxy, Sxx, Syy correct M1 for structure of r A1 (-0.27 to -0.28 to 2dp) M1 for method for cov (x,y)
M1 for method for at least one msd A1 for at least one of cov (x,y), msd(x), msd(y) correct M1 for structure of r A1 (-0.27 to -0.28 to 2dp)
5
If and x y used in rounded form, be generous with first A1 Structure of r needs to be fully correct in all parts – the first two M1
marks must have been earned and r = S
S S
xy
xx yy
applied.
If and x y used in rounded form, be generous with first A1 Structure of r needs to be fully correct in all parts – the first two M1
marks must have been earned and r = cov(x,y)
( ) ( )rmsd x rmsd y applied.

4767 Mark Scheme January 2011
2
(ii) H0: ρ = 0 H1: ρ 0 (two-tailed test) where ρ is the population correlation coefficient For n = 14, 5% critical value = –0.5324 Since –0.276 > –0.5324 the result is not significant. Thus we do not have sufficient evidence to reject H0 There is not sufficient evidence at the 5% level to suggest that there is correlation between birth rate and death rate
B1 for H0, H1 in symbols B1 for defining ρ
B1 for critical value (+ or -) M1 for a sensible comparison leading to a conclusion (provided that -1 < r < 1) A1 for correct result ft their r B1 ft for conclusion in
context
6
Condone hypotheses written in words and context. e.g. allow H0: There is no correlation between x & y, H1: There is correlation between x & y. (i.e. allow x & y as ‘context’ since these are defined in the question) NB If hypotheses given only in words and ‘association’ mentioned then do not award first B1 and last B1 For hypotheses written in words, candidates must make it clear that they are testing for evidence of correlation in the population. One-tailed test cv = (-) 0.4575 Comparison should be between the candidate’s value of r from part (i) and an appropriate cv (i.e. the sign of the cv and the sign of r should be the same). NOTE If result not stated but final conclusion is correct award SC1 to replace the final A1 B1
(iii) The underlying population must have a bivariate Normal distribution. Since the scatter diagram has a roughly elliptical shape.
B1 E1 for elliptical shape
2
Not bivariate and Normal
(iv) Because this data point is a long way from the other data and it is below and to the right of the other data. It does bring the validity of the test into question since this extra data point is so far from the other points and so there is less evidence of ellipticity.
E1 for a long way E1 for below and to the right of. E1 for does cast doubt on validity E1 for less elliptical
4
Indication that the point is (possibly) an outlier For identifying the position of this point (allow in terms of x and y) Allow ‘no’ but only with with suitable explanation e.g. the sample is still too small to provide evidence either for or against the presence of ellipticity.
TOTAL 17
4767 Mark Scheme January 2011
3
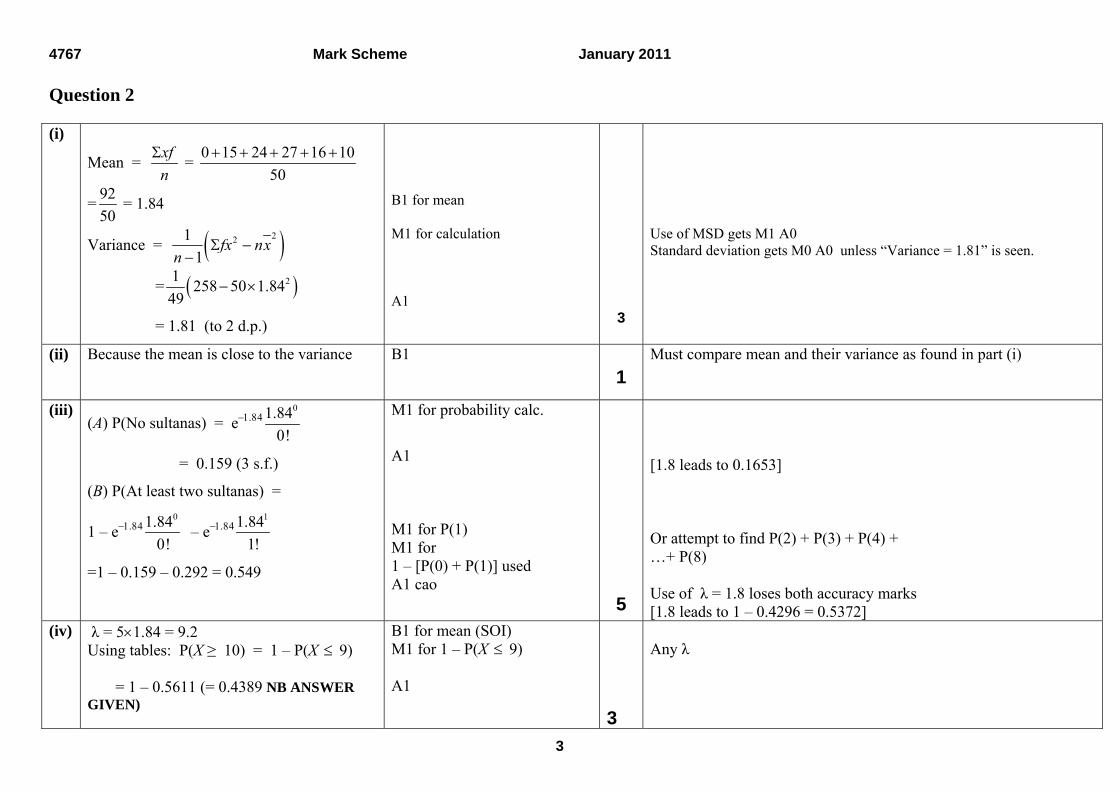
Question 2 (i)
Mean = xf
n
=
0 15 24 27 16 10
50
=92
50 = 1.84
Variance = 221
1fx nx
n
= 21258 50 1.84
49
= 1.81 (to 2 d.p.)
B1 for mean M1 for calculation
A1
3
Use of MSD gets M1 A0 Standard deviation gets M0 A0 unless “Variance = 1.81” is seen.
(ii) Because the mean is close to the variance
B1 1
Must compare mean and their variance as found in part (i)
(iii) (A) P(No sultanas) = e
01.84
0!
= 0.159 (3 s.f.)
(B) P(At least two sultanas) =
1 – e01.84
0! – e
11.84
1!
=1 – 0.159 – 0.292 = 0.549
M1 for probability calc.
A1 M1 for P(1) M1 for 1 – [P(0) + P(1)] used A1 cao
5
[1.8 leads to 0.1653] Or attempt to find P(2) + P(3) + P(4) + …+ P(8) Use of λ = 1.8 loses both accuracy marks [1.8 leads to 1 – 0.4296 = 0.5372]
(iv) λ = 51.84 = 9.2 Using tables: P(X ≥ 10) = 1 – P(X 9) = 1 – 0.5611 (= 0.4389 NB ANSWER GIVEN)
B1 for mean (SOI) M1 for 1 – P(X 9) A1
3
Any λ

4767 Mark Scheme January 2011
4
(v) P(2 out of 6 contain at least ten sultanas) 6
= 2
0.43892 0.56114 = 0.2864
M1 for p2 q4 M1 dep for coefficient A1
3
p + q = 1 Coefficient of 15 as part of a binomial calculation ft if p rounded from part (iv)
(vi)
Use Normal approx with μ = np = 60 0.4389 = 26.334 σ2 = npq = 60 0.4389 0.5611 = 14.776
P(X > 30) = P30.5 26.334
14.776Z
= P(Z > 1.0838) = 1 – Φ(1.0838)
= 1 – 0.8608
= 0.1392
B1 for μ B1 for σ2 B1 for correct continuity correction M1 for probability using correct tail. FT their μ & σ2 A1 cao
5
SOI Allow 26.3 Allow 14.8 … …(giving P(Z > 1.091..) = 0.137 3sf ) But do not FT wrong or omitted CC
20
4767 Mark Scheme January 2011
5
Question 3 (i)
(A) P(X < 325)
= P 325 355
52Z
= P( Z < – 0.577)
= 1– Φ(0.577) = 1 – 0.7181
= 0.2819
(B) P( 300 < X < 400)
= P 300 355 400 355
52 52Z
= P 1.058 0.865Z = Φ(0.865) – (1– Φ(1.058)) = 0.8065 – (1 – 0.8549)
= 0.6614 (0.6615 from GDC)
M1 for standardising M1 for correct structure A1 CAO M1 for standardising both M1 for correct structure A1 CAO
3
3
NB When a candidate’s answers suggest that (s)he appears to have neglected to use the difference column of the Normal distribution tables penalise the first occurrence only
Ignore spurious continuity corrections & allow reversal of numerator i.e. correct tail (including below a negative z) Allow answers which round to 0.282 Penalise spurious continuity corrections Allow 0.663 if penalised inappropriate table use already Use of standard deviation = √52 or 522 can earn M1 for structure only in each part – max 2/6
(ii)
From tables Φ-1 ( 0.2) = – 0.8416
3550.8416
52
k
k = 355 – 0.8416 52 = 311.2
B1 for ± 0.8416 seen M1 for equation in k A1 CAO
3
NOT 1 – 0.8416 Equation must be equivalent to this. Penalise use of + 0.8416 unless numerator has been reversed. Condone other z values but use of probabilities here, e.g. use of 0.2 or Φ(0.2) = 0.5793, gets M0 A0 Allow 311

4767 Mark Scheme January 2011
6
(iii)
H0: μ = 355; H1: μ ≠ 355. Where μ denotes the population mean (reaction time for women)
Test statistic = 344 355 11
1.05810.452 / 25
5% level 2 tailed critical value of z = 1.96 –1.058 > –1.96 so not significant. There is not sufficient evidence to reject H0 There is insufficient evidence to conclude that women have a different reaction time from men in this experiment.
B1 for use of 355 in hypotheses B1 for both correct B1 for definition of μ M1 must include √25 A1 B1 for 1.96 M1 for a sensible comparison
leading to a conclusion A1 for correct conclusion in words in context
8
Use of 355 in hypotheses and hypotheses given in terms of μ not p or x, etc. unless letter used is clearly defined as population mean Allow + 1.058 only if later compared with + 1.96 Or -1.96 Do not accept ‘men and women have same reaction time’
TOTAL 17

4767 Mark Scheme January 2011
7
Question 4 (i)
H0: no association between pebble size and site H1: some association between pebble size and site;
EXPECTED Site A Site B Site C Large 13.70 9.44 13.86 Medium 33.33 22.96 33.70 Small 42.96 29.60 43.44
CONTRIB’N Site A Site B Site C Large 0.1226 0.6940 1.0731
Medium 0.8533 1.5484 3.7861
Small 0.3793 0.3913 1.2744
X 2 = 10.12 Refer to X4
2 Critical value at 5% level = 9.488 Result is significant There is evidence to suggest that there is some association between pebble size and site
B1
M1 A2 for expected values (to 2 dp)
(allow A1 for at least one row or column correct)
M1 for valid attempt at
(O-E)2/E A1 M1 for summation A1 for X2 B1 for 4 deg of freedom
B1 CAO for cv B1 ft their ‘sensible’ X2 and critical value
E1 must be consistent with their X2
12
Must be in context NB if H0 H1 reversed, or ‘correlation’ mentioned, do not award first B1 or final E1 1d.p.can get M1A1A0 M1A2 can be implied by correct contributions/final answer NB These (M1A1) marks cannot be implied by a correct final value of X 2. A1 for at least 1 row/column correct
Dependent on previous M1 Award only if no incorrect working seen Allow reject H0. B0 if critical value of 0.711 (lower tail) or 2.776 (t distribution) used. Dependent on previous B1 SC1 (to replace B1E1 if first B1B1 earned where ‘significant’ not stated but final statement is correct)

4767 Mark Scheme January 2011
8
(ii)
Site A Contributes least to X2 showing that frequencies are as expected if there were no association. OR Contribution of 0.8533 implies that there are (slightly) fewer medium pebbles than expected. Site B Contribution of 1.5484 implies that there are fewer medium pebbles than expected. Site C Contribution of 3.7861 implies that there are a lot more medium than expected. NB MAX 3/6 for answers not referring to contributions (explicitly or implicitly).
E2,1,0 E2,1,0 E2,1,0 Need ‘a lot more’ for E2
2
2
2
NOTE For each site, some reference to contributions needed (explicitly or implicitly). Award E2 only if no incorrect additional comment made. Allow large/small ‘as expected’ or ‘more than expected’ and medium ‘as expected’ or ‘less than expected’ for E1 (if contribution not mentioned) Award E2 only if no incorrect additional comment made. Allow large/small ‘as expected’ or ‘more than expected’ and medium ‘less than expected’ for E1 (if contribution not mentioned) Award E2 only if no incorrect additional comment made. Allow large/small ‘fewer than expected’ and medium ‘more than expected’ for E1 (if contribution not mentioned)
TOTAL 18

4767 Mark Scheme January 2011
9
Additional notes re Q1(ii) For those carrying out a one-tailed test, B0 B1 B1 M1 A1 B1 is available provided that working is consistent with a one-tailed test being used. For the final B1 to be earned, the conclusion should refer to alternative hypothesis used. e.g. ‘There is not sufficient evidence at the 5% level to suggest that there is a negative correlation between birth rate and death rate’. If the cv is taken from the Spearman’s Test table (i.e. -0.5385 and -0.4637) then the third B1 will be lost. If other ‘sensible’ cvs are used then only B1 B1 B0 M1 A0 B0 available. Use of t distribution leads to B1 B1 B0 M0 A0 B0 max. Additional notes re Q3(iii)
Critical Value Method 355 – 1.96 × 52 ÷ √25 gets M1B1 = 334.6… gets A1 334.6 < 344 gets M1for sensible comparison A1 still available for correct conclusion in words & context
Confidence Interval Method CI centred on 344 + or - 1.96 × 52 ÷ √25 gets M1 B1 = (323.62, 364.384) A1 contains 355 gets M1 A1 still available for correct conclusion in words & context
Probability Method Finding P(sample mean < 344) = 0.1451 gets M1 A1 B1 0.1451 > 0.025 gets M1 for a sensible comparison if a conclusion is . 0.1451 > 0.05 gets M1 A0 unless using one tailed test A1 still available for correct conclusion in words & context. Condone P(sample mean > 344) = 0.8549 for M1 but only allow A1 if later compared with 0.975 at which point the final M1and A1 are still available
One-tailed test Max B1 B0 B1 M1 A1 B1 (for cv = -1.645) M1 A1 (provided that the conclusion relates to H1: μ < 355, e.g. there is insufficient evidence to suggest that women have a lower reaction time than men in this experiment). Consistent use of σ = √52 Do not penalise in parts (ii) and (iii).

Examiners’ Reports - January 2011
Chief Examiner’s Introduction to Statistics Reports
Two general matters, to which some attention is also drawn in the individual subject reports, are worthy of mention in a general introduction, as they apply to all the Statistics modules. First, advice was circulated several months ago concerning the issue of numerical accuracy of final answers, in particular to the practice of some candidates of gross over-specification in this regard. As an example, this would refer to the quotation of the value of a test statistic as, say, 2.18735693762 merely because this is the number that happened to appear on the candidate's calculator. This shows a complete lack of understanding of statistical practice and, indeed, of basic concepts of numeracy. In the current round of examinations, accuracy marks (but not method marks) were normally withheld in such cases. The earlier advice had explicitly stated that this would occur, and it will continue in future rounds. This is of course different from the desirable practice of retaining sufficient accuracy in intermediate calculations to avoid problems resulting from premature rounding. Secondly, there are many references in the individual subject reports to the importance of securely stating hypotheses when conducting statistical tests. In future rounds of examinations, candidates will be expected to state their null and alternative hypotheses even if this is not explicitly asked for in the question. In many cases, this can sensibly and compactly be done in the usual notation of the subject, for example "H0: μ = 25; H1: μ > 25", but it would be expected that any parameters appearing in those statements are themselves briefly but adequately defined verbally. In the example, this might be achieved by adding "where μ is the population mean". There is no objection to hypotheses being stated verbally (for example "the null hypothesis is that the population mean is 25 (cm) and the alternative hypothesis is that it is greater"), but candidates must be careful to be precise in their wording (notably, explicit use of the word "population" will often be necessary for full marks to be awarded).
28

Examiners’ Reports - January 2011
4767 Statistics 2
General Comments Yet again, a very good overall standard of work was seen from the majority of candidates. There was no evidence that candidates struggled to complete the paper in the time allocated. Indeed, many candidates found time to write lengthy descriptions when asked for ‘brief’ comments. There were a small number of instances where candidates were penalised for providing excessive accuracy in final answers; more commonly, candidates were penalised for premature rounding which led to inaccuracy in final answers. Most candidates handled probability calculations competently. In general, the wording and layout of responses to hypothesis tests was very good. Comments on Individual Questions 1 (i) This was well answered, with many gaining full marks. Those candidates who used a
version of the formula for calculating Pearson’s product moment correlation coefficient, r, which involved calculation of the mean value of x and the mean value of y tended to round these values; this produced a large error in their final value for r. Attempts at both methods highlighted in the mark scheme were seen; occasionally candidates mixed these methods up finding, for example, the numerator from the Sxy method and the denominator from the covariance method.
1 (ii) In this hypothesis test, many candidates preferred to state their hypotheses in words, rather than using symbols. In both cases, many candidates failed to make it clear that they were testing for correlation in the underlying population. Most managed to carry out the required two-tailed test successfully. A small proportion of candidates did not manage to obtain the correct critical value, with some inappropriately using a one-tailed test value and others using critical values from the Spearman’s table. It is a requirement in these tests that candidates show clearly a comparison of their test statistic with their critical value. This comparison can be in the form of a diagram; indeed, those who provided diagrams tended to be less likely to compare their negative test statistic with a positive critical value. It was pleasing to see most candidates phrase their conclusion along the lines of ‘there is insufficient evidence to suggest that there is a correlation between …’ rather than the more assertive ‘there is no correlation between…’.
1 (iii) The phrase ‘bivariate Normal’ seemed elusive to many candidates. The idea that if the points in the scatter diagram fall within an ellipse then the test is likely to be valid was more widely known. Some candidates referred to the diagram being ‘linear’ as the reason for validity.
1 (iv) Many found this difficult but some good responses were seen. Most picked up marks for recognising that the additional value was not within the original body of data and stating that the validity of the test was brought into question, despite providing spurious justifications. The mark for identifying the position of the point in the bottom right hand corner of the diagram was less frequently given. The most elusive mark proved to be the mark for commenting that the new value reduced the elliptical shape of the scatter diagram.
2 (i) The majority of candidates found it easy to justify the given value of the sample mean, but many struggled with the calculation of the sample variance; calculation of MSD was common. This led to difficulties providing a sensible answer to part (ii)
33

Examiners’ Reports - January 2011
2 (ii) This was well answered by those obtaining the sample variance in part (i). It was clear that some candidates knew what was required in part (ii) but did not know how to calculate sample variance – many ‘fudged’ their answers to part (i) to enable them to answer part (ii).
2 (iii) This was very well answered, with many candidates gaining full marks. Most commonly, marks were lost in part (iii) B for calculating 1 – P(X = 1), or for rounding λ to 1.8 so that tables could be used.
2 (iv) Very well answered, with most candidates managing to satisfactorily justify the given answer.
2 (v) Also well answered. Some candidates proceeded to use their own (wrong) answer from part (iv) despite the correct value being provided.
2 (vi) Many candidates struggled with this request to use a suitable approximating distribution to find the required probability. Most decided to use a Normal approximation, but seemed unsure as to the correct parameters; in particular the variance caused problems. In addition to this, many did not use a continuity correction or used 29.5 instead of 30.5. Otherwise, the majority of candidates coped well with the probability calculation, demonstrating a good understanding of how to use the Normal distribution.
3 (i) Very well answered. Many candidates gained full marks here. Where marks were lost it was usually through inaccurate use of Normal probability tables. Most candidates managed to standardise correctly; although some applied spurious continuity corrections and were thus penalised. A few candidates struggled with the structure of the probability calculation, particularly in part (i) B, but efforts at this were, on the whole, good.
3 (ii) Well answered. Most candidates managed to identify the appropriate z-value, -0.8416, and use it appropriately to produce the correct answer. Common errors included using +0.8416 in place of -0.8416. Many others used a mix of probability and z-value by using 1 – 0.8416 ( = 0.1584) in place of -0.8416.
3 (iii) This was reasonably well answered, but proved to be one of the more difficult parts of the paper. Most candidates managed to state correct hypotheses, with only a small proportion opting to apply a one-tailed test. As usual, the definition of μ as the population mean was omitted in most cases. A variety of approaches to the test were seen, with the method outlined in the main body of the mark scheme being most popular. Candidates who treated the mean value of 344 as a single observation from the N(355, 522) distribution were heavily penalised. Several candidates identified the critical value incorrectly as -1.645 despite carrying out a two-tailed test at the 5% level of significance. Again, it was pleasing to see most candidates phrasing their conclusion correctly as ‘there is insufficient evidence to suggest that women have a different mean reaction time to men’.
4 (i) Very well answered. This part proved to be a valuable source of marks for most candidates. Common reasons for marks to be lost included inaccurate recording of expected frequencies or premature rounding to, say, 1 decimal place leading to inaccuracy in the calculation of the test statistic. Otherwise the remainder of the test was handled well. A few candidates attempted a two-tailed test and were thus penalised. Very few candidates were penalised for not referring to the context of the question in hypotheses and/or conclusion. Very few mixed up association with correlation.
34

Examiners’ Reports - January 2011
4 (ii) As with previous years, candidates found this type of question difficult. The aim of the question was to get candidates to explain the connection between size of contribution to the test statistic and degree of association. It was apparent that candidates had a better idea of how to proceed than in previous years, with many referring to the particularly large and small contributions and making sensible comments. However, many candidates’ comments did not refer to contributions either explicitly or implicitly; in such cases, full marks were not available. Those candidates who insisted on providing an explanation for each of the three sizes of pebble at each of the three sites often slipped up somewhere along the way and lost marks; if candidates answered the question in the desired manner, it was not necessary to comment on each of the nine contributions to obtain full marks.
35

OCR (Oxford Cambridge and RSA Examinations) 1 Hills Road Cambridge CB1 2EU OCR Customer Contact Centre 14 – 19 Qualifications (General) Telephone: 01223 553998 Facsimile: 01223 552627 Email: [email protected] www.ocr.org.uk For staff training purposes and as part of our quality assurance programme your call may be recorded or monitored
Oxford Cambridge and RSA Examinations is a Company Limited by Guarantee Registered in England Registered Office; 1 Hills Road, Cambridge, CB1 2EU Registered Company Number: 3484466 OCR is an exempt Charity OCR (Oxford Cambridge and RSA Examinations) Head office Telephone: 01223 552552 Facsimile: 01223 552553 © OCR 2011


![Mathematics (MEI) - OCR · Advanced Subsidiary GCE Pure Mathematics (MEI) (3898) ... (C3) Methods for Advanced Mathematics 9 4754 ... ≤ for Ms]; if 0, allow SC1 for 9/6 o.e found](https://img.dokumen.tips/doc/110x75/5b82c6f17f8b9a934f8bbfd8/mathematics-mei-advanced-subsidiary-gce-pure-mathematics-mei-3898-.jpg)