Embed Size (px)
Citation preview

Mathematics and Science Education
U.S. Department of Education

Mathematics and Science Partnerships: Summary of the FY2007 Annual Reports
U.S. Department of Education

Conceptual Model of Mathematics and Science Partnerships Program
Develop partnership of high-need school districts and an IHE’s science, technology, engineering, mathematics faculty
Develop partnership of high-need school districts and an IHE’s science, technology, engineering, mathematics faculty
Improve classroom instruction
Improve classroom instruction
Provide professional development to strengthen teachers’ content knowledge
Provide professional development to strengthen teachers’ content knowledge
Improve student achievement in mathematics and science
Improve student achievement in mathematics and science
Mathematics and Science Partnerships at a Glance
Almost 60,000 teachers participated nationwide. Over 4,000 IHE faculty participated in ED MSP
projects. Approximately 5,200 organizations partnered to
form 575 projects across the country. Enhanced the quality of classroom instruction for
nearly 2.5 million students.

MSP Funding FY 2007 ED MSP provided $182 million dollars through a formula to the states. State received awards ranging from $906,246 to over $23.6 million
dollars. Projects received awards ranging from $24,000 to 3.6 million.
Project Budgets from State MSP Grants, FY 2006
Project budgets FY 2007 Percent of projects
$100,000 or less 9%
$100,001 to $200,000 43%
$200,001 to $500,000 26%
$500,001 to $1,000,000 18%
$1,000,001 or more 4%
Did not report 0%
Total 100%

Characteristics of MSP Projects 56% led by LEAs 32% led by IHEs 16% led by “Other” The medium number of teachers served per
project was 54. (Range from 2 to 1,540) An average of 7 IHE faculty participated per
project.

Profession Development MSP projects reported using one of two main
models for providing professional development for teachers:
1. The individual teacher model (79 percent) – when teachers from a set of school or school districts participate as individuals in order to improve their own content knowledge and teaching skills.
2. The teacher leader or district models (21 percent) – when teachers are trained to become mathematics or science leaders in their schools/districts.

Professional Development Models
37 percent of projects focused on mathematics 30 percent of projects focused on science 33 percent of projects focused on mathematics and science.
Average Professional Development Hours, by Professional Development Model Type, FY 2007
Professional Development Model
Percent of projects(n =575)
Total Average Hours
Summer Institute only 1% 80
Summer Institute with Follow -up
59% 100
Focus on School Year Activities
40% 74
Did not report 0% --

Teachers’ Content Knowledge Results
Percent of Teachers with Significant Gains In Content Knowledge, of Those Teachers with Pre-Post Content Assessments, Summed Across All Projects, FY 2007
Content area
Total Number of teachers
served
Number of teachers with
content assessments
Percent of teachers
with significant gains
Mathematics content knowledge
34,567 11,696 68%
Science content knowledge
26,552 11,546 73%

Students’ Content Knowledge Results
Percent of Students Scoring at Basic or Proficient or Above, of Students Taught by MSP Teachers And Assessed In Each Content Area, FY 2007
Content area
Total number of students taught by
MSP teachers*
Number of students with assessment
data
Percent of assessed students
scoring at basic level or above
Percent of assessed
students scoring at proficient level
or above
Mathematics content knowledge
1,284,911 610,868 52% 45%
Science content knowledge
844,749 253,216 50% 49%

Evaluation Designs 2% Experimental 42% Quasi-Experimental 20% One group pre/post 14% Mixed methods 22% Other

Final Reports with Strong Evaluation Designs
183 Final Reports Submitted 63 projects reported experimental or quasi-
experimental design. 37 completed both data on treatment and comparison
groups.
--Content Knowledge
--Teacher Classroom Practice
--Student Achievement
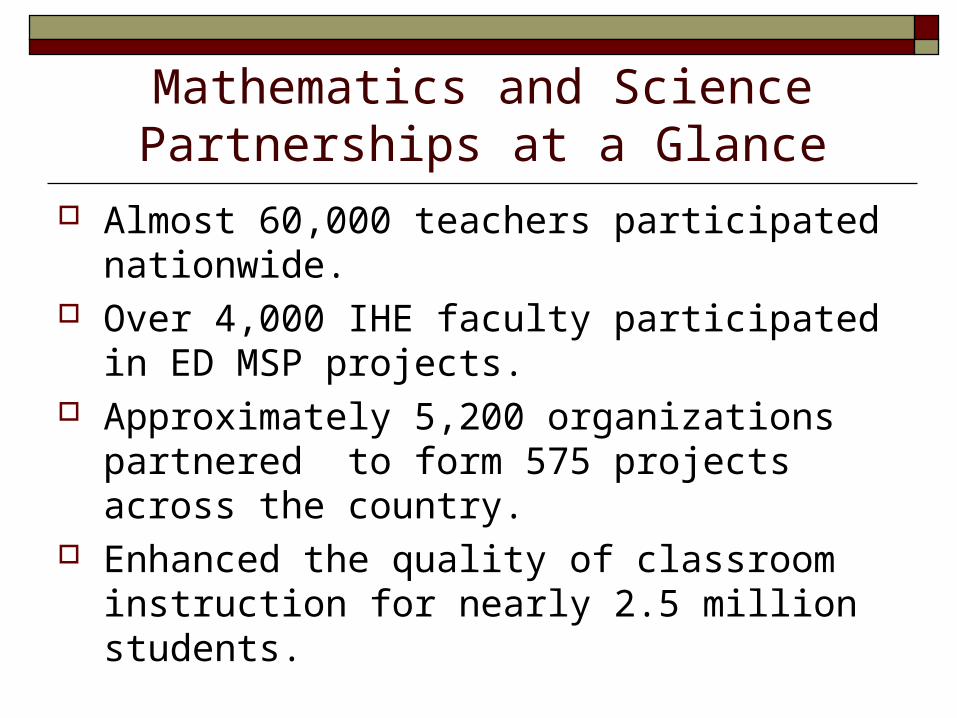
MSP Federal Fiscal Year 2007 Summary
$181 million in federal resources were granted to 575 projects to provide professional development to K-12 educators.
The typical project provided professional development to 54 teachers, and involved 7 IHE faculty members from both STEM disciplines and Schools of Education, receiving 100 hours of PD in a year.
The majority (80 percent) of teachers who participated in MSP projects were elementary and middle school teachers.
A large majority of teachers made statistically significant gains in their content knowledge and teaching skills (68% math, 73% science).
Quality if instruction improved for 2.5 million students throughout the nation.

Race to the Top/Other $9.7B $4.35B –Race to the Top Fund $3.5B – School Improvement Grants $650MM – Investing in Innovation (I3) $650MM – Education Technology $300MM – Teacher Incentive Fund $250MM – Statewide Data Systems

Race to the Top -- $4.35 Billion States are only eligible applicants. Half of
funds go to high need LEAs.
Two rounds of awards. First round under review, 2nd round due in June.
Proposed Competitive Priority: Improving math and science education.

Four Assurances Develop rigorous college and career-ready
standards and high quality assessments that are valid and reliable for all students.
Establish preK-college and career systems that track progress and foster improvement.
Improve teacher effectiveness and the equitable distribution of high quality teachers
Intensive support for lowest performing schools.

Set Aside for Assessments $350 million is set aside for development of
assessments for Common Core State Standards.
Mathematics and Reading.

School Improvement Grants Formula grant funds to states to support the
lowest performing schools.
Primary focus on mathematics and reading, and on school improvement models.
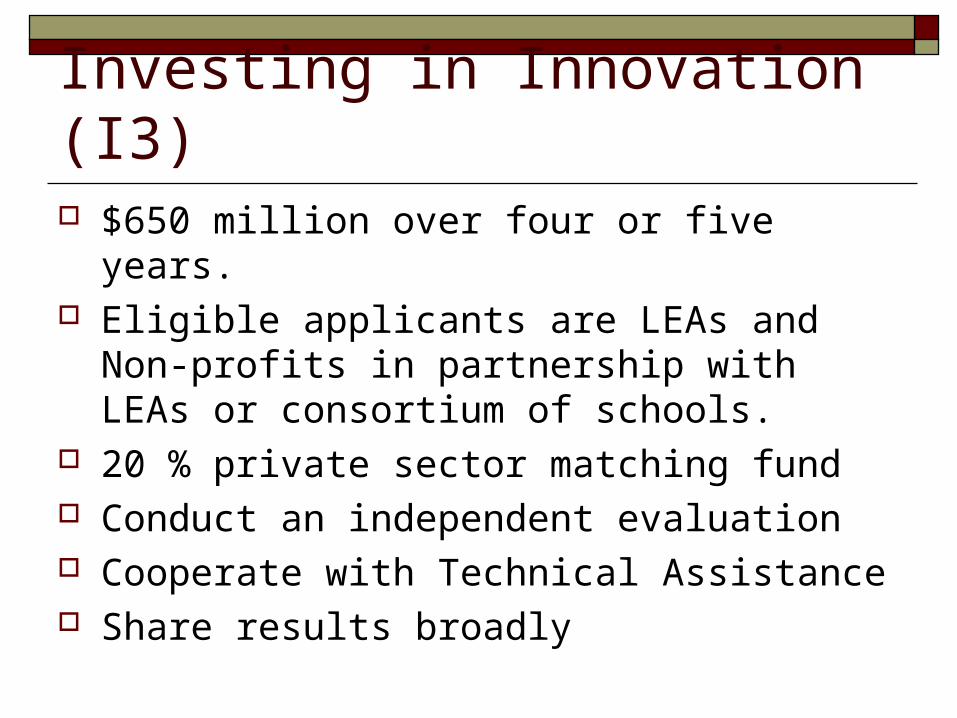
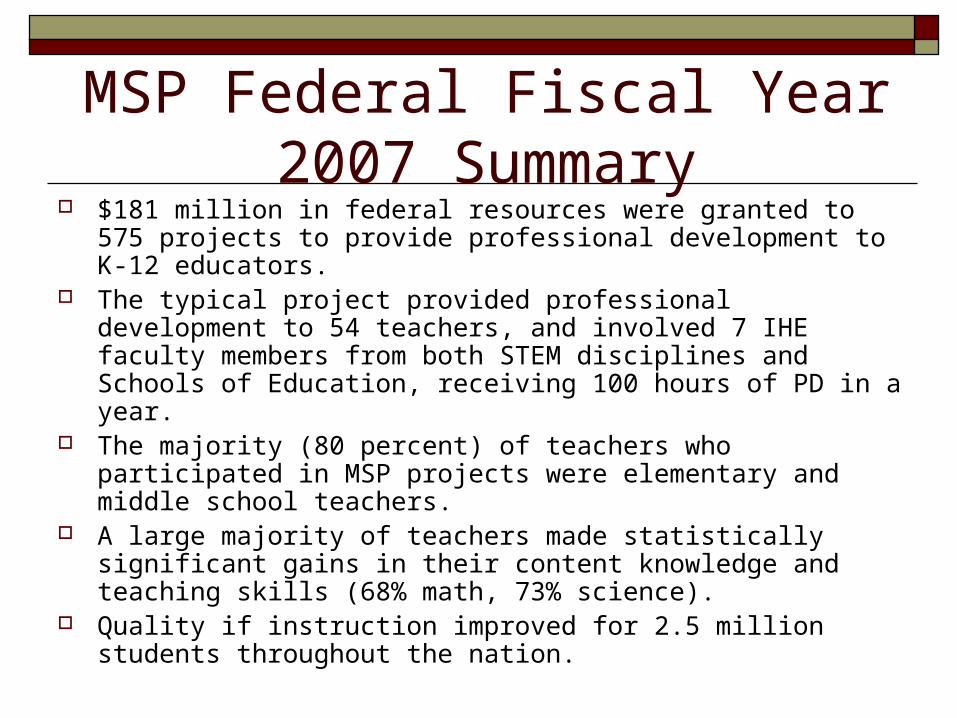
Investing in Innovation (I3) $650 million over four or five years. Eligible applicants are LEAs and Non-profits
in partnership with LEAs or consortium of schools.
20 % private sector matching fund Conduct an independent evaluation Cooperate with Technical Assistance Share results broadly

I3 Types of Awards Development:
--up to $5 million, reasonable research base, able to further develop and scale.
Validation:
--Up to $30 million, moderate evidence, able to scale to regional or state level.
Scale-up:
--Up to $50 million, strong evidence, able to scale national, regional, or state.

i3 Proposed Priorities Must be designed to improve achievement in
high-need students. Must address one or more of the 4
Assurances. May address: early learning, college access
and success, unique needs of students with disabilities or are ELL, serve rural schools.
$150 million set aside for STEM.

Education Technology $650 million formula grant to states that is
then sent out to LEAs.

Teacher Incentive Fund $300 million for competitive grants To support a variety of performance-based
compensation systems that reward for increases in student achievement, numbers of effective teachers in hard to staff schools, filling shortages such as math and science.
Must establish differentiated levels of compensation based on student achievement and classroom evaluations.

Statewide Data Systems $250 million to improve data systems and
their integration.
Summary Unprecedented resources beginning to be
available.
STEM improvement embedded in most of these initiatives.
How can we take advantage of this opportunity?

Contact InformationPat O’Connell Johnson
Team Leader
United States Department of Education
(202) 260-7813