Embed Size (px)
Citation preview
TIMSS International Study CenterBoston CollegeChestnut Hill, MA, USA
MATHEMATICS ACHIEVEMENT INMISSOURI AND OREGON IN
AN INTERNATIONAL CONTEXT:1997 TIMSS BENCHMARKING
International Association for the Evaluation ofEducational Achievement
Ina V.S. MullisMichael O. MartinAlbert E. Beaton
Eugenio J. GonzalezDana L. Kelly
Teresa A. Smith
June 1998

ii
© 1998 International Association for the Evaluation of Educational Achievement (IEA).
Mathematics Achievement in Missouri and Oregon in an International Context:1997 TIMSS Benchmarking/ by Ina V.S. Mullis, Michael O. Martin, Albert E. Beaton,Eugenio J. Gonzalez, Dana L. Kelly, and Teresa A. Smith
Publisher: Center for the Study of Testing, Evaluation, and Educational Policy,Boston College.
Library of Congress Catalog Card Number: 98-86204
ISBN 1-889938-10-6
For more information about TIMSS contact:
TIMSS International Study CenterCenter for the Study of Testing, Evaluation, and Educational PolicyCampion HallSchool of EducationBoston CollegeChestnut Hill, MA 02467United States
For information on ordering this report, write the above addressor call +1-617-552-4521.
This report also is available on the World Wide Web:http://wwwcsteep.bc.edu/timss
Funding for the international coordination of TIMSS is provided by the U.S.National Center for Education Statistics, the U.S. National Science Foundation, theIEA, and the Canadian government. Each participating country provides fundingfor the national implementation of TIMSS.
Boston College is an equal opportunity, affirmative action employer.
Printed and bound in the United States.

iii
T A B L E O F C O N T E N T S
Contents
INTRODUCTION ......................................................................................................................................... 1
OVERVIEW OF RESULTS ........................................................................................................................... 3
Brief Summary of Results for Missouri ................................................................................................... 3
Brief Summary of Results for Oregon .................................................................................................... 3
MAJOR ASPECTS OF TIMSS ..................................................................................................................... 4
Which Countries and States Participated? ........................................................................................... 4
What Was the Nature of the Mathematics Test ................................................................................... 4
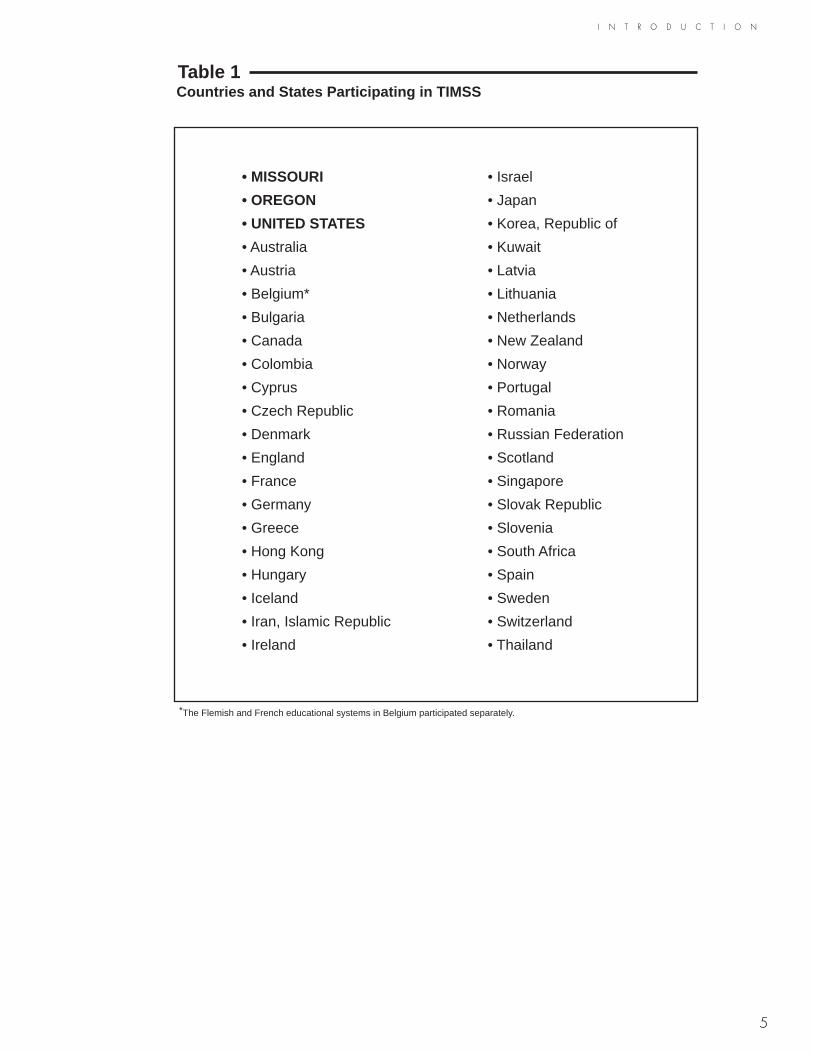
Table 1: Countries and States Participating in TIMSS .............................................................................................................. 5
Table 2: Information About the Grades Tested .......................................................................................................................... 6
How Does TIMSS Document Compliance with Sampling Guidelines? ............................................ 7
Figure 1: Countries Grouped for Reporting of Achievement According to Their Compliance with
Guidelines for Sample Implementation and Participation Rates ........................................................................................ 8
CHAPTER 1: MATHEMATICS ACHIEVEMENT IN AN INTERNATIONAL CONTEXT .......................11
How Did Missouri and Oregon Perform Compared with the TIMSS Countries ..............................11
Table 1.1: Distributions of Mathematics Achievement – Eighth Grade ............................................................................... 12
Figure 1.1: Countries’ Average Mathematics Performance at Eighth Grade Compared with
Missouri and Oregon ............................................................................................................................................................... 13
What Are the Differences in Performance Compared to Three Marker Levels of InternationalMathematics Achievement? ............................................................................................................. 15
Table 1.2: Percentages of Students Achieving International Marker Levels in Mathematics – Eighth Grade .......... 16
What Are the Gender Differences in Mathematics Achievement? .................................................. 17
Table 1.3: Gender Differences in Mathematics Achievement – Eighth Grade ................................................................ 18
CHAPTER 2 : AVERAGE ACHIEVEMENT IN THE MATHEMATICS CONTENT AREAS ................... 19
How Does Achievement Differ Across Mathematics Content Areas? .............................................. 19
Table 2.1: Average Percent Correct by Mathematics Content Areas – Eighth Grade .................................................. 20
Figure 2.1: Countries’ Average Achievement in Mathematics Content Areas Compared with Missouri
Eighth Grade ............................................................................................................................................................................. 23
Figure 2.2: Countries’ Average Achievement in Mathematics Content Areas Compared with Oregon
Eighth Grade ............................................................................................................................................................................ 24

iv
T A B L E O F C O N T E N T S
What Are the Gender Differences in Achievement for the Content Areas? .................................... 25
Table 2.2: Average Percent Correct for Boys and Girls by Mathematics Content Areas – Eighth Grade ............... 26
CHAPTER 3 : PERFORMANCE ON ITEMS WITHIN EACH MATHEMATICS CONTENT AREA ..... 29
What Have Students Learned About Fractions and Number Sense? .............................................. 30
Table 3.1: Percent Correct for Example Item 1 – Eighth Grade .......................................................................................... 32
Table 3.2: Percent Correct for Example Item 2 – Eighth Grade ......................................................................................... 33
Table 3.3: Percent Correct for Example Item 3 – Eighth Grade ........................................................................................ 34
Table 3.4: Percent Correct for Example Item 4 – Eighth Grade ........................................................................................ 35
Table 3.5: Percent Correct for Example Item 5 – Eighth Grade ........................................................................................ 36
Table 3.6: Percent Correct for Example Item 6 – Eighth Grade ........................................................................................ 37
Figure 3.1: International Difficulty Map for Fractions and Number Sense Example Items – Eighth Grade ............. 38
What Have Students Learned About Geometry? .............................................................................. 39
Table 3.7: Percent Correct for Example Item 7 – Eighth Grade .......................................................................................... 40
Table 3.8: Percent Correct for Example Item 8 – Eighth Grade ......................................................................................... 41
Table 3.9: Percent Correct for Example Item 9 – Eighth Grade ........................................................................................ 42
Table 3.10: Percent Correct for Example Item 10 – Eighth Grade .................................................................................... 43
Table 3.11: Percent Correct for Example Item 11 – Eighth Grade ..................................................................................... 44
Table 3.12: Percent Correct for Example Item 12 – Eighth Grade .................................................................................... 45
Figure 3.2: International Difficulty Map for Geometry Example Item – Eighth Grade ................................................... 46
What Have Students Learned About Algebra? ................................................................................. 47
Table 3.13: Percent Correct for Example Item 13 – Eighth Grade .................................................................................... 48
Table 3.14: Percent Correct for Example Item 14 – Eighth Grade .................................................................................... 49
Table 3.15: Percent Correct for Example Item 15 – Eighth Grade ..................................................................................... 51
Table 3.16: Percent Correct for Example Item 16 – Eighth Grade .................................................................................... 52
Table 3.17: Percent Correct for Example Item 17 – Eighth Grade .................................................................................... 53
Figure 3.3: International Difficulty Map for Algebra Example Items – Eighth Grade ..................................................... 54
What Have Students Learned About Data Representation, Analysis, and Probability?................. 55
Table 3.18: Percent Correct for Example Item 18 – Eighth Grades .................................................................................. 57
Table 3.19: Percent Correct for Example Item 19 – Eighth Grade .................................................................................... 58
Table 3.20: Percent Correct for Example Item 20 – Eighth Grade ................................................................................... 59
Table 3.21: Percent Correct for Example Item 21 – Eighth Grade .................................................................................... 60

v
T A B L E O F C O N T E N T S
Table 3.22: Percent Correct for Example Item 22 – Eighth Grade .................................................................................... 61
Table 3.23: Percent Correct for Example Item 23 – Eighth Grade ................................................................................... 62
Figure 3.4: International Difficulty Map for Data Representation, Analysis, and Probability Example Items
Eighth Grade ............................................................................................................................................................................. 63
What Have Students Learned About Measurement? ........................................................................ 64
Table 3.24: Percent Correct for Example Item 24 – Eighth Grade ................................................................................... 66
Table 3.25: Percent Correct for Example Item 25 – Eighth Grade ................................................................................... 67
Table 3.26: Percent Correct for Example Item 26 – Eighth Grade ................................................................................... 68
Table 3.27: Percent Correct for Example Item 27 – Eighth Grade ................................................................................... 69
Table 3.28: Percent Correct for Example Item 28 – Eighth Grade ................................................................................... 70
Figure 3.5: International Difficulty Map for Measurement Example Items – Eighth Grade ............................................ 72
What Have Students Learned About Proportionality? ...................................................................... 73
Table 3.29: Percent Correct for Example Item 29 – Eighth Grade .................................................................................... 74
Table 3.30: Percent Correct for Example Item 30 – Eighth Grade ................................................................................... 75
Table 3.31: Percent Correct for Example Item 31 – Eighth Grade ..................................................................................... 76
Table 3.32: Percent Correct for Example Item 32 – Eighth Grade ................................................................................... 77
Table 3.33: Percent Correct for Example Item 33 – Eighth Grade ................................................................................... 78
Figure 3.6: International Difficulty Map for Proportionality Example Items – Eighth Grade ........................................ 79
CHAPTER 4 : STUDENTS’ BACKGROUNDS AND ATTITUDES TOWARDS MATHEMATICS .......... 81
What Educational Resources Do Students Have in Their Homes? .................................................. 81
Table 4.1: Students’ Reports on Educational Aids in the Home: Dictionary, Study Desk/Table, and Computer
Eighth Grade ............................................................................................................................................................................ 82
Table 4.2: Students’ Reports on the Number of Books in the Home – Eighth Grade .................................................... 84
Table 4.3: Students’ Reports on the Highest Level of Education of Either Parent – Eighth Grade .................................... 85
Figure 4.1: Country Modifications to the Definitions of Educational Levels for Parents’ Highest Level of Education .... 86
Table 4.4: Students’ Reports on the Frequency with Which They Speak the Language of the Test at Home
Eighth Grade ............................................................................................................................................................................. 88
What Are the Academic Expectations of Students, Their Families, and Their Friends? .................. 89
Table 4.5: Students’ Reports on Whether They Agree or Strongly Agree That It is Important to Do
Various Activities – Eighth Grade .......................................................................................................................................... 91
Table 4.6 Students’ Reports on Whether Their Mothers Agree or Strongly Agree That It is Important
to Do Various Activities – Eighth Grade .............................................................................................................................. 92

vi
T A B L E O F C O N T E N T S
Table 4.7: Students’ Reports on Whether Their Friends Agree or Strongly Agree That It is Important to
Do Various Activities – Eighth Grade ................................................................................................................................... 93
How Do Students Spend Their Out-of-School Time During the School Week? .............................. 94
Table 4.8: Students’ Reports on How They Spend Their Daily Out-of-School Study Time – Eighth Grade ............... 95
Table 4.9: Students’ Reports on How They Spend Their Daily Leisure Time – Eighth Grade ....................................... 96
Table 4.10: Students’ Reports on Total Amount of Out-of-School Time Spent Studying Mathematics
or Doing Mathematics Homework on a Normal School Day – Eighth Grade ......................................................... 98
Table 4.11: Students’ Reports on the Hours Spent Each Day Watching Television and Videos – Eighth Grade ......... 99
How Do Students Perceive Success in Mathematics? .....................................................................100
Table 4.12: Students’ Reports on Their Self-Perceptions About Usually Doing Well in Mathematics
Eighth Grade ........................................................................................................................................................................... 101
Figure 4.2: Gender Differences In Students’ Self-Perceptions About Usually Doing Well in Mathematics
Eighth Grade ........................................................................................................................................................................... 102
Table 4.13: Students’ Reports on Things Necessary to Do Well in Mathematics – Eighth Grade ............................... 103
Table 4.14: Students’ Reports on Why They Need to Do Well in Mathematics – Eighth Grade ............................. 105
What Are Students’ Attitudes Towards the Mathematics? ..............................................................106
Table 4.15: Students’ Reports About How Much They Like Mathematics – Eighth Grade ......................................... 107
Figure 4.3: Gender Differences in Liking Mathematics – Eighth Grade .......................................................................... 108
Table 4.16: Students’ Overall Attitudes Towards Mathematics – Eighth Grade ...........................................................110
Figure 4.4: Gender Differences in Students’ Overall Attitudes Towards Mathematics – Eighth Grade ................... 111
CHAPTER 5 : TEACHERS AND MATHEMATICS INSTRUCTION ...................................................... 113
Who Delivers Mathematics Instruction? ........................................................................................... 114
Table 5.1: Teachers’ Reports on Their Age and Gender – Eighth Grade ....................................................................... 115
Table 5.2: Teachers’ Reports on Their Years of Teaching Experience – Eighth Grade ................................................. 116
What Are Teachers’ Perceptions About Mathematics? ................................................................... 117
Figure 5.1: Percent of Students Whose Mathematics Teachers Agree or Strongly Agree with Statements
About the Nature of Mathematics and Mathematics Teaching – Eighth Grade ..................................................... 118
Figure 5.2: Percent of Students Whose Mathematics Teachers Think Particular Abilities Are Very Important
for Students’ Success in the Mathematics in School – Eighth Grade ........................................................................ 122
How Do Mathematics Teachers Spend Their School-Related Time? ............................................. 124
Table 5.3: Teachers’ Reports on the Proportion of Their Formally Scheduled School Time Spent Teaching
Mathematics – Eighth Grade .............................................................................................................................................. 125

vii
T A B L E O F C O N T E N T S
Table 5.4: Teachers’ Reports on Average Number of Hours Mathematics is Taught Weekly to Their
Mathematics Classes – Eighth Grade ............................................................................................................................... 126
Table 5.5: Average Number of Hours Students’ Teachers Spend on Various School-Related Activities
Outside the Formal School Day During the School Week – Eighth Grade .............................................................. 127
Table 5.6: Teachers’ Reports on How Often They Meet with Other Teachers in Their Subject Area to
Discuss and Plan Curriculum or Teaching Approaches – Eighth Grade .................................................................... 129
How Are Mathematics Classes Organized? .................................................................................... 130
Figure 5.3: Teachers’ Reports on Factors Limiting How They Teach Class – Eighth Grade ........................................ 132
Table 5.7: Teachers’ Reports on Average Size of Mathematics Class – Eighth Grade .............................................. 134
Figure 5.4: Teachers’ Reports About Classroom Organization During Mathematics Lessons – Eighth Grade .......... 136
What Activities Do Students Do in Their Mathematics Lessons?..................................................... 138
Table 5.8: Teachers’ Reports on Their Main Sources of Written Information When Deciding Which Topics
to Teach and How to Present a Topic – Eighth Grade .................................................................................................. 139
Table 5.9: Teachers’ Reports on How Often They Ask Students to Practice Computational Skills
Eighth Grade ........................................................................................................................................................................... 140
Table 5.10: Students’ Reports on How Often They Ask Students to Do Reasoning Tasks – Eighth Grade ............. 141
Table 5.11: Students’ Reports on Using Things from Everyday Life in Solving Mathematics Problems
Eighth Grade ........................................................................................................................................................................... 142
How Are Calculators and Computers Used? ................................................................................... 143
Table 5.12: Students’ Reports on Having a Calculator and Computer in the Home – Eighth Grade ...................... 144
Table 5.13: Teachers’ Reports on Frequency of Students’ Use of Calculators in Mathematics Class
Eighth Grade ........................................................................................................................................................................... 145
Table 5.14: Teachers’ Reports on Ways in Which Calculators Are Used At Least Once or Twice a Week
Eighth Grade ........................................................................................................................................................................... 146
Table 5.15: Teachers’ Reports on Frequency of Using Calculators in Mathematics Class – Eighth Grade ............ 147
Table 5.16: Students’ Reports on Frequency of Using Computers in Mathematics Class to Solve Exercises
or Problems – Eighth Grade ................................................................................................................................................. 149
Table 5.17: Students’ Reports on Frequency of Using Computers in Mathematics Class – Eighth Grade ............. 150
How Much Mathematics Homework Are Students Assigned? ....................................................... 151
Table 5.18: Teachers’ Reports About the Amount of Mathematics Homework Assigned – Eighth Grade ............. 152
Table 5.19: Teachers’ Reports on Their Use of Students’ Written Mathematics Homework – Eighth Grade ........ 153
What Assessment and Evaluation Procedures Do Teachers Use? .................................................. 154
Table 5.20: Teachers’ Reports on the Types of Assessment Given “Quite A Lot” or “A Great Deal” of Weight
in Assessing Students’ Work in Mathematics Class – Eighth Grade .......................................................................... 155
viii
T A B L E O F C O N T E N T S
Table 5.21: Teachers’ Reports on Ways Assessment Information Is Used “Quite A Lot” or “A Great Deal”
Eighth Grade ........................................................................................................................................................................... 156
Table 5.22: Students’ Reports on Frequency of Having a Quiz or Test in Their Mathematics Lessons
Eighth Grade ........................................................................................................................................................................... 158
APPENDIX A: OVERVIEW OF TIMSS PROCEDURES ...........................................................................A-1
History ...................................................................................................................................................A-1
The Components of TIMSS .................................................................................................................A-2
Developing the TIMSS Mathematics Test ..........................................................................................A-4
Figure A.1: The Three Aspects and Major Categories of the Mathematics Framework ............................................. A-5
Table A.1: Distribution of Mathematics Items by Content Reporting Category and Performance Category ........... A-6
TIMSS Test Design ...............................................................................................................................A-7
Sample Implementation and Participation Rates...............................................................................A-8
Table A.2: Coverage of TIMSS Target Population .............................................................................................................. A-9
Table A.3: School Sample Sizes – Eighth Grade .............................................................................................................. A-11
Table A.4: Student Sample Sizes – Eighth Grade .............................................................................................................. A-12
Table A.5: Participation Rates – Eighth Grade ..................................................................................................................... A-13
Figure A.2 Countries Grouped for Reporting of Achievement According to Their Compliance
With Guidelines for Sample Implementation and Participation Rates ........................................................................ A-14
Data Collection ..................................................................................................................................A-15
Scoring the Free-Response Items ..................................................................................................... A-16
Table A.6: TIMSS Within-Country Free-Response Coding Reliability Data for Eighth Grade Mathematics Items .... A-18
Test Reliability .................................................................................................................................... A-19
Data Processing ................................................................................................................................ A-19
Table A.7: Cronbach’s Alpha Reliability Coefficients – TIMSS Mathematics Test – Eighth Grade ........................ A-20
IRT Scaling and Data Analysis ..........................................................................................................A-21
Estimating Sampling Error ................................................................................................................ A-22
APPENDIX B: PERCENTILES AND STANDARD DEVIATIONS OF ACHIEVEMENT ......................... B-1
Table B.1: Percentiles of Achievement in the Mathematics – Eighth Grade .....................................................................B-2
Table B.2: Standard Deviation of Achievement in Mathematics – Eighth Grade .........................................................B-3

ix
T A B L E O F C O N T E N T S

x

I N T R O D U C T I O N
1
Introduction
M
ATHEMATICS
The Third International Mathematics and Science Study (TIMSS) is the largest, most comprehensive, and most rigorous international study of student achievement ever undertaken. Conducted by the International Association for the Evaluation of Education Achievement (IEA),
1
TIMSS tested the mathematics and science knowledge of nearly a half million students in more than 40 countries around the world during the 1995 school year.
TIMSS tested students in mathematics and science at five grade levels. All countries that participated in TIMSS were to test students in the two grades with the largest pro-portion of 13-year olds (seventh and eighth grades in most countries). Many TIMSS countries also tested students in the grades with largest proportion of 9-year-olds (third and fourth grades in most countries) and students in their final year of secondary school. Together with the achievement tests, TIMSS administered a broad array of background questionnaires. The data collected from students, teachers, and school principals, as well as the system-level information collected from the participating countries make it possible to examine differences in current levels of performance in relation to a wide variety of variables associated with the contexts within which edu-cation takes place.
Recent calls for improvement in education are based on the premise that international competition in the global marketplace requires a future work force that is educa-tionally well-equipped. With the ever increasing impact of technology on the daily lives of individual throughout the world, skills in mathematics and science are becoming more and more critical. The TIMSS data provide a reference point from which we can begin to clarify what is meant by “world class” education.
The data provide a basis for benchmarking the performance of students in the United States and the way in which we deliver instruction. In his 1997 State of the Union Address, President Clinton challenged every community and state to adopt standards of excellence in education. As part of the President’s initiative, the United States Department of Education provided states an opportunity to administer the TIMSS mathematics and science tests and background questionnaires at the eighth grade to obtain comparisons of achievement with the TIMSS countries. Missouri and Oregon took advantage of this unique opportunity to view their mathematics and science edu-cation from an international perspective.
1
Since its inception in 1959, IEA has conducted a series of international comparative studies designed to pro-vide policy makers, educators, researchers, and practitioners with information about educational achievement and learning contexts. The previous mathematics studies were conducted in 1964 and 1980-82, and the sci-ence studies in 1970-71 and 1983-84. For information about TIMSS procedures see Appendix A.

2
I N T R O D U C T I O N
This report presents findings from the TIMSS eighth-grade mathematics assessments in Oregon and Missouri in relation to the results obtained from the TIMSS countries. A companion report,
Science Achievement in Missouri and Oregon in an International Context: 1997 TIMSS Benchmarking
, presents corresponding results about students’ science achievement as compared to the TIMSS countries.
To provide a fair and accurate comparison of mathematics and science achievement, the 1997 TIMSS Benchmarking Study was directed by the TIMSS International Study Center at Boston College using the same procedures and applying the same technical standards that were followed in the international project. Rigorous procedures were designed specifically to translate the tests, and numerous regional training sessions were held in data collection and scoring procedures. Quality control monitors observed testing sessions and sent back reports.The samples of students selected for testing were scrutinized according to rigorous standards designed to prevent bias and ensure comparability. In this publication, the countries are grouped for reporting of achievement according to their compliance with the sampling guidelines and the level of their participation rates. Prior to analysis, the data from each country were sub-jected to exhaustive checks for adherence to the international formats as well as for consistency and comparability. To enhance the utility of the state results, the proce-dures used paralleled those for the United States as closely as possible. Just as was done for the United States’ participation in TIMSS, Westat, Inc., was responsible for drawing the school sample, administering the tests and questionnaires, and preparing the data files. Following the end-of-school-year schedule used in TIMSS, the tests were administered in Missouri and Oregon in April and May of 1997.

I N T R O D U C T I O N
3
OVERVIEW OF RESULTS
Brief Summary of Results for Missouri
The average mathematics score for Missouri of 505 was comparable to the interna-tional average of the participating countries (513) and to performance by the United States (500). Compared to all participating countries, the average performance for Missouri’s grade 8 students was above that of 10 countries, equivalent to 13 countries, and below that of 18 countries. Singapore had the highest level of achievement in mathematics with Korea, Japan, and Hong Kong also among the top-performing countries.
About 7% of Missouri’s eighth graders achieved at or above the level considered to represent the top 10 percent of grade 8 students participating in TIMSS, which com-pared to 5% for the United States. There was no significant difference between the average mathematics performance of males and females in Missouri. In the content areas, Missouri performed similar to the international average in fractions, algebra, and proportionality. Missouri eighth graders were significantly above the international average in data representation. However, they had lower relative performance in geometry and measurement, performing significantly below the average of the partic-ipating countries.
Brief Summary of Results for Oregon
The average mathematics score for Oregon of 525 was not significantly different from the international average (513). However, eighth-graders in Oregon outperformed their counterparts in 17 countries, including the United States. They had performance equivalent with that of the students in 16 countries, and performed below students in 8 countries.
About 9% of Oregon’s eighth graders achieved at or above the Top 10% level of students internationally. There was no significant difference in average mathematics achievement by gender. The results in the content areas revealed that eighth-grade students in Oregon performed significantly above the international average in data representation. Oregon’s performance was approximately at the international average in fractions, geometry, algebra, measurement, and proportionality.

4
I N T R O D U C T I O N
MAJOR ASPECTS OF TIMSS
Which Countries and States Participated?
As shown in Table 1, this report compares the results for Missouri and Oregon with those of 40 countries including the United States. Because the Flemish and French educational systems in Belgium participated separately, the tables contain the results for 41 international participants as well as Oregon and Missouri. Table 2 presents information about the grades tested in the TIMSS countries and presented in this report, including the name for the grade, the years of formal schooling students had completed when they were tested for TIMSS, and the average age of students tested.
What Was the Nature of the Mathematics Test?
All countries that participated in TIMSS wished to ensure that the achievement items were appropriate for their students and reflected their current curriculum. Developing the TIMSS tests was a cooperative venture involving all of the NRCs during the entire process. Through a series of efforts, countries submitted items that were reviewed by mathematics subject-matter specialists, and additional items were written to ensure that the desired mathematics topics were covered adequately. Items were piloted, the results reviewed, and new items were written and piloted. The resulting TIMSS math-ematics test contained 151 items representing a range of mathematics topics and skills.
The TIMSS curriculum frameworks described the content dimensions for the TIMSS tests as well as performance expectations (behaviors that might be expected of stu-dents in school mathematics).
2
Six content areas are covered in the TIMSS mathe-matics test for the eighth grade. These areas and the percentage of the test items devoted to each include: fractions and number sense (34%); measurement (12%); proportionality (7%); data representation, analysis, and probability (14%); geometry (15%); and algebra (18%). The performance expectations include: knowing (22%); performing routine procedures (25%); using complex procedures (21%); and solving problems (32%).
About one-fourth of the questions were in the free-response format, requiring students to generate and write their answers. These questions, some of which required extended responses, were allotted approximately one-third of the testing time. Responses to the free-response questions were evaluated to capture diagnostic infor-mation, and some were scored using procedures that permitted partial credit.
3
2
Robitaille, D.F., McKnight, C.C., Schmidt, W.H., Britton, E.D., Raizen, S.A., and Nicol, C. (1993).
TIMSS Monograph No. 1: Curriculum Frameworks for Mathematics and Science
. Vancouver, B.C.: Pacific Educational Press.
3
TIMSS scoring reliability studies within and across countries indicate that the percent of exact agreement for correctness scores averaged well above 90%. For more details see Appendix A.
5
I N T R O D U C T I O N
Table 1Countries and States Participating in TIMSS
*The Flemish and French educational systems in Belgium participated separately.
• MISSOURI
• OREGON
• UNITED STATES
• Australia
• Austria
• Belgium*
• Bulgaria
• Canada
• Colombia
• Cyprus
• Czech Republic
• Denmark
• England
• France
• Germany
• Greece
• Hong Kong
• Hungary
• Iceland
• Iran, Islamic Republic
• Ireland
• Israel
• Japan
• Korea, Republic of
• Kuwait
• Latvia
• Lithuania
• Netherlands
• New Zealand
• Norway
• Portugal
• Romania
• Russian Federation
• Scotland
• Singapore
• Slovak Republic
• Slovenia
• South Africa
• Spain
• Sweden
• Switzerland
• Thailand

6
I N T R O D U C T I O N
Table 2Information About the Grades Tested
Country State or Country'sName for the Grade Tested
Years of Formal SchoolingIncluding the Grade Tested 1 Average Age of Students
UNITED STATES 8 8 14.2
MISSOURI 8 8 14.6
OREGON 8 8 14.42 Australia 8 or 9 8 or 9 14.2
Austria 4. Klasse 8 14.3
Belgium (Fl) 2A & 2P 8 14.1
Belgium (Fr) 2A & 2P 8 14.3
Bulgaria 8 8 14.0
Canada 8 8 14.1
Colombia 8 8 15.7
Cyprus 8 8 13.7
Czech Republic 8 8 14.4
Denmark 7 7 13.9
England Year 9 9 14.0
France 4ème (90%) or 4èmeTechnologique (10%)
8 14.3
Germany 8 8 14.8
Greece Secondary 2 8 13.6
Hong Kong Secondary 2 8 14.2
Hungary 8 8 14.3
Iceland 8 8 13.6
Iran, Islamic Rep. 8 8 14.6
Ireland 2nd Year 8 14.4
Israel 8 8 14.1
Japan 2nd Grade Lower Secondary 8 14.4
Korea, Republic of 2nd Grade Middle School 8 14.2
Kuwait 9 9 15.3
Latvia 8 8 14.3
Lithuania 8 8 14.3
Netherlands Secondary 2 8 14.33 New Zealand Form 3 8.5 - 9.5 14.0
Norway 7 7 13.9
Philippines 1st Year High School 7 -
Portugal Grade 8 8 14.5
Romania 8 8 14.64 Russian Federation 8 7 or 8 14.0
Scotland Secondary 2 9 13.7
Singapore Secondary 2 8 14.5
Slovak Republic 8 8 14.3
Slovenia 8 8 14.8
Spain 8 EGB 8 14.3
South Africa Standard 6 8 15.4
Sweden 7 7 13.9
Switzerland 14.2
(German) 7 7 -
(French and Italian) 8 8 -
Thailand Secondary 2 8 14.31Years of schooling based on the number of years children in the grade level have been in formal schooling, beginning with primary education (International Standard Classification of Education Level 1). Does not include preprimary education.2Australia: Each state/territory has its own policy regarding age of entry to primary school. In 4 of the 8 states/territories students were sampled from grades 7 and 8; in the other four states/territories students were sampled from grades 8 and 9. 3New Zealand: The majority of students begin primary school on or near their 5th birthday so the "years of formal schooling" vary.4Russian Federation: 70% of students in the seventh grade have had 6 years of formal schooling; 70% in the eighth grade have had 7 years of formal schooling.
SO
UR
CE
: IE
A T
hird
Inte
rnat
iona
l Mat
hem
atic
s an
d S
cien
ce S
tudy
(T
IMS
S),
199
4-95
. M
isso
uri a
nd O
rego
n da
ta c
olle
cted
in 1
997.
I N T R O D U C T I O N
7
The tests were given so that no one student took all of the items, which would have required more than three hours. Instead, the test was assembled in eight booklets, each requiring 90 minutes to complete. Each student took only one booklet, and the items were rotated through the booklets so that each item was answered by a representative sample of students.
How Does TIMSS Document Compliance with Sampling Guidelines?
TIMSS developed procedures and guidelines to ensure that the national samples were of the highest quality possible. Standards for coverage of the target population, partic-ipation rates, and the age of students were established as were clearly documented procedures on how to obtain the samples. The TIMSS target population was defined as students in the two adjacent grades with the most 13-year-olds at the time of testing, the seventh and eighth grades in most countries – including the United States. Because it was the upper grade tested in the United States and most countries, grade 8 was selected for the TIMSS Benchmarking Study and both Missouri and Oregon defined the target population as students attending eighth-grade public schools. The United States and the other TIMSS participating countries included both public and private schools. In Oregon, 7% of the eighth-grade students attended private schools and in Missouri 14% attended private schools.
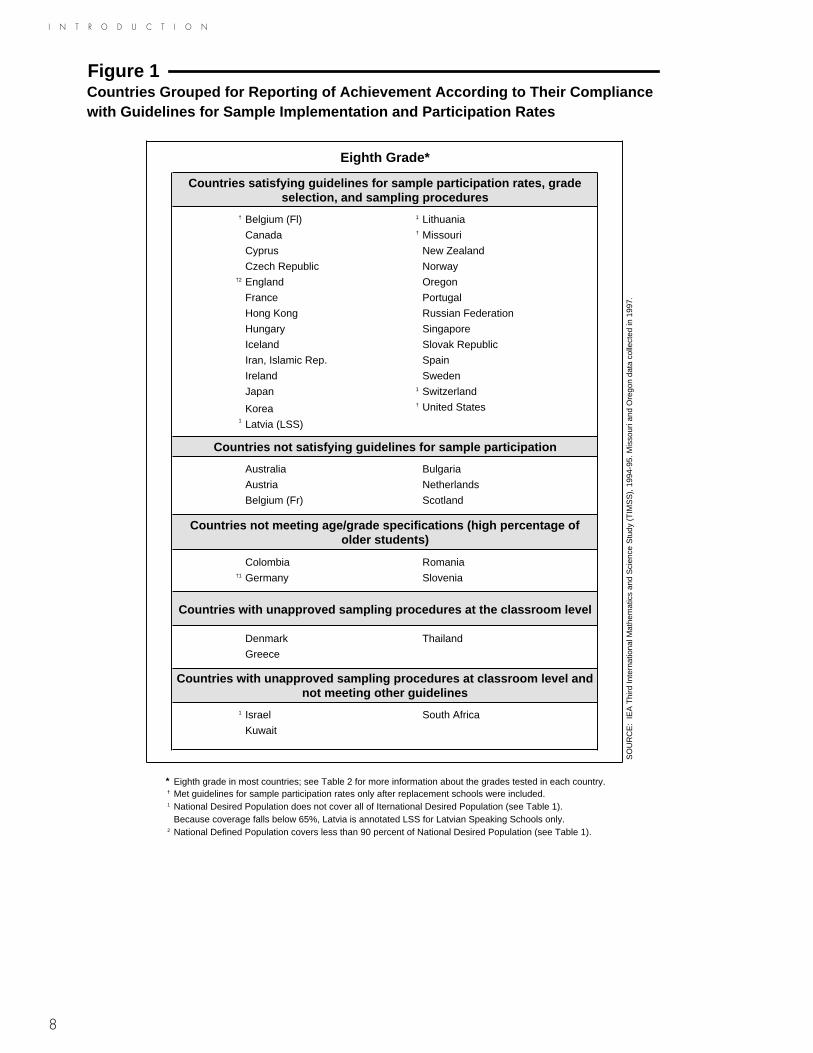
For the most part, the national samples were drawn in accordance with the TIMSS standards, and achievement results can be compared with confidence. However, despite efforts to meet the TIMSS specifications, some countries did not do so. Figure 1 shows how the states and countries have been grouped in tables reporting achievement results. An acceptable participation rate was either 85% for both the schools and students, or a combined rate (the product of school and student participation) of 75% – with or without replacement schools. Countries that achieved acceptable participation rates, and that complied with the TIMSS guidelines for grade selection and classroom sam-pling are shown in the first panel of Figure 1. Missouri and Oregon both achieved acceptable participation rates, however, Missouri met sample participation guidelines only after the replacement schools were included. Both states satisfied the TIMSS guidelines for grade selection and classroom sampling.
Countries not reaching at least 50% school participation without the use of replace-ment schools, or that failed to reach the sampling participation standard even with the inclusion of replacement schools, are shown in the second panel of Figure 1. These countries are presented in a separate section of the achievement tables in Chapters 1, 2, and 3 in alphabetical order, and are shown in tables in Chapters 4 and 5 in italics.
8
I N T R O D U C T I O N
Figure 1Countries Grouped for Reporting of Achievement According to Their Compliance with Guidelines for Sample Implementation and Participation Rates
Eighth Grade*
Countries satisfying guidelines for sample participation rates, grade selection, and sampling procedures
† Belgium (Fl) 1 Lithuania Canada † Missouri Cyprus New Zealand Czech Republic Norway
†2 England Oregon France Portugal Hong Kong Russian Federation Hungary Singapore Iceland Slovak Republic Iran, Islamic Rep. Spain Ireland Sweden Japan 1 Switzerland Korea † United States
1 Latvia (LSS)
Countries not satisfying guidelines for sample participation Australia Bulgaria Austria Netherlands Belgium (Fr) Scotland
Countries not meeting age/grade specifications (high percentage of older students)
Colombia Romania†1 Germany Slovenia
Countries with unapproved sampling procedures at the classroom level
Denmark Thailand Greece
Countries with unapproved sampling procedures at classroom level and not meeting other guidelines
1 Israel South Africa Kuwait
* Eighth grade in most countries; see Table 2 for more information about the grades tested in each country.† Met guidelines for sample participation rates only after replacement schools were included.1 National Desired Population does not cover all of Iternational Desired Population (see Table 1).
Because coverage falls below 65%, Latvia is annotated LSS for Latvian Speaking Schools only.2 National Defined Population covers less than 90 percent of National Desired Population (see Table 1).
SO
UR
CE
: IE
A T
hird
Inte
rnat
iona
l Mat
hem
atic
s an
d S
cien
ce S
tudy
(T
IMS
S),
199
4-95
. Mis
sour
i and
Ore
gon
data
col
lect
ed in
199
7.

I N T R O D U C T I O N
9
To provide a better curricular match, four countries (i.e., Colombia, Germany, Romania, and Slovenia), elected to test their seventh- and eighth-grade students even though that meant not testing the two grades with the most 13-year olds. This led to their students being somewhat older than in the other countries and states. These countries are also presented in a separate section of the achievement tables in Chapters 1, 2, and 3 in alphabetical order, and are shown in tables in Chapters 4 and 5 in italics.
For a variety of reasons, three countries (Denmark, Greece, and Thailand) did not comply with the guidelines for sampling classrooms. Their results are also presented in a separate section of the achievement tables in Chapters 1, 2, and 3 in alphabetical order, and are italicized in tables in Chapters 4 and 5. At the eighth grade, Israel, Kuwait, and South Africa also had difficulty complying with the classroom selection guidelines, but in addition had other difficulties (Kuwait tested a single grade with rel-atively few 13-year-olds; Israel and South Africa had low sampling participation rates), and so these countries are also presented in separate sections in tables in Chapters 1, 2, and 3, and are italicized in tables in Chapters 4 and 5.

10
C H A P T E R 1
11
Chapter 1
M
ATHEMATICS
A
CHIEVEMENT
IN
AN
I
NTERNATIONAL
CONTEXT
Chapter 1 summarizes the mathematics achievement of the TIMSS countries and the states of Missouri and Oregon. Results are provided overall and by gender for the eighth grade public-school students in Oregon and Missouri and students in the upper grade of the TIMSS target population in 41 countries.
1
This was the eighth grade in the United States and in many other countries, but by virtue of the organization of their educational systems several countries tested in either the seventh or ninth grades (see Table 2).
How Did Missouri and Oregon Perform Compared with the TIMSS Countries?
Table 1.1 presents the mean (or average) mathematics achievement for the United States, Missouri, Oregon, and for the 40 other countries participating in TIMSS at the eighth grade.
2
Missouri and Oregon and the 25 countries shown by decreasing order of mean achievement in the upper part of the table were judged to have met the TIMSS requirements for testing a representative sample of students.
3
The means for Missouri (505) and Oregon (525) and for each country can be com-pared with the international average of 513, which represents the average across the means for each of the 41 international participants shown in the table. A triangle pointing up next to the mean indicates that performance was significantly higher than the international average, while a triangle pointing down indicates that performance was significantly lower. A bullet next to the mean indicates the mean was not significantly different from the international average. As can be seen from the results, Missouri and Oregon performed similar to the international average as did the United States.
1
The TIMSS target population was defined as students in the two grades with the most 13-year-olds at the time of testing.
2
TIMSS used item response theory (IRT) methods to summarize the achievement results for both grades of the TIMSS target population (seventh and eighth grades in most TIMSS countries) on a scale with a mean of 500 and a standard deviation of 100. Scaling averages students’ responses to the subsets of items they took in a way that accounts for differences in the difficulty of those items. It allows students’ performance to be summa-rized on a common metric even though individual students responded to different items in the mathematics test. For more detailed information, see the “IRT Scaling and Data Analysis” section of Appendix A.
3
Although all countries tried very hard to meet the TIMSS sampling requirements, several encountered resis-tance from schools and teachers. Several participants, including the United States and the state of Missouri, met the sample participation rates only after replacement schools were included, and are annotated for this reason. The countries shown “below the line” did not have participation of 85% or higher as specified in the TIMSS guidelines, even with the use of replacement schools (i.e., Australia, Austria, Belgium (French), Bulgaria, the Netherlands, and Scotland). To provide a better curricular match, four countries (i.e., Colombia, Germany, Romania, and Slovenia) elected to test their eighth-grade students even though that led to their students being somewhat older than those in the other countries. The countries in the remaining two categories encountered various degrees of difficulty in implementing the prescribed methods for sampling classrooms within schools. A full discussion of the sampling procedures and outcomes for each country can be found in Appendix A.

12
C H A P T E R 1
Table 1.1Distributions of Mathematics Achievement: Eighth Grade*
Country Mean Mathematics Achievement Scale Score
Singapore ▲ 643 (4.9) Korea ▲ 607 (2.4) Japan ▲ 605 (1.9) Hong Kong ▲ 588 (6.5)‡ Belgium (Fl) ▲ 565 (5.7) Czech Republic ▲ 564 (4.9) Slovak Republic ▲ 547 (3.3)‡ Switzerland ▲ 545 (2.8)‡ France ▲ 538 (2.9) Hungary ▲ 537 (3.2) Russian Federation ▲ 535 (5.3) Ireland ● 527 (5.1) Canada ▲ 527 (2.4) OREGON ● 525 (4.8) Sweden ● 519 (3.0) New Zealand ● 508 (4.5)‡ England ● 506 (2.6)‡ MISSOURI ● 505 (4.8) Norway ▼ 503 (2.2)‡ UNITED STATES ● 500 (4.6)‡ Latvia (LSS) ▼ 493 (3.1) Spain ▼ 487 (2.0) Iceland ▼ 487 (4.5)‡ Lithuania ▼ 477 (3.5) Cyprus ▼ 474 (1.9) Portugal ▼ 454 (2.5) Iran, Islamic Rep. ▼ 428 (2.2)
Countries Not Satisfying Guidelines for Sample Participation Rates (See Appendix A for Details): Australia ▲ 530 (4.0) Austria ▲ 539 (3.0) Belgium (Fr) ▲ 526 (3.4) Bulgaria ▲ 540 (6.3) Netherlands ▲ 541 (6.7) Scotland ● 499 (5.5)
Countries Not Meeting Age/Grade Specifications (High Percentage of Older Students; See Appendix A for Details): Colombia ▼ 385 (3.4)‡ Germany ● 509 (4.5) Romania ▼ 482 (4.0) Slovenia ▲ 541 (3.1)
Countries With Unapproved Sampling Procedures at Classroom Level (See Appendix A for Details): Denmark ▼ 502 (2.8) Greece ▼ 484 (3.1) Thailand ● 522 (5.7)
Unapproved Sampling Procedures at Classroom Level and Not Meeting Other Guidelines (See Appendix A for Details):‡ Israel ● 522 (6.2) Kuwait ▼ 392 (2.5) South Africa ▼ 354 (4.4)
513
*Eighth grade in most countries; see Table 2 for information about the grades tested in each country.‡Did not meet sampling guidelines for population coverage or use of replacement schools. See Figure 1.( ) Standard errors appear in parentheses. Because results are rounded to the nearest whole number, some totals may appear inconsistent.
SO
UR
CE
: IE
A T
hird
Inte
rnat
iona
l Mat
hem
atic
s an
d S
cien
ce S
tudy
(T
IMS
S),
199
4-95
. Mis
sour
i and
Ore
gon
data
col
lect
ed in
199
7.
200 250 300 350 400 450 500 550 600 650 700 750 800
International Average =(Average of all Country Means. Does not
include Missouri and Oregon)
5th 25th 75th 95th
Mean and Confidence Interval (±2SE)
Percentiles of Performance
▲ = Country/ state mean significantly higher than international average
▼ = Country/ state mean significantly lower than international average
● = No statistically significant difference between country/state mean and international average
Statistically significant at .05 level, adjusted for multiple comparisons.

13
C H A P T E R 1
Figure 1.1Countries' Average Mathematics Performance at Eighth Grade* Compared
with Missouri and Oregon
Comparison withMISSOURI
Comparison withOREGON
Country MeanScale Score Country Mean
Scale Score
Singapore 643 (4.9) Singapore 643 (4.9) Korea 607 (2.4) Korea 607 (2.4) Japan 605 (1.9) Japan 605 (1.9) Hong Kong 588 (6.5) Hong Kong 588 (6.5) Belgium (Fl) 565 (5.7) Belgium (Fl) 565 (5.7) Czech Republic 564 (4.9) Czech Republic 564 (4.9) Slovak Republic 547 (3.3) Slovak Republic 547 (3.3) Switzerland 545 (2.8) Switzerland 545 (2.8) Slovenia 541 (3.1) Slovenia 541 (3.1) Netherlands 541 (6.7) Netherlands 541 (6.7) Bulgaria 540 (6.3) Bulgaria 540 (6.3) Austria 539 (3.0) Austria 539 (3.0) France 538 (2.9) France 538 (2.9) Hungary 537 (3.2) Hungary 537 (3.2) Russian Federation 535 (5.3) Russian Federation 535 (5.3) Australia 530 (4.0) Australia 530 (4.0) Canada 527 (2.4) Canada 527 (2.4) Belgium (Fr) 526 (3.4) Ireland 527 (5.1) Ireland 527 (5.1) Belgium (Fr) 526 (3.4) Thailand 522 (5.7) OREGON OREGON 525 (4.8) Israel 522 (6.2) 525 Thailand 522 (5.7) Sweden 519 (3.0) Israel 522 (6.2) Germany 509 (4.5) Sweden 519 (3.0) New Zealand 508 (4.5) Germany 509 (4.5) England 506 (2.6) New Zealand 508 (4.5) MISSOURI 505 (4.8) MISSOURI England 506 (2.6) Norway 503 (2.2) 505 Norway 503 (2.2) Denmark 502 (2.8) Denmark 502 (2.8) UNITED STATES 500 (4.6) UNITED STATES 500 (4.6) Scotland 499 (5.5) Scotland 499 (5.5) Latvia (LSS) 493 (3.1) Latvia (LSS) 493 (3.1) Iceland 487 (4.5) Iceland 487 (4.5) Spain 487 (2.0) Spain 487 (2.0) Greece 484 (3.1) Greece 484 (3.1) Romania 482 (4.0) Romania 482 (4.0) Lithuania 477 (3.5) Lithuania 477 (3.5) Cyprus 474 (1.9) Cyprus 474 (1.9) Portugal 454 (2.5) Portugal 454 (2.5) Iran, Islamic Rep. 428 (2.2) Iran, Islamic Rep. 428 (2.2) Kuwait 392 (2.5) Kuwait 392 (2.5) Colombia 385 (3.4) Colombia 385 (3.4) South Africa 354 (4.4) South Africa 354 (4.4)
*Eighth grade in most countries; see Table 2 for information about the grades tested in each country.Countries shown in italics did not satisfy one or more guidelines for sample participation rates or student sampling (see Figure 1).( ) Standard errors appear in parentheses. Because results are rounded to the nearest whole number, some totals may appear inconsistent.
Not Significantly Different from State Average
Significantly Higher thanState Average
Significantly Lower than State Average
SO
UR
CE
: IE
A T
hird
Inte
rnat
iona
l Mat
hem
atic
s an
d S
cien
ce S
tudy
(T
IMS
S),
199
4-95
. Mis
sour
i and
Ore
gon
data
col
lect
ed in
199
7.

14
C H A P T E R 1
Among the countries meeting the TIMSS sampling guidelines, Singapore had the highest performance, with Korea, Japan, Hong Kong, Belgium (Flemish), and the Czech Republic also performing very well.
To illustrate the broad range of achievement both across and within countries, Table 1.1 also provides a visual representation of the distribution of student performance within each country. Achievement for each country is shown for the 25th and 75th percentiles as well as for the 5th and 95th percentiles. The range between the 25th and 75th per-centiles represents performance by the middle half of the students. In contrast, perfor-mance at the 5th and 95th percentiles represents the extremes in both lower and higher achievement. The dark boxes at the midpoints of the distributions show the 95% con-fidence intervals around the average achievement in each country.
In general, the results reveal substantial differences in average mathematics achieve-ment between the top- and bottom-performing countries, although most countries had achievement somewhere in the middle ranges. Also, the differences between the extremes in performance were very large within most countries as well as in Missouri and Oregon. Comparisons across countries reveal that performance of the average stu-dents in Oregon and Missouri was comparable to that of below average students (5th to 25th percentiles) in Singapore, Korea, and Japan. The best performing students (75th to 95th percentiles) were comparable to average performing students in those Asian countries.
Because the precise mean score of each TIMSS participant cannot be determined with perfect accuracy, to fairly compare Missouri and Oregon to the TIMSS countries the nations have been grouped into broad bands according to whether their performance was higher than, not significantly different from, or lower than Missouri and Oregon, respectively. These results are presented in Figure 1.1 for Missouri (first panel) and Oregon (second panel).
Students in 18 countries outperformed the public-school eighth graders in Missouri. Students in 13 countries – including the United States – did not perform significantly different than those in Missouri, and Missouri students outperformed the students in 10 countries. The public-school eighth graders in Oregon were outperformed by stu-dents in 8 countries, performance was not statistically different in 16 countries, and performance was statistically higher than 17 countries, including the United States.
C H A P T E R 1
15
What Are the Differences in Performance Compared to Three Marker Levels of International Mathematics Achievement?
Table 1.2 portrays performance in terms of international levels of achievement for the eighth grade. This table presents the percentage of students in each country reaching each of three international marker levels, or benchmarks. Since the TIMSS achievement tests do not have any pre-specified performance standards, three marker levels were chosen on the basis of the combined performance of all students at a grade level in the study — the Top 10%, the Top Quarter (25%), and the Top Half (50%). For example, Table 1.2 shows that 10% of all eighth graders in countries participating in the TIMSS study achieved at the level of 656 or better. This score point, then, was des-ignated as the marker level for the Top 10%. Similarly, the Top Quarter marker level was determined as 587 and the Top Half marker level as 509.
If every country had the same distribution of high-, medium-, and low-performing stu-dents, then each country would be expected to have approximately 10% of its students reaching the Top 10% level, 25% reaching the Top Quarter level, and 50% reaching the Top Half level. Although no country achieved exactly this pattern, the data in Table 1.2 indicate that Oregon came close to the international norm, with 9%, 27%, and 55% reaching the marker levels. In Missouri, students fell just short of the international levels, with 7%, 21%, and 46% of the students reaching the levels, respectively. The corresponding figures for the United States were 5% performing at the Top 10% level, 18% at or above the Top Quarter level, and 45% at or above the Top Half level. In con-trast, 45% of the students in Singapore reached the Top 10% level, 74% reached the Top Quarter level, and 94% performed at or above the Top Half level.

16
C H A P T E R 1
Table 1.2Percentages of Students Achieving International Marker Levels in Mathematics
Eighth Grade*
Country Top 10% Level
Top Quarter Level
Top Half Level
Percent Reaching International Levels
Singapore 45 (2.5) 74 (2.1) 94 (0.8) Korea 34 (1.1) 58 (1.0) 82 (0.8) Japan 32 (0.8) 58 (0.9) 83 (0.6) Hong Kong 27 (2.1) 53 (2.6) 80 (2.4) Czech Republic 18 (1.9) 39 (2.3) 70 (1.9)‡ Belgium (Fl) 17 (1.2) 41 (2.3) 73 (2.9) Slovak Republic 12 (1.0) 33 (1.5) 64 (1.6) Hungary 11 (0.8) 29 (1.3) 60 (1.6)‡ Switzerland 11 (0.7) 33 (1.2) 65 (1.4) Russian Federation 10 (0.7) 29 (2.4) 60 (2.6) OREGON 9 (1.1) 27 (1.7) 55 (2.1) Ireland 9 (1.0) 27 (1.9) 57 (2.4)‡ MISSOURI 7 (0.7) 21 (1.6) 46 (2.1) Canada 7 (0.7) 25 (1.1) 58 (1.2)‡ France 7 (0.8) 26 (1.5) 63 (1.5)‡ England 7 (0.6) 20 (1.1) 48 (1.4) New Zealand 6 (0.8) 20 (1.6) 48 (2.2) Sweden 5 (0.5) 22 (1.2) 53 (1.5)‡ UNITED STATES 5 (0.6) 18 (1.5) 45 (2.3) Norway 4 (0.4) 17 (0.9) 46 (1.2)‡ Latvia (LSS) 3 (0.5) 14 (1.2) 40 (1.5) Cyprus 2 (0.3) 11 (0.6) 34 (1.1) Spain 2 (0.2) 10 (0.7) 36 (1.2) Iceland 1 (0.3) 10 (1.3) 37 (2.9)‡ Lithuania 1 (0.3) 10 (1.0) 34 (1.8) Portugal 0 (0.1) 2 (0.4) 19 (1.3) Iran, Islamic Rep. 0 (0.0) 0 (0.2) 9 (0.8)Countries Not Satisfying Guidelines for Sample Participation Rates (See Appendix A for Details): Australia 11 (0.9) 29 (1.5) 57 (1.7) Austria 11 (0.7) 31 (1.3) 61 (1.4) Belgium (Fr) 6 (0.6) 25 (1.5) 58 (1.7) Bulgaria 16 (1.9) 33 (2.7) 57 (2.7) Netherlands 10 (1.6) 30 (2.7) 63 (3.2) Scotland 5 (0.9) 17 (2.1) 44 (2.7)Countries Not Meeting Age/Grade Specifications (High Percentage of Older Students; See Appendix A for Details): Colombia 0 (0.0) 1 (0.3) 4 (0.8)‡ Germany 6 (0.7) 20 (1.7) 49 (2.3) Romania 3 (0.4) 13 (1.1) 36 (2.0) Slovenia 11 (0.7) 31 (1.4) 61 (1.5)Countries With Unapproved Sampling Procedures at Classroom Level (See Appendix A for Details): Denmark 4 (0.5) 17 (1.0) 47 (1.6) Greece 3 (0.4) 13 (0.8) 37 (1.5) Thailand 7 (1.2) 23 (2.6) 54 (2.7)Unapproved Sampling Procedures at Classroom Level and Not Meeting Other Guidelines (See Appendix A for Details):‡ Israel 6 (0.9) 24 (2.5) 56 (2.6) Kuwait 0 (0.0) 0 (0.1) 3 (0.5) South Africa 0 (0.0) 0 (0.0) 2 (0.9)
*Eighth grade in most countries; see Table 2 for information about the grades tested in each country.‡Did not meet sampling guidelines for population coverage or use of replacement schools. See Figure 1.( ) Standard errors appear in parentheses. Because results are rounded to the nearest whole number, some differences may appear inconsistent.
The international levels correspond to the percentiles computed from the combined data from all of the participating countries.
Top 10% Level (90th Percentile) = 656 Top Quarter Level (75th Percentile) = 587 Top Half Level (50th Percentile) = 509
Percent Reaching Top Half
Level
Percent Reaching Top Quarter Level
Percent Reaching Top 10%
Level
0 25 50 75 100
SO
UR
CE
: IE
A T
hird
Inte
rnat
iona
l Mat
hem
atic
s an
d S
cien
ce S
tudy
(T
IMS
S),
199
4-95
. Mis
sour
i nd
Ore
gon
data
col
lect
ed in
199
7.

C H A P T E R 1
17
What Are the Gender Differences in Mathematics Achievement?
Table 1.3, showing the differences in achievement by gender, reveals that girls and boys had approximately the same average mathematics achievement in both Missouri and Oregon. This is similar to the pattern shown by most countries, including the United States. However, the differences in achievement that did exist in some coun-tries tended to favor boys rather than girls.
The table presents mean mathematics achievement separately for boys and girls for each country, as well as the difference between the means. The visual representation of the gender difference for each country, shown by a bar, indicates the amount of the difference, whether the direction of the difference favors girls or boys, and whether or not the difference is statistically significant (indicated by a darkened bar). Regardless of their directions, about three-fourths of the differences were not statistically signif-icant, indicating that, for most countries, gender differences in mathematics achievement generally are small or negligible in the middle years of schooling. That is, nearly three-quarters of the differences favoring boys at the eighth grade were not statistically significant. Also, girls had higher mean achievement than boys in eight countries and in Missouri, even though those results were not statistically significant either. From another perspective, however, all the statistically significant differences favored boys rather than girls. Boys had significantly higher mathematics achievement than girls in Japan, Spain, Portugal, Iran, Korea, Denmark, Greece, and Israel.

18
C H A P T E R 1
Table 1.3Gender Differences in Mathematics Achievement: Eighth Grade*
Country Boys Mean Girls Mean Difference Absolute Value
Gender Difference
Hungary 537 (3.6) 537 (3.6) 0 (5.1) ‡ Lithuania 477 (4.0) 478 (4.1) 1 (5.7) ‡ MISSOURI 504 (5.5) 505 (4.3) 1 (7.0) Russian Federation 535 (6.3) 536 (5.0) 1 (8.0) Iceland 488 (5.5) 486 (5.6) 2 (7.8) Sweden 520 (3.6) 518 (3.1) 2 (4.7) Singapore 642 (6.3) 645 (5.4) 2 (8.3) Cyprus 472 (2.8) 475 (2.5) 3 (3.7) Canada 526 (3.2) 530 (2.7) 4 (4.2) Slovak Republic 549 (3.7) 545 (3.6) 4 (5.2) Norway 505 (2.8) 501 (2.7) 4 (3.9) ‡ Belgium (Fl) 563 (8.8) 567 (7.4) 4 (11.5) ‡ England 508 (5.1) 504 (3.5) 4 (6.2) OREGON 527 (5.1) 523 (5.0) 4 (7.1) ‡ Latvia (LSS) 496 (3.8) 491 (3.5) 4 (5.2) ‡ UNITED STATES 502 (5.2) 497 (4.5) 5 (6.9) ‡ Switzerland 548 (3.5) 543 (3.1) 5 (4.7) ‡ France 542 (3.1) 536 (3.8) 6 (4.9) Japan 609 (2.6) 600 (2.1) 9 (3.3) New Zealand 512 (5.9) 503 (5.3) 9 (7.9) Spain 492 (2.5) 483 (2.6) 10 (3.6) Czech Republic 569 (4.5) 558 (6.3) 11 (7.7) Portugal 460 (2.8) 449 (2.7) 11 (3.9) Iran, Islamic Rep. 434 (2.9) 421 (3.3) 13 (4.4) Ireland 535 (7.2) 520 (6.0) 14 (9.3) Korea 615 (3.2) 598 (3.4) 17 (4.7) Hong Kong 597 (7.7) 577 (7.7) 20 (10.9)
Countries Not Satisfying Guidelines for Sample Participation Rates (See Appendix A for Details): Australia 527 (5.1) 532 (4.6) 5 (6.9) Austria 544 (3.2) 536 (4.5) 8 (5.6) Belgium (Fr) 530 (4.7) 524 (3.7) 6 (6.0) Netherlands 545 (7.8) 536 (6.4) 8 (10.1) Scotland 506 (6.6) 490 (5.3) 16 (8.5)
Countries Not Meeting Age/Grade Specifications (High Percentage of Older Students; See Appendix A for Details): Colombia 386 (6.9) 384 (3.6) 2 (7.7) ‡ Germany 512 (5.1) 509 (5.0) 3 (7.1) Romania 483 (4.8) 480 (4.0) 3 (6.2) Slovenia 545 (3.8) 537 (3.3) 8 (5.0)
Countries With Unapproved Sampling Procedures at Classroom Level (See Appendix A for Details): Denmark 511 (3.2) 494 (3.4) 17 (4.7) Greece 490 (3.7) 478 (3.1) 12 (4.8) Thailand 517 (5.6) 526 (7.0) 9 (9.0)
Unapproved Sampling Procedures at Classroom Level and Not Meeting Other Guidelines (See Appendix A for Details):‡ Israel 539 (6.6) 509 (6.9) 29 (9.6) South Africa 360 (6.3) 349 (4.1) 11 (7.5)
Boys Girls Difference
519 512 8
*Eighth grade in most countries; see Table 2 for information about the grades tested in each country.‡Did not meet sampling guidelines for population coverage or use of replacement schools. See Figure 1.( ) Standard errors appear in parentheses. Because results are rounded to the nearest whole number, some totals may appear inconsistent.
GirlsScoreHigher
BoysScoreHigher
5 0 5 25 351515
Gender difference statistically significant at .05 level.
Gender difference not statistically significant.
International Averages
(Averages of all country means. Does not include Missouri and Oregon)
SO
UR
CE
: IE
A T
hird
Inte
rnat
iona
l Mat
hem
atic
s an
d S
cien
ce S
tudy
(T
IMS
S),
199
4-95
. Mis
sour
i and
Ore
gon
data
col
lect
ed in
199
7.
C H A P T E R 2
19
Chapter 2
A
VERAGE
ACHIEVEMENT
IN
M
ATHEMATICS
C
ONTENT
A
REAS
Recognizing that important curricular differences exist between and within countries is an important aspect of IEA studies, TIMSS attempted to measure achievement in different areas within mathematics that would be useful in relating achievement to curriculum. After much deliberation, the mathematics test for the eighth grade was designed to enable reporting by six content areas. These six content areas include:
• fractions and number sense• geometry• algebra• data representation, analysis, and probability• measurement• proportionality
This chapter describes differences in average achievement in mathematics content areas for Missouri and Oregon as compared to the TIMSS countries. Chapter 3 con-tains further information about the types of items within each content area, including a range of five or six example items within each content area and the percent of correct responses on those items for each of the TIMSS participants.
How Does Achievement Differ Across Mathematics Content Areas?
As we have seen in Chapter 1, there are substantial differences in achievement among the participating countries on the TIMSS mathematics test. Given that the mathematics test was designed to include items from different curricular areas, it is important to examine whether or not Missouri and Oregon have particular strengths and weak-nesses in their achievement in these content areas. Table 2.1 provides an analysis based on the average percent of correct responses to items within each content area to address the question of how well Missouri and Oregon performed in each mathe-matics content area in relation to the TIMSS countries.
The results for the average percent across all mathematics items are provided for each country and Missouri and Oregon primarily to provide a basis of comparison for per-formance in each of the content areas. For the purpose of comparing overall achievement between participants, it is preferable to use the results presented in Chapter 1. It is interesting to note, however, that even though the relative standings of countries differ somewhat from Table 1.1, the slight differences are well within the limits expected by sampling error and can be attributed to the differences in the methodologies used.

20
C H A P T E R 2
Table 2.1Average Percent Correct by Mathematics Content Areas: Eighth Grade*
Country
Mathematics Overall
Fractions & Number Sense
Geometry Algebra
Data Representa-
tion, Analysis & Probability
Measurement Proportion-ality
(151 items) (51 items) (23 items) (27 items) (21 items) (18 items) (11 items ) Singapore ▲ 79 (0.9) ▲ 84 (0.8) ▲ 76 (1.0) ▲ 76 (1.1) ▲ 79 (0.8) ▲ 77 (1.0) ▲ 75 (1.0) Japan ▲ 73 (0.4) ▲ 75 (0.4) ▲ 80 (0.4) ▲ 72 (0.6) ▲ 78 (0.4) ▲ 67 (0.5) ▲ 61 (0.5) Korea ▲ 72 (0.5) ▲ 74 (0.5) ▲ 75 (0.6) ▲ 69 (0.6) ▲ 78 (0.6) ▲ 66 (0.7) ▲ 62 (0.6) Hong Kong ▲ 70 (1.4) ▲ 72 (1.4) ▲ 73 (1.5) ▲ 70 (1.5) ▲ 72 (1.3) ▲ 65 (1.7) ▲ 62 (1.4)‡ Belgium (Fl) ▲ 66 (1.4) ▲ 71 (1.2) ▲ 64 (1.5) ▲ 63 (1.7) ▲ 73 (1.3) ▲ 60 (1.3) ▲ 53 (1.8) Czech Republic ▲ 66 (1.1) ▲ 69 (1.1) ▲ 66 (1.1) ▲ 65 (1.3) ▲ 68 (0.9) ▲ 62 (1.2) ▲ 52 (1.3) Slovak Republic ▲ 62 (0.8) ▲ 66 (0.8) ▲ 63 (0.8) ▲ 62 (0.9) ● 62 (0.7) ▲ 60 (0.9) ▲ 49 (1.0)‡ Switzerland ▲ 62 (0.6) ▲ 67 (0.7) ▲ 60 (0.8) ● 53 (0.7) ▲ 72 (0.7) ▲ 61 (0.8) ▲ 52 (0.7) Hungary ▲ 62 (0.7) ▲ 65 (0.8) ▲ 60 (0.8) ▲ 63 (0.9) ▲ 66 (0.7) ▲ 56 (0.8) ● 47 (0.9)‡ France ▲ 61 (0.8) ▲ 64 (0.8) ▲ 66 (0.8) ● 54 (1.0) ▲ 71 (0.8) ▲ 57 (0.9) ▲ 49 (0.9) Russian Federation ▲ 60 (1.3) ▲ 62 (1.2) ▲ 63 (1.4) ▲ 63 (1.5) ● 60 (1.2) ▲ 56 (1.5) ● 48 (1.5) Canada ▲ 59 (0.5) ▲ 64 (0.6) ● 58 (0.6) ● 54 (0.7) ▲ 69 (0.5) ● 51 (0.7) ▲ 48 (0.7) Ireland ● 59 (1.2) ▲ 65 (1.2) ▼ 51 (1.3) ● 53 (1.3) ▲ 69 (1.1) ● 53 (1.3) ▲ 51 (1.2) OREGON ● 57 (1.0) ● 61 (1.1) ● 55 (1.0) ● 56 (1.3) ▲ 70 (1.0) ● 47 (1.2) ● 46 (0.9) Sweden ● 56 (0.7) ▲ 62 (0.8) ▼ 48 (0.7) ▼ 44 (0.9) ▲ 70 (0.7) ▲ 56 (0.9) ● 44 (0.9) New Zealand ● 54 (1.0) ● 56 (1.1) ● 54 (1.1) ● 49 (1.1) ▲ 66 (1.0) ● 48 (1.2) ● 42 (1.0) Norway ● 54 (0.5) ● 58 (0.6) ▼ 51 (0.6) ▼ 45 (0.7) ▲ 66 (0.6) ● 51 (0.6) ▼ 40 (0.6)‡ England ● 53 (0.7) ▼ 54 (0.8) ● 54 (1.0) ▼ 49 (0.9) ▲ 66 (0.7) ● 50 (0.9) ● 41 (1.1)‡ UNITED STATES ● 53 (1.1) ● 59 (1.1) ▼ 48 (1.2) ● 51 (1.2) ● 65 (1.1) ▼ 40 (1.1) ● 42 (1.1)‡ MISSOURI ● 53 (1.1) ● 59 (1.2) ▼ 49 (1.3) ● 51 (1.4) ▲ 66 (1.0) ▼ 42 (1.2) ● 42 (1.0)‡ Latvia (LSS) ▼ 51 (0.8) ▼ 53 (0.9) ● 57 (0.8) ● 51 (0.9) ▼ 56 (0.8) ▼ 47 (0.9) ▼ 39 (0.9) Spain ▼ 51 (0.5) ▼ 52 (0.5) ▼ 49 (0.6) ● 54 (0.8) ▼ 60 (0.7) ▼ 44 (0.7) ▼ 40 (0.8) Iceland ▼ 50 (1.1) ● 54 (1.2) ▼ 51 (1.4) ▼ 40 (1.3) ● 63 (1.1) ▼ 45 (1.4) ▼ 38 (1.4)‡ Lithuania ▼ 48 (0.9) ▼ 51 (1.0) ● 53 (1.1) ▼ 47 (1.2) ▼ 52 (1.0) ▼ 43 (0.9) ▼ 35 (0.9) Cyprus ▼ 48 (0.5) ▼ 50 (0.6) ▼ 47 (0.6) ▼ 48 (0.7) ▼ 53 (0.6) ▼ 44 (0.9) ▼ 40 (0.7) Portugal ▼ 43 (0.7) ▼ 44 (0.7) ▼ 44 (0.8) ▼ 40 (0.8) ▼ 54 (0.7) ▼ 39 (0.7) ▼ 32 (0.8) Iran, Islamic Rep. ▼ 38 (0.6) ▼ 39 (0.6) ▼ 43 (0.8) ▼ 37 (0.8) ▼ 41 (0.6) ▼ 29 (1.2) ▼ 36 (0.8)Countries Not Satisfying Guidelines for Sample Participation Rates (See Appendix A for Details): Australia ▲ 58 (0.9) ● 61 (0.9) ● 57 (1.0) ● 55 (1.0) ▲ 67 (0.8) ▲ 54 (1.0) ● 47 (0.9) Austria ▲ 62 (0.8) ▲ 66 (0.8) ● 57 (1.0) ▲ 59 (0.8) ▲ 68 (0.8) ▲ 62 (1.0) ▲ 49 (0.9) Belgium (Fr) ▲ 59 (0.9) ▲ 62 (1.0) ● 58 (1.0) ● 53 (1.1) ▲ 68 (1.0) ▲ 56 (1.0) ● 48 (0.9) Bulgaria ▲ 60 (1.2) ● 60 (1.4) ▲ 65 (1.3) ▲ 62 (1.5) ● 62 (1.1) ● 54 (1.6) ● 47 (1.5) Netherlands ● 60 (1.6) ● 62 (1.6) ● 59 (1.8) ● 53 (1.6) ▲ 72 (1.7) ▲ 57 (1.6) ▲ 51 (1.9) Scotland ● 52 (1.3) ▼ 53 (1.3) ● 52 (1.4) ▼ 46 (1.5) ● 65 (1.3) ● 48 (1.6) ▼ 40 (1.4)Countries Not Meeting Age/Grade Specifications (High Percentage of Older Students; See Appendix A for Details): Colombia ▼ 29 (0.8) ▼ 31 (0.9) ▼ 29 (0.9) ▼ 28 (0.9) ▼ 37 (1.0) ▼ 25 (1.5) ▼ 23 (0.9)‡ Germany ● 54 (1.1) ● 58 (1.1) ▼ 51 (1.3) ▼ 48 (1.3) ● 64 (1.2) ● 51 (1.1) ● 42 (1.3) Romania ▼ 49 (1.0) ▼ 48 (1.0) ▼ 52 (0.9) ● 52 (1.3) ▼ 49 (1.0) ● 48 (1.1) ● 42 (1.2) Slovenia ▲ 61 (0.7) ▲ 63 (0.7) ▲ 60 (0.9) ▲ 61 (0.8) ▲ 66 (0.7) ▲ 59 (0.9) ▲ 49 (0.8)Countries With Unapproved Sampling Procedures at Classroom Level (See Appendix A for Details): Denmark ▼ 52 (0.7) ▼ 53 (0.9) ● 54 (0.9) ▼ 45 (0.7) ▲ 67 (0.9) ● 49 (1.0) ▼ 41 (0.8) Greece ▼ 49 (0.7) ▼ 53 (0.8) ▼ 51 (0.7) ▼ 46 (0.8) ▼ 56 (0.8) ▼ 43 (0.9) ▼ 39 (1.1) Thailand ● 57 (1.4) ● 60 (1.5) ▲ 62 (1.3) ● 53 (1.7) ● 63 (1.1) ● 50 (1.4) ▲ 51 (1.5)Unapproved Sampling Procedures at Classroom Level and Not Meeting Other Guidelines (See Appendix A for Details):‡ Israel ● 57 (1.3) ● 60 (1.4) ● 57 (1.4) ▲ 61 (1.6) ● 63 (1.3) ● 48 (1.6) ● 43 (1.6) Kuwait ▼ 30 (0.7) ▼ 27 (0.8) ▼ 38 (1.0) ▼ 30 (1.0) ▼ 38 (1.0) ▼ 23 (1.0) ▼ 21 (0.7) South Africa ▼ 24 (1.1) ▼ 26 (1.4) ▼ 24 (1.0) ▼ 23 (1.1) ▼ 26 (1.2) ▼ 18 (1.1) ▼ 21 (0.9)
International Average Percent Correct(Does not include Missouri and Oregon)
55 (0.1) 58 (0.1) 56 (0.1) 52 (0.2) 62 (0.1) 51 (0.1) 45 (0.2)
*Eighth grade in most countries; see Table 2 for information about the grades tested in each country.‡Did not meet sampling guidelines for population coverage or use of replacement schools. See Figure 1.( ) Standard errors appear in parentheses. Because results are rounded to the nearest whole number, some totals may appear inconsistent.
SO
UR
CE
: IE
A T
hird
Inte
rnat
iona
l Mat
hem
atic
s an
d S
cien
ce S
tudy
(T
IMS
S),
199
4-95
. Mis
sour
i and
Ore
gon
data
col
lect
ed in
199
7.
▲ = Country/state mean significantly higher than international mean
▼ = Country/state mean significantly lower than international mean
● = No statistically significant difference between country/state mean and international mean

C H A P T E R 2
21
It is important to note that content areas differed in terms of their level of difficulty. As shown by the international averages across the bottom of Table 2.1 based on the per-formance of the 41 TIMSS countries, items in the data representation content area were easiest, while proportionality items were the most difficult. Thus, in comparing across columns most participants will appear to have higher performance in data rep-resentation than in proportionality. The results in this chapter are most appropriate for comparing performance
within
specific content areas.
For each content area shown in Table 2.1, a triangle pointing up indicates performance above the international average, a dot indicates performance about the same as the international average, and a triangle pointing down indicates performance below the international average for that content area. Compared to students in other countries, the performance of United States eighth graders was similar to the international average in most content areas, except in geometry and measurement where its perfor-mance was significantly below the international average. In relation to the TIMSS countries, performance in Missouri was quite similar to that of the United States. Eighth-grade students in Missouri performed at the international average in fractions and number sense, algebra, and proportionality, and below the international average in geometry and measurement. However, Missourian eighth graders performed above the international average in data representation. In contrast, eighth graders in Oregon did not perform below the international average in geometry and measurement. Oregonian eighth graders performed similar to the international average in all content areas except data representation, where like the students in Missouri, they performed above the international average.

22
C H A P T E R 2
Figure 2.1 provides a comparison of the performance of Missouri students with those in the TIMSS countries in each of six mathematics content areas. In relative terms, students from Missouri performed best in the area of data representation, analysis, and probability. They were outperformed by students in only seven countries, including those in Asia and several European countries (i.e., Belgium (Flemish), Switzerland, and France). Students in Missouri performed similarly in the areas of fractions and number sense and algebra, where they were outperformed by 13 countries. Nineteen countries had significantly higher achievement than Missouri in proportionality. Rela-tively, students in Missouri performed least well in geometry and measurement. In geometry, students in Missouri were outperformed by 22 countries and had higher achievement than students in 5 countries. In measurement, they were outperformed by 30 countries and did better than students in only 4 countries. In each content area, the results for Missouri were nearly identical to those for the United States.
Figure 2.2 presents the corresponding comparisons for Oregon. The pattern of achievement across the content areas is quite similar to that of Missouri. Relative to the TIMSS countries, Oregon performed best in data representation, analysis, and probability. Only Singapore, Japan, and Korea had higher achievement than Oregon in this content area. Students in Oregon performed similarly in the areas of fractions and number sense, algebra, and proportionality, where they were outperformed by 9 coun-tries in the first two of these areas and by 7 countries in the third. In geometry, students had significantly lower achievement than did students in 14 of the TIMSS countries. Eighth graders in Oregon did least well internationally in the area of measurement. Here they were outperformed by students in 19 countries, and had higher achievement than students in only 6 countries. Oregon had significantly higher achievement than the United States in three of the content areas – geometry, data representation, and measurement.
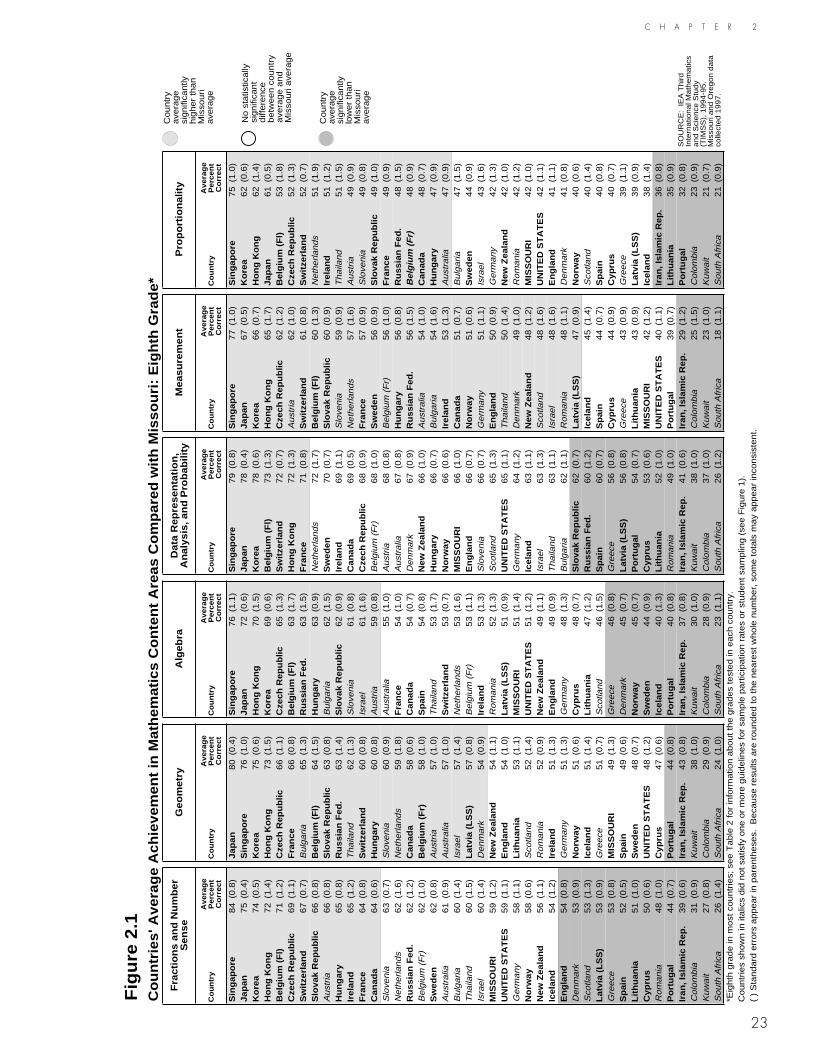
23
C H A P T E R 2
Fig
ure
2.1
Co
un
trie
s' A
vera
ge
Ach
ieve
me
nt
in M
ath
em
atic
s C
on
ten
t A
rea
s C
om
pa
red
with
Mis
sou
ri:
Eig
hth
Gra
de
*F
ract
ion
s a
nd
Nu
mb
er
Se
nse
Ge
om
etr
yA
lge
bra
Da
ta R
ep
rese
nta
tion
, A
na
lysi
s, a
nd
Pro
ba
bili
tyM
ea
sure
me
nt
Pro
po
rtio
na
lity
Co
un
try
Ave
rag
eP
erc
en
t C
orr
ect
Co
un
try
Ave
rag
eP
erc
en
t C
orr
ect
Co
un
try
Ave
rag
eP
erc
en
t C
orr
ect
Co
un
try
Ave
rag
eP
erc
en
t C
orr
ect
Co
un
try
Ave
rag
eP
erc
en
t C
orr
ect
Co
un
try
Ave
rag
eP
erc
en
t C
orr
ect
Sin
ga
po
re8
4(0
.8)
Jap
an
80
(0.4
)S
ing
ap
ore
76
(1.1
)S
ing
ap
ore
79
(0.8
)S
ing
ap
ore
77
(1.0
)S
ing
ap
ore
75
(1.0
)Ja
pa
n7
5(0
.4)
Sin
ga
po
re7
6(1
.0)
Jap
an
72
(0.6
)Ja
pa
n7
8(0
.4)
Jap
an
67
(0.5
)K
ore
a6
2(0
.6)
Ko
rea
74
(0.5
)K
ore
a7
5(0
.6)
Ho
ng
Ko
ng
70
(1.5
)K
ore
a7
8(0
.6)
Ko
rea
66
(0.7
)H
on
g K
on
g6
2(1
.4)
Ho
ng
Ko
ng
72
(1.4
)H
on
g K
on
g7
3(1
.5)
Ko
rea
69
(0.6
)B
elg
ium
(F
l)7
3(1
.3)
Ho
ng
Ko
ng
65
(1.7
)Ja
pa
n6
1(0
.5)
Be
lgiu
m (
Fl)
71
(1.2
)C
zech
Re
pu
blic
66
(1.1
)C
zech
Re
pu
blic
65
(1.3
)S
witz
erla
nd
72
(0.7
)C
zech
Re
pu
blic
62
(1.2
)B
elg
ium
(F
l)5
3(1
.8)
Cze
ch R
ep
ub
lic6
9(1
.1)
Fra
nce
66
(0.8
)B
elg
ium
(F
l)6
3(1
.7)
Ho
ng
Ko
ng
72
(1.3
)A
ust
ria
62
(1.0
)C
zech
Re
pu
blic
52
(1.3
)S
witz
erla
nd
67
(0.7
)B
ulg
aria
65
(1.3
)R
uss
ian
Fe
d.
63
(1.5
)F
ran
ce7
1(0
.8)
Sw
itze
rla
nd
61
(0.8
)S
witz
erla
nd
52
(0.7
)S
lova
k R
ep
ub
lic6
6(0
.8)
Be
lgiu
m (
Fl)
64
(1.5
)H
un
ga
ry6
3(0
.9)
Ne
the
rla
nd
s7
2(1
.7)
Be
lgiu
m (
Fl)
60
(1.3
)N
eth
erla
nd
s5
1(1
.9)
Au
stria
66
(0.8
)S
lova
k R
ep
ub
lic6
3(0
.8)
Bu
lga
ria
62
(1.5
)S
we
de
n7
0(0
.7)
Slo
vak
Re
pu
blic
60
(0.9
)Ir
ela
nd
51
(1.2
)H
un
ga
ry6
5(0
.8)
Ru
ssia
n F
ed
.6
3(1
.4)
Slo
vak
Re
pu
blic
62
(0.9
)Ir
ela
nd
69
(1.1
)S
love
nia
59
(0.9
)T
ha
ilan
d5
1(1
.5)
Ire
lan
d6
5(1
.2)
Th
aila
nd
62
(1.3
)S
love
nia
61
(0.8
)C
an
ad
a6
9(0
.5)
Ne
the
rla
nd
s5
7(1
.6)
Au
stria
49
(0.9
)F
ran
ce6
4(0
.8)
Sw
itze
rla
nd
60
(0.8
)Is
rae
l6
1(1
.6)
Cze
ch R
ep
ub
lic6
8(0
.9)
Fra
nce
57
(0.9
)S
love
nia
49
(0.8
)C
an
ad
a6
4(0
.6)
Hu
ng
ary
60
(0.8
)A
ust
ria
59
(0.8
)B
elg
ium
(F
r)6
8(1
.0)
Sw
ed
en
56
(0.9
)S
lova
k R
ep
ub
lic4
9(1
.0)
Slo
ven
ia6
3(0
.7)
Slo
ven
ia6
0(0
.9)
Au
stra
lia5
5(1
.0)
Au
stria
68
(0.8
)B
elg
ium
(F
r)5
6(1
.0)
Fra
nce
49
(0.9
)N
eth
erla
nd
s6
2(1
.6)
Ne
the
rla
nd
s5
9(1
.8)
Fra
nce
54
(1.0
)A
ust
ralia
67
(0.8
)H
un
ga
ry5
6(0
.8)
Ru
ssia
n F
ed
.4
8(1
.5)
Ru
ssia
n F
ed
.6
2(1
.2)
Ca
na
da
58
(0.6
)C
an
ad
a5
4(0
.7)
De
nm
ark
67
(0.9
)R
uss
ian
Fe
d.
56
(1.5
)B
elgi
um (
Fr)
48
(0.9
)B
elg
ium
(F
r)6
2(1
.0)
Be
lgiu
m (
Fr)
58
(1.0
)S
pa
in5
4(0
.8)
Ne
w Z
ea
lan
d6
6(1
.0)
Au
stra
lia5
4(1
.0)
Ca
na
da
48
(0.7
)S
we
de
n6
2(0
.8)
Au
stria
57
(1.0
)T
ha
ilan
d5
3(1
.7)
Hu
ng
ary
66
(0.7
)B
ulg
aria
54
(1.6
)H
un
ga
ry4
7(0
.9)
Au
stra
lia6
1(0
.9)
Au
stra
lia5
7(1
.0)
Sw
itze
rla
nd
53
(0.7
)N
orw
ay
66
(0.6
)Ir
ela
nd
53
(1.3
)A
ust
ralia
47
(0.9
)B
ulg
aria
60
(1.4
)Is
rae
l5
7(1
.4)
Ne
the
rla
nd
s5
3(1
.6)
MIS
SO
UR
I6
6(1
.0)
Ca
na
da
51
(0.7
)B
ulg
aria
47
(1.5
)T
ha
ilan
d6
0(1
.5)
La
tvia
(L
SS
)5
7(0
.8)
Be
lgiu
m (
Fr)
53
(1.1
)E
ng
lan
d6
6(0
.7)
No
rwa
y5
1(0
.6)
Sw
ed
en
44
(0.9
)Is
rae
l6
0(1
.4)
De
nm
ark
54
(0.9
)Ir
ela
nd
53
(1.3
)S
love
nia
66
(0.7
)G
erm
an
y5
1(1
.1)
Isra
el
43
(1.6
)M
ISS
OU
RI
59
(1.2
)N
ew
Ze
ala
nd
54
(1.1
)R
om
an
ia5
2(1
.3)
Sco
tlan
d6
5(1
.3)
En
gla
nd
50
(0.9
)G
erm
an
y4
2(1
.3)
UN
ITE
D S
TA
TE
S5
9(1
.1)
En
gla
nd
54
(1.0
)L
atv
ia (
LS
S)
51
(0.9
)U
NIT
ED
ST
AT
ES
65
(1.1
)T
ha
ilan
d5
0(1
.4)
Ne
w Z
ea
lan
d4
2(1
.0)
Ge
rma
ny
58
(1.1
)L
ithu
an
ia5
3(1
.1)
MIS
SO
UR
I5
1(1
.4)
Ge
rma
ny
64
(1.2
)D
en
ma
rk4
9(1
.0)
Ro
ma
nia
42
(1.2
)N
orw
ay
58
(0.6
)S
cotla
nd
52
(1.4
)U
NIT
ED
ST
AT
ES
51
(1.2
)Ic
ela
nd
63
(1.1
)N
ew
Ze
ala
nd
48
(1.2
)M
ISS
OU
RI
42
(1.0
)N
ew
Ze
ala
nd
56
(1.1
)R
om
an
ia5
2(0
.9)
Ne
w Z
ea
lan
d4
9(1
.1)
Isra
el
63
(1.3
)S
cotla
nd
48
(1.6
)U
NIT
ED
ST
AT
ES
42
(1.1
)Ic
ela
nd
54
(1.2
)Ir
ela
nd
51
(1.3
)E
ng
lan
d4
9(0
.9)
Th
aila
nd
63
(1.1
)Is
rae
l4
8(1
.6)
En
gla
nd
41
(1.1
)E
ng
lan
d5
4(0
.8)
Ge
rma
ny
51
(1.3
)G
erm
an
y4
8(1
.3)
Bu
lga
ria
62
(1.1
)R
om
an
ia4
8(1
.1)
De
nm
ark
41
(0.8
)D
en
ma
rk5
3(0
.9)
No
rwa
y5
1(0
.6)
Cyp
rus
48
(0.7
)S
lova
k R
ep
ub
lic6
2(0
.7)
La
tvia
(L
SS
)4
7(0
.9)
No
rwa
y4
0(0
.6)
Sco
tlan
d5
3(1
.3)
Ice
lan
d5
1(1
.4)
Lith
ua
nia
47
(1.2
)R
uss
ian
Fe
d.
60
(1.2
)Ic
ela
nd
45
(1.4
)S
cotla
nd
40
(1.4
)L
atv
ia (
LS
S)
53
(0.9
)G
ree
ce5
1(0
.7)
Sco
tlan
d4
6(1
.5)
Sp
ain
60
(0.7
)S
pa
in4
4(0
.7)
Sp
ain
40
(0.8
)G
ree
ce5
3(0
.8)
MIS
SO
UR
I4
9(1
.3)
Gre
ece
46
(0.8
)G
ree
ce5
6(0
.8)
Cyp
rus
44
(0.9
)C
ypru
s4
0(0
.7)
Sp
ain
52
(0.5
)S
pa
in4
9(0
.6)
De
nm
ark
45
(0.7
)L
atv
ia (
LS
S)
56
(0.8
)G
ree
ce4
3(0
.9)
Gre
ece
39
(1.1
)L
ithu
an
ia5
1(1
.0)
Sw
ed
en
48
(0.7
)N
orw
ay
45
(0.7
)P
ort
ug
al
54
(0.7
)L
ithu
an
ia4
3(0
.9)
La
tvia
(L
SS
)3
9(0
.9)
Cyp
rus
50
(0.6
)U
NIT
ED
ST
AT
ES
48
(1.2
)S
we
de
n4
4(0
.9)
Cyp
rus
53
(0.6
)M
ISS
OU
RI
42
(1.2
)Ic
ela
nd
38
(1.4
)R
om
an
ia4
8(1
.0)
Cyp
rus
47
(0.6
)Ic
ela
nd
40
(1.3
)L
ithu
an
ia5
2(1
.0)
UN
ITE
D S
TA
TE
S4
0(1
.1)
Ira
n,
Isla
mic
Re
p.
36
(0.8
)P
ort
ug
al
44
(0.7
)P
ort
ug
al
44
(0.8
)P
ort
ug
al
40
(0.8
)R
om
an
ia4
9(1
.0)
Po
rtu
ga
l3
9(0
.7)
Lith
ua
nia
35
(0.9
)Ir
an
, Is
lam
ic R
ep
.3
9(0
.6)
Ira
n,
Isla
mic
Re
p.
43
(0.8
)Ir
an
, Is
lam
ic R
ep
.3
7(0
.8)
Ira
n,
Isla
mic
Re
p.
41
(0.6
)Ir
an
, Is
lam
ic R
ep
.2
9(1
.2)
Po
rtu
ga
l3
2(0
.8)
Co
lom
bia
31
(0.9
)K
uw
ait
38
(1.0
)K
uw
ait
30
(1.0
)K
uw
ait
38
(1.0
)C
olo
mb
ia2
5(1
.5)
Co
lom
bia
23
(0.9
)K
uw
ait
27
(0.8
)C
olo
mb
ia2
9(0
.9)
Co
lom
bia
28
(0.9
)C
olo
mb
ia3
7(1
.0)
Ku
wa
it2
3(1
.0)
Ku
wa
it2
1(0
.7)
So
uth
Afr
ica
26
(1.4
)S
ou
th A
fric
a2
4(1
.0)
So
uth
Afr
ica
23
(1.1
)S
ou
th A
fric
a2
6(1
.2)
So
uth
Afr
ica
18
(1.1
)S
ou
th A
fric
a2
1(0
.9)
*Eig
hth
gra
de
in m
ost
co
un
trie
s; s
ee
Ta
ble
2 f
or
info
rma
tion
ab
ou
t th
e g
rad
es
test
ed
in e
ach
co
un
try.
Co
un
trie
s sh
ow
n in
ita
lics
did
no
t sa
tisfy
on
e o
r m
ore
gu
ide
line
s fo
r sa
mp
le p
art
icip
atio
n r
ate
s o
r st
ud
en
t sa
mp
ling
(se
e F
igu
re 1
).(
) S
tan
da
rd e
rro
rs a
pp
ea
r in
pa
ren
the
ses.
B
eca
use
re
sults
are
ro
un
de
d t
o t
he
ne
are
st w
ho
le n
um
be
r, s
om
e t
ota
ls m
ay
ap
pe
ar
inco
nsi
ste
nt.
SO
UR
CE
: I
EA
Th
ird
In
tern
atio
na
l Ma
the
ma
tics
an
d S
cie
nce
Stu
dy
(TIM
SS
), 1
99
4-9
5.
Mis
sou
ri a
nd
Ore
go
n d
ata
co
llect
ed
19
97
.
Co
un
try
ave
rag
e
sig
nifi
can
tly
hig
he
r th
an
M
isso
uri
ave
rag
e
Co
un
try
ave
rag
e
sig
nifi
can
tlylo
we
r th
an
M
isso
uri
ave
rag
e
No
sta
tistic
ally
si
gn
ifica
nt
diff
ere
nce
b
etw
ee
n c
ou
ntr
y a
vera
ge
an
d
Mis
sou
ri a
vera
ge
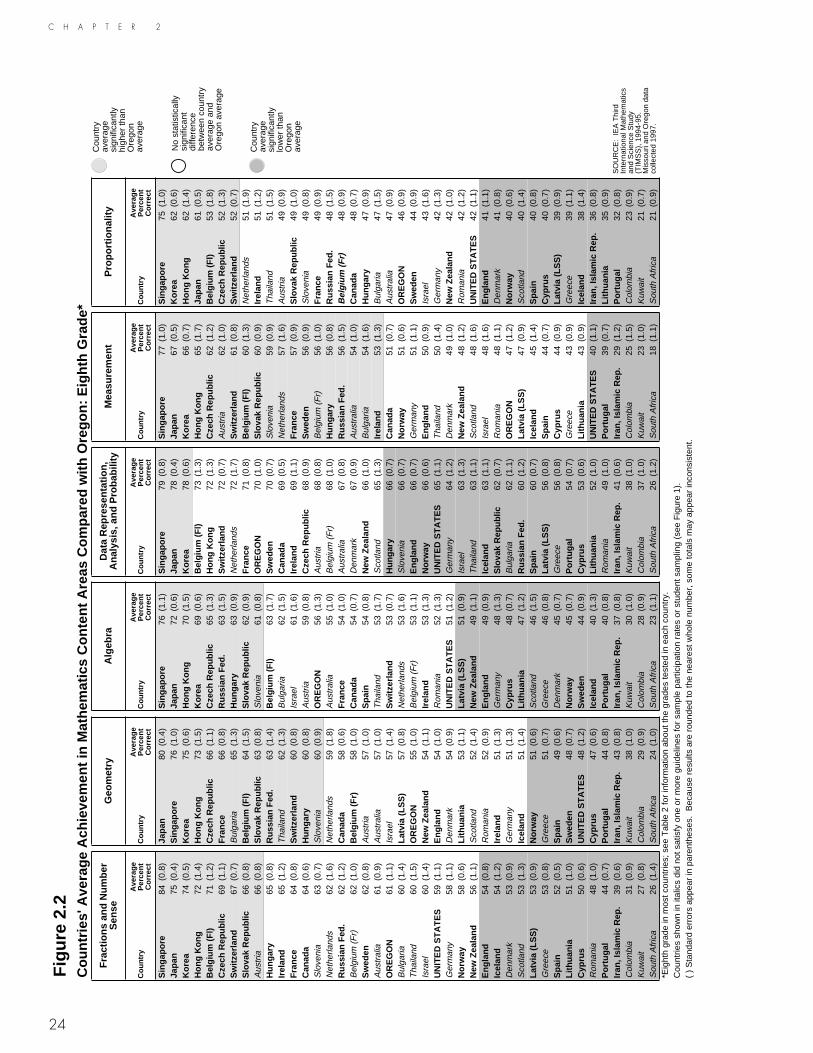
24
C H A P T E R 2
Fig
ure
2.2
Cou
ntrie
s' A
vera
ge A
chie
vem
ent i
n M
athe
mat
ics
Con
tent
Are
as C
ompa
red
with
Ore
gon:
Eig
hth
Gra
de*
Fra
ctio
ns a
nd N
umbe
r S
ense
Geo
met
ryA
lgeb
raD
ata
Rep
rese
ntat
ion,
A
naly
sis,
and
Pro
babi
lity
Mea
sure
men
tP
ropo
rtio
nalit
y
Cou
ntry
Ave
rage
Per
cent
C
orre
ctC
ount
ryA
vera
geP
erce
nt
Cor
rect
Cou
ntry
Ave
rage
Per
cent
C
orre
ctC
ount
ryA
vera
geP
erce
nt
Cor
rect
Cou
ntry
Ave
rage
Per
cent
C
orre
ctC
ount
ryA
vera
geP
erce
nt
Cor
rect
Sin
gapo
re84
(0.8
)Ja
pan
80(0
.4)
Sin
gapo
re76
(1.1
)S
inga
pore
79(0
.8)
Sin
gapo
re77
(1.0
)S
inga
pore
75(1
.0)
Japa
n75
(0.4
)S
inga
pore
76(1
.0)
Japa
n72
(0.6
)Ja
pan
78(0
.4)
Japa
n67
(0.5
)K
orea
62(0
.6)
Kor
ea74
(0.5
)K
orea
75(0
.6)
Hon
g K
ong
70(1
.5)
Kor
ea78
(0.6
)K
orea
66(0
.7)
Hon
g K
ong
62(1
.4)
Hon
g K
ong
72(1
.4)
Hon
g K
ong
73(1
.5)
Kor
ea69
(0.6
)B
elgi
um (
Fl)
73(1
.3)
Hon
g K
ong
65(1
.7)
Japa
n61
(0.5
)B
elgi
um (
Fl)
71(1
.2)
Cze
ch R
epub
lic66
(1.1
)C
zech
Rep
ublic
65(1
.3)
Hon
g K
ong
72(1
.3)
Cze
ch R
epub
lic62
(1.2
)B
elgi
um (
Fl)
53(1
.8)
Cze
ch R
epub
lic69
(1.1
)F
ranc
e66
(0.8
)R
ussi
an F
ed.
63(1
.5)
Sw
itzer
land
72(0
.7)
Aus
tria
62(1
.0)
Cze
ch R
epub
lic52
(1.3
)S
witz
erla
nd67
(0.7
)B
ulga
ria65
(1.3
)H
unga
ry63
(0.9
)N
ethe
rland
s72
(1.7
)S
witz
erla
nd61
(0.8
)S
witz
erla
nd52
(0.7
)S
lova
k R
epub
lic66
(0.8
)B
elgi
um (
Fl)
64(1
.5)
Slo
vak
Rep
ublic
62(0
.9)
Fra
nce
71(0
.8)
Bel
gium
(F
l)60
(1.3
)N
ethe
rland
s51
(1.9
)A
ustr
ia66
(0.8
)S
lova
k R
epub
lic63
(0.8
)S
love
nia
61(0
.8)
OR
EG
ON
70(1
.0)
Slo
vak
Rep
ublic
60(0
.9)
Irel
and
51(1
.2)
Hun
gary
65(0
.8)
Rus
sian
Fed
.63
(1.4
)B
elgi
um (
Fl)
63(1
.7)
Sw
eden
70(0
.7)
Slo
veni
a59
(0.9
)T
haila
nd51
(1.5
)Ir
elan
d65
(1.2
)T
haila
nd62
(1.3
)B
ulga
ria62
(1.5
)C
anad
a69
(0.5
)N
ethe
rland
s57
(1.6
)A
ustr
ia49
(0.9
)F
ranc
e64
(0.8
)S
witz
erla
nd60
(0.8
)Is
rael
61(1
.6)
Irel
and
69(1
.1)
Fra
nce
57(0
.9)
Slo
vak
Rep
ublic
49(1
.0)
Can
ada
64(0
.6)
Hun
gary
60(0
.8)
Aus
tria
59(0
.8)
Cze
ch R
epub
lic68
(0.9
)S
wed
en56
(0.9
)S
love
nia
49(0
.8)
Slo
veni
a63
(0.7
)S
love
nia
60(0
.9)
OR
EG
ON
56(1
.3)
Aus
tria
68(0
.8)
Bel
gium
(F
r)56
(1.0
)F
ranc
e49
(0.9
)N
ethe
rland
s62
(1.6
)N
ethe
rland
s59
(1.8
)A
ustr
alia
55(1
.0)
Bel
gium
(F
r)68
(1.0
)H
unga
ry56
(0.8
)R
ussi
an F
ed.
48(1
.5)
Rus
sian
Fed
.62
(1.2
)C
anad
a58
(0.6
)F
ranc
e54
(1.0
)A
ustr
alia
67(0
.8)
Rus
sian
Fed
.56
(1.5
)B
elgi
um (
Fr)
48(0
.9)
Bel
gium
(F
r)62
(1.0
)B
elgi
um (
Fr)
58(1
.0)
Can
ada
54(0
.7)
Den
mar
k67
(0.9
)A
ustr
alia
54(1
.0)
Can
ada
48(0
.7)
Sw
eden
62(0
.8)
Aus
tria
57(1
.0)
Spa
in54
(0.8
)N
ew Z
eala
nd66
(1.0
)B
ulga
ria54
(1.6
)H
unga
ry47
(0.9
)A
ustr
alia
61(0
.9)
Aus
tral
ia57
(1.0
)T
haila
nd53
(1.7
)S
cotla
nd65
(1.3
)Ir
elan
d53
(1.3
)B
ulga
ria47
(1.5
)O
RE
GO
N61
(1.1
)Is
rael
57(1
.4)
Sw
itzer
land
53(0
.7)
Hun
gary
66(0
.7)
Can
ada
51(0
.7)
Aus
tral
ia47
(0.9
)B
ulga
ria60
(1.4
)La
tvia
(LS
S)
57(0
.8)
Net
herla
nds
53(1
.6)
Slo
veni
a66
(0.7
)N
orw
ay51
(0.6
)O
RE
GO
N46
(0.9
)T
haila
nd60
(1.5
)O
RE
GO
N55
(1.0
)B
elgi
um (
Fr)
53(1
.1)
Eng
land
66(0
.7)
Ger
man
y51
(1.1
)S
wed
en44
(0.9
)Is
rael
60(1
.4)
New
Zea
land
54(1
.1)
Irel
and
53(1
.3)
Nor
way
66(0
.6)
Eng
land
50(0
.9)
Isra
el43
(1.6
)U
NIT
ED
ST
AT
ES
59(1
.1)
Eng
land
54(1
.0)
Rom
ania
52(1
.3)
UN
ITE
D S
TA
TE
S65
(1.1
)T
haila
nd50
(1.4
)G
erm
any
42(1
.3)
Ger
man
y58
(1.1
)D
enm
ark
54(0
.9)
UN
ITE
D S
TA
TE
S51
(1.2
)G
erm
any
64(1
.2)
Den
mar
k49
(1.0
)N
ew Z
eala
nd42
(1.0
)N
orw
ay58
(0.6
)Li
thua
nia
53(1
.1)
Latv
ia (
LSS
)51
(0.9
)Is
rael
63(1
.3)
New
Zea
land
48(1
.2)
Rom
ania
42(1
.2)
New
Zea
land
56(1
.1)
Sco
tland
52(1
.4)
New
Zea
land
49(1
.1)
Tha
iland
63(1
.1)
Sco
tland
48(1
.6)
UN
ITE
D S
TA
TE
S42
(1.1
)E
ngla
nd54
(0.8
)R
oman
ia52
(0.9
)E
ngla
nd49
(0.9
)Ic
elan
d63
(1.1
)Is
rael
48(1
.6)
Eng
land
41(1
.1)
Icel
and
54(1
.2)
Irel
and
51(1
.3)
Ger
man
y48
(1.3
)S
lova
k R
epub
lic62
(0.7
)R
oman
ia48
(1.1
)D
enm
ark
41(0
.8)
Den
mar
k53
(0.9
)G
erm
any
51(1
.3)
Cyp
rus
48(0
.7)
Bul
garia
62(1
.1)
OR
EG
ON
47(1
.2)
Nor
way
40(0
.6)
Sco
tland
53(1
.3)
Icel
and
51(1
.4)
Lith
uani
a47
(1.2
)R
ussi
an F
ed.
60(1
.2)
Latv
ia (
LSS
)47
(0.9
)S
cotla
nd40
(1.4
)La
tvia
(LS
S)
53(0
.9)
Nor
way
51(0
.6)
Sco
tland
46(1
.5)
Spa
in60
(0.7
)Ic
elan
d45
(1.4
)S
pain
40(0
.8)
Gre
ece
53(0
.8)
Gre
ece
51(0
.7)
Gre
ece
46(0
.8)
Latv
ia (
LSS
)56
(0.8
)S
pain
44(0
.7)
Cyp
rus
40(0
.7)
Spa
in52
(0.5
)S
pain
49(0
.6)
Den
mar
k45
(0.7
)G
reec
e56
(0.8
)C
ypru
s44
(0.9
)La
tvia
(LS
S)
39(0
.9)
Lith
uani
a51
(1.0
)S
wed
en48
(0.7
)N
orw
ay45
(0.7
)P
ortu
gal
54(0
.7)
Gre
ece
43(0
.9)
Gre
ece
39(1
.1)
Cyp
rus
50(0
.6)
UN
ITE
D S
TA
TE
S48
(1.2
)S
wed
en44
(0.9
)C
ypru
s53
(0.6
)Li
thua
nia
43(0
.9)
Icel
and
38(1
.4)
Rom
ania
48(1
.0)
Cyp
rus
47(0
.6)
Icel
and
40(1
.3)
Lith
uani
a52
(1.0
)U
NIT
ED
ST
AT
ES
40(1
.1)
Iran
, Isl
amic
Rep
.36
(0.8
)P
ortu
gal
44(0
.7)
Por
tuga
l44
(0.8
)P
ortu
gal
40(0
.8)
Rom
ania
49(1
.0)
Por
tuga
l39
(0.7
)Li
thua
nia
35(0
.9)
Iran
, Isl
amic
Rep
.39
(0.6
)Ir
an, I
slam
ic R
ep.
43(0
.8)
Iran
, Isl
amic
Rep
.37
(0.8
)Ir
an, I
slam
ic R
ep.
41(0
.6)
Iran
, Isl
amic
Rep
.29
(1.2
)P
ortu
gal
32(0
.8)
Col
ombi
a31
(0.9
)K
uwai
t38
(1.0
)K
uwai
t30
(1.0
)K
uwai
t38
(1.0
)C
olom
bia
25(1
.5)
Col
ombi
a23
(0.9
)K
uwai
t27
(0.8
)C
olom
bia
29(0
.9)
Col
ombi
a28
(0.9
)C
olom
bia
37(1
.0)
Kuw
ait
23(1
.0)
Kuw
ait
21(0
.7)
Sou
th A
fric
a26
(1.4
)S
outh
Afr
ica
24(1
.0)
Sou
th A
fric
a23
(1.1
)S
outh
Afr
ica
26(1
.2)
Sou
th A
fric
a18
(1.1
)S
outh
Afr
ica
21(0
.9)
*Eig
hth
grad
e in
mos
t cou
ntrie
s; s
ee T
able
2 fo
r in
form
atio
n ab
out t
he g
rade
s te
sted
in e
ach
coun
try.
Cou
ntrie
s sh
own
in it
alic
s di
d no
t sat
isfy
one
or
mor
e gu
idel
ines
for
sam
ple
part
icip
atio
n ra
tes
or s
tude
nt s
ampl
ing
(see
Fig
ure
1).
( )
Sta
ndar
d er
rors
app
ear
in p
aren
thes
es.
Bec
ause
res
ults
are
rou
nded
to th
e ne
ares
t who
le n
umbe
r, s
ome
tota
ls m
ay a
ppea
r in
cons
iste
nt.
SO
UR
CE
: IE
A T
hird
In
tern
atio
nal M
athe
mat
ics
and
Sci
ence
Stu
dy
(TIM
SS
), 1
994-
95.
Mis
sour
i and
Ore
gon
data
co
llect
ed 1
997.
Cou
ntry
av
erag
e si
gnifi
cant
ly
high
er th
an
Ore
gon
aver
age
Cou
ntry
av
erag
e si
gnifi
cant
lylo
wer
than
O
rego
n av
erag
e
No
stat
istic
ally
si
gnifi
cant
di
ffere
nce
betw
een
coun
try
aver
age
and
Ore
gon
aver
age

C H A P T E R 2
25
What Are the Gender Differences in Achievement for the Content Areas?
In the United States, as in other countries, policy makers have made great efforts to make mathematics more accessible to girls, and to encourage gender equity in this subject. Table 2.2 shows that similar to the findings for the United States, Missouri and Oregon showed no significant gender gap in any of the six content areas. In fact, Table 2.2 indicates few statistically significant gender differences in achievement by content areas. However, the reduced number of gender differences in performance overall compared to the differences in scale scores discussed in Chapter 1 reinforces the idea of less precision in the percent-correct metric. Still, the findings are consistent — few gender differences, but the differences that do exist tended to favor boys. The exception to the pattern internationally occurred in algebra, where, if anything, girls tended to have the advantage.
In fractions and number sense, geometry, and data representation, the gender differ-ences were minimal, except Korean boys outperformed girls in both fractions and number sense and data representation and boys in Greece had significantly higher achievement than girls in geometry. In proportionality, there were no significant gender differences, with boys and girls performing similarly in most countries.
In algebra, no gender differences were statistically significant, but the results appeared to be more diverse, with girls having slightly higher averages (three percentage points or more) than boys in a dozen or so countries. This pattern also is evidenced in the results for Missouri.
Even though the differences were statistically significant only in Korea, Portugal, Spain and Denmark, the most differences in performance by gender were found in measurement. The data indicate higher achievement for boys than girls in a number of countries, including the United States—a pattern also found in Missouri and Oregon.
In some respects, the TIMSS findings about gender differences parallel those found in the Second International Mathematics Study (SIMS) conducted in 1980-82.
1
Based on testing the grade with the most 13-year-old students, SIMS results indicated that girls were more likely to achieve better than boys in computation-level arithmetic, whole numbers, estimation and approximation, and algebra. Boys tended to be better in mea-surement, geometry, and proportional thinking. Even though the SIMS gender differ-ences in arithmetic, geometry, and proportional thinking did not appear in the TIMSS results, the patterns of higher achievement for girls in algebra and of higher achievement for boys in measurement are consistent from the second to the third IEA mathematics studies. In the SIMS report, the authors suggested that “boys’ familiarity with the application of, and relationships between, units of measure may well be related to their link with traditionally male occupations, hobbies, and pastimes, and the gender differences for this subtest may underline the effect that experience can have on learning.” This potential explanation for boys’ advantage in the content area of mea-surement may also be worth considering in the context of the TIMSS data.
1
Robitaille, D.F. (1989). “Students’ Achievements: Population A” in D.F. Robitaille and R.A. Garden (eds.),
The IEA Study of Mathematics II: Contexts and Outcomes of School Mathematics
. New York: Pergamon Press.

26
C H A P T E R 2
Table 2.2Average Percent Correct for Boys and Girls by Mathematics Content Areas: Eighth Grade*
Country
Mathematics Overall
Fractions & Number Sense Geometry Algebra
Boys Girls Boys Girls Boys Girls Boys Girls‡ UNITED STATES 53 (1.2) 53 (1.1) 60 (1.3) 59 (1.2) 49 (1.4) 47 (1.1) 50 (1.4) 51 (1.2)‡ MISSOURI 53 (1.6) 54 (1.5) 58 (1.8) 60 (1.6) 49 (1.5) 50 (1.8) 49 (2.1) 53 (1.9) OREGON 58 (1.8) 57 (1.8) 61 (2.1) 60 (1.9) 56 (1.5) 54 (1.8) 56 (2.2) 56 (2.3)‡ Belgium (Fl) 65 (2.0) 66 (1.9) 71 (1.8) 72 (1.7) 63 (2.1) 64 (2.1) 60 (2.5) 65 (2.4) Canada 59 (0.7) 59 (0.6) 63 (0.8) 64 (0.7) 58 (0.9) 58 (0.7) 52 (0.9) 55 (1.0) Cyprus 47 (0.6) 48 (0.6) 50 (0.7) 50 (0.8) 47 (0.9) 48 (0.8) 46 (0.9) 49 (0.9) Czech Republic 67 (1.0) 64 (1.3) 70 (1.1) 68 (1.3) 68 (1.1) 65 (1.4) 64 (1.4) 66 (1.4)‡ England 53 (1.3) 53 (0.9) 54 (1.3) 53 (1.0) 54 (1.5) 54 (1.3) 47 (1.6) 51 (1.1)‡ France 62 (0.8) 61 (0.9) 65 (0.9) 64 (1.0) 67 (1.0) 65 (1.1) 54 (1.1) 54 (1.3) Hong Kong 72 (1.7) 68 (1.7) 74 (1.7) 70 (1.7) 74 (1.8) 71 (1.9) 71 (1.8) 69 (2.0) Hungary 61 (0.8) 62 (0.8) 64 (1.0) 65 (0.9) 61 (1.0) 60 (1.0) 61 (1.0) 66 (1.1) Iceland 49 (1.3) 50 (1.3) 54 (1.8) 55 (1.4) 50 (1.3) 52 (1.6) 39 (1.1) 41 (1.9) Iran, Islamic Rep. 39 (0.8) 36 (0.8) 40 (0.9) 37 (0.8) 45 (1.1) 40 (1.2) 36 (0.9) 38 (1.2) Ireland 60 (1.6) 58 (1.4) 65 (1.7) 64 (1.5) 54 (1.7) 49 (1.6) 54 (1.7) 53 (1.7) Japan 74 (0.5) 73 (0.4) 76 (0.6) 75 (0.5) 79 (0.6) 80 (0.5) 72 (0.7) 72 (0.7) Korea ▲ 73 (0.6) 70 (0.7) ▲ 76 (0.7) 72 (0.8) 77 (0.8) 73 (0.8) 70 (0.8) 69 (0.9)‡ Latvia (LSS) 52 (1.0) 51 (0.8) 53 (1.2) 53 (1.0) 58 (1.0) 56 (1.1) 50 (1.3) 51 (0.9)‡ Lithuania 48 (1.1) 49 (1.0) 51 (1.2) 52 (1.2) 54 (1.2) 53 (1.2) 45 (1.5) 49 (1.4) New Zealand 55 (1.4) 53 (1.3) 58 (1.4) 55 (1.3) 54 (1.5) 55 (1.4) 48 (1.5) 49 (1.3) Norway 54 (0.6) 53 (0.6) 58 (0.7) 58 (0.7) 50 (0.8) 51 (0.9) 44 (0.9) 46 (0.9) Portugal 44 (0.8) 42 (0.7) 45 (0.9) 42 (0.8) 46 (1.2) 42 (0.9) 39 (1.0) 40 (1.0) Russian Federation 59 (1.4) 61 (1.3) 61 (1.5) 62 (1.1) 62 (1.7) 64 (1.4) 61 (1.8) 64 (1.3) Singapore 79 (1.1) 79 (1.0) 83 (1.0) 84 (0.8) 76 (1.3) 77 (1.2) 75 (1.3) 77 (1.3) Slovak Republic 63 (0.9) 62 (0.8) 66 (1.0) 66 (0.8) 65 (0.9) 62 (1.0) 60 (1.1) 64 (1.0) Spain 52 (0.7) 50 (0.7) 53 (0.7) 51 (0.7) 51 (0.8) 48 (0.8) 54 (1.0) 54 (0.9) Sweden 56 (0.8) 56 (0.8) 62 (0.9) 62 (0.9) 48 (0.8) 49 (0.8) 43 (1.0) 45 (1.1)‡ Switzerland 63 (0.8) 61 (0.7) 67 (0.8) 66 (0.9) 60 (1.1) 59 (0.9) 53 (1.1) 53 (0.9)Countries Not Satisfying Guidelines for Sample Participation Rates (See Appendix A for Details): Australia 57 (1.2) 59 (1.1) 60 (1.2) 61 (1.1) 57 (1.3) 58 (1.2) 53 (1.3) 57 (1.2) Austria 63 (0.8) 61 (1.2) 67 (0.9) 65 (1.1) 57 (1.3) 57 (1.4) 59 (0.9) 60 (1.2) Belgium (Fr) 59 (1.1) 58 (1.0) 62 (1.4) 62 (0.9) 60 (1.3) 57 (1.1) 52 (1.6) 55 (1.3) Netherlands 61 (1.8) 59 (1.6) 63 (1.8) 60 (1.7) 61 (2.1) 58 (1.8) 52 (1.8) 53 (1.8) Scotland 53 (1.7) 50 (1.3) 55 (1.5) 51 (1.3) 54 (1.8) 50 (1.4) 46 (2.0) 46 (1.4)
Countries Not Meeting Age/Grade Specifications (High Percentage of Older Students; See Appendix A for Details): Colombia 30 (1.6) 29 (0.9) 31 (1.8) 30 (0.7) 29 (1.6) 29 (1.1) 28 (1.7) 28 (1.0)‡ Germany 54 (1.3) 54 (1.2) 60 (1.3) 57 (1.3) 51 (1.5) 53 (1.5) 47 (1.5) 49 (1.4) Romania 49 (1.1) 49 (1.0) 48 (1.2) 48 (1.0) 53 (1.1) 51 (1.1) 50 (1.5) 54 (1.2) Slovenia 62 (0.8) 60 (0.7) 64 (0.9) 62 (0.8) 61 (1.1) 59 (1.1) 61 (1.0) 61 (0.9)
Countries With Unapproved Sampling Procedures at Classroom Level (See Appendix A for Details): Denmark ▲ 54 (0.8) 50 (0.9) 55 (1.0) 51 (1.1) 56 (1.1) 53 (1.3) 47 (0.8) 44 (1.0) Greece 51 (0.9) 48 (0.7) 54 (1.0) 51 (0.8) ▲ 53 (0.9) 48 (0.9) 46 (1.0) 46 (0.9) Thailand 56 (1.4) 58 (1.7) 59 (1.5) 61 (1.8) 60 (1.3) 63 (1.5) 51 (1.8) 55 (2.0)
Unapproved Sampling Procedures at Classroom Level and Not Meeting Other Guidelines (See Appendix A for Details):‡ Israel 61 (1.5) 55 (1.5) 64 (1.6) 58 (1.6) 61 (1.3) 55 (1.8) 63 (1.7) 59 (1.9) South Africa 25 (1.7) 22 (1.0) 28 (2.0) 24 (1.2) 25 (1.6) 24 (0.9) 24 (1.5) 23 (1.2)
International Average Percent Correct
56 (0.2) 55 (0.2) 58 (0.2) 57 (0.2) 56 (0.2) 55 (0.2) 52 (0.2) 53 (0.2)
*Eighth grade in most countries; see Table 2 for information about the grades tested in each country.‡Did not meet sampling guidelines for population coverage or use of replacement schools. See Figure 1.( ) Standard errors appear in parentheses. Because results are rounded to the nearest whole number, some totals may appear inconsistent.
▲ = Difference from other gender statistically significant at .05 level, adjusted for multiple comparisons

27
C H A P T E R 2
Table 2.2 (Continued)Average Percent Correct for Boys and Girls by Mathematics Content Areas: Eighth Grade*
Country
Data Representation, Analysis & Probability
Measurement Proportionality
Boys Girls Boys Girls Boys Girls‡ UNITED STATES 65 (1.1) 66 (1.2) 42 (1.2) 38 (1.2) 43 (1.1) 42 (1.2) ‡ MISSOURI 65 (1.5) 67 (1.4) 44 (1.9) 40 (1.5) 43 (1.6) 41 (1.5) OREGON 70 (1.8) 70 (1.5) 49 (2.2) 45 (2.0) 47 (1.7) 45 (1.9) ‡ Belgium (Fl) 72 (2.2) 73 (1.4) 60 (1.9) 59 (2.0) 52 (2.2) 53 (2.7) Canada 69 (0.9) 69 (0.6) 52 (0.9) 50 (0.8) 48 (0.9) 48 (1.0) Cyprus 52 (0.9) 54 (0.9) 44 (1.1) 43 (1.1) 40 (1.0) 39 (0.9) Czech Republic 70 (0.9) 67 (1.4) 64 (1.2) 60 (1.5) 54 (1.4) 49 (1.7) ‡ England 67 (1.2) 65 (1.1) 51 (1.5) 48 (1.1) 42 (1.5) 40 (1.3) ‡ France 72 (0.8) 70 (1.1) 58 (1.0) 56 (1.1) 50 (1.2) 48 (1.2) Hong Kong 73 (1.6) 69 (1.4) 68 (1.9) 62 (2.1) 63 (1.5) 60 (1.9) Hungary 66 (0.9) 65 (0.9) 57 (1.0) 56 (1.0) 47 (1.2) 46 (1.1) Iceland 63 (1.6) 62 (1.4) 45 (1.8) 45 (2.0) 40 (1.6) 37 (1.4) Iran, Islamic Rep. 42 (0.8) 40 (0.9) 32 (1.7) 26 (1.4) 38 (1.3) 34 (1.1) Ireland 70 (1.6) 68 (1.3) 55 (1.9) 51 (1.6) 52 (1.8) 49 (1.2) Japan 79 (0.5) 77 (0.5) 68 (0.6) 67 (0.6) 62 (0.8) 60 (0.8) Korea ▲ 80 (0.7) 75 (0.8) ▲ 69 (0.9) 62 (1.0) 62 (0.9) 61 (0.9) ‡ Latvia (LSS) 57 (1.0) 55 (1.0) 49 (1.2) 46 (1.1) 41 (1.1) 37 (1.0) ‡ Lithuania 52 (1.2) 52 (1.1) 44 (1.1) 41 (1.2) 34 (1.1) 35 (1.2) New Zealand 67 (1.3) 65 (1.3) 50 (1.5) 46 (1.4) 44 (1.5) 40 (1.4) Norway 67 (0.8) 66 (0.8) 53 (0.8) 50 (0.7) 41 (0.8) 40 (0.8) Portugal 55 (0.9) 53 (0.8) ▲ 41 (0.9) 36 (0.8) 33 (1.0) 30 (0.9) Russian Federation 60 (1.2) 60 (1.4) 56 (1.3) 56 (1.8) 48 (1.6) 49 (1.6) Singapore 79 (1.1) 79 (1.0) 77 (1.3) 77 (1.0) 75 (1.2) 76 (1.1) Slovak Republic 62 (0.9) 61 (0.8) 62 (1.1) 59 (1.0) 50 (1.1) 48 (1.3) Spain 61 (0.8) 59 (0.8) ▲ 47 (1.0) 42 (0.9) 42 (1.1) 38 (0.9) Sweden 70 (0.9) 69 (0.9) 56 (1.1) 55 (1.0) 46 (1.1) 43 (1.1) ‡ Switzerland 73 (1.0) 71 (0.7) 62 (1.0) 59 (1.0) 53 (1.0) 52 (0.9)
Countries Not Satisfying Guidelines for Sample Participation Rates (See Appendix A for Details): Australia 66 (1.1) 69 (1.0) 54 (1.2) 53 (1.1) 47 (1.3) 46 (1.1) Austria 69 (0.9) 68 (1.2) 64 (1.0) 60 (1.6) 50 (1.0) 48 (1.3) Belgium (Fr) 69 (1.4) 67 (1.1) 56 (1.2) 55 (1.2) 49 (1.1) 46 (1.2) Netherlands 74 (2.0) 70 (1.5) 58 (1.8) 56 (1.7) 54 (2.4) 49 (1.9) Scotland 67 (1.6) 63 (1.3) 50 (2.0) 45 (1.4) 43 (1.7) 37 (1.4)
Countries Not Meeting Age/Grade Specifications (High Percentage of Older Students; See Appendix A for Details): Colombia 38 (1.9) 36 (1.1) 25 (1.9) 25 (2.5) 24 (1.5) 22 (0.9) ‡ Germany 65 (1.3) 64 (1.3) 52 (1.3) 50 (1.3) 44 (1.6) 41 (1.3) Romania 49 (1.2) 48 (1.1) 49 (1.4) 47 (1.3) 41 (1.3) 42 (1.3) Slovenia 67 (0.9) 65 (0.8) 60 (1.1) 57 (1.0) 50 (1.1) 48 (1.2)
Countries With Unapproved Sampling Procedures at Classroom Level (See Appendix A for Details): Denmark 69 (1.0) 64 (1.3) ▲ 52 (1.0) 47 (1.2) 43 (1.2) 39 (0.9) Greece 58 (1.2) 55 (0.8) 45 (1.0) 41 (1.0) 41 (1.3) 38 (1.1) Thailand 62 (1.3) 63 (1.4) 50 (1.5) 51 (1.8) 50 (1.7) 52 (1.9)
Unapproved Sampling Procedures at Classroom Level and Not Meeting Other Guidelines (See Appendix A for Details):‡ Israel 67 (1.6) 60 (1.6) 52 (1.9) 46 (1.8) 48 (2.0) 40 (1.6) South Africa 28 (1.9) 25 (1.1) 20 (1.8) 16 (1.0) 23 (1.4) 20 (0.9)
International Average Percent Correct
63 (0.2) 62 (0.2) 52 (0.2) 49 (0.2) 46 (0.2) 44 (0.2)
*Eighth grade in most countries; see Table 2 for information about the grades tested in each country.‡Did not meet sampling guidelines for population coverage or use of replacement schools. See Figure 1.( ) Standard errors appear in parentheses. Because results are rounded to the nearest whole number, some totals may appear inconsistent.
▲ = Difference from other gender statistically significant at .05 level, adjusted for multiple comparisons

28
C H A P T E R 3
29
Chapter 3
P
ERFORMANCE
ON ITEMS WITHIN EACH MATHEMATICSCONTENT AREA
This chapter presents five or six example items within each of the mathematics content areas, including the performance on each of the items for Missouri and Oregon and for each of the TIMSS countries. The example items were selected to illustrate the dif-ferent topics covered within each content area as well as the different performance expectations. The items also were chosen to show the range of item formats used within each area. To provide some sense of what types of items were answered cor-rectly by higher-performing as compared to lower-performing students, the items show a range of difficulty within each content area. Finally, it should be noted that all these items and others are released for use by the public.1
The presentation for each of the content areas begins with a brief description of the major topics included in the content area and a discussion of student performance in that content area. The discussion is followed by a series of tables showing achievement results on example items from that content area. Each table shows the percentages of correct responses on the example item for the United States, Missouri, and Oregon and for each of the countries participating in TIMSS at the eighth grade. Each table also presents the example item in its entirety. The correct answer is circled for mul-tiple-choice items and shown in the answer space for short-answer items. For extended-response questions, the answer shown exemplifies the type of student responses that were given full credit. All of the responses shown have been repro-duced from students’ actual test booklets.
After the tables showing the results on each of the items, there is a figure relating achievement on each of the example items to performance on the TIMSS international mathematics scale. This “difficulty map” provides a pictorial representation of achievement on the scale in relation to achievement on the example items for the content area.
1 The IEA retained about one-third of the TIMSS items as secure for possible future use in measuring international trends in mathematics and science achievement. All remaining items are available for general use.

30
C H A P T E R 3
What Have Students Learned About Fractions and Number Sense?The category of fractions and number sense included operations and problem solving with whole numbers, fractions, decimals, and percentages, as well as estimating and rounding. Example Item 1 is a subtraction problem with whole numbers that requires regrouping (borrowing). The international average percent correct (86%) shown in Table 3.1 indicates that most students were successful on this item. Both Missouri and Oregon performed at about the international average with 87% and 85%, respectively. In general, the lack of variation in performance across countries and states suggests that most eighth graders have developed a grasp of how to solve this type of problem prior to the eighth grade.
Example Item 2 involved understanding the relative size of fractions and required stu-dents to provide their response, rather than select an answer in the multiple-choice format. As seen in Table 3.2, on average, three-fourths of eighth graders (75%) provided a correct response (any fraction larger than two-sevenths). Students in Missouri and Oregon performed above the international average, with 82% of the students responding correctly in both states. With the exception of Iran, Kuwait, and South Africa, at least 60% of the students in each of the participating countries responded correctly.
As indicated in Table 3.3, on average, about two-thirds of the students (67%) correctly solved Example Item 3. This item required students to interpret the information about the scale provided on the map shown in Table 3.3. Students in Missouri and Oregon performed near the international average, with 62% and 64% correct responses, respectively.
Example Item 4 required students to demonstrate their understanding of rounded values. Any value within the range of 165 through 174 was coded as a correct response. Oregon (70%) and Missouri (64%) both performed above the international average of 54% on this problem. There was considerable variation in performance on this problem across countries. For example, as indicated in Table 3.4, 80% or more of the students in the Czech Republic, Korea, Singapore, Sweden, and Australia provided a correct answer to this question. In contrast, fewer than 20% of the students did so in Cyprus, Iran, Spain, Colombia, Kuwait, and South Africa.
Multi-step problems such as the one shown in Example Item 5 were difficult for most students. As indicated in Table 3.5, on average, 39% of students internationally, responded correctly to this problem. The most prevalent mistake was to select the amount of fuel used on the trip (option C) rather than the amount of fuel remaining in the tank. Thirty-four percent of students across the United States and in Oregon responded correctly to this item, while in Missouri 33% responded correctly.
The international averages for Example Item 6 presented in Table 3.6 indicate that working with percentages is a challenge for many students. Only about one-fourth of the students (29%) responded correctly to this multiple-choice item, on average. Sin-gapore posted by far the best performance on this item (78%), with Hong Kong having the next highest achievement (54%). Students in Missouri (19%) performed below the international average as did those in the United States (20%). Eighth graders in Oregon (27%) performed closer to the international average.

C H A P T E R 3
31
Figure 3.1 presents a pictorial representation of the relationship between performance on the TIMSS international mathematics scale and achievement on the six example items for fractions and number sense.2 The achievement on each example item is indi-cated both by the average percent correct at the eighth grade and by the international mathematics scale value, or item difficulty level, for each item.
For the figure, the item results have been placed on the scale at the point where stu-dents at that level were more likely than not (65% probability) to answer the question correctly. For example, students scoring at or above 546 on the scale were likely to provide a correct response to the rounding item about the dolphin’s actual weight (Example Item 4), and those scoring at or above 610 were likely to have responded correctly to the problem about rate of fuel consumption (Example Item 5). Consid-ering that the international average on the scale was 513, students achieving at about the level of the international average such as those in Missouri and Oregon were unlikely to have answered Example Item 5 or Example Item 6 correctly. These results, however, varied dramatically by country. Students in Singapore, whose mean achieve-ment was 643, had relatively high probabilities of answering all but the most difficult fractions and number sense items correctly. Indeed, this is borne out by Singapore’s average percent correct of 79% in this content area.
2 The three-digit item label shown in the lower right corner of the box locating each example item on the item dif-ficulty map refers to the original item identification number used in the student test booklets.
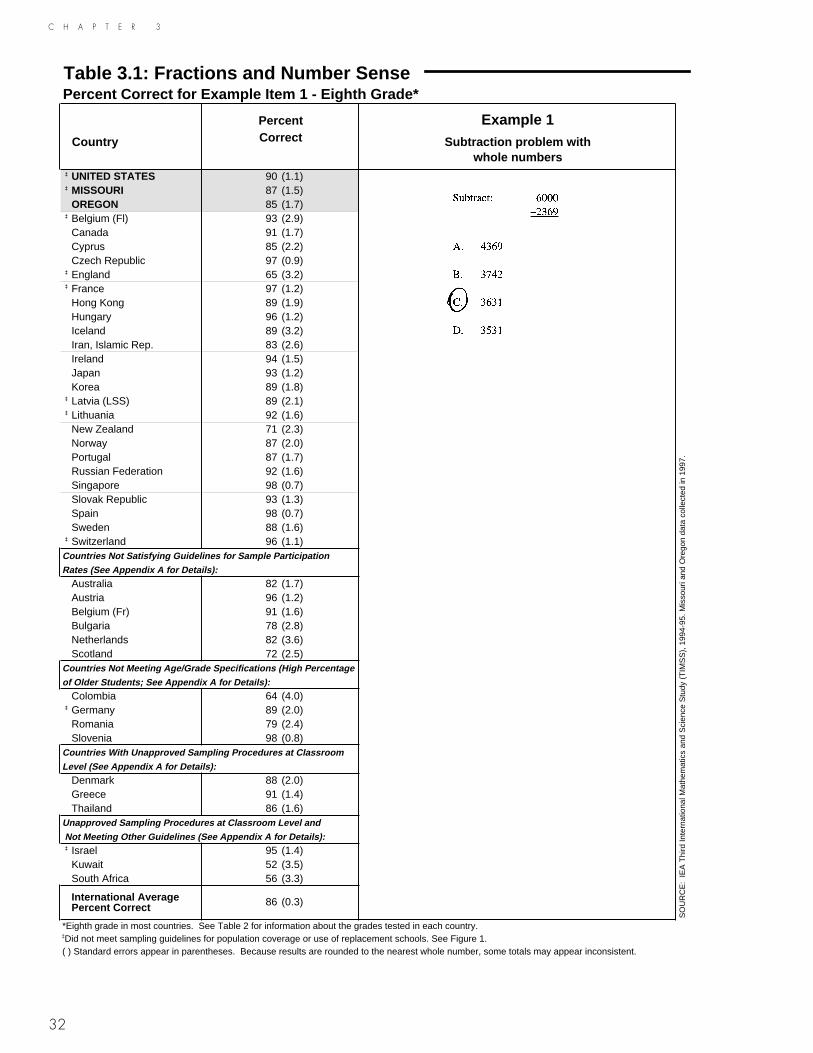
32
C H A P T E R 3
Table 3.1: Fractions and Number Sense Percent Correct for Example Item 1 - Eighth Grade*
Percent Example 1Country Correct Subtraction problem with
whole numbers‡ UNITED STATES 90 (1.1)‡ MISSOURI 87 (1.5) OREGON 85 (1.7)
‡ Belgium (Fl) 93 (2.9) Canada 91 (1.7) Cyprus 85 (2.2) Czech Republic 97 (0.9)
‡ England 65 (3.2)‡ France 97 (1.2) Hong Kong 89 (1.9) Hungary 96 (1.2) Iceland 89 (3.2) Iran, Islamic Rep. 83 (2.6) Ireland 94 (1.5) Japan 93 (1.2) Korea 89 (1.8)
‡ Latvia (LSS) 89 (2.1)‡ Lithuania 92 (1.6) New Zealand 71 (2.3) Norway 87 (2.0) Portugal 87 (1.7) Russian Federation 92 (1.6) Singapore 98 (0.7) Slovak Republic 93 (1.3) Spain 98 (0.7) Sweden 88 (1.6)
‡ Switzerland 96 (1.1)Countries Not Satisfying Guidelines for Sample ParticipationRates (See Appendix A for Details):
Australia 82 (1.7) Austria 96 (1.2) Belgium (Fr) 91 (1.6) Bulgaria 78 (2.8) Netherlands 82 (3.6) Scotland 72 (2.5)
Countries Not Meeting Age/Grade Specifications (High Percentageof Older Students; See Appendix A for Details):
Colombia 64 (4.0)‡ Germany 89 (2.0) Romania 79 (2.4) Slovenia 98 (0.8)
Countries With Unapproved Sampling Procedures at ClassroomLevel (See Appendix A for Details):
Denmark 88 (2.0) Greece 91 (1.4) Thailand 86 (1.6)
Unapproved Sampling Procedures at Classroom Level and Not Meeting Other Guidelines (See Appendix A for Details):‡ Israel 95 (1.4) Kuwait 52 (3.5) South Africa 56 (3.3)
International Average Percent Correct 86 (0.3)
*Eighth grade in most countries. See Table 2 for information about the grades tested in each country.‡Did not meet sampling guidelines for population coverage or use of replacement schools. See Figure 1.( ) Standard errors appear in parentheses. Because results are rounded to the nearest whole number, some totals may appear inconsistent.
SO
UR
CE
: IE
A T
hird
Inte
rnat
iona
l Mat
hem
atic
s an
d S
cien
ce S
tudy
(T
IMS
S),
199
4-95
. Mis
sour
i and
Ore
gon
data
col
lect
ed in
199
7.

33
C H A P T E R 3
Table 3.2: Fractions and Number Sense Percent Correct for Example Item 2 - Eighth Grade*
Percent Example 2Country Correct Write a larger fraction
‡ UNITED STATES 81 (1.9)‡ MISSOURI 82 (1.5) OREGON 82 (1.9)
‡ Belgium (Fl) 81 (3.1) Canada 80 (1.6) Cyprus 77 (2.4) Czech Republic 83 (2.1)
‡ England 79 (2.6)‡ France 75 (2.4) Hong Kong 85 (2.2) Hungary 87 (1.9) Iceland 89 (2.8) Iran, Islamic Rep. 31 (3.2) Ireland 82 (2.0) Japan 87 (1.2) Korea 84 (2.2)
‡ Latvia (LSS) 69 (3.1)‡ Lithuania 67 (3.0) New Zealand 80 (2.0) Norway 84 (1.6) Portugal 63 (2.7) Russian Federation 83 (1.9) Singapore 88 (1.6) Slovak Republic 85 (1.8) Spain 71 (2.0) Sweden 78 (2.5)
‡ Switzerland 83 (2.0)Countries Not Satisfying Guidelines for Sample ParticipationRates (See Appendix A for Details):
Australia 78 (1.6) Austria 87 (1.7) Belgium (Fr) 72 (2.6) Bulgaria 64 (4.7) Netherlands 76 (3.3) Scotland 81 (2.4)
Countries Not Meeting Age/Grade Specifications (High Percentageof Older Students; See Appendix A for Details):
Colombia 77 (2.8)‡ Germany 81 (2.3) Romania 64 (2.7) Slovenia 77 (2.7)
Countries With Unapproved Sampling Procedures at ClassroomLevel (See Appendix A for Details):
Denmark 65 (3.8) Greece 77 (2.0) Thailand 73 (2.1)
Unapproved Sampling Procedures at Classroom Level and Not Meeting Other Guidelines (See Appendix A for Details):‡ Israel 80 (3.1) Kuwait 37 (5.7) South Africa 50 (2.4)
International Average Percent Correct 75 (0.4)
*Eighth grade in most countries. See Table 2 for information about the grades tested in each country.‡Did not meet sampling guidelines for population coverage or use of replacement schools. See Figure 1.( ) Standard errors appear in parentheses. Because results are rounded to the nearest whole number, some totals may appear inconsistent.
SO
UR
CE
: IE
A T
hird
Inte
rnat
iona
l Mat
hem
atic
s an
d S
cien
ce S
tudy
(T
IMS
S),
199
4-95
. Mis
sour
i and
Ore
gon
data
col
lect
ed in
199
7.

34
C H A P T E R 3
Table 3.3: Fractions and Number Sense Percent Correct for Example Item 3 - Eighth Grade*
Percent Example 3Country Correct Distance on map
‡ UNITED STATES 61 (2.5)‡ MISSOURI 62 (2.3) OREGON 64 (2.4)
‡ Belgium (Fl) 84 (2.6) Canada 63 (2.0) Cyprus 61 (2.7) Czech Republic 83 (2.5)
‡ England 69 (3.1)‡ France 84 (2.0) Hong Kong 64 (2.5) Hungary 82 (2.0) Iceland 68 (4.4) Iran, Islamic Rep. 32 (3.2) Ireland 67 (2.4) Japan 79 (1.7) Korea 74 (2.3)
‡ Latvia (LSS) 70 (2.8)‡ Lithuania 67 (3.0) New Zealand 67 (2.2) Norway 65 (2.7) Portugal 56 (2.6) Russian Federation 77 (2.3) Singapore 84 (1.6) Slovak Republic 76 (2.3) Spain 62 (2.3) Sweden 77 (1.9)
‡ Switzerland 81 (2.5)Countries Not Satisfying Guidelines for Sample ParticipationRates (See Appendix A for Details):
Australia 69 (1.8) Austria 78 (3.6) Belgium (Fr) 82 (3.1) Bulgaria 75 (4.4) Netherlands 74 (3.7) Scotland 65 (3.1)
Countries Not Meeting Age/Grade Specifications (High Percentageof Older Students; See Appendix A for Details):
Colombia 31 (3.1)‡ Germany 72 (2.9) Romania 50 (2.7) Slovenia 76 (2.2)
Countries With Unapproved Sampling Procedures at ClassroomLevel (See Appendix A for Details):
Denmark 85 (2.3) Greece 50 (2.4) Thailand 67 (2.2)
Unapproved Sampling Procedures at Classroom Level and Not Meeting Other Guidelines (See Appendix A for Details):‡ Israel 59 (3.3) Kuwait 30 (4.1) South Africa 24 (2.2)
International Average Percent Correct 67 (0.4)
*Eighth grade in most countries. See Table 2 for information about the grades tested in each country.‡Did not meet sampling guidelines for population coverage or use of replacement schools. See Figure 1.( ) Standard errors appear in parentheses. Because results are rounded to the nearest whole number, some totals may appear inconsistent.
SO
UR
CE
: IE
A T
hird
Inte
rnat
iona
l Mat
hem
atic
s an
d S
cien
ce S
tudy
(T
IMS
S),
199
4-95
. Mis
sour
i and
Ore
gon
data
col
lect
ed in
199
7.

35
C H A P T E R 3
Table 3.4: Fractions and Number Sense Percent Correct for Example Item 4 - Eighth Grade*
Percent Example 4
Country Correct Actual weight fromrounded value
‡ UNITED STATES 66 (2.1)‡ MISSOURI 64 (2.5) OREGON 70 (1.8)
‡ Belgium (Fl) 65 (2.4) Canada 67 (1.7) Cyprus 17 (1.9) Czech Republic 80 (1.7)
‡ England 72 (2.5)‡ France – – Hong Kong 56 (2.8) Hungary 67 (2.0) Iceland 59 (4.1) Iran, Islamic Rep. 6 (1.1) Ireland 68 (2.0) Japan 76 (1.3) Korea 85 (1.3)
‡ Latvia (LSS) 49 (2.5)‡ Lithuania 47 (2.5) New Zealand 74 (1.8) Norway 77 (1.6) Portugal 33 (1.9) Russian Federation 59 (2.8) Singapore 89 (1.3) Slovak Republic 52 (2.1) Spain 28 (2.1) Sweden 88 (1.3)
‡ Switzerland 59 (1.8)Countries Not Satisfying Guidelines for Sample Participation
Rates (See Appendix A for Details): Australia 81 (1.4) Austria 63 (2.1) Belgium (Fr) 30 (2.6) Bulgaria 44 (3.8) Netherlands 61 (2.9) Scotland 74 (2.0)
Countries Not Meeting Age/Grade Specifications (High Percentage
of Older Students; See Appendix A for Details): Colombia 6 (1.1)
‡ Germany 55 (2.4) Romania 26 (2.0) Slovenia 38 (2.4)
Countries With Unapproved Sampling Procedures at Classroom
Level (See Appendix A for Details): Denmark 71 (2.0) Greece 56 (2.0) Thailand 40 (2.4)
Unapproved Sampling Procedures at Classroom Level and
Not Meeting Other Guidelines (See Appendix A for Details):‡ Israel 63 (3.6) Kuwait 10 (1.9) South Africa 16 (2.2)
International Average Percent Correct 54 (0.4)
*Eighth grade in most countries. See Table 2 for information about the grades tested in each country.‡Did not meet sampling guidelines for population coverage or use of replacement schools. See Figure 1.( ) Standard errors appear in parentheses. Because results are rounded to the nearest whole number, some totals may appear inconsistent.A dash (–) indicates data are not available. Internationally comparable data are unavailable for France on Example Item 4.
SO
UR
CE
: IE
A T
hird
Inte
rnat
iona
l Mat
hem
atic
s an
d S
cien
ce S
tudy
(T
IMS
S),
199
4-95
. Mis
sour
i and
Ore
gon
datta
col
lect
ed in
199
7.
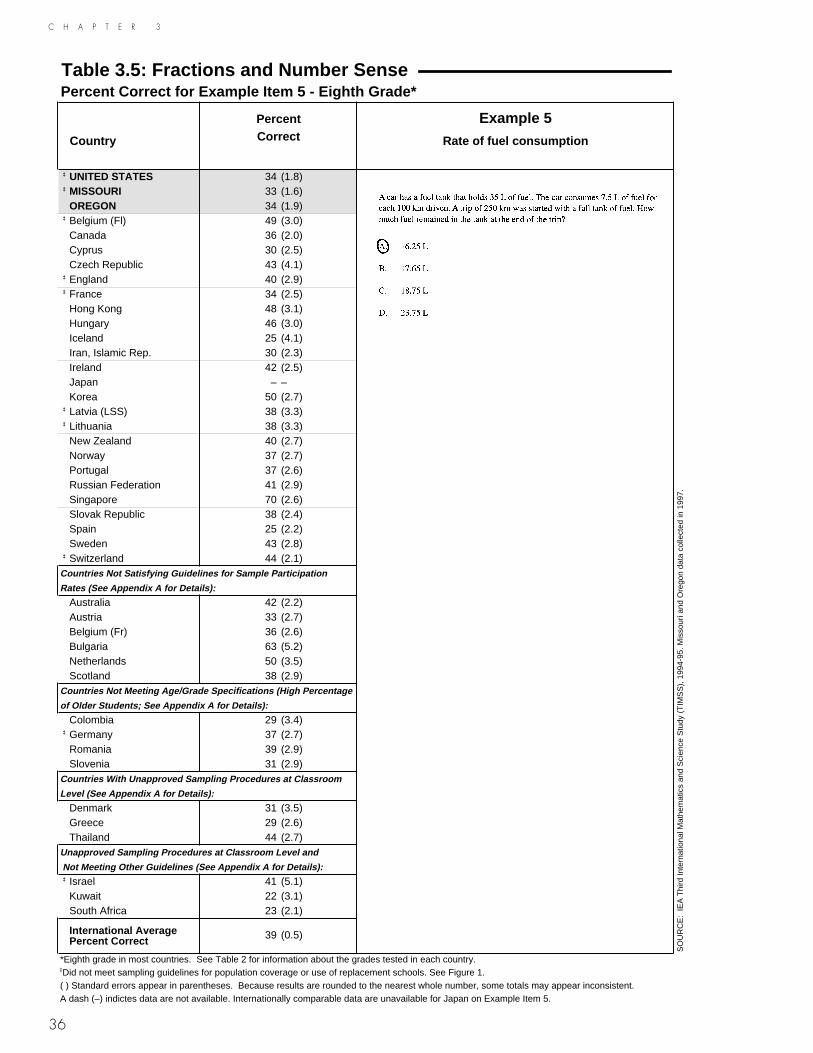
36
C H A P T E R 3
Table 3.5: Fractions and Number Sense Percent Correct for Example Item 5 - Eighth Grade*
Percent Example 5
Country Correct Rate of fuel consumption
‡ UNITED STATES 34 (1.8)‡ MISSOURI 33 (1.6) OREGON 34 (1.9)
‡ Belgium (Fl) 49 (3.0) Canada 36 (2.0) Cyprus 30 (2.5) Czech Republic 43 (4.1)
‡ England 40 (2.9)‡ France 34 (2.5) Hong Kong 48 (3.1) Hungary 46 (3.0) Iceland 25 (4.1) Iran, Islamic Rep. 30 (2.3) Ireland 42 (2.5) Japan – – Korea 50 (2.7)
‡ Latvia (LSS) 38 (3.3)‡ Lithuania 38 (3.3) New Zealand 40 (2.7) Norway 37 (2.7) Portugal 37 (2.6) Russian Federation 41 (2.9) Singapore 70 (2.6) Slovak Republic 38 (2.4) Spain 25 (2.2) Sweden 43 (2.8)
‡ Switzerland 44 (2.1)Countries Not Satisfying Guidelines for Sample Participation
Rates (See Appendix A for Details): Australia 42 (2.2) Austria 33 (2.7) Belgium (Fr) 36 (2.6) Bulgaria 63 (5.2) Netherlands 50 (3.5) Scotland 38 (2.9)
Countries Not Meeting Age/Grade Specifications (High Percentage
of Older Students; See Appendix A for Details): Colombia 29 (3.4)
‡ Germany 37 (2.7) Romania 39 (2.9) Slovenia 31 (2.9)
Countries With Unapproved Sampling Procedures at Classroom
Level (See Appendix A for Details): Denmark 31 (3.5) Greece 29 (2.6) Thailand 44 (2.7)
Unapproved Sampling Procedures at Classroom Level and
Not Meeting Other Guidelines (See Appendix A for Details):‡ Israel 41 (5.1) Kuwait 22 (3.1) South Africa 23 (2.1)
International Average Percent Correct 39 (0.5)
*Eighth grade in most countries. See Table 2 for information about the grades tested in each country.‡Did not meet sampling guidelines for population coverage or use of replacement schools. See Figure 1.( ) Standard errors appear in parentheses. Because results are rounded to the nearest whole number, some totals may appear inconsistent.A dash (–) indictes data are not available. Internationally comparable data are unavailable for Japan on Example Item 5.
SO
UR
CE
: IE
A T
hird
Inte
rnat
iona
l Mat
hem
atic
s an
d S
cien
ce S
tudy
(T
IMS
S),
199
4-95
. Mis
sour
i and
Ore
gon
data
col
lect
ed in
199
7.
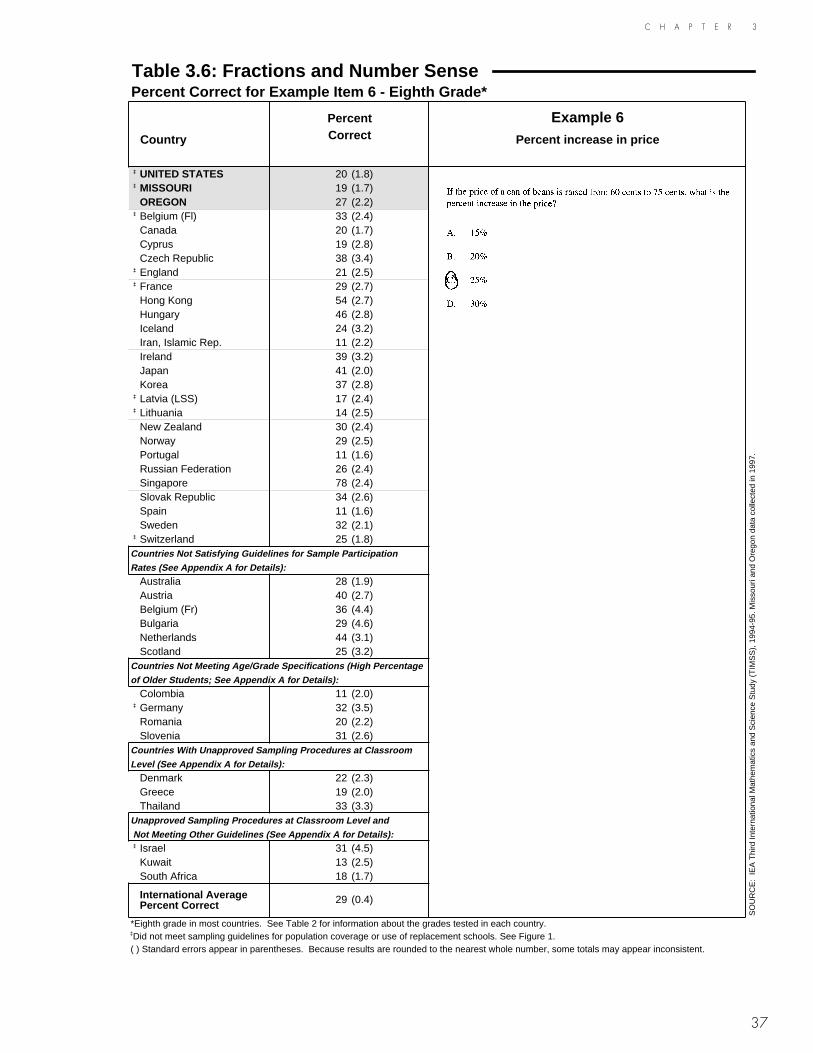
37
C H A P T E R 3
Table 3.6: Fractions and Number Sense Percent Correct for Example Item 6 - Eighth Grade*
Percent Example 6Country Correct Percent increase in price
‡ UNITED STATES 20 (1.8)‡ MISSOURI 19 (1.7) OREGON 27 (2.2)
‡ Belgium (Fl) 33 (2.4) Canada 20 (1.7) Cyprus 19 (2.8) Czech Republic 38 (3.4)
‡ England 21 (2.5)‡ France 29 (2.7) Hong Kong 54 (2.7) Hungary 46 (2.8) Iceland 24 (3.2) Iran, Islamic Rep. 11 (2.2) Ireland 39 (3.2) Japan 41 (2.0) Korea 37 (2.8)
‡ Latvia (LSS) 17 (2.4)‡ Lithuania 14 (2.5) New Zealand 30 (2.4) Norway 29 (2.5) Portugal 11 (1.6) Russian Federation 26 (2.4) Singapore 78 (2.4) Slovak Republic 34 (2.6) Spain 11 (1.6) Sweden 32 (2.1)
‡ Switzerland 25 (1.8)Countries Not Satisfying Guidelines for Sample ParticipationRates (See Appendix A for Details):
Australia 28 (1.9) Austria 40 (2.7) Belgium (Fr) 36 (4.4) Bulgaria 29 (4.6) Netherlands 44 (3.1) Scotland 25 (3.2)
Countries Not Meeting Age/Grade Specifications (High Percentageof Older Students; See Appendix A for Details):
Colombia 11 (2.0)‡ Germany 32 (3.5) Romania 20 (2.2) Slovenia 31 (2.6)
Countries With Unapproved Sampling Procedures at ClassroomLevel (See Appendix A for Details):
Denmark 22 (2.3) Greece 19 (2.0) Thailand 33 (3.3)
Unapproved Sampling Procedures at Classroom Level and Not Meeting Other Guidelines (See Appendix A for Details):‡ Israel 31 (4.5) Kuwait 13 (2.5) South Africa 18 (1.7)
International Average Percent Correct 29 (0.4)
*Eighth grade in most countries. See Table 2 for information about the grades tested in each country.‡Did not meet sampling guidelines for population coverage or use of replacement schools. See Figure 1.( ) Standard errors appear in parentheses. Because results are rounded to the nearest whole number, some totals may appear inconsistent.
SO
UR
CE
: IE
A T
hird
Inte
rnat
iona
l Mat
hem
atic
s an
d S
cien
ce S
tudy
(T
IMS
S),
199
4-95
. Mis
sour
i and
Ore
gon
data
col
lect
ed in
199
7.

38
C H A P T E R 3
750
500
250
Figure 3.1International Difficulty Map for Fractions and Number Sense Example Items: Eighth Grade*
*Eighth grade in most countries; see Table 2 for information about the grades tested in each country.NOTE: Each item was placed onto the TIMSS international mathematics scale based on students' performance in both grades of TIMSSPopulation 2 (seventh and eighth grades in most countries). Items are shown at the point on the scale where students withthat level of proficiency had a 65 percent probability of providing a correct response.
Scale Value
680
Example 6
International Average Percent Correct: 29%
Percent increase in price
O01
Scale Value
546
Example 4
International Average Percent Correct: 54%
Actual weight fromrounded value
V01
Scale Value
427
Example 2
International Average Percent Correct: 75%
Write a larger fraction
I06
Scale Value
360
Example 1
Subtraction problem withwhole numbersInternational Average Percent Correct: 86%
R12
Scale Value
484
Example 3
Distance on map
International Average Percent Correct: 67%
J17
Scale Value
610
Example 5
Rate of fuel consumption
International Average Percent Correct: 39%
N17
C H A P T E R 3
39
What Have Students Learned About Geometry?There was perhaps more variation in the geometry curriculum across countries than in any of the other mathematics content areas. The TIMSS geometry items required stu-dents to visualize geometric figures and to demonstrate their understanding of the properties of geometric figures. The range of student understanding in geometry is demonstrated by their performance on Example Items 7 through 12.
Example Item 7 (Table 3.7) assessed spatial visualization skills, and Example Item 8 (Table 3.8) lines of symmetry. Although the content differed, about two-thirds of the students internationally, on average, answered these questions correctly (Example Item 7 - 68%, Example Item 8 - 66%). On Example Item 7, Oregon (69%) performed near the international average while Missouri (61%) performed somewhat below it, as did the United States (62%). However, on Example Item 8, both Missouri and Oregon performed at least 10 percentage points above the international average.
On average, internationally, Example Item 9 (Table 3.9) requiring understanding of ratio and perimeter, was answered correctly by 56% of the students. Missouri per-formed at the international average while Oregon, at 63%, performed above the inter-national average.
The majority of students had difficulties with Example Item 10 on the properties of parallelograms. As indicated by Table 3.10, the international average for the percent correct was 49%. Students in Missouri and Oregon also had difficulty with this problem with percents correct of 38% and 37%, respectively. Only in Belgium (Flemish) (79%), Korea (79%), and Bulgaria (78%) did more than three-fourths of the students answer this question correctly.
When given its coordinates and asked about another point on a line (Example Item 11), students showed great variation in performance. As presented in Table 3.11, on average, the results were low (41%). The United States performed at the international average, as did Missouri (43%), while Oregon (50%) performed above it. In the Neth-erlands, the top-performing country on this item, 66% of the students answered cor-rectly. Students in England (55%) and Scotland (52%) also performed relatively well compared to their counterparts in other countries.
Example Item 12 (Table 3.12) which assessed the understanding of the properties of congruent triangles, was one of the most difficult geometry items, with an interna-tional average of 36%. Still, about two-thirds of the students responded correctly in Japan, Korea, and Singapore. Eighth graders in the United States (17%) had particular difficulty, and performance in Oregon (23%) and Missouri (14%) was similar to that in the United States.
Figure 3.2 presents the international difficulty map for the example items in geometry. Considering the international mean on the mathematics scale of 513, it can be seen that students performing above the mean were much more likely to understand the properties of geometric figures.

40
C H A P T E R 3
Table 3.7: Geometry Percent Correct for Example Item 7 - Eighth Grade*
Percent Example 7Country Correct Rotated 3-dimensional figure
‡ UNITED STATES 62 (2.5)‡ MISSOURI 61 (2.6) OREGON 69 (2.3)
‡ Belgium (Fl) 83 (2.1) Canada 75 (2.1) Cyprus 43 (3.0) Czech Republic 87 (1.9)
‡ England 77 (2.9)‡ France 77 (2.1) Hong Kong 75 (2.7) Hungary 71 (2.6) Iceland 81 (2.2) Iran, Islamic Rep. 42 (2.6) Ireland 75 (2.5) Japan 80 (1.3) Korea 74 (2.6)
‡ Latvia (LSS) 81 (2.6)‡ Lithuania 69 (3.1) New Zealand 67 (2.3) Norway 78 (2.1) Portugal 58 (2.5) Russian Federation 75 (2.8) Singapore 79 (1.9) Slovak Republic 81 (2.1) Spain 71 (2.2) Sweden 53 (2.6)
‡ Switzerland 82 (2.0)Countries Not Satisfying Guidelines for Sample ParticipationRates (See Appendix A for Details):
Australia 73 (1.7) Austria 80 (2.8) Belgium (Fr) 74 (2.4) Bulgaria 58 (5.3) Netherlands 77 (2.7) Scotland 72 (2.3)
Countries Not Meeting Age/Grade Specifications (High Percentageof Older Students; See Appendix A for Details):
Colombia 41 (3.6)‡ Germany 72 (2.7) Romania 53 (2.4) Slovenia 73 (2.5)
Countries With Unapproved Sampling Procedures at ClassroomLevel (See Appendix A for Details):
Denmark 73 (3.1) Greece 64 (2.7) Thailand 50 (2.5)
Unapproved Sampling Procedures at Classroom Level and Not Meeting Other Guidelines (See Appendix A for Details):‡ Israel 57 (3.5) Kuwait 29 (3.3) South Africa 36 (2.3)
International Average Percent Correct 68 (0.4)
*Eighth grade in most countries. See Table 2 for information about the grades tested in each country.‡Did not meet sampling guidelines for population coverage or use of replacement schools. See Figure 1.( ) Standard errors appear in parentheses. Because results are rounded to the nearest whole number, some totals may appear inconsistent.
SO
UR
CE
: IE
A T
hird
Inte
rnat
iona
l Mat
hem
atic
s an
d S
cien
ce S
tudy
(T
IMS
S),
199
4-95
. Mis
sour
i and
Ore
gon
data
cal
lect
ed in
199
7.

41
C H A P T E R 3
Table 3.8: Geometry Percent Correct for Example Item 8 - Eighth Grade*
Percent Example 8Country Correct Lines of symmetry
‡ UNITED STATES 70 (2.2)‡ MISSOURI 80 (2.0) OREGON 76 (2.0)
‡ Belgium (Fl) 78 (3.3) Canada 76 (2.1) Cyprus 58 (2.2) Czech Republic 74 (2.6)
‡ England 82 (2.6)‡ France 80 (2.3) Hong Kong 73 (2.4) Hungary 82 (2.1) Iceland 55 (3.5) Iran, Islamic Rep. 68 (3.3) Ireland 64 (2.6) Japan 77 (1.6) Korea 58 (2.7)
‡ Latvia (LSS) 50 (3.1)‡ Lithuania 58 (3.6) New Zealand 80 (2.0) Norway 42 (2.7) Portugal 44 (2.7) Russian Federation 67 (3.3) Singapore 81 (2.1) Slovak Republic 75 (2.2) Spain 51 (2.5) Sweden 44 (2.4)
‡ Switzerland 76 (2.6)Countries Not Satisfying Guidelines for Sample ParticipationRates (See Appendix A for Details):
Australia 69 (2.0) Austria 57 (3.9) Belgium (Fr) 80 (2.4) Bulgaria 78 (4.7) Netherlands 72 (3.9) Scotland 86 (1.7)
Countries Not Meeting Age/Grade Specifications (High Percentageof Older Students; See Appendix A for Details):
Colombia 44 (3.9)‡ Germany 64 (3.1) Romania 46 (2.7) Slovenia 69 (2.5)
Countries With Unapproved Sampling Procedures at ClassroomLevel (See Appendix A for Details):
Denmark 52 (3.2) Greece 62 (3.0) Thailand 80 (1.8)
Unapproved Sampling Procedures at Classroom Level and Not Meeting Other Guidelines (See Appendix A for Details):‡ Israel 76 (3.5) Kuwait 61 (4.3) South Africa 29 (2.3)
International Average Percent Correct 66 (0.4)
*Eighth grade in most countries. See Table 2 for information about the grades tested in each country.‡Did not meet sampling guidelines for population coverage or use of replacement schools. See Figure 1.( ) Standard errors appear in parentheses. Because results are rounded to the nearest whole number, some totals may appear inconsistent.
SO
UR
CE
: IE
A T
hird
Inte
rnat
iona
l Mat
hem
atic
s an
d S
cien
ce S
tudy
(T
IMS
S),
199
4-95
. Mis
sour
i and
Ore
gon
data
col
lect
ed in
199
7.

42
C H A P T E R 3
Table 3.9: Geometry Percent Correct for Example Item 9 - Eighth Grade*
Percent Example 9Country Correct Ratio of side length
to perimeter‡ UNITED STATES 55 (1.9)‡ MISSOURI 56 (2.4) OREGON 63 (2.4)
‡ Belgium (Fl) 72 (3.5) Canada 69 (1.8) Cyprus 55 (2.7) Czech Republic 60 (2.9)
‡ England 52 (3.3)‡ France 69 (2.5) Hong Kong 71 (2.6) Hungary 55 (2.7) Iceland 32 (3.1) Iran, Islamic Rep. 50 (3.6) Ireland 54 (3.2) Japan 80 (1.6) Korea 78 (2.1)
‡ Latvia (LSS) 54 (3.2)‡ Lithuania 46 (3.0) New Zealand 48 (2.5) Norway 41 (2.5) Portugal 48 (2.3) Russian Federation 55 (4.3) Singapore 80 (1.8) Slovak Republic 67 (2.3) Spain 55 (2.6) Sweden 47 (2.5)
‡ Switzerland 55 (2.4)Countries Not Satisfying Guidelines for Sample ParticipationRates (See Appendix A for Details):
Australia 60 (2.1) Austria 69 (3.0) Belgium (Fr) 62 (3.1) Bulgaria 56 (3.4) Netherlands 60 (4.5) Scotland 48 (3.0)
Countries Not Meeting Age/Grade Specifications (High Percentageof Older Students; See Appendix A for Details):
Colombia 37 (4.2)‡ Germany 45 (3.3) Romania 59 (2.8) Slovenia 69 (2.7)
Countries With Unapproved Sampling Procedures at ClassroomLevel (See Appendix A for Details):
Denmark 35 (3.1) Greece 61 (2.2) Thailand 64 (2.3)
Unapproved Sampling Procedures at Classroom Level and Not Meeting Other Guidelines (See Appendix A for Details):‡ Israel 69 (3.5) Kuwait 38 (4.8) South Africa 31 (2.5)
International Average Percent Correct 56 (0.5)
*Eighth grade in most countries. See Table 2 for information about the grades tested in each country.‡Did not meet sampling guidelines for population coverage or use of replacement schools. See Figure 1.( ) Standard errors appear in parentheses. Because results are rounded to the nearest whole number, some totals may appear inconsistent.
SO
UR
CE
: IE
A T
hird
Inte
rnat
iona
l Mat
hem
atic
s an
d S
cien
ce S
tudy
(T
IMS
S),
199
4-95
. Mis
sour
i and
Ore
gon
data
col
lect
ed in
199
7.
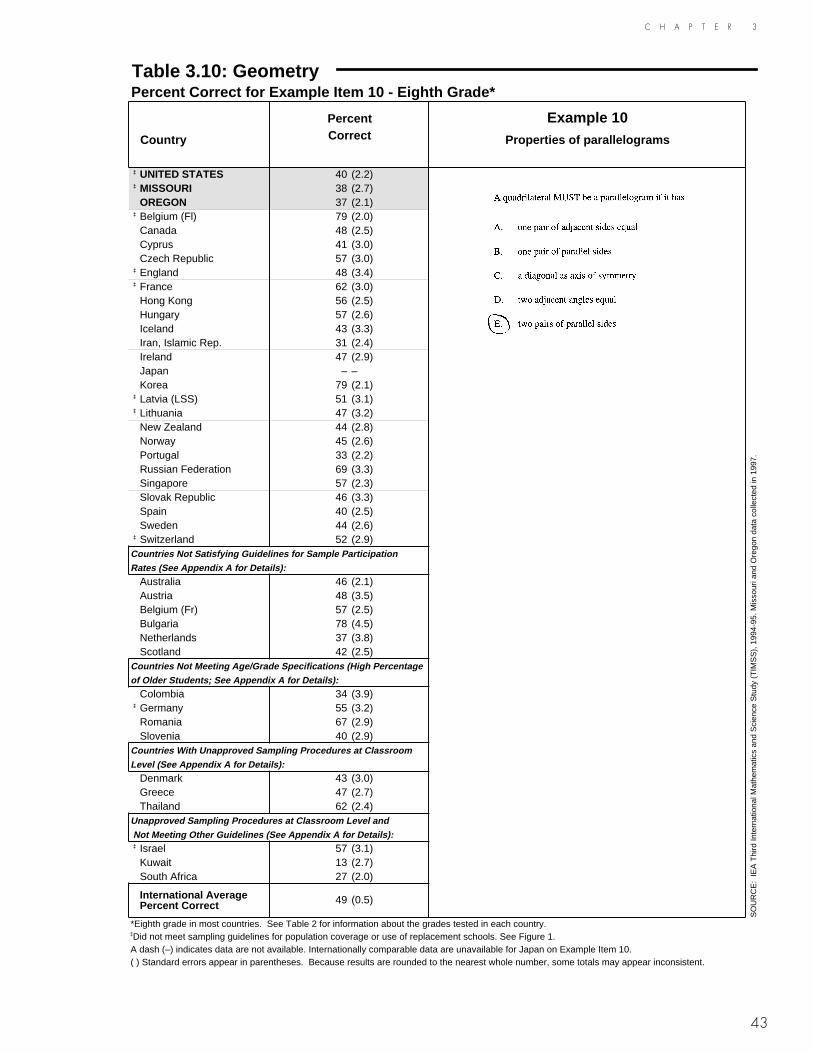
43
C H A P T E R 3
Table 3.10: Geometry Percent Correct for Example Item 10 - Eighth Grade*
Percent Example 10Country Correct Properties of parallelograms
‡ UNITED STATES 40 (2.2)‡ MISSOURI 38 (2.7) OREGON 37 (2.1)
‡ Belgium (Fl) 79 (2.0) Canada 48 (2.5) Cyprus 41 (3.0) Czech Republic 57 (3.0)
‡ England 48 (3.4)‡ France 62 (3.0) Hong Kong 56 (2.5) Hungary 57 (2.6) Iceland 43 (3.3) Iran, Islamic Rep. 31 (2.4) Ireland 47 (2.9) Japan – – Korea 79 (2.1)
‡ Latvia (LSS) 51 (3.1)‡ Lithuania 47 (3.2) New Zealand 44 (2.8) Norway 45 (2.6) Portugal 33 (2.2) Russian Federation 69 (3.3) Singapore 57 (2.3) Slovak Republic 46 (3.3) Spain 40 (2.5) Sweden 44 (2.6)
‡ Switzerland 52 (2.9)Countries Not Satisfying Guidelines for Sample ParticipationRates (See Appendix A for Details):
Australia 46 (2.1) Austria 48 (3.5) Belgium (Fr) 57 (2.5) Bulgaria 78 (4.5) Netherlands 37 (3.8) Scotland 42 (2.5)
Countries Not Meeting Age/Grade Specifications (High Percentageof Older Students; See Appendix A for Details):
Colombia 34 (3.9)‡ Germany 55 (3.2) Romania 67 (2.9) Slovenia 40 (2.9)
Countries With Unapproved Sampling Procedures at ClassroomLevel (See Appendix A for Details):
Denmark 43 (3.0) Greece 47 (2.7) Thailand 62 (2.4)
Unapproved Sampling Procedures at Classroom Level and Not Meeting Other Guidelines (See Appendix A for Details):‡ Israel 57 (3.1) Kuwait 13 (2.7) South Africa 27 (2.0)
International Average Percent Correct 49 (0.5)
*Eighth grade in most countries. See Table 2 for information about the grades tested in each country.‡Did not meet sampling guidelines for population coverage or use of replacement schools. See Figure 1.A dash (–) indicates data are not available. Internationally comparable data are unavailable for Japan on Example Item 10.( ) Standard errors appear in parentheses. Because results are rounded to the nearest whole number, some totals may appear inconsistent.
SO
UR
CE
: IE
A T
hird
Inte
rnat
iona
l Mat
hem
atic
s an
d S
cien
ce S
tudy
(T
IMS
S),
199
4-95
. Mis
sour
i and
Ore
gon
data
col
lect
ed in
199
7.

44
C H A P T E R 3
Table 3.11: Geometry Percent Correct for Example Item 11 - Eighth Grade*
Percent Example 11Country Correct Point on a line
‡ UNITED STATES 41 (1.8)‡ MISSOURI 43 (2.5) OREGON 50 (2.3)
‡ Belgium (Fl) 44 (3.5) Canada 49 (2.0) Cyprus 30 (2.5) Czech Republic 34 (3.1)
‡ England 55 (3.7)‡ France 34 (2.5) Hong Kong 50 (2.8) Hungary 51 (2.6) Iceland 43 (3.4) Iran, Islamic Rep. 17 (2.4) Ireland 46 (2.6) Japan 47 (2.2) Korea 42 (3.2)
‡ Latvia (LSS) 38 (3.0)‡ Lithuania 24 (2.8) New Zealand 52 (2.8) Norway 44 (3.1) Portugal 46 (2.5) Russian Federation 46 (3.3) Singapore 59 (2.3) Slovak Republic 40 (2.8) Spain 39 (2.6) Sweden 51 (2.3)
‡ Switzerland 51 (2.7)Countries Not Satisfying Guidelines for Sample ParticipationRates (See Appendix A for Details):
Australia 51 (1.8) Austria 54 (3.3) Belgium (Fr) 23 (2.6) Bulgaria 38 (5.1) Netherlands 66 (4.5) Scotland 52 (3.1)
Countries Not Meeting Age/Grade Specifications (High Percentageof Older Students; See Appendix A for Details):
Colombia 28 (4.3)‡ Germany 38 (2.9) Romania 22 (2.3) Slovenia 32 (2.9)
Countries With Unapproved Sampling Procedures at ClassroomLevel (See Appendix A for Details):
Denmark 51 (3.7) Greece 25 (2.4) Thailand 44 (2.6)
Unapproved Sampling Procedures at Classroom Level and Not Meeting Other Guidelines (See Appendix A for Details):‡ Israel 42 (3.6) Kuwait 24 (3.1) South Africa 25 (2.2)
International Average Percent Correct 41 (0.5)
*Eighth grade in most countries. See Table 2 for information about the grades tested in each country.‡Did not meet sampling guidelines for population coverage or use of replacement schools. See Figure 1.( ) Standard errors appear in parentheses. Because results are rounded to the nearest whole number, some totals may appear inconsistent.
SO
UR
CE
: IE
A T
hird
Inte
rnat
iona
l Mat
hem
atic
s an
d S
cien
ce S
tudy
(T
IMS
S),
199
4-95
. Mis
sour
i and
Ore
gon
data
col
lect
ed in
199
7.

45
C H A P T E R 3
Table 3.12: Geometry Percent Correct for Example Item 12 - Eighth Grade*
Percent Example 12Country Correct Congruent triangles
‡ UNITED STATES 17 (1.6)‡ MISSOURI 14 (1.4) OREGON 23 (2.0)
‡ Belgium (Fl) 43 (2.8) Canada 29 (2.5) Cyprus 41 (2.4) Czech Republic 51 (3.0)
‡ England 31 (3.7)‡ France 50 (2.8) Hong Kong 61 (2.7) Hungary 39 (2.8) Iceland 43 (3.6) Iran, Islamic Rep. 35 (2.8) Ireland 34 (2.6) Japan 69 (1.7) Korea 66 (2.1)
‡ Latvia (LSS) 25 (2.9)‡ Lithuania 27 (2.8) New Zealand 26 (2.5) Norway 30 (2.3) Portugal 21 (2.3) Russian Federation 39 (2.9) Singapore 69 (2.3) Slovak Republic 45 (2.5) Spain 14 (1.9) Sweden 34 (2.4)
‡ Switzerland 33 (2.8)Countries Not Satisfying Guidelines for Sample ParticipationRates (See Appendix A for Details):
Australia 34 (1.8) Austria 29 (2.9) Belgium (Fr) 32 (2.8) Bulgaria 44 (5.1) Netherlands 21 (3.0) Scotland 29 (2.7)
Countries Not Meeting Age/Grade Specifications (High Percentageof Older Students; See Appendix A for Details):
Colombia 12 (2.6)‡ Germany 29 (3.0) Romania 41 (2.9) Slovenia 37 (3.3)
Countries With Unapproved Sampling Procedures at ClassroomLevel (See Appendix A for Details):
Denmark 33 (3.2) Greece 37 (2.3) Thailand 33 (2.2)
Unapproved Sampling Procedures at Classroom Level and Not Meeting Other Guidelines (See Appendix A for Details):‡ Israel 43 (3.4) Kuwait 20 (2.8) South Africa 14 (1.8)
International Average Percent Correct 36 (0.4)
*Eighth grade in most countries. See Table 2 for information about the grades tested in each country.‡Did not meet sampling guidelines for population coverage or use of replacement schools. See Figure 1.( ) Standard errors appear in parentheses. Because results are rounded to the nearest whole number, some totals may appear inconsistent.
SO
UR
CE
: IE
A T
hird
Inte
rnat
iona
l Mat
hem
atic
s an
d S
cien
ce S
tudy
(T
IMS
S),
199
4-95
. Mis
sour
i and
Ore
gon
data
col
lect
ed in
199
7.
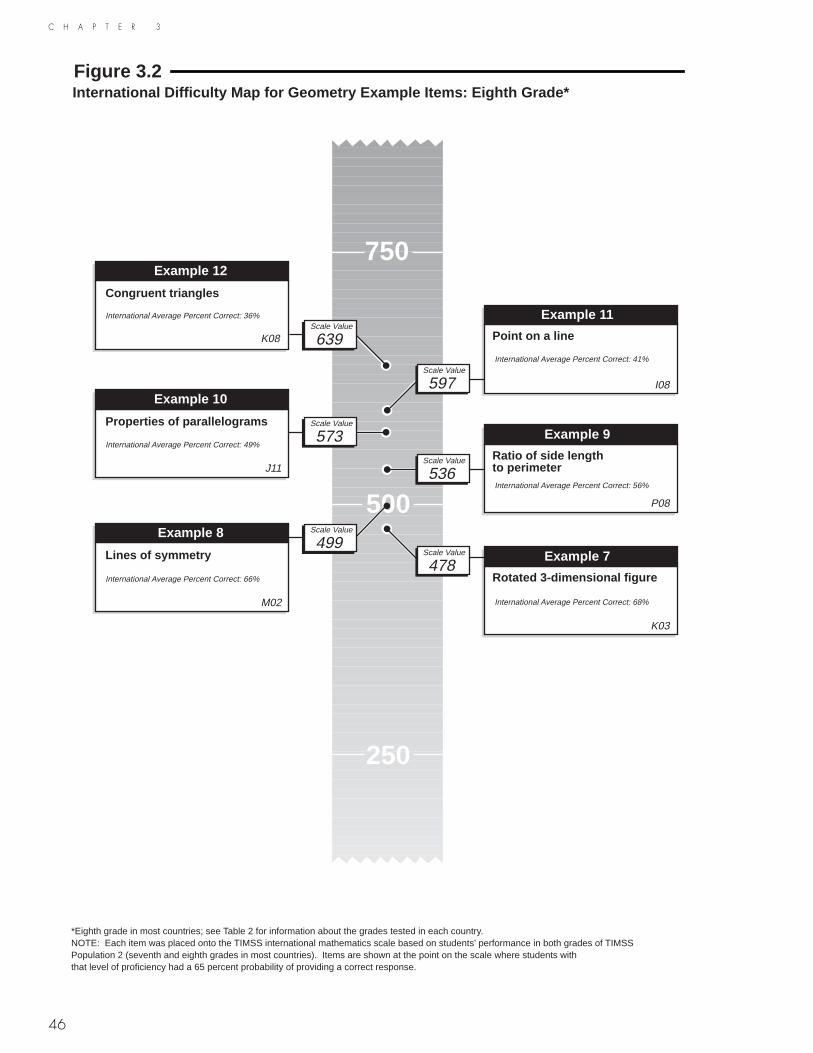
46
C H A P T E R 3
750
500
250
Figure 3.2International Difficulty Map for Geometry Example Items: Eighth Grade*
*Eighth grade in most countries; see Table 2 for information about the grades tested in each country.NOTE: Each item was placed onto the TIMSS international mathematics scale based on students' performance in both grades of TIMSSPopulation 2 (seventh and eighth grades in most countries). Items are shown at the point on the scale where students withthat level of proficiency had a 65 percent probability of providing a correct response.
J11
Scale Value
573
Example 10
International Average Percent Correct: 49%
Properties of parallelograms
Scale Value
478Example 7
Rotated 3-dimensional figure
International Average Percent Correct: 68%
K03
Scale Value
597
Example 11
Point on a line
International Average Percent Correct: 41%
I08
Scale Value
499Example 8
International Average Percent Correct: 66%
Lines of symmetry
M02
Scale Value
639
Example 12
International Average Percent Correct: 36%
Congruent triangles
K08
Scale Value
536
Example 9
Ratio of side lengthto perimeter International Average Percent Correct: 56%
P08

C H A P T E R 3
47
What Have Students Learned About Algebra?To demonstrate their understanding of algebraic concepts, students were asked to solve a variety of problems involving patterns, relations, expressions, and equations. Example Items 13 through 17 illustrate the range of student performance.
As shown by Example Item 13 (Table 3.13), the easiest items measured concepts underlying algebra, such as the ability to detect patterns. Most student performed very well on this item (90% correct responses averaged across countries), with Missouri and Oregon performing above the international average at 94% and 95%, respectively.
Example Item 14 is a two-part item requiring students to supply their answers. As shown in Table 3.14, in the first part of the item, students generally were able to establish the number of small triangles in the figures (76% average correct). Of course, finding the answers of 4 and 9 could have been accomplished by actually counting the small triangles. In contrast, very few students demonstrated their ability to extend the pattern and determine that 64 small triangles would be needed for the 8th figure (inter-national average of 26%). In only Japan (52%) and Singapore (50%) did at least half the students provide a correct response to this question. Similar to the performance of the countries, Missouri (75%) and Oregon (76%) both performed well on the first part of the item but less well on the second part of the item at 25% and 35%, respectively. It should be noted, however, that eighth graders in Oregon performed above the inter-national average on the second part of the question.
Example Items 15, 16, and 17 required students to work with algebraic equations and expressions. The international results for Example Item 15, as shown in Table 3.15, indicate that students in most countries were relatively successful in solving a simple linear equation for x (on average, 73% correct). Missouri and Oregon both performed at about the international average on Item 15, with percents correct of 72% and 73%, respectively. As shown by the data for Example Item 16, (Table 3.16) students around the world had more difficulty recognizing that m + m + m + m was equivalent to 4m (international average of 58%). Performance in Oregon (53%) and particularly in Mis-souri (42%) was below the international average. It should be noted, however, that three-fourths or more of the students answered this question correctly in the Czech Republic, Hong Kong, Japan, the Russian Federation, Singapore, the Slovak Republic, and Slovenia. Considering the performance on Example Item 16, it is not surprising that students had even more difficulty identifying the correct expression to represent the number of Clarissa’s hats as required by Example Item 17 (Table 3.17). Interna-tional performance on this item averaged 47%. In contrast to the international pattern, however, students in Oregon (54%) and Missouri (43%) performed about the same on Item 17 as they did on Item 16.
Figure 3.3, showing the relationship between performance on these items and perfor-mance on the mathematics scale, suggests that students in Missouri and Oregon and in most countries had considerable difficulty with all but the most straightforward algebra questions. Questions involving expressions and equations were most likely to be answered correctly by only the higher-performing students (students achieving sig-nificantly above the mean of 513).
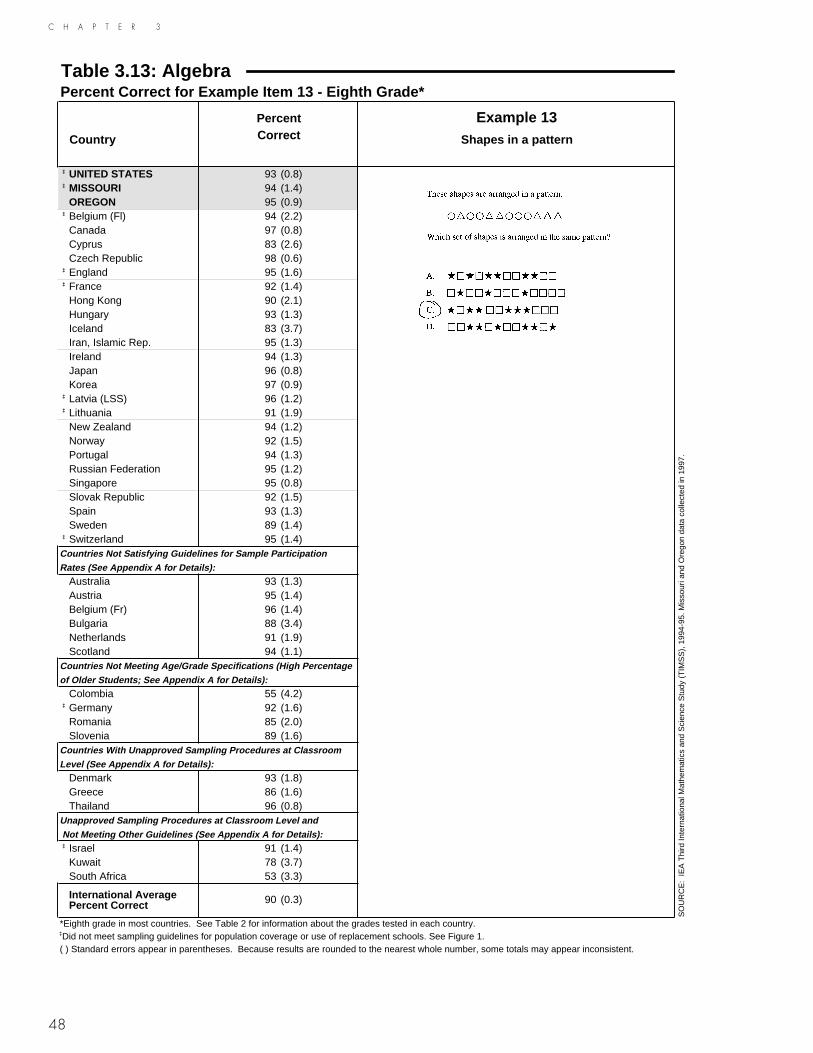
48
C H A P T E R 3
Table 3.13: AlgebraPercent Correct for Example Item 13 - Eighth Grade*
Percent Example 13Country Correct Shapes in a pattern
‡ UNITED STATES 93 (0.8)‡ MISSOURI 94 (1.4) OREGON 95 (0.9)
‡ Belgium (Fl) 94 (2.2) Canada 97 (0.8) Cyprus 83 (2.6) Czech Republic 98 (0.6)
‡ England 95 (1.6)‡ France 92 (1.4) Hong Kong 90 (2.1) Hungary 93 (1.3) Iceland 83 (3.7) Iran, Islamic Rep. 95 (1.3) Ireland 94 (1.3) Japan 96 (0.8) Korea 97 (0.9)
‡ Latvia (LSS) 96 (1.2)‡ Lithuania 91 (1.9) New Zealand 94 (1.2) Norway 92 (1.5) Portugal 94 (1.3) Russian Federation 95 (1.2) Singapore 95 (0.8) Slovak Republic 92 (1.5) Spain 93 (1.3) Sweden 89 (1.4)
‡ Switzerland 95 (1.4)Countries Not Satisfying Guidelines for Sample ParticipationRates (See Appendix A for Details):
Australia 93 (1.3) Austria 95 (1.4) Belgium (Fr) 96 (1.4) Bulgaria 88 (3.4) Netherlands 91 (1.9) Scotland 94 (1.1)
Countries Not Meeting Age/Grade Specifications (High Percentageof Older Students; See Appendix A for Details):
Colombia 55 (4.2)‡ Germany 92 (1.6) Romania 85 (2.0) Slovenia 89 (1.6)
Countries With Unapproved Sampling Procedures at ClassroomLevel (See Appendix A for Details):
Denmark 93 (1.8) Greece 86 (1.6) Thailand 96 (0.8)
Unapproved Sampling Procedures at Classroom Level and Not Meeting Other Guidelines (See Appendix A for Details):‡ Israel 91 (1.4) Kuwait 78 (3.7) South Africa 53 (3.3)
International Average Percent Correct 90 (0.3)
*Eighth grade in most countries. See Table 2 for information about the grades tested in each country.‡Did not meet sampling guidelines for population coverage or use of replacement schools. See Figure 1.( ) Standard errors appear in parentheses. Because results are rounded to the nearest whole number, some totals may appear inconsistent.
SO
UR
CE
: IE
A T
hird
Inte
rnat
iona
l Mat
hem
atic
s an
d S
cien
ce S
tudy
(T
IMS
S),
199
4-95
. Mis
sour
i and
Ore
gon
data
col
lect
ed in
199
7.

49
C H A P T E R 3
Table 3.14: AlgebraPercent Correct for Example Item 14, Part A - Eighth Grade*
Percent Example 14, Part ACountry Correct Sequence of triangles:
Chart finding pattern‡ UNITED STATES 75 (2.2)‡ MISSOURI 75 (2.1) OREGON 76 (2.5)
‡ Belgium (Fl) 83 (2.4) Canada 82 (1.7) Cyprus 69 (2.7) Czech Republic 75 (2.4)
‡ England 86 (2.4)‡ France 80 (2.1) Hong Kong 82 (1.9) Hungary 91 (1.4) Iceland 77 (3.6) Iran, Islamic Rep. 65 (2.8) Ireland 73 (2.3) Japan 94 (0.8) Korea 84 (2.1)
‡ Latvia (LSS) 76 (2.7)‡ Lithuania 66 (3.2) New Zealand 81 (2.0) Norway 77 (2.3) Portugal 71 (2.6) Russian Federation 76 (2.3) Singapore 83 (1.5) Slovak Republic 73 (2.4) Spain 80 (2.0) Sweden 75 (2.1)
‡ Switzerland 86 (1.7)Countries Not Satisfying Guidelines for Sample ParticipationRates (See Appendix A for Details):
Australia 80 (1.3) Austria 91 (2.1) Belgium (Fr) 84 (2.5) Bulgaria 76 (3.5) Netherlands 84 (2.5) Scotland 89 (1.8)
Countries Not Meeting Age/Grade Specifications (High Percentageof Older Students; See Appendix A for Details):
Colombia 46 (4.2)‡ Germany 81 (2.4) Romania 63 (2.6) Slovenia 82 (2.4)
Countries With Unapproved Sampling Procedures at ClassroomLevel (See Appendix A for Details):
Denmark 77 (2.9) Greece 79 (2.2) Thailand 86 (1.3)
Unapproved Sampling Procedures at Classroom Level and Not Meeting Other Guidelines (See Appendix A for Details):‡ Israel 78 (2.7) Kuwait 34 (3.7) South Africa 20 (2.5)
International Average Percent Correct 76 (0.4)
*Eighth grade in most countries. See Table 2 for information about the grades tested in each country.‡Did not meet sampling guidelines for population coverage or use of replacement schools. See Figure 1.( ) Standard errors appear in parentheses. Because results are rounded to the nearest whole number, some totals may appear inconsistent.
SO
UR
CE
: IE
A T
hird
Inte
rnat
iona
l Mat
hem
atic
s an
d S
cien
ce S
tudy
(T
IMS
S),
199
4-95
. Mis
sour
i and
Ore
gon
data
col
lect
ed in
199
7.

50
C H A P T E R 3
Table 3.14: Algebra (Continued)Percent Correct for Example Item 14, Part B - Eighth Grade*
Percent Example 14, Part BCountry Correct Sequence of triangles:
Extending pattern‡ UNITED STATES 25 (1.6)‡ MISSOURI 25 (1.8) OREGON 35 (2.6)
‡ Belgium (Fl) 31 (2.9) Canada 33 (2.4) Cyprus 20 (2.4) Czech Republic 32 (3.4)
‡ England 42 (3.4)‡ France 18 (2.5) Hong Kong 48 (2.7) Hungary 34 (2.8) Iceland 16 (2.7) Iran, Islamic Rep. 12 (2.7) Ireland 25 (2.6) Japan 52 (2.2) Korea 38 (2.6)
‡ Latvia (LSS) 17 (2.4)‡ Lithuania 13 (2.2) New Zealand 31 (2.5) Norway 22 (2.4) Portugal 13 (1.8) Russian Federation 22 (2.0) Singapore 50 (2.8) Slovak Republic 27 (2.4) Spain 22 (2.0) Sweden 17 (2.0)
‡ Switzerland 38 (2.5)Countries Not Satisfying Guidelines for Sample ParticipationRates (See Appendix A for Details):
Australia 32 (1.8) Austria 35 (3.4) Belgium (Fr) 22 (2.5) Bulgaria 18 (3.5) Netherlands 38 (3.8) Scotland 35 (2.8)
Countries Not Meeting Age/Grade Specifications (High Percentageof Older Students; See Appendix A for Details):
Colombia 11 (4.1)‡ Germany 18 (2.6) Romania 20 (2.4) Slovenia 31 (3.2)
Countries With Unapproved Sampling Procedures at ClassroomLevel (See Appendix A for Details):
Denmark 24 (3.4) Greece 13 (2.1) Thailand 26 (2.7)
Unapproved Sampling Procedures at Classroom Level and Not Meeting Other Guidelines (See Appendix A for Details):‡ Israel 25 (3.4) Kuwait 20 (4.1) South Africa 3 (1.3)
International Average Percent Correct 26 (0.4)
*Eighth grade in most countries. See Table 2 for information about the grades tested in each country.‡Did not meet sampling guidelines for population coverage or use of replacement schools. See Figure 1.( ) Standard errors appear in parentheses. Because results are rounded to the nearest whole number, some totals may appear inconsistent.
SO
UR
CE
: IE
A T
hird
Inte
rnat
iona
l Mat
hem
atic
s an
d S
cien
ce S
tudy
(T
IMS
S),
199
4-95
. Mis
sour
i and
Ore
gon
data
col
lect
ed in
199
7.
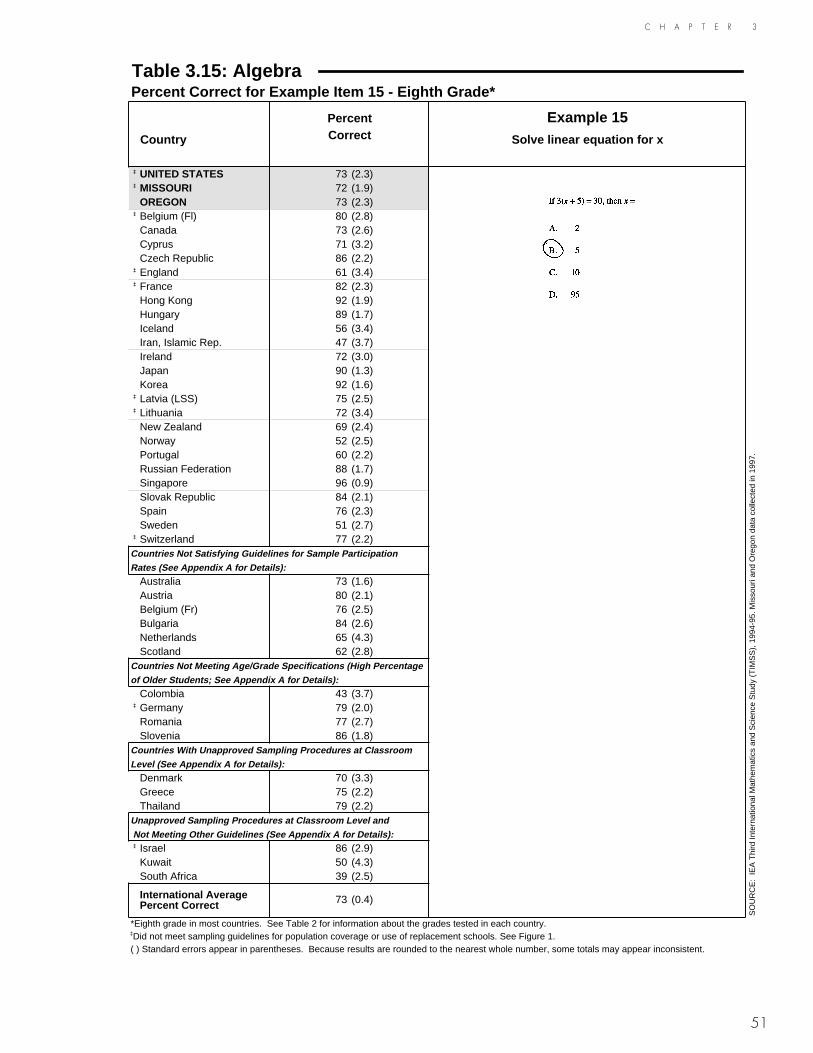
51
C H A P T E R 3
Table 3.15: AlgebraPercent Correct for Example Item 15 - Eighth Grade*
Percent Example 15Country Correct Solve linear equation for x
‡ UNITED STATES 73 (2.3)‡ MISSOURI 72 (1.9) OREGON 73 (2.3)
‡ Belgium (Fl) 80 (2.8) Canada 73 (2.6) Cyprus 71 (3.2) Czech Republic 86 (2.2)
‡ England 61 (3.4)‡ France 82 (2.3) Hong Kong 92 (1.9) Hungary 89 (1.7) Iceland 56 (3.4) Iran, Islamic Rep. 47 (3.7) Ireland 72 (3.0) Japan 90 (1.3) Korea 92 (1.6)
‡ Latvia (LSS) 75 (2.5)‡ Lithuania 72 (3.4) New Zealand 69 (2.4) Norway 52 (2.5) Portugal 60 (2.2) Russian Federation 88 (1.7) Singapore 96 (0.9) Slovak Republic 84 (2.1) Spain 76 (2.3) Sweden 51 (2.7)
‡ Switzerland 77 (2.2)Countries Not Satisfying Guidelines for Sample ParticipationRates (See Appendix A for Details):
Australia 73 (1.6) Austria 80 (2.1) Belgium (Fr) 76 (2.5) Bulgaria 84 (2.6) Netherlands 65 (4.3) Scotland 62 (2.8)
Countries Not Meeting Age/Grade Specifications (High Percentageof Older Students; See Appendix A for Details):
Colombia 43 (3.7)‡ Germany 79 (2.0) Romania 77 (2.7) Slovenia 86 (1.8)
Countries With Unapproved Sampling Procedures at ClassroomLevel (See Appendix A for Details):
Denmark 70 (3.3) Greece 75 (2.2) Thailand 79 (2.2)
Unapproved Sampling Procedures at Classroom Level and Not Meeting Other Guidelines (See Appendix A for Details):‡ Israel 86 (2.9) Kuwait 50 (4.3) South Africa 39 (2.5)
International Average Percent Correct 73 (0.4)
*Eighth grade in most countries. See Table 2 for information about the grades tested in each country.‡Did not meet sampling guidelines for population coverage or use of replacement schools. See Figure 1.( ) Standard errors appear in parentheses. Because results are rounded to the nearest whole number, some totals may appear inconsistent.
SO
UR
CE
: IE
A T
hird
Inte
rnat
iona
l Mat
hem
atic
s an
d S
cien
ce S
tudy
(T
IMS
S),
199
4-95
. Mis
sour
i and
Ore
gon
data
col
lect
ed in
199
7.

52
C H A P T E R 3
Table 3.16: AlgebraPercent Correct for Example Item 16 - Eighth Grade*
Percent Example 16Country Correct Equivalent algebraic
expressions‡ UNITED STATES 46 (2.5)‡ MISSOURI 42 (3.4) OREGON 53 (2.4)
‡ Belgium (Fl) 69 (4.2) Canada 61 (2.1) Cyprus 59 (2.9) Czech Republic 75 (2.7)
‡ England 42 (3.6)‡ France 65 (2.5) Hong Kong 79 (3.3) Hungary 72 (2.4) Iceland 59 (4.0) Iran, Islamic Rep. 34 (3.2) Ireland 53 (2.8) Japan 75 (1.9) Korea 65 (2.6)
‡ Latvia (LSS) 58 (3.0)‡ Lithuania 56 (3.8) New Zealand 55 (2.6) Norway 52 (2.7) Portugal 42 (2.9) Russian Federation 75 (2.9) Singapore 82 (2.0) Slovak Republic 77 (2.6) Spain 59 (2.7) Sweden 51 (2.6)
‡ Switzerland 54 (2.7)Countries Not Satisfying Guidelines for Sample ParticipationRates (See Appendix A for Details):
Australia 65 (1.8) Austria 73 (2.8) Belgium (Fr) 64 (2.7) Bulgaria 72 (3.1) Netherlands 51 (4.5) Scotland 53 (3.0)
Countries Not Meeting Age/Grade Specifications (High Percentageof Older Students; See Appendix A for Details):
Colombia 34 (4.5)‡ Germany 57 (3.3) Romania 64 (2.7) Slovenia 75 (2.7)
Countries With Unapproved Sampling Procedures at ClassroomLevel (See Appendix A for Details):
Denmark 36 (3.1) Greece 57 (2.5) Thailand 49 (3.2)
Unapproved Sampling Procedures at Classroom Level and Not Meeting Other Guidelines (See Appendix A for Details):‡ Israel 70 (3.7) Kuwait 29 (3.0) South Africa 33 (2.7)
International Average Percent Correct 58 (0.5)
*Eighth grade in most countries. See Table 2 for information about the grades tested in each country.‡Did not meet sampling guidelines for population coverage or use of replacement schools. See Figure 1.( ) Standard errors appear in parentheses. Because results are rounded to the nearest whole number, some totals may appear inconsistent.
SO
UR
CE
: IE
A T
hird
Inte
rnat
iona
l Mat
hem
atic
s an
d S
cien
ce S
tudy
(T
IMS
S),
199
4-95
. Mis
sour
i and
Ore
gon
data
col
lect
ed in
199
7.

53
C H A P T E R 3
Table 3.17: AlgebraPercent Correct for Example Item 17 - Eighth Grade*
Percent Example 17Country Correct Expression representing
number of hats‡ UNITED STATES 49 (2.3)‡ MISSOURI 43 (3.2) OREGON 54 (2.4)
‡ Belgium (Fl) 53 (3.8) Canada 45 (2.7) Cyprus 47 (3.0) Czech Republic 70 (3.7)
‡ England 37 (3.0)‡ France 55 (2.8) Hong Kong 65 (3.2) Hungary 57 (3.0) Iceland 14 (3.2) Iran, Islamic Rep. 38 (3.8) Ireland 51 (2.6) Japan 57 (2.2) Korea 64 (2.7)
‡ Latvia (LSS) 42 (3.3)‡ Lithuania 46 (3.5) New Zealand 38 (2.6) Norway 23 (2.3) Portugal 42 (2.3) Russian Federation 58 (3.8) Singapore 86 (1.7) Slovak Republic 66 (2.6) Spain 61 (2.3) Sweden 20 (2.0)
‡ Switzerland 41 (3.1)Countries Not Satisfying Guidelines for Sample ParticipationRates (See Appendix A for Details):
Australia 45 (2.0) Austria 51 (3.1) Belgium (Fr) 46 (3.1) Bulgaria 64 (3.9) Netherlands 45 (4.0) Scotland 36 (3.1)
Countries Not Meeting Age/Grade Specifications (High Percentageof Older Students; See Appendix A for Details):
Colombia 33 (3.7)‡ Germany 41 (3.0) Romania 52 (3.0) Slovenia 55 (3.0)
Countries With Unapproved Sampling Procedures at ClassroomLevel (See Appendix A for Details):
Denmark 29 (2.8) Greece 36 (2.7) Thailand 46 (2.6)
Unapproved Sampling Procedures at Classroom Level and Not Meeting Other Guidelines (See Appendix A for Details):‡ Israel 73 (3.3) Kuwait 27 (4.4) South Africa 19 (2.4)
International Average Percent Correct 47 (0.5)
*Eighth grade in most countries. See Table 2 for information about the grades tested in each country.‡Did not meet sampling guidelines for population coverage or use of replacement schools. See Figure 1.( ) Standard errors appear in parentheses. Because results are rounded to the nearest whole number, some totals may appear inconsistent.
SO
UR
CE
: IE
A T
hird
Inte
rnat
iona
l Mat
hem
atic
s an
d S
cien
ce S
tudy
(T
IMS
S),
199
4-95
. Mis
sour
i and
Ore
gon
data
col
lect
ed in
199
7.

54
C H A P T E R 3
750
500
250
Figure 3.3International Difficulty Map for Algebra Example Items: Eighth Grade*
*Eighth grades in most countries; see Table 2 for information about the grades tested in each country.NOTE: Each item was placed onto the TIMSS international mathematics scale based on students' performance in both grades of TIMSSPopulation 2 (seventh and eighth grades in most countries). Items are shown at the point on the scale where students withthat level of proficiency had a 65 percent probability of providing a correct response.
Scale Value
692
Example 14B
International Average Percent Correct: 26%
Sequence of triangles:Extending pattern
S01B
Scale Value
540
Example 16
International Average Percent Correct: 58%
Equivalent algebraicexpressions
P10
Scale Value
421
Example 14A
International Average Percent Correct: 76%
Sequence of triangles:Chart finding pattern
S01A
Scale Value
326
Example 13
Shapes in a pattern
International Average Percent Correct: 90%
L13
Scale Value
474
Example 15
Solve linear equation for x
International Average Percent Correct: 73%
O07
Scale Value
595
Example 17
Expression representationnumber of hatsInternational Average Percent Correct: 47%
Q01

C H A P T E R 3
55
What Have Students Learned About Data Representation, Analysis, and Probability?As illustrated by Example Items 18 through 23, the types of items in this content area required students to represent and analyze data using charts, tables, and graphs and to demonstrate their understanding of basic concepts underlying uncertainty and probability.
Example Item 18 asked students to read a chart of daily temperatures. As can be seen from Table 3.18, performance on reading the chart of temperatures was high (interna-tional average of 87%). Performance also was relatively high on Example Item 19 (Table 3.19) which required students to complete a pictograph (international average of 81%). Eighth graders in Missouri and Oregon performed very well on both of these problems, with 90% or more of the students answering each question correctly.
Example Item 21, requiring students to read a line graph, posed a greater challenge for students. As indicated in Table 3.21, on average, 59% of the students internationally, answered this question correctly. Achievement in Missouri (72%) and Oregon (81%) were among the higher performing countries on this problem. There were large differences in performance among countries. Performance at 75% correct or better was achieved in Belgium (Flemish) (82%), France (81%), Japan (75%), Switzerland (77%), the Netherlands (76%), and Denmark (75%). Performance below 45% occurred in Cyprus (40%), Iran (25%), Colombia (20%), Romania (36%), South Africa (17%), and Kuwait (24%).
Example Items 20 and 22 assessed the area of probability. In general, students appeared to understand that the probability of picking the one red marble was highest for the fewest number of marbles (Example Item 20). The international average, as presented in Table 3.20, was 76%. Eighty-five percent or more of the students answered this question correctly in Missouri and Oregon, as well as in Belgium (Flemish and French), Bulgaria, Canada, England, Hong Kong, Korea, the Netherlands, Norway, Slovenia, Switzerland, and the United States. In contrast, in Example Item 22, students were asked to integrate their understanding of both cubes and probability which proved to be more difficult for them (Table 3.22). The international average of correct responses was 47%. Although the students performed quite well in Singapore (88%) and two-thirds or more answered correctly in Belgium (Flemish) (68%), Hong Kong (72%), Japan (75%), and Korea (68%), performance fell below 40% correct in a number of countries. While Missouri (46%) performed near the international average, Oregon fared better at 57%.

56
C H A P T E R 3
Example Item 23 required students to apply their mathematics understanding to an everyday situation – that of extracting and using appropriate information from a news-paper advertisement to determine which office space had the lower rent. Students were asked to show their work. To receive complete credit for the item students needed to indicate that Building A had the lower price and show accurate computations to support this conclusion. However, the scoring approach also provided partial credit for students able to show accurate computations about one of the buildings. As indicated in Table 3.23, the international average for fully correct responses (20%) was quite low. Students in Missouri and Oregon performed near the international average with 22% and 21%, respectively. Only in Singapore (55%) did more than half the students provide a complete solution to this problem, although performance in Japan (47%) and Korea (50%) also was higher than in other countries. On average internationally, about one-fourth of the students (27%) received partial credit. The corresponding figures were 31% in Missouri and 36% in Oregon.
As shown in Figure 3.4, the international difficulty map for data representation, analysis, and probability indicates that the higher performing students were more likely to demonstrate the ability to apply concepts and integrate their understandings.

57
C H A P T E R 3
Table 3.18: Data Representation, Analysis, and ProbabilityPercent Correct for Example Item 18 - Eighth Grade*
Percent Example 18Country Correct Highest temperature on chart
‡ UNITED STATES 90 (1.1)‡ MISSOURI 93 (1.2) OREGON 92 (1.1)
‡ Belgium (Fl) 91 (2.5) Canada 92 (1.7) Cyprus 78 (2.5) Czech Republic 96 (0.8)
‡ England 91 (2.2)‡ France 90 (1.7) Hong Kong 79 (2.8) Hungary 91 (1.4) Iceland 90 (2.2) Iran, Islamic Rep. 75 (2.9) Ireland 92 (1.6) Japan 93 (1.1) Korea 85 (1.8)
‡ Latvia (LSS) 86 (2.2)‡ Lithuania 87 (2.1) New Zealand 93 (1.3) Norway 92 (1.5) Portugal 90 (1.6) Russian Federation 91 (1.5) Singapore 88 (1.4) Slovak Republic 93 (1.4) Spain 88 (1.7) Sweden 94 (1.3)
‡ Switzerland 92 (1.8)Countries Not Satisfying Guidelines for Sample ParticipationRates (See Appendix A for Details):
Australia 92 (1.4) Austria 91 (1.9) Belgium (Fr) 90 (2.3) Bulgaria 81 (2.8) Netherlands 89 (2.4) Scotland 91 (1.7)
Countries Not Meeting Age/Grade Specifications (High Percentageof Older Students; See Appendix A for Details):
Colombia 71 (4.0)‡ Germany 87 (2.2) Romania 69 (2.8) Slovenia 95 (1.2)
Countries With Unapproved Sampling Procedures at ClassroomLevel (See Appendix A for Details):
Denmark 92 (2.1) Greece 85 (1.7) Thailand 86 (1.5)
Unapproved Sampling Procedures at Classroom Level and Not Meeting Other Guidelines (See Appendix A for Details):‡ Israel 89 (2.2) Kuwait 82 (3.4) South Africa 55 (2.6)
International Average Percent Correct 87 (0.3)
*Eighth grade in most countries. See Table 2 for information about the grades tested in each country.‡Did not meet sampling guidelines for population coverage or use of replacement schools. See Figure 1.( ) Standard errors appear in parentheses. Because results are rounded to the nearest whole number, some totals may appear inconsistent.
SO
UR
CE
: IE
A T
hird
Inte
rnat
iona
l Mat
hem
atic
s an
d S
cien
ce S
tudy
(T
IMS
S),
199
4-95
. Mis
sour
i and
Ore
gon
data
col
lect
ed in
199
7.

58
C H A P T E R 3
Table 3.19: Data Representation, Analysis, and ProbabilityPercent Correct for Example Item 19 - Eighth Grade*
Percent Example 19Country Correct Pictograph of number
of students‡ UNITED STATES 89 (1.2)‡ MISSOURI 93 (1.2) OREGON 90 (1.3)
‡ Belgium (Fl) 86 (3.8) Canada 89 (1.5) Cyprus 82 (1.8) Czech Republic 84 (2.3)
‡ England 92 (1.7)‡ France 88 (1.6) Hong Kong 81 (2.0) Hungary 87 (1.7) Iceland 87 (2.9) Iran, Islamic Rep. 67 (2.9) Ireland 89 (1.8) Japan 94 (1.0) Korea 90 (1.6)
‡ Latvia (LSS) 82 (1.9)‡ Lithuania 75 (2.8) New Zealand 92 (1.4) Norway 86 (1.9) Portugal 86 (1.8) Russian Federation 78 (2.2) Singapore 94 (1.1) Slovak Republic 80 (2.0) Spain 86 (1.7) Sweden 87 (1.5)
‡ Switzerland 88 (2.1)Countries Not Satisfying Guidelines for Sample ParticipationRates (See Appendix A for Details):
Australia 88 (1.4) Austria 87 (2.1) Belgium (Fr) 82 (2.8) Bulgaria 75 (4.1) Netherlands 87 (3.6) Scotland 88 (1.7)
Countries Not Meeting Age/Grade Specifications (High Percentageof Older Students; See Appendix A for Details):
Colombia 64 (4.2)‡ Germany 82 (2.7) Romania 64 (2.7) Slovenia 77 (2.0)
Countries With Unapproved Sampling Procedures at ClassroomLevel (See Appendix A for Details):
Denmark 88 (2.2) Greece 77 (2.5) Thailand 94 (1.0)
Unapproved Sampling Procedures at Classroom Level and Not Meeting Other Guidelines (See Appendix A for Details):‡ Israel 87 (3.3) Kuwait 29 (4.7) South Africa 17 (3.1)
International Average Percent Correct 81 (0.4)
*Eighth grade in most countries. See Table 2 for information about the grades tested in each country.‡Did not meet sampling guidelines for population coverage or use of replacement schools. See Figure 1.( ) Standard errors appear in parentheses. Because results are rounded to the nearest whole number, some totals may appear inconsistent.
SO
UR
CE
: IE
A T
hird
Inte
rnat
iona
l Mat
hem
atic
s an
d S
cien
ce S
tudy
(T
IMS
S),
199
4-95
. Mis
sour
i and
Ore
gon
data
col
lect
ed in
199
7.

59
C H A P T E R 3
Table 3.20: Data Representation, Analysis, and ProbabilityPercent Correct for Example Item 20 - Eighth Grade*
Percent Example 20Country Correct Chance of picking red marble
‡ UNITED STATES 86 (1.2)‡ MISSOURI 87 (2.2) OREGON 88 (1.0)
‡ Belgium (Fl) 86 (1.9) Canada 90 (1.1) Cyprus 68 (2.9) Czech Republic 76 (2.8)
‡ England 86 (2.3)‡ France 82 (2.3) Hong Kong 89 (1.6) Hungary 82 (2.1) Iceland 77 (2.8) Iran, Islamic Rep. 37 (3.1) Ireland 82 (2.1) Japan 83 (1.4) Korea 91 (1.6)
‡ Latvia (LSS) 60 (3.0)‡ Lithuania 68 (2.9) New Zealand 82 (1.7) Norway 85 (1.7) Portugal 67 (2.3) Russian Federation 70 (2.5) Singapore 81 (1.9) Slovak Republic 70 (2.6) Spain 83 (2.0) Sweden 81 (1.9)
‡ Switzerland 86 (1.4)Countries Not Satisfying Guidelines for Sample ParticipationRates (See Appendix A for Details):
Australia 84 (1.6) Austria 82 (2.3) Belgium (Fr) 85 (2.3) Bulgaria 85 (3.8) Netherlands 91 (1.9) Scotland 82 (2.0)
Countries Not Meeting Age/Grade Specifications (High Percentageof Older Students; See Appendix A for Details):
Colombia 47 (4.0)‡ Germany 83 (2.2) Romania 52 (2.7) Slovenia 85 (2.2)
Countries With Unapproved Sampling Procedures at ClassroomLevel (See Appendix A for Details):
Denmark 83 (2.2) Greece 71 (1.9) Thailand 76 (1.9)
Unapproved Sampling Procedures at Classroom Level and Not Meeting Other Guidelines (See Appendix A for Details):‡ Israel 77 (3.2) Kuwait 53 (3.7) South Africa 28 (2.8)
International Average Percent Correct 76 (0.4)
*Eighth grade in most countries. See Table 2 for information about the grades tested in each country.‡Did not meet sampling guidelines for population coverage or use of replacement schools. See Figure 1.( ) Standard errors appear in parentheses. Because results are rounded to the nearest whole number, some totals may appear inconsistent.
SO
UR
CE
: IE
A T
hird
Inte
rnat
iona
l Mat
hem
atic
s an
d S
cien
ce S
tudy
(T
IMS
S),
199
4-95
. Mis
sour
i and
Ore
gon
data
col
lect
ed in
199
7.
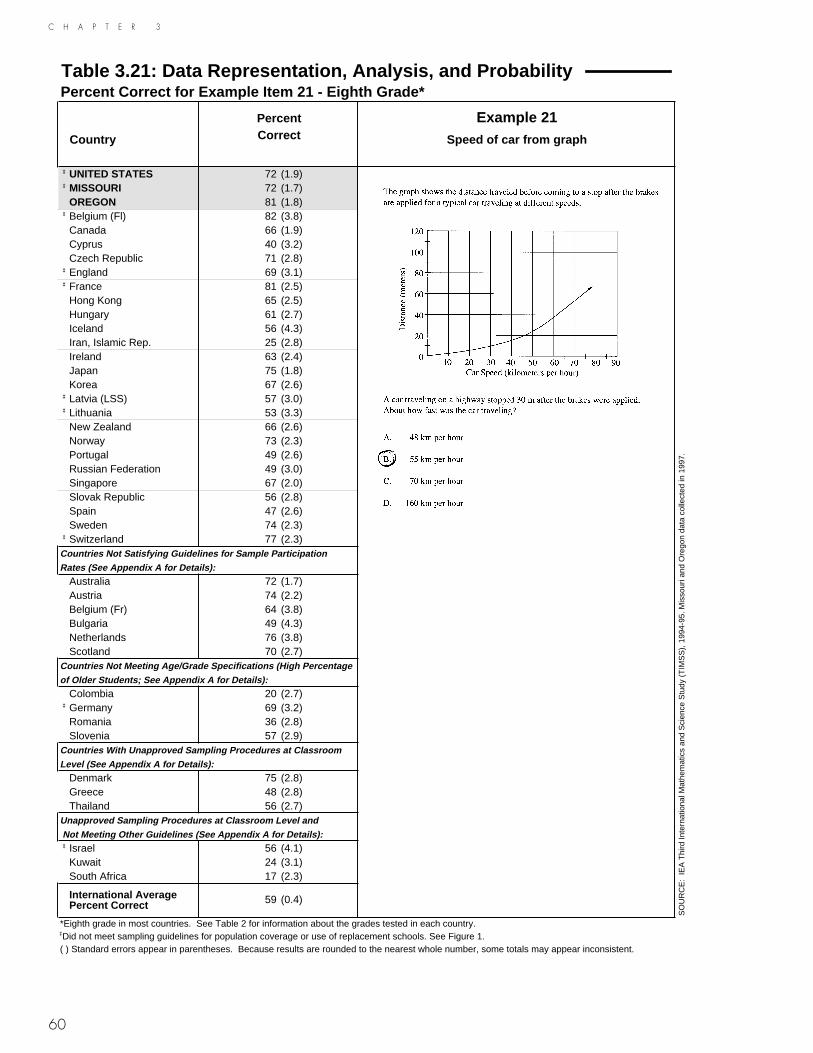
60
C H A P T E R 3
Table 3.21: Data Representation, Analysis, and ProbabilityPercent Correct for Example Item 21 - Eighth Grade*
Percent Example 21Country Correct Speed of car from graph
‡ UNITED STATES 72 (1.9)‡ MISSOURI 72 (1.7) OREGON 81 (1.8)
‡ Belgium (Fl) 82 (3.8) Canada 66 (1.9) Cyprus 40 (3.2) Czech Republic 71 (2.8)
‡ England 69 (3.1)‡ France 81 (2.5) Hong Kong 65 (2.5) Hungary 61 (2.7) Iceland 56 (4.3) Iran, Islamic Rep. 25 (2.8) Ireland 63 (2.4) Japan 75 (1.8) Korea 67 (2.6)
‡ Latvia (LSS) 57 (3.0)‡ Lithuania 53 (3.3) New Zealand 66 (2.6) Norway 73 (2.3) Portugal 49 (2.6) Russian Federation 49 (3.0) Singapore 67 (2.0) Slovak Republic 56 (2.8) Spain 47 (2.6) Sweden 74 (2.3)
‡ Switzerland 77 (2.3)Countries Not Satisfying Guidelines for Sample ParticipationRates (See Appendix A for Details):
Australia 72 (1.7) Austria 74 (2.2) Belgium (Fr) 64 (3.8) Bulgaria 49 (4.3) Netherlands 76 (3.8) Scotland 70 (2.7)
Countries Not Meeting Age/Grade Specifications (High Percentageof Older Students; See Appendix A for Details):
Colombia 20 (2.7)‡ Germany 69 (3.2) Romania 36 (2.8) Slovenia 57 (2.9)
Countries With Unapproved Sampling Procedures at ClassroomLevel (See Appendix A for Details):
Denmark 75 (2.8) Greece 48 (2.8) Thailand 56 (2.7)
Unapproved Sampling Procedures at Classroom Level and Not Meeting Other Guidelines (See Appendix A for Details):‡ Israel 56 (4.1) Kuwait 24 (3.1) South Africa 17 (2.3)
International Average Percent Correct 59 (0.4)
*Eighth grade in most countries. See Table 2 for information about the grades tested in each country.‡Did not meet sampling guidelines for population coverage or use of replacement schools. See Figure 1.( ) Standard errors appear in parentheses. Because results are rounded to the nearest whole number, some totals may appear inconsistent.
SO
UR
CE
: IE
A T
hird
Inte
rnat
iona
l Mat
hem
atic
s an
d S
cien
ce S
tudy
(T
IMS
S),
199
4-95
. Mis
sour
i and
Ore
gon
data
col
lect
ed in
199
7.

61
C H A P T E R 3
Table 3.22: Data Representation, Analysis, and ProbabilityPercent Correct for Example Item 22 - Eighth Grade*
Percent Example 22Country Correct Number of red cube faces
‡ UNITED STATES 47 (3.0)‡ MISSOURI 46 (3.5) OREGON 57 (2.6)
‡ Belgium (Fl) 68 (2.7) Canada 57 (2.2) Cyprus 46 (3.0) Czech Republic 36 (3.2)
‡ England 39 (3.1)‡ France 54 (3.0) Hong Kong 72 (2.7) Hungary 55 (2.8) Iceland 57 (4.2) Iran, Islamic Rep. 24 (3.9) Ireland 64 (3.3) Japan 75 (1.6) Korea 68 (3.2)
‡ Latvia (LSS) 28 (3.0)‡ Lithuania 22 (2.9) New Zealand 52 (2.4) Norway 57 (2.6) Portugal 21 (1.9) Russian Federation 33 (2.6) Singapore 88 (1.7) Slovak Republic 43 (2.9) Spain 34 (2.6) Sweden 55 (2.7)
‡ Switzerland 64 (3.0)Countries Not Satisfying Guidelines for Sample ParticipationRates (See Appendix A for Details):
Australia 53 (2.2) Austria 54 (3.3) Belgium (Fr) 61 (3.8) Bulgaria 46 (5.7) Netherlands 62 (3.6) Scotland 48 (3.3)
Countries Not Meeting Age/Grade Specifications (High Percentageof Older Students; See Appendix A for Details):
Colombia 15 (2.0)‡ Germany 45 (3.5) Romania 33 (2.8) Slovenia 42 (2.7)
Countries With Unapproved Sampling Procedures at ClassroomLevel (See Appendix A for Details):
Denmark 46 (2.9) Greece 38 (2.6) Thailand 54 (2.9)
Unapproved Sampling Procedures at Classroom Level and Not Meeting Other Guidelines (See Appendix A for Details):‡ Israel 53 (4.4) Kuwait 19 (3.9) South Africa 15 (1.9)
International Average Percent Correct 47 (0.5)
*Eighth grade in most countries. See Table 2 for information about the grades tested in each country.‡Did not meet sampling guidelines for population coverage or use of replacement schools. See Figure 1.( ) Standard errors appear in parentheses. Because results are rounded to the nearest whole number, some totals may appear inconsistent.
SO
UR
CE
: IE
A T
hird
Inte
rnat
iona
l Mat
hem
atic
s an
d S
cien
ce S
tudy
(T
IMS
S),
199
4-95
. Mis
sour
i and
Ore
gon
data
col
lect
ed in
199
7.

62
C H A P T E R 3
Table 3.23: Data Representation, Analysis, and ProbabilityPercent Correct for Example Item 23 - Eighth Grade*
Percent Percent Example 23Country Partially Fully Price of renting office space
Correct Correct‡ UNITED STATES 36 (1.5) 18 (1.6)‡ MISSOURI 31 (1.7) 22 (1.6) OREGON 36 (1.5) 21 (1.6)
‡ Belgium (Fl) 28 (2.6) 23 (1.9) Canada 33 (1.5) 24 (1.7) Cyprus 25 (1.8) 8 (1.6) Czech Republic 32 (2.8) 28 (2.6)
‡ England 30 (2.2) 20 (2.0)‡ France 26 (1.7) 26 (2.1) Hong Kong 26 (1.6) 37 (2.5) Hungary 25 (1.9) 20 (1.6) Iceland 26 (2.4) 15 (1.8) Iran, Islamic Rep. 28 (1.8) 1 (0.4) Ireland 35 (2.0) 25 (2.3) Japan 24 (1.2) 47 (1.5) Korea 21 (1.6) 50 (1.8)
‡ Latvia (LSS) 18 (1.8) 9 (1.2)‡ Lithuania 19 (1.9) 7 (1.2) New Zealand 28 (1.6) 22 (2.0) Norway 28 (1.5) 23 (1.6) Portugal 24 (1.4) 8 (0.9) Russian Federation 28 (2.0) 14 (1.7) Singapore 30 (1.5) 55 (2.0) Slovak Republic 25 (1.6) 15 (1.7) Spain 29 (1.5) 15 (1.3) Sweden 31 (1.7) 23 (1.7)
‡ Switzerland 27 (1.7) 26 (1.5)Countries Not Satisfying Guidelines for Sample Participation Rates (See Appendix A for Details):
Australia 29 (1.3) 22 (1.3) Austria 31 (2.5) 25 (1.8) Belgium (Fr) 29 (1.9) 20 (2.5) Bulgaria 34 (3.8) 6 (1.4) Netherlands 31 (2.2) 24 (2.6) Scotland 28 (1.5) 20 (2.3)
Countries Not Meeting Age/Grade Specifications (High Percentageof Older Students; See Appendix A for Details):
Colombia 16 (1.9) 1 (0.5)‡ Germany 24 (2.0) 14 (1.7) Romania 20 (2.1) 12 (1.7) Slovenia 25 (1.7) 20 (1.6)
Countries With Unapproved Sampling Procedures at ClassroomLevel (See Appendix A for Details):
Denmark 25 (1.7) 22 (2.2) Greece 27 (1.3) 13 (1.2) Thailand 26 (1.4) 21 (2.5)
Unapproved Sampling Procedures at Classroom Level and Not Meeting Other Guidelines (See Appendix A for Details):‡ Israel 29 (2.2) 15 (2.5) Kuwait 26 (2.5) 4 (1.2) South Africa 19 (1.6) 2 (1.1)
International Average Percent Correct 27 (0.3) 20 (0.3)
*Eighth grade in most countries. See Table 2 for information about the grades tested in each country.‡Did not meet sampling guidelines for population coverage or use of replacement schools. See Figure 1.( ) Standard errors appear in parentheses. Because results are rounded to the nearest whole number, some totals may appear inconsistent.
SO
UR
CE
: IE
A T
hird
Inte
rnat
iona
l Mat
hem
atic
s an
d S
cien
ce S
tudy
(T
IMS
S),
199
4-95
. Mis
sour
i and
Ore
gon
data
col
lect
ed in
199
7.

63
C H A P T E R 3
750
500
250
Figure 3.4International Difficulty Map for Data Representation, Analysis, and ProbabilityExample Items: Eighth Grade*
*Eighth grade in most countries; see Table 2 for information about the grades tested in each country.NOTE: Each item was placed onto the TIMSS international mathematics scale based on students' performance in both grades of TIMSSPopulation 2 (seventh and eighth grades in most countries). Items are shown at the point on the scale where students withthat level of proficiency had a 65 percent probability of providing a correct response.
Scale Value
675
Example 23
International Average Percent Fully Correct: 20%
Price of renting office space
V02
Scale Value
535
Example 21
International Average Percent Correct: 59%
Speed of car from graph
O02
Scale Value
394
Example 19
International Average Percent Correct: 81%
Pictograph of numberof students
J13 Scale Value
353
Example 18
Highest temperature on chart
International Average Percent Correct: 87%
L10
Scale Value
433
Example 20
Chance of picking red marble
International Average Percent Correct: 76%
M03
Scale Value
587
Example 22
Number of red cube faces
International Average Percent Correct: 47%
O05
64
C H A P T E R 3
What Have Students Learned About Measurement?The measurement items focused on students’ understanding of units of length, weight, time, area, and volume as well as on interpreting scales of measures.
A more detailed look at performance on the example items suggests that students in many countries had a solid grasp of a variety of measuring units and how to interpret them. Most students in the TIMSS countries were able to read the weight shown on the scale (Example Item 24 presented in Table 3.24). The international average on this item was 87% with Missouri (90%) and Oregon (92%) performing above this average. Students internationally (75% on average) also did relatively well on Example Item 25 (Table 3.25) about pacing off the width of a room. This item required some thought to understand that the longer the paces, the fewer required to cross the room. The most prevalent misconception was to indicate that the greatest number of paces was related to the longest pace. Interestingly, students in both Missouri (55%) and Oregon (58%) performed significantly below the international average as did those in the United States (48%).
As shown in Table 3.26, Example Item 26 required familiarity with the number of degrees in circles or parts of circles to identify the angle closest to 30 degrees. On average, internationally, it was answered correctly by 65% of the students. Oregon, at 59%, performed about the same as the United States at 57%. However, Missouri per-formed significantly lower at 49%.
Internationally, approximately half the students (53%) were able to determine 10.5 cm as the length of the pencil (Example Item 27). Table 3.27 indicates that students in both Missouri (46%) and Oregon (54%) were in line with many countries, including the United States (45%). Across the countries, performance was generally consistent although students did particularly well in Switzerland (73%), Austria (73%), and Germany (72%). They had the most difficulty in South Africa (17%).

C H A P T E R 3
65
Example Item 28, presented in Table 3.28, was a two-part task that first required stu-dents to actually draw a new rectangle whose length was one and one-half times the length of a given rectangle and whose width was half the width of that rectangle. All correctly drawn and labeled 9 cm by 2 cm rectangles were given full credit and those with one dimension correctly shown were given partial credit. In the second part of the item, students were asked to determine the ratio of the area of the new rectangle to the area of the one shown. Most students had considerable difficulty with the first part of this multifaceted task, and even more trouble with the second part (even though the scoring for full credit permitted correct ratios based on incorrect drawings). On average, 31% of the students provided a correct drawing of the new rectangle. In only two countries did at least half the students correctly draw the new rectangle, Korea (54%) and Austria (51%). Only 24% of the students in Oregon were successful, and fewer than 20% in Missouri (18%), the United States (16%), Iceland (18%), Colombia (5%), South Africa (4%), and Kuwait (10%) responded correctly. Compared with 10% of the students receiving partial credit on average internationally, 7% of the eighth graders in both Oregon and Missouri received partial credit. Internationally, the second part of the item was very difficult. On average, just 10% of the students provided a correct ratio between the newly drawn and given rectangles. It is interesting to note that while both Missouri and Oregon performed below the international average on the first part of the item, they performed better in relation to the international average on the second part of the item, with Oregon performing significantly above it (17%).
The international difficulty map for the measurement items (Figure 3.5) indicates that only the students with higher-than-average mathematics scores internationally were likely to demonstrate an ability to use measurement skills in situations involving several steps.

66
C H A P T E R 3
Table 3.24: MeasurementPercent Correct for Example Item 24 - Eighth Grade*
Percent Example 24Country Correct Weight shown on scale
‡ UNITED STATES 87 (1.7)‡ MISSOURI 90 (1.9) OREGON 92 (1.3)
‡ Belgium (Fl) 98 (0.7) Canada 90 (1.6) Cyprus 72 (2.4) Czech Republic 92 (1.7)
‡ England 94 (1.7)‡ France 94 (1.5) Hong Kong 91 (1.7) Hungary 92 (1.5) Iceland 88 (2.2) Iran, Islamic Rep. 71 (2.9) Ireland 91 (1.7) Japan 97 (0.6) Korea 95 (1.2)
‡ Latvia (LSS) 84 (2.2)‡ Lithuania 84 (2.2) New Zealand 91 (1.4) Norway 88 (1.7) Portugal 84 (2.0) Russian Federation 92 (1.3) Singapore 96 (0.9) Slovak Republic 88 (1.6) Spain 83 (1.8) Sweden 92 (1.3)
‡ Switzerland 97 (1.1)Countries Not Satisfying Guidelines for Sample ParticipationRates (See Appendix A for Details):
Australia 94 (0.9) Austria 90 (2.2) Belgium (Fr) 89 (2.7) Bulgaria 87 (4.4) Netherlands 97 (1.1) Scotland 92 (1.5)
Countries Not Meeting Age/Grade Specifications (High Percentageof Older Students; See Appendix A for Details):
Colombia 58 (4.5)‡ Germany 94 (1.6) Romania 74 (2.3) Slovenia 95 (1.3)
Countries With Unapproved Sampling Procedures at ClassroomLevel (See Appendix A for Details):
Denmark 88 (1.6) Greece 86 (1.7) Thailand 92 (1.1)
Unapproved Sampling Procedures at Classroom Level and Not Meeting Other Guidelines (See Appendix A for Details):‡ Israel 86 (3.5) Kuwait 58 (2.9) South Africa 52 (2.5)
International Average Percent Correct 87 (0.3)
*Eighth grade in most countries. See Table 2 for information about the grades tested in each country.‡Did not meet sampling guidelines for population coverage or use of replacement schools. See Figure 1.( ) Standard errors appear in parentheses. Because results are rounded to the nearest whole number, some totals may appear inconsistent.
SO
UR
CE
: IE
A T
hird
Inte
rnat
iona
l Mat
hem
atic
s an
d S
cien
ce S
tudy
(T
IMS
S),
199
4-95
. Mis
sour
i and
Ore
gon
data
col
lect
ed in
199
7.

67
C H A P T E R 3
Table 3.25: MeasurementPercent Correct for Example Item 25 - Eighth Grade*
Percent Example 25Country Correct Measuring the width of a room
‡ UNITED STATES 48 (2.6)‡ MISSOURI 55 (3.0) OREGON 58 (2.4)
‡ Belgium (Fl) 86 (2.7) Canada 70 (2.3) Cyprus 63 (2.9) Czech Republic 94 (1.4)
‡ England 73 (3.5)‡ France 81 (2.6) Hong Kong 72 (2.8) Hungary 59 (2.6) Iceland 80 (4.0) Iran, Islamic Rep. 57 (3.3) Ireland 83 (2.0) Japan 86 (1.3) Korea 77 (2.2)
‡ Latvia (LSS) 91 (1.5)‡ Lithuania 74 (3.4) New Zealand 69 (2.3) Norway 79 (2.2) Portugal 79 (2.2) Russian Federation 89 (1.5) Singapore 77 (2.3) Slovak Republic 88 (1.7) Spain 81 (1.7) Sweden 86 (1.8)
‡ Switzerland 87 (1.6)Countries Not Satisfying Guidelines for Sample ParticipationRates (See Appendix A for Details):
Australia 70 (1.9) Austria 86 (2.3) Belgium (Fr) 84 (2.0) Bulgaria 77 (3.4) Netherlands 82 (3.0) Scotland 66 (3.0)
Countries Not Meeting Age/Grade Specifications (High Percentageof Older Students; See Appendix A for Details):
Colombia 55 (3.8)‡ Germany 79 (2.4) Romania 70 (2.9) Slovenia 90 (1.7)
Countries With Unapproved Sampling Procedures at ClassroomLevel (See Appendix A for Details):
Denmark 80 (2.6) Greece 70 (2.2) Thailand 81 (1.8)
Unapproved Sampling Procedures at Classroom Level and Not Meeting Other Guidelines (See Appendix A for Details):‡ Israel 79 (3.3) Kuwait 39 (3.8) South Africa 23 (2.7)
International Average Percent Correct 75 (0.4)
*Eighth grade in most countries. See Table 2 for information about the grades tested in each country.‡Did not meet sampling guidelines for population coverage or use of replacement schools. See Figure 1.( ) Standard errors appear in parentheses. Because results are rounded to the nearest whole number, some totals may appear inconsistent.
SO
UR
CE
: IE
A T
hird
Inte
rnat
iona
l Mat
hem
atic
s an
d S
cien
ce S
tudy
(T
IMS
S),
199
4-95
. Mis
sour
i and
Ore
gon
data
col
lect
ed in
199
7.

68
C H A P T E R 3
Table 3.26: MeasurementPercent Correct for Example Item 26 - Eighth Grade*
Percent Example 26Country Correct Angle closest to 30 degrees
‡ UNITED STATES 57 (1.7)‡ MISSOURI 49 (2.9) OREGON 59 (1.9)
‡ Belgium (Fl) 64 (3.2) Canada 65 (2.1) Cyprus 64 (2.8) Czech Republic 76 (3.0)
‡ England 62 (2.9)‡ France 76 (2.5) Hong Kong 68 (2.3) Hungary 77 (2.3) Iceland 61 (4.4) Iran, Islamic Rep. 63 (2.7) Ireland 63 (2.6) Japan 76 (1.8) Korea 76 (2.2)
‡ Latvia (LSS) 65 (3.0)‡ Lithuania 63 (2.9) New Zealand 63 (2.4) Norway 70 (2.0) Portugal 48 (2.8) Russian Federation 72 (2.8) Singapore 73 (1.9) Slovak Republic 74 (2.4) Spain 59 (2.3) Sweden 61 (2.5)
‡ Switzerland 73 (2.4)Countries Not Satisfying Guidelines for Sample ParticipationRates (See Appendix A for Details):
Australia 64 (2.3) Austria 74 (3.1) Belgium (Fr) 67 (2.7) Bulgaria 78 (3.3) Netherlands 64 (3.3) Scotland 58 (2.7)
Countries Not Meeting Age/Grade Specifications (High Percentageof Older Students; See Appendix A for Details):
Colombia 37 (3.6)‡ Germany 63 (2.8) Romania 59 (2.9) Slovenia 77 (2.6)
Countries With Unapproved Sampling Procedures at ClassroomLevel (See Appendix A for Details):
Denmark 69 (3.1) Greece 64 (2.3) Thailand 78 (1.7)
Unapproved Sampling Procedures at Classroom Level and Not Meeting Other Guidelines (See Appendix A for Details):‡ Israel 50 (4.2) Kuwait 49 (3.3) South Africa 34 (2.5)
International Average Percent Correct 65 (0.4)
*Eighth grade in most countries. See Table 2 for information about the grades tested in each country.‡Did not meet sampling guidelines for population coverage or use of replacement schools. See Figure 1.( ) Standard errors appear in parentheses. Because results are rounded to the nearest whole number, some totals may appear inconsistent.
SO
UR
CE
: IE
A T
hird
Inte
rnat
iona
l Mat
hem
atic
s an
d S
cien
ce S
tudy
(T
IMS
S),
199
4-95
. Mis
sour
i and
Ore
gon
data
col
lect
ed in
199
7.

69
C H A P T E R 3
Table 3.27: MeasurementPercent Correct for Example Item 27 - Eighth Grade*
Percent Example 27Country Correct Approximate length
of pencil‡ UNITED STATES 45 (2.2)‡ MISSOURI 46 (2.5) OREGON 54 (1.8)
‡ Belgium (Fl) 69 (3.3) Canada 53 (2.0) Cyprus 40 (3.4) Czech Republic 67 (2.6)
‡ England 52 (3.0)‡ France 61 (2.6) Hong Kong 60 (3.2) Hungary 58 (2.6) Iceland 27 (2.6) Iran, Islamic Rep. 34 (3.3) Ireland 52 (2.4) Japan 64 (2.3) Korea 60 (2.7)
‡ Latvia (LSS) 60 (2.5)‡ Lithuania 41 (3.1) New Zealand 52 (2.7) Norway 62 (2.4) Portugal 43 (2.7) Russian Federation 59 (3.1) Singapore 64 (2.3) Slovak Republic 63 (2.8) Spain 52 (2.6) Sweden 67 (2.0)
‡ Switzerland 73 (2.6)Countries Not Satisfying Guidelines for Sample ParticipationRates (See Appendix A for Details):
Australia 55 (1.9) Austria 73 (2.5) Belgium (Fr) 57 (3.7) Bulgaria 45 (4.5) Netherlands 62 (3.3) Scotland 45 (3.0)
Countries Not Meeting Age/Grade Specifications (High Percentageof Older Students; See Appendix A for Details):
Colombia 29 (2.5)‡ Germany 72 (3.0) Romania 41 (2.6) Slovenia 70 (2.8)
Countries With Unapproved Sampling Procedures at ClassroomLevel (See Appendix A for Details):
Denmark 52 (3.2) Greece 33 (2.5) Thailand 57 (2.5)
Unapproved Sampling Procedures at Classroom Level and Not Meeting Other Guidelines (See Appendix A for Details):‡ Israel 44 (4.4) Kuwait 31 (3.5) South Africa 17 (2.1)
International Average Percent Correct 53 (0.4)
*Eighth grade in most countries. See Table 2 for information about the grades tested in each country.‡Did not meet sampling guidelines for population coverage or use of replacement schools. See Figure 1.( ) Standard errors appear in parentheses. Because results are rounded to the nearest whole number, some totals may appear inconsistent.
SO
UR
CE
: IE
A T
hird
Inte
rnat
iona
l Mat
hem
atic
s an
d S
cien
ce S
tudy
(T
IMS
S),
199
4-95
. Mis
sour
i and
Ore
gon
data
col
lect
ed in
199
7.
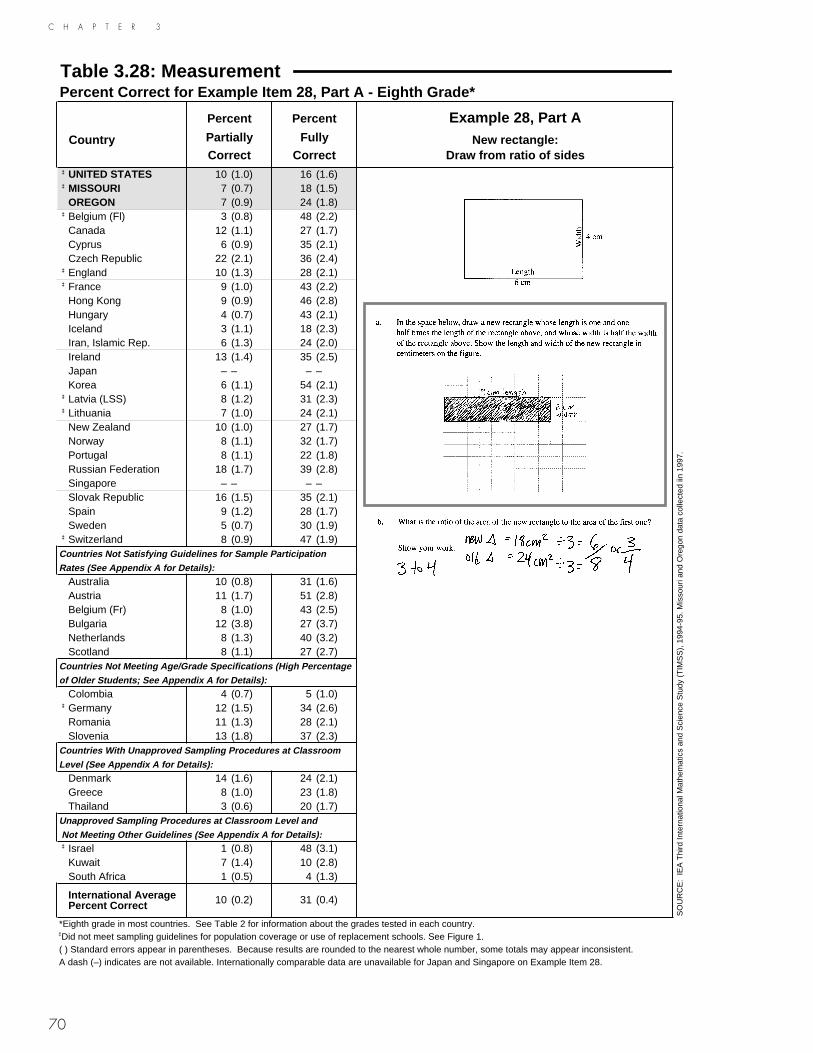
70
C H A P T E R 3
Table 3.28: MeasurementPercent Correct for Example Item 28, Part A - Eighth Grade*
Percent Percent Example 28, Part ACountry Partially Fully New rectangle:
Correct Correct Draw from ratio of sides‡ UNITED STATES 10 (1.0) 16 (1.6)‡ MISSOURI 7 (0.7) 18 (1.5) OREGON 7 (0.9) 24 (1.8)
‡ Belgium (Fl) 3 (0.8) 48 (2.2) Canada 12 (1.1) 27 (1.7) Cyprus 6 (0.9) 35 (2.1) Czech Republic 22 (2.1) 36 (2.4)
‡ England 10 (1.3) 28 (2.1)‡ France 9 (1.0) 43 (2.2) Hong Kong 9 (0.9) 46 (2.8) Hungary 4 (0.7) 43 (2.1) Iceland 3 (1.1) 18 (2.3) Iran, Islamic Rep. 6 (1.3) 24 (2.0) Ireland 13 (1.4) 35 (2.5) Japan – – – – Korea 6 (1.1) 54 (2.1)
‡ Latvia (LSS) 8 (1.2) 31 (2.3)‡ Lithuania 7 (1.0) 24 (2.1) New Zealand 10 (1.0) 27 (1.7) Norway 8 (1.1) 32 (1.7) Portugal 8 (1.1) 22 (1.8) Russian Federation 18 (1.7) 39 (2.8) Singapore – – – – Slovak Republic 16 (1.5) 35 (2.1) Spain 9 (1.2) 28 (1.7) Sweden 5 (0.7) 30 (1.9)
‡ Switzerland 8 (0.9) 47 (1.9)Countries Not Satisfying Guidelines for Sample ParticipationRates (See Appendix A for Details):
Australia 10 (0.8) 31 (1.6) Austria 11 (1.7) 51 (2.8) Belgium (Fr) 8 (1.0) 43 (2.5) Bulgaria 12 (3.8) 27 (3.7) Netherlands 8 (1.3) 40 (3.2) Scotland 8 (1.1) 27 (2.7)
Countries Not Meeting Age/Grade Specifications (High Percentageof Older Students; See Appendix A for Details):
Colombia 4 (0.7) 5 (1.0)‡ Germany 12 (1.5) 34 (2.6) Romania 11 (1.3) 28 (2.1) Slovenia 13 (1.8) 37 (2.3)
Countries With Unapproved Sampling Procedures at ClassroomLevel (See Appendix A for Details):
Denmark 14 (1.6) 24 (2.1) Greece 8 (1.0) 23 (1.8) Thailand 3 (0.6) 20 (1.7)
Unapproved Sampling Procedures at Classroom Level and Not Meeting Other Guidelines (See Appendix A for Details):‡ Israel 1 (0.8) 48 (3.1) Kuwait 7 (1.4) 10 (2.8) South Africa 1 (0.5) 4 (1.3)
International Average Percent Correct 10 (0.2) 31 (0.4)
*Eighth grade in most countries. See Table 2 for information about the grades tested in each country.‡Did not meet sampling guidelines for population coverage or use of replacement schools. See Figure 1.( ) Standard errors appear in parentheses. Because results are rounded to the nearest whole number, some totals may appear inconsistent.A dash (–) indicates are not available. Internationally comparable data are unavailable for Japan and Singapore on Example Item 28.
SO
UR
CE
: IE
A T
hird
Inte
rnat
iona
l Mat
hem
atic
s an
d S
cien
ce S
tudy
(T
IMS
S),
199
4-95
. Mis
sour
i and
Ore
gon
data
col
lect
ed ii
n 19
97.
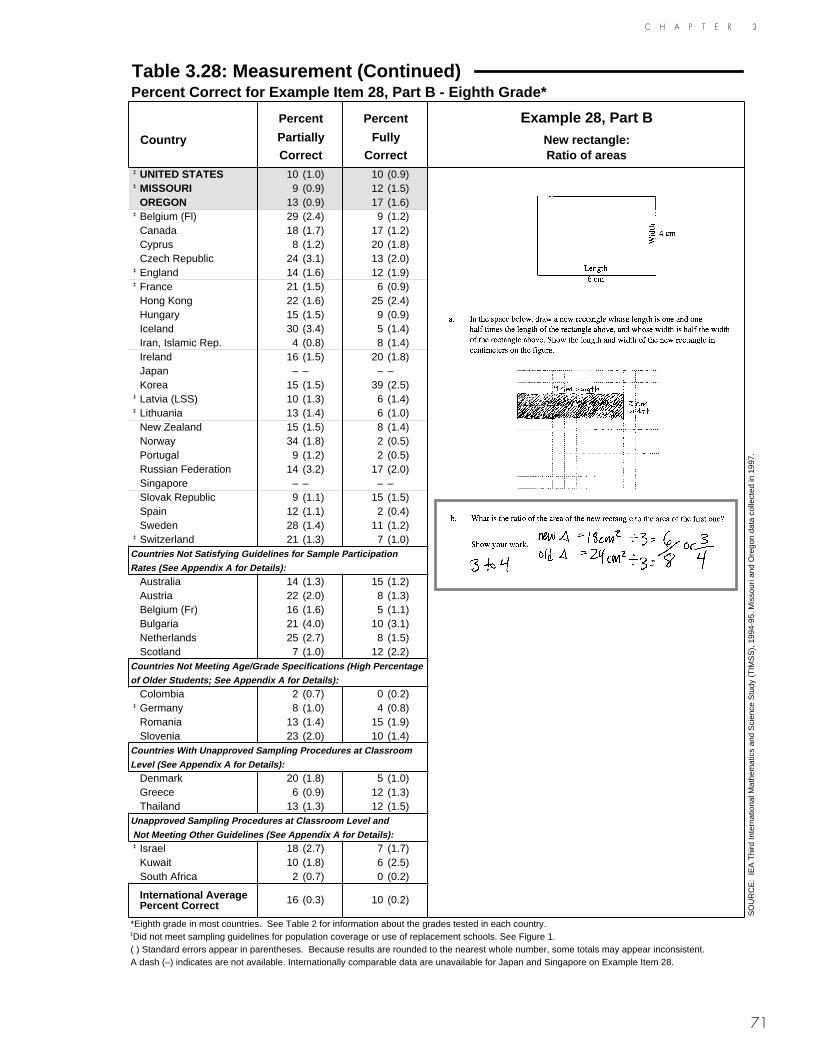
71
C H A P T E R 3
Table 3.28: Measurement (Continued)Percent Correct for Example Item 28, Part B - Eighth Grade*
Percent Percent Example 28, Part BCountry Partially Fully New rectangle:
Correct Correct Ratio of areas‡ UNITED STATES 10 (1.0) 10 (0.9)‡ MISSOURI 9 (0.9) 12 (1.5) OREGON 13 (0.9) 17 (1.6)
‡ Belgium (Fl) 29 (2.4) 9 (1.2) Canada 18 (1.7) 17 (1.2) Cyprus 8 (1.2) 20 (1.8) Czech Republic 24 (3.1) 13 (2.0)
‡ England 14 (1.6) 12 (1.9)‡ France 21 (1.5) 6 (0.9) Hong Kong 22 (1.6) 25 (2.4) Hungary 15 (1.5) 9 (0.9) Iceland 30 (3.4) 5 (1.4) Iran, Islamic Rep. 4 (0.8) 8 (1.4) Ireland 16 (1.5) 20 (1.8) Japan – – – – Korea 15 (1.5) 39 (2.5)
‡ Latvia (LSS) 10 (1.3) 6 (1.4)‡ Lithuania 13 (1.4) 6 (1.0) New Zealand 15 (1.5) 8 (1.4) Norway 34 (1.8) 2 (0.5) Portugal 9 (1.2) 2 (0.5) Russian Federation 14 (3.2) 17 (2.0) Singapore – – – – Slovak Republic 9 (1.1) 15 (1.5) Spain 12 (1.1) 2 (0.4) Sweden 28 (1.4) 11 (1.2)
‡ Switzerland 21 (1.3) 7 (1.0)Countries Not Satisfying Guidelines for Sample ParticipationRates (See Appendix A for Details):
Australia 14 (1.3) 15 (1.2) Austria 22 (2.0) 8 (1.3) Belgium (Fr) 16 (1.6) 5 (1.1) Bulgaria 21 (4.0) 10 (3.1) Netherlands 25 (2.7) 8 (1.5) Scotland 7 (1.0) 12 (2.2)
Countries Not Meeting Age/Grade Specifications (High Percentageof Older Students; See Appendix A for Details):
Colombia 2 (0.7) 0 (0.2)‡ Germany 8 (1.0) 4 (0.8) Romania 13 (1.4) 15 (1.9) Slovenia 23 (2.0) 10 (1.4)
Countries With Unapproved Sampling Procedures at ClassroomLevel (See Appendix A for Details):
Denmark 20 (1.8) 5 (1.0) Greece 6 (0.9) 12 (1.3) Thailand 13 (1.3) 12 (1.5)
Unapproved Sampling Procedures at Classroom Level and Not Meeting Other Guidelines (See Appendix A for Details):‡ Israel 18 (2.7) 7 (1.7) Kuwait 10 (1.8) 6 (2.5) South Africa 2 (0.7) 0 (0.2)
International Average Percent Correct 16 (0.3) 10 (0.2)
*Eighth grade in most countries. See Table 2 for information about the grades tested in each country.‡Did not meet sampling guidelines for population coverage or use of replacement schools. See Figure 1.( ) Standard errors appear in parentheses. Because results are rounded to the nearest whole number, some totals may appear inconsistent.A dash (–) indicates are not available. Internationally comparable data are unavailable for Japan and Singapore on Example Item 28.
SO
UR
CE
: IE
A T
hird
Inte
rnat
iona
l Mat
hem
atic
s an
d S
cien
ce S
tudy
(T
IMS
S),
199
4-95
. Mis
sour
i and
Ore
gon
data
col
lect
ed in
199
7.
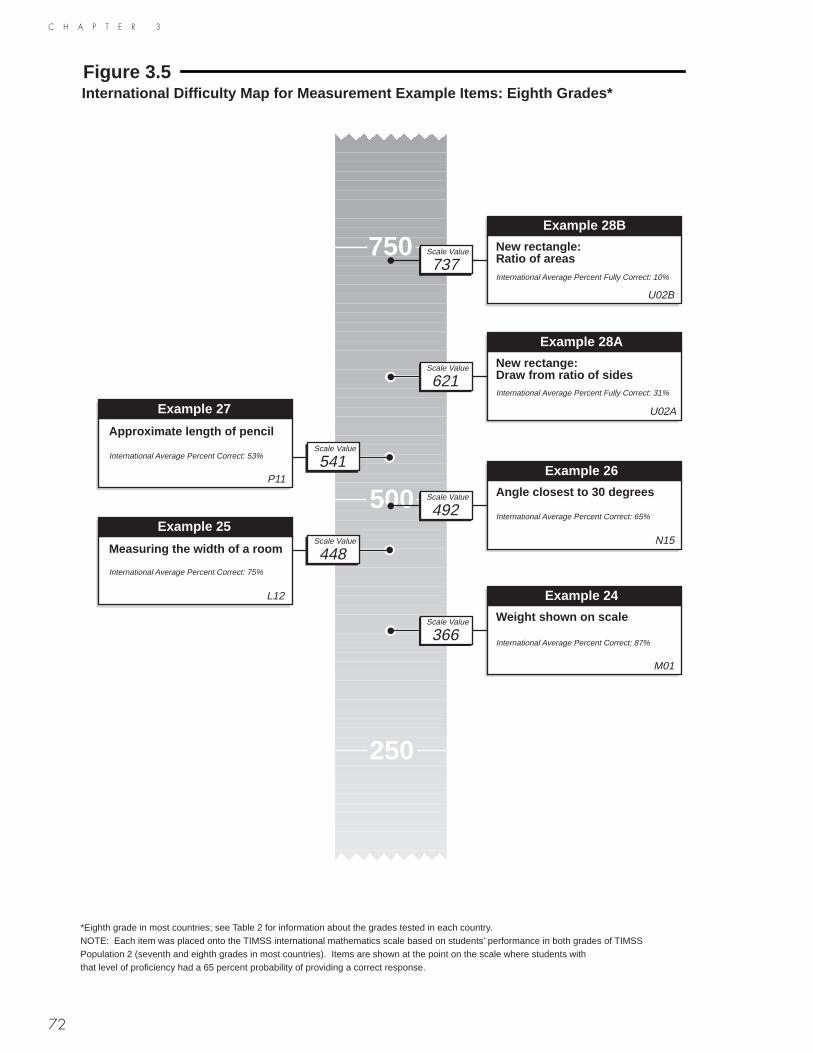
72
C H A P T E R 3
750
500
250
Figure 3.5International Difficulty Map for Measurement Example Items: Eighth Grades*
*Eighth grade in most countries; see Table 2 for information about the grades tested in each country.NOTE: Each item was placed onto the TIMSS international mathematics scale based on students' performance in both grades of TIMSSPopulation 2 (seventh and eighth grades in most countries). Items are shown at the point on the scale where students withthat level of proficiency had a 65 percent probability of providing a correct response.
Scale Value
448
Example 25
International Average Percent Correct: 75%
Measuring the width of a room
L12
Scale Value
366
Example 24
Weight shown on scale
International Average Percent Correct: 87%
M01
Scale Value
492
Example 26
Angle closest to 30 degrees
International Average Percent Correct: 65%
N15
Scale Value
541
Example 27
International Average Percent Correct: 53%
Approximate length of pencil
P11
Scale Value
621
Example 28A
New rectange:Draw from ratio of sidesInternational Average Percent Fully Correct: 31%
U02A
Scale Value
737
Example 28B
New rectangle:Ratio of areasInternational Average Percent Fully Correct: 10%
U02B
C H A P T E R 3
73
What Have Students Learned About Proportionality?A small set (11) of the mathematics items was designed to focus specifically on pro-portionality concepts and problems. Arguably, these items could have been classified in other content areas, usually fractions and number sense, but the decision was made to analyze them separately because they assess an important kind of mathematical rea-soning. Example Items 29 through 33 illustrate these types of questions.
Example Item 29, the least difficult of the items shown here, was one of the few pro-portionality items answered correctly by the majority of students in most countries. As shown in Table 3.29, the item asked about adding 5 boys and 5 girls to a class that was three-fifths girls. On average, 65% of the students correctly answered that there would still be more girls than boys in the class. Missouri and Oregon performed near the international average at 60% and 69%, respectively, as did the United States at 62%.
Despite the overall difficulty encountered by students in this content area, there was an extremely large range in performance. As presented in Table 3.30, Example Item 30 required students to determine the ratio of red paint to the total amount of paint when different colors of paint are combined. The range of performance on this item varied from students performing very well in Singapore (95%) and Korea (87%) to students performing poorly in Lithuania (14%), Colombia (15%), and Kuwait (14%). Students in Missouri and Oregon both performed above the international average at 56%.
Example Item 31, asked students to determine the amount paid for a portion of items purchased. Again, the range in performance was broad, as can be seen in Table 3.31. The international average was 38% with both Missouri and Oregon performing below the international average at 24% and 26%, respectively.
As presented in Table 3.32, Example Item 32 required students to determine the number of girls in a class of 28 based on the ratio of girls to boys. This item clearly illustrates the extent of the difference in achievement levels. While the international average was 38%, the question was answered correctly by 92% of the students in Singapore com-pared to very few in Colombia (12%), Greece (13%), South Africa (9%), and Kuwait (12%). Students in Missouri (38%) and Oregon (42%) had performance in mid-range, close to the international average (38%). Both performed above the United States (34%).
It is clear from the results presented in Table 3.33 that Example Item 33 was the most difficult of the proportionality items presented in this report. Even Singapore (47%), who fared well in most of the proportionality items, performed less well on this item. The international average percent correct was 25%, with Missouri (20%) and Oregon (21%) performing near the international average.
As described previously in Chapter 2, this item group was relatively more difficult for students than those from the other content areas. Figure 3.6 shows the extreme diffi-culty of these items for students. Only those students scoring above 600 on the math-ematics scale were likely to answer most of the proportionality questions correctly.

74
C H A P T E R 3
Table 3.29: ProportionalityPercent Correct for Example Item 29 - Eighth Grade*
Percent Example 29Country Correct More boys or girls in class
‡ UNITED STATES 62 (2.2)‡ MISSOURI 60 (2.7) OREGON 69 (2.1)
‡ Belgium (Fl) 82 (2.9) Canada 66 (2.5) Cyprus 63 (2.7) Czech Republic 70 (2.7)
‡ England 69 (3.3)‡ France 75 (2.4) Hong Kong 78 (1.7) Hungary 67 (2.3) Iceland 66 (4.6) Iran, Islamic Rep. 51 (3.2) Ireland 78 (2.4) Japan 82 (1.9) Korea 82 (2.2)
‡ Latvia (LSS) 57 (3.4)‡ Lithuania 51 (3.0) New Zealand 70 (2.3) Norway 73 (2.4) Portugal 50 (2.6) Russian Federation 47 (2.5) Singapore 85 (1.7) Slovak Republic 62 (2.9) Spain 62 (3.0) Sweden 74 (2.0)
‡ Switzerland 76 (2.2)Countries Not Satisfying Guidelines for Sample ParticipationRates (See Appendix A for Details):
Australia 74 (1.4) Austria 73 (2.7) Belgium (Fr) 76 (2.8) Bulgaria 57 (4.4) Netherlands 77 (2.7) Scotland 71 (2.7)
Countries Not Meeting Age/Grade Specifications (High Percentageof Older Students; See Appendix A for Details):
Colombia 30 (3.9)‡ Germany 67 (3.3) Romania 52 (3.0) Slovenia 66 (2.5)
Countries With Unapproved Sampling Procedures at ClassroomLevel (See Appendix A for Details):
Denmark 68 (2.9) Greece 59 (2.5) Thailand 56 (2.7)
Unapproved Sampling Procedures at Classroom Level and Not Meeting Other Guidelines (See Appendix A for Details):‡ Israel 75 (4.0) Kuwait 25 (3.0) South Africa 31 (2.2)
International Average Percent Correct 65 (0.4)
*Eighth grade in most countries. See Table 2 for information about the grades tested in each country.‡Did not meet sampling guidelines for population coverage or use of replacement schools. See Figure 1.( ) Standard errors appear in parentheses. Because results are rounded to the nearest whole number, some totals may appear inconsistent.
SO
UR
CE
: IE
A T
hird
Inte
rnat
iona
l Mat
hem
atic
s an
d S
cien
ce S
tudy
(T
IMS
S),
199
4-95
. Mis
sour
i and
Ore
gon
data
col
lect
ed in
199
7.
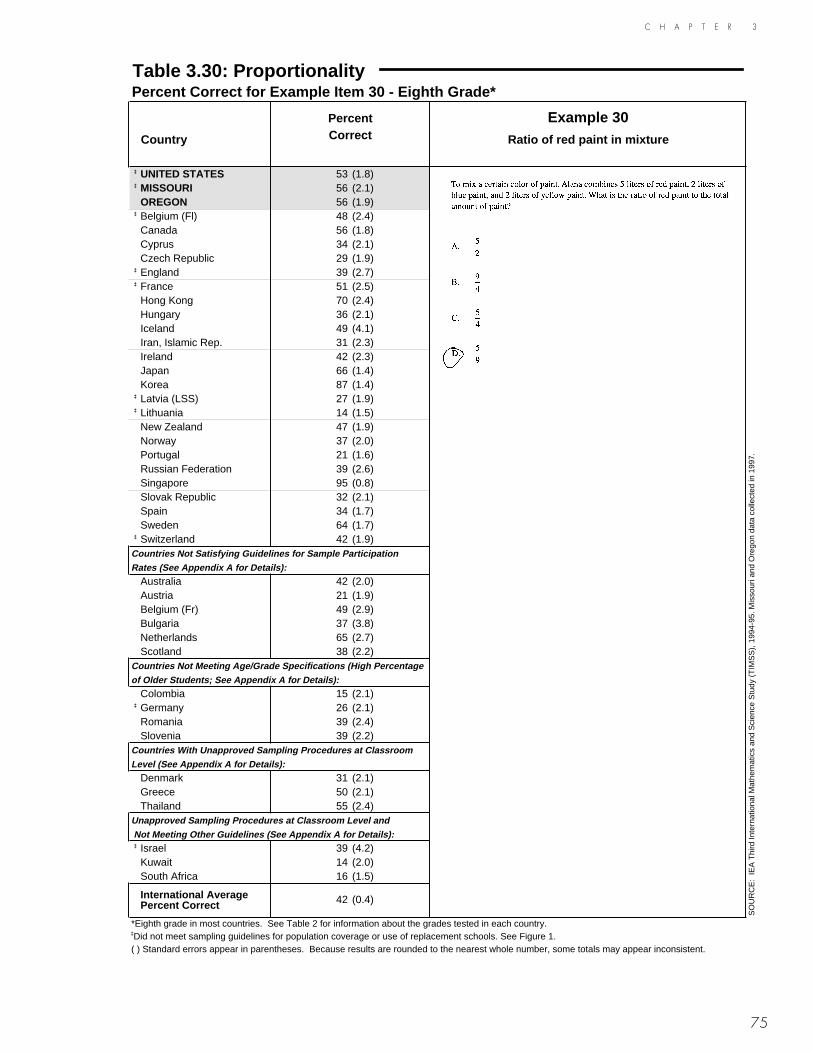
75
C H A P T E R 3
Table 3.30: ProportionalityPercent Correct for Example Item 30 - Eighth Grade*
Percent Example 30Country Correct Ratio of red paint in mixture
‡ UNITED STATES 53 (1.8)‡ MISSOURI 56 (2.1) OREGON 56 (1.9)
‡ Belgium (Fl) 48 (2.4) Canada 56 (1.8) Cyprus 34 (2.1) Czech Republic 29 (1.9)
‡ England 39 (2.7)‡ France 51 (2.5) Hong Kong 70 (2.4) Hungary 36 (2.1) Iceland 49 (4.1) Iran, Islamic Rep. 31 (2.3) Ireland 42 (2.3) Japan 66 (1.4) Korea 87 (1.4)
‡ Latvia (LSS) 27 (1.9)‡ Lithuania 14 (1.5) New Zealand 47 (1.9) Norway 37 (2.0) Portugal 21 (1.6) Russian Federation 39 (2.6) Singapore 95 (0.8) Slovak Republic 32 (2.1) Spain 34 (1.7) Sweden 64 (1.7)
‡ Switzerland 42 (1.9)Countries Not Satisfying Guidelines for Sample ParticipationRates (See Appendix A for Details):
Australia 42 (2.0) Austria 21 (1.9) Belgium (Fr) 49 (2.9) Bulgaria 37 (3.8) Netherlands 65 (2.7) Scotland 38 (2.2)
Countries Not Meeting Age/Grade Specifications (High Percentageof Older Students; See Appendix A for Details):
Colombia 15 (2.1)‡ Germany 26 (2.1) Romania 39 (2.4) Slovenia 39 (2.2)
Countries With Unapproved Sampling Procedures at ClassroomLevel (See Appendix A for Details):
Denmark 31 (2.1) Greece 50 (2.1) Thailand 55 (2.4)
Unapproved Sampling Procedures at Classroom Level and Not Meeting Other Guidelines (See Appendix A for Details):‡ Israel 39 (4.2) Kuwait 14 (2.0) South Africa 16 (1.5)
International Average Percent Correct 42 (0.4)
*Eighth grade in most countries. See Table 2 for information about the grades tested in each country.‡Did not meet sampling guidelines for population coverage or use of replacement schools. See Figure 1.( ) Standard errors appear in parentheses. Because results are rounded to the nearest whole number, some totals may appear inconsistent.
SO
UR
CE
: IE
A T
hird
Inte
rnat
iona
l Mat
hem
atic
s an
d S
cien
ce S
tudy
(T
IMS
S),
199
4-95
. Mis
sour
i and
Ore
gon
data
col
lect
ed in
199
7.

76
C H A P T E R 3
Table 3.31: ProportionalityPercent Correct for Example Item 31 - Eighth Grade*
Percent Example 31Country Correct Amount paid for portion
of items‡ UNITED STATES 23 (2.2)‡ MISSOURI 24 (2.1) OREGON 26 (2.1)
‡ Belgium (Fl) 58 (4.1) Canada 26 (2.3) Cyprus 30 (3.0) Czech Republic 63 (2.8)
‡ England 17 (2.9)‡ France 54 (2.9) Hong Kong 62 (3.2) Hungary 42 (2.5) Iceland 25 (4.1) Iran, Islamic Rep. 19 (2.6) Ireland 41 (3.3) Japan 71 (2.0) Korea 62 (2.5)
‡ Latvia (LSS) 39 (2.9)‡ Lithuania 36 (3.2) New Zealand 22 (2.0) Norway 27 (2.4) Portugal 20 (2.5) Russian Federation 49 (3.8) Singapore 83 (1.8) Slovak Republic 54 (2.7) Spain 42 (2.7) Sweden 30 (2.0)
‡ Switzerland 60 (2.4)Countries Not Satisfying Guidelines for Sample ParticipationRates (See Appendix A for Details):
Australia 31 (1.8) Austria 67 (3.0) Belgium (Fr) 41 (3.1) Bulgaria 34 (4.4) Netherlands 41 (3.7) Scotland 19 (2.6)
Countries Not Meeting Age/Grade Specifications (High Percentageof Older Students; See Appendix A for Details):
Colombia 7 (1.6)‡ Germany 37 (3.4) Romania 32 (2.6) Slovenia 52 (3.0)
Countries With Unapproved Sampling Procedures at ClassroomLevel (See Appendix A for Details):
Denmark 28 (2.6) Greece 39 (2.7) Thailand 43 (2.9)
Unapproved Sampling Procedures at Classroom Level and Not Meeting Other Guidelines (See Appendix A for Details):‡ Israel 42 (4.8) Kuwait 2 (0.8) South Africa 2 (0.8)
International Average Percent Correct 38 (0.4)
*Eighth grade in most countries. See Table 2 for information about the grades tested in each country.‡Did not meet sampling guidelines for population coverage or use of replacement schools. See Figure 1.( ) Standard errors appear in parentheses. Because results are rounded to the nearest whole number, some totals may appear inconsistent.
SO
UR
CE
: IE
A T
hird
Inte
rnat
iona
l Mat
hem
atic
s an
d S
cien
ce S
tudy
(T
IMS
S),
199
4-95
. Mis
sour
i and
Ore
gon
data
col
lect
ed in
199
7.

77
C H A P T E R 3
Table 3.32: ProportionalityPercent Correct for Example Item 32 - Eighth Grade*
Percent Example 32Country Correct Number of girls from
boy/girl ratio‡ UNITED STATES 34 (2.3)‡ MISSOURI 38 (1.9) OREGON 42 (2.2)
‡ Belgium (Fl) 34 (3.7) Canada 43 (2.4) Cyprus 24 (2.6) Czech Republic 60 (3.7)
‡ England 42 (3.4)‡ France 43 (3.1) Hong Kong 63 (3.3) Hungary 57 (2.6) Iceland 18 (3.1) Iran, Islamic Rep. 22 (2.4) Ireland 56 (2.9) Japan 53 (1.8) Korea 64 (2.6)
‡ Latvia (LSS) 32 (3.1)‡ Lithuania 30 (2.7) New Zealand 37 (2.5) Norway 19 (2.2) Portugal 17 (1.8) Russian Federation 37 (3.1) Singapore 92 (1.3) Slovak Republic 58 (2.7) Spain 24 (2.2) Sweden 24 (2.0)
‡ Switzerland 38 (2.5)Countries Not Satisfying Guidelines for Sample ParticipationRates (See Appendix A for Details):
Australia 50 (2.3) Austria 46 (2.6) Belgium (Fr) 48 (3.1) Bulgaria 54 (4.3) Netherlands 43 (4.6) Scotland 37 (3.3)
Countries Not Meeting Age/Grade Specifications (High Percentageof Older Students; See Appendix A for Details):
Colombia 12 (2.0)‡ Germany 30 (3.4) Romania 29 (2.7) Slovenia 43 (2.7)
Countries With Unapproved Sampling Procedures at ClassroomLevel (See Appendix A for Details):
Denmark 35 (3.5) Greece 13 (1.9) Thailand 48 (2.7)
Unapproved Sampling Procedures at Classroom Level and Not Meeting Other Guidelines (See Appendix A for Details):‡ Israel 22 (3.4) Kuwait 12 (3.7) South Africa 9 (1.7)
International Average Percent Correct 38 (0.4)
*Eighth grade in most countries. See Table 2 for information about the grades tested in each country.‡Did not meet sampling guidelines for population coverage or use of replacement schools. See Figure 1.( ) Standard errors appear in parentheses. Because results are rounded to the nearest whole number, some totals may appear inconsistent.
SO
UR
CE
: IE
A T
hird
Inte
rnat
iona
l Mat
hem
atic
s an
d S
cien
ce S
tudy
(T
IMS
S),
199
4-95
. Mis
sour
i and
Ore
gon
data
col
lect
ed in
199
7.

78
C H A P T E R 3
Table 3.33: ProportionalityPercent Correct for Example Item 33 - Eighth Grade*
Percent Example 33Country Correct Missing values
in proportionality table‡ UNITED STATES 20 (1.6)‡ MISSOURI 20 (1.9) OREGON 21 (1.9)
‡ Belgium (Fl) 33 (2.9) Canada 26 (2.1) Cyprus 24 (2.4) Czech Republic 30 (3.2)
‡ England 18 (3.0)‡ France 33 (2.6) Hong Kong 38 (2.9) Hungary 24 (2.4) Iceland 14 (3.2) Iran, Islamic Rep. 31 (4.3) Ireland 25 (2.1) Japan 49 (2.2) Korea 41 (2.6)
‡ Latvia (LSS) 21 (2.6)‡ Lithuania 14 (2.2) New Zealand 19 (2.1) Norway 15 (1.8) Portugal 21 (2.3) Russian Federation 27 (2.3) Singapore 47 (2.8) Slovak Republic 27 (2.9) Spain 10 (1.5) Sweden 14 (1.8)
‡ Switzerland 29 (2.4)Countries Not Satisfying Guidelines for Sample ParticipationRates (See Appendix A for Details):
Australia 22 (1.7) Austria 18 (2.1) Belgium (Fr) 19 (2.6) Bulgaria 44 (6.4) Netherlands 29 (3.1) Scotland 15 (2.4)
Countries Not Meeting Age/Grade Specifications (High Percentageof Older Students; See Appendix A for Details):
Colombia 11 (2.2)‡ Germany 18 (2.2) Romania 29 (2.9) Slovenia 24 (2.1)
Countries With Unapproved Sampling Procedures at ClassroomLevel (See Appendix A for Details):
Denmark 13 (2.3) Greece 30 (2.3) Thailand 39 (2.5)
Unapproved Sampling Procedures at Classroom Level and Not Meeting Other Guidelines (See Appendix A for Details):‡ Israel 17 (2.8) Kuwait 15 (2.5) South Africa 13 (1.4)
International Average Percent Correct 25 (0.4)
*Eighth grade in most countries. See Table 2 for information about the grades tested in each country.‡Did not meet sampling guidelines for population coverage or use of replacement schools. See Figure 1.( ) Standard errors appear in parentheses. Because results are rounded to the nearest whole number, some totals may appear inconsistent.
SO
UR
CE
: IE
A T
hird
Inte
rnat
iona
l Mat
hem
atic
s an
d S
cien
ce S
tudy
(T
IMS
S),
199
4-95
. Mis
sour
i and
Ore
gon
data
col
lect
ed in
199
7.

79
C H A P T E R 3
750
500
250
Figure 3.6International Difficulty Map for Proportionality Example Items: Eighth Grade*
*Eighth grade in most countries; see Table 2 for information about the grades tested in each country.NOTE: Each item was placed onto the TIMSS international mathematics scale based on students' performance in both grades of TIMSSPopulation 2 (seventh and eighth grades in most countries). Items are shown at the point on the scale where students withthat level of proficiency had a 65 percent probability of providing a correct response.
Scale Value
617
Example 31
Amount paid for portionof items
International Average Percent Correct: 38%
R14 Scale Value
603
Example 30
International Average Percent Correct: 42%
Ratio of red paint in mixture
V03
Scale Value
634
Example 32
International Average Percent Correct: 38%
Number of girls fromboy/girl ratio
M06
Scale Value
693
Example 33
Missing values inproportionality tableInternational Average Percent Correct: 25%
L14
Scale Value
487
Example 29
More boys or girls in class
International Average Percent Correct: 65%
Q05

80
C H A P T E R 4
81
Chapter 4STUDENTS’ BACKGROUNDS AND ATTITUDES TOWARD MATHEMATICS
To provide an educational context for interpreting the mathematics achievement results, TIMSS collected a full range of descriptive information from students about their backgrounds, as well as their activities in and out of school. This chapter presents students’ responses to a selected subset of these questions. In an effort to explore the degree to which the students’ home and social environment fostered academic devel-opment, some of the questions presented herein address the availability of educational resources in the home. Another group of questions is provided to help examine whether or not students typically spend their out-of-school time in ways that support their in-school academic performance. Because students’ attitudes and opinions about mathematics reflect what happens in school and their perceptions of the value of math-ematics in broader social contexts, results also are described for several questions from the affective domain. More specifically, these questions asked students to express their opinions about the abilities necessary for success in mathematics, provide infor-mation about what motivates them to do well in mathematics, and indicate their attitudes towards mathematics.
What Educational Resources Do Students Have inTheir Homes?Students were asked about the availability at home of three types of educational resources – a dictionary, a study desk or table for their own use, and a computer. Table 4.1 reveals that similar to the results in most countries, students in Missouri and Oregon, with all three of these educational study aids had higher mathematics achievement than students who did not have ready access to these study aids. Nearly all of the students (97%) in both Missouri and Oregon reported having a dictionary in their home, which corresponded to the results in many countries including the United States. There was more variation among countries in the percentage of students reporting their own study desk or table, but 89% to 90% so reported in Missouri, Oregon, and the United States. Of the three study aids, the most variation was in the number of stu-dents reporting having a home computer. About three-fourths of the eighth graders in Oregon (76%) reported having a computer in the home as did 64% of the students in Missouri. Even though the percentage of home computers in Oregon was notably larger than that reported by U.S. students as a whole (59%), it was consistent with some TIMSS countries. In several countries, more than 70% of students reported having a computer in the home, including the more than 85% who so reported in England, the Netherlands, and Scotland.

82
C H A P T E R 4
Table 4.1Students' Reports on Educational Aids in the Home: Dictionary, Study Desk/Table
and Computer - Mathematics - Eighth Grade*
Country
Have All Three Educational Aids
Do Not Have All Three Educational Aids
Have Dictionary
Have Study Desk/Table
for Own Use
Have Computer
Percent of Students
Mean Achievement
Percent of Students
Mean Achievement
Percent of Students
Percent of Students
Percent of Students
UNITED STATES 56 (1.7) 521 (4.7) 44 (1.7) 474 (4.2) 97 (0.4) 90 (0.7) 59 (1.7)
MISSOURI 59 (1.9) 522 (7.0) 41 (1.9) 482 (6.4) 97 (0.5) 90 (0.8) 64 (1.9)
OREGON 70 (1.9) 538 (7.8) 30 (1.9) 495 (7.2) 97 (0.3) 89 (0.8) 76 (1.8)
Australia 66 (1.2) 542 (4.3) 34 (1.2) 509 (4.5) 88 (0.7) 97 (0.3) 73 (1.2)
Austria 56 (1.5) 548 (3.6) 44 (1.5) 530 (3.9) 98 (0.3) 93 (0.8) 59 (1.5)
Belgium (Fl) 64 (1.3) 577 (4.9) 36 (1.3) 547 (7.2) 99 (0.5) 96 (0.5) 67 (1.3)
Belgium (Fr) 58 (1.4) 541 (3.3) 42 (1.4) 510 (4.8) 97 (0.5) 96 (0.5) 60 (1.4)
Canada 57 (1.4) 539 (2.4) 43 (1.4) 513 (3.2) 97 (0.4) 89 (0.6) 61 (1.3)
Colombia 10 (1.2) 407 (9.3) 90 (1.2) 383 (3.4) 96 (0.5) 84 (1.0) 11 (1.2)
Cyprus 37 (0.9) 486 (2.8) 63 (0.9) 468 (2.4) 97 (0.3) 96 (0.5) 39 (0.9)
Czech Republic 33 (1.3) 583 (5.8) 67 (1.3) 555 (5.0) 94 (0.6) 90 (0.6) 36 (1.2)
Denmark 66 (1.5) 510 (3.0) 34 (1.5) 492 (4.6) 85 (1.1) 98 (0.3) 76 (1.2)
England 80 (1.0) 512 (3.1) 20 (1.0) 485 (5.6) 98 (0.4) 90 (0.8) 89 (0.8)
France 49 (1.3) 547 (3.6) 51 (1.3) 531 (3.6) 99 (0.2) 96 (0.4) 50 (1.3)
Germany 66 (1.1) 515 (4.3) 34 (1.1) 500 (5.5) 98 (0.4) 93 (0.6) 71 (1.0)
Greece 28 (1.0) 502 (5.4) 72 (1.0) 478 (2.8) 97 (0.3) 93 (0.5) 29 (1.0)
Hong Kong 33 (1.8) 606 (7.3) 67 (1.8) 582 (6.5) 99 (0.1) 80 (1.1) 39 (1.9)
Hungary 32 (1.2) 574 (3.7) 68 (1.2) 523 (3.4) 77 (1.2) 92 (0.7) 37 (1.2)
Iceland 72 (1.6) 490 (5.2) 28 (1.6) 479 (4.5) 95 (0.5) 96 (0.6) 77 (1.4)
Iran, Islamic Rep. 1 (0.3) ~ ~ 99 (0.3) 430 (2.2) 54 (1.5) 40 (2.0) 4 (0.4)
Ireland 67 (1.2) 536 (5.2) 33 (1.2) 514 (6.3) 99 (0.3) 86 (0.9) 78 (1.1)
Israel 75 (2.1) 534 (5.8) 25 (2.1) 497 (8.8) 100 (0.2) 98 (0.4) 76 (2.1)
Japan – – – – – – – – – – – – – –
Korea 38 (1.2) 635 (3.6) 62 (1.2) 591 (2.7) 98 (0.2) 95 (0.4) 39 (1.2)
Kuwait 38 (2.4) 398 (3.0) 62 (2.4) 389 (2.7) 84 (1.0) 73 (2.2) 53 (2.0)
Latvia (LSS) 13 (0.8) 492 (5.4) 87 (0.8) 495 (3.1) 94 (0.6) 98 (0.3) 13 (0.9)
Lithuania 35 (1.3) 485 (4.0) 65 (1.3) 474 (4.0) 88 (1.0) 95 (0.6) 42 (1.4)
Netherlands 83 (1.3) 545 (8.2) 17 (1.3) 524 (7.7) 100 (0.1) 99 (0.2) 85 (1.2)
New Zealand 56 (1.4) 522 (5.0) 44 (1.4) 491 (4.6) 99 (0.2) 91 (0.6) 60 (1.3)
Norway 63 (1.1) 512 (2.7) 37 (1.1) 489 (2.9) 97 (0.3) 98 (0.2) 64 (1.1)
Portugal 35 (1.8) 471 (3.6) 65 (1.8) 446 (2.2) 98 (0.4) 84 (0.9) 39 (1.8)
Romania 8 (1.0) 531 (8.5) 92 (1.0) 479 (3.8) 60 (1.6) 69 (1.3) 19 (1.2)
Russian Federation 30 (1.4) 541 (5.5) 70 (1.4) 534 (6.1) 88 (1.1) 95 (0.7) 35 (1.5)
Scotland 74 (1.2) 506 (5.8) 26 (1.2) 480 (6.6) 96 (0.5) 84 (1.2) 90 (0.6)
Singapore 47 (1.5) 657 (5.0) 53 (1.5) 631 (5.1) 99 (0.1) 92 (0.5) 49 (1.5)
Slovak Republic 27 (1.2) 570 (4.3) 73 (1.2) 539 (3.6) 96 (0.5) 86 (0.9) 31 (1.2)
Slovenia 43 (1.4) 563 (3.7) 57 (1.4) 525 (3.4) 94 (0.5) 93 (0.6) 47 (1.3)
Spain 40 (1.3) 501 (2.9) 60 (1.3) 479 (2.1) 99 (0.1) 93 (0.5) 42 (1.2)
Sweden 58 (1.3) 532 (2.9) 42 (1.3) 501 (3.5) 94 (0.4) 100 (0.1) 60 (1.3)
Switzerland 63 (1.2) 555 (3.2) 37 (1.2) 531 (3.6) 97 (0.4) 95 (0.4) 66 (1.2)
Thailand 4 (0.8) 577 (14.9) 96 (0.8) 521 (5.4) 68 (2.1) 66 (2.1) 4 (0.9)*Eighth grade in most countries; see Table 2 for more information about the grades tested in each country.( ) Standard errors appear in parentheses. Because results are rounded to the nearest whole number, some totals may appear inconsistent.Countries shown in italics did not satisfy one or more guidelines for sample participation rates or student sampling (see Figure 1). Background datafor Bulgaria and South Africa not available.A dash (–) indicates data are not available. A tilde (~) indicates insufficient data to report achievement.
SO
UR
CE
: IE
A T
hird
Inte
rnat
iona
l Mat
hem
atic
s an
d S
cien
ce S
tudy
(T
IMS
S),
199
4-95
. Mis
sour
i and
Ore
gon
data
col
lect
ed in
199
7.

C H A P T E R 4
83
The number of books in the home can be an indicator of a home environment that values literacy, the acquisition of knowledge, and general academic support. Table 4.2 presents students’ reports about the number of books in their homes in relation to their achievement on the TIMSS mathematics test. As in most countries, the more books students in Missouri and Oregon reported having in the home, the higher their mathe-matics achievement. Although the main purpose of the question was to gain some information about the relative importance of academic pursuits in the students’ home environments rather than to determine the actual number of books in students’ homes, there was a substantial amount of variation from country to country in students’ reports about the number of books in their homes. In Colombia, Hong Kong, Iran, Kuwait, Romania, and Thailand, 40% or more of the students reported 25 or fewer books in the home. Conversely, 40% or more of the students in Australia, Hungary, Latvia (LSS), New Zealand, Norway, and Sweden reported three or more bookcases in their homes. Thirty-one percent of the eighth graders in the U.S. reported having three or more bookcases in the home, and the results for Missouri (28%) resembled those for the United States. In Oregon, more students (38%) than in the U.S. as a whole reported having three or more bookcases in their homes.
Information about their parents’ educational levels was gathered by asking students to indicate the highest level of education completed by their fathers and mothers. Table 4.3 presents the relationship between students’ mathematics achievement and their reports of the highest level of education of either parent. Results are presented at three educational levels: finished university, finished upper secondary school but not university, and finished primary school but not upper secondary school. As shown in Figure 4.1, these three educational levels are based on internationally-defined cate-gories, which may not be strictly comparable across countries due to differences in national education systems. Although the majority of countries translated and defined the educational categories used in their questionnaires to be comparable to the inter-nationally-defined levels, some countries used modified response options to conform to their national education systems. Also, for a few countries, the percentages of students responding to this question fell below 85%. When this happened, the percentages shown in the table are annotated with an “r” for a response rate of 70% to 84% or an “s” if the response rate was from 50% to 69%.
Despite the different educational approaches, structures, and organizations across the TIMSS countries, it is clear from the data in Table 4.3 that parents’ education is posi-tively related to students’ mathematics achievement. In every country, as well as in Missouri and Oregon, the pattern was for those students whose parents had more edu-cation to also be those who had higher achievement in mathematics. As indicated by the results, there was variation among countries in the percentages of students reporting that they did not know their parents’ educational levels, as well as in the percentages of students reporting that their parents had completed successively higher educational levels. For example, in Canada, Israel, Lithuania, the Russian Federation, and the United States, more than 30% of the students reported that at least one of their parents had finished university, and only relatively small percentages (12% or fewer) reported that they did not know the educational levels of their parents.

84
C H A P T E R 4
Table 4.2 Students' Reports on the Number of Books in the Home - Mathematics - Eighth Grade*
None or Very Few About One ShelfAbout One Bookcase
About Two Bookcases
Three or More Bookcases
Country(0-10 Books) (11-25 Books) (26-100 Books) (101-200 Books) (More than 200
Books)
Percent of Students
Mean Achieve-
ment
Percent of Students
Mean Achieve-
ment
Percent of Students
Mean Achieve-
ment
Percent of Students
Mean Achieve-
ment
Percent of Students
Mean Achieve-
ment
UNITED STATES 8 (0.8) 435 (4.5) 13 (0.8) 462 (5.2) 28 (0.9) 491 (3.5) 21 (0.6) 517 (5.2) 31 (1.5) 531 (5.1)
MISSOURI 9 (1.0) 454 (5.8) 13 (1.0) 459 (7.4) 30 (1.0) 502 (5.9) 21 (1.2) 514 (7.2) 28 (1.5) 539 (8.4)
OREGON 6 (0.7) 461 (9.1) 10 (0.9) 474 (8.0) 24 (1.1) 513 (7.4) 21 (1.1) 533 (8.3) 38 (2.0) 553 (8.3)
Australia 3 (0.3) 449 (7.2) 7 (0.6) 482 (5.4) 24 (0.8) 512 (3.7) 25 (0.6) 534 (4.1) 42 (1.4) 555 (4.7)
Austria 11 (1.0) 485 (5.8) 17 (1.1) 505 (4.8) 31 (1.2) 534 (3.9) 17 (0.9) 567 (5.7) 24 (1.4) 579 (4.5)
Belgium (Fl) 11 (1.2) 521 (11.6) 18 (0.8) 549 (8.0) 33 (1.0) 571 (4.9) 18 (1.0) 587 (4.9) 21 (0.9) 575 (7.1)
Belgium (Fr) 7 (0.7) 461 (11.5) 10 (0.7) 484 (6.0) 28 (1.1) 517 (4.7) 21 (0.9) 537 (4.0) 34 (1.5) 555 (4.1)
Canada 4 (0.3) 505 (8.4) 10 (0.7) 510 (5.7) 28 (1.0) 528 (3.4) 25 (0.8) 532 (3.2) 33 (1.4) 534 (3.4)
Colombia 26 (1.5) 376 (5.5) 31 (1.1) 375 (3.7) 27 (1.3) 395 (3.8) 9 (0.7) 404 (7.7) 7 (1.0) 402 (10.4)
Cyprus 6 (0.6) 428 (7.6) 18 (0.8) 448 (3.4) 34 (0.8) 479 (2.9) 23 (0.8) 494 (3.8) 20 (0.8) 490 (4.0)
Czech Republic 1 (0.2) ~ ~ 4 (0.5) 506 (8.1) 30 (1.5) 539 (4.9) 32 (0.9) 569 (6.4) 34 (1.8) 588 (5.8)
Denmark 3 (0.6) 452 (13.5) 9 (0.8) 471 (6.8) 30 (1.2) 494 (3.3) 21 (0.9) 506 (4.4) 37 (1.5) 522 (3.8)
England 6 (0.6) 431 (7.7) 13 (1.0) 463 (5.2) 27 (1.3) 495 (4.0) 22 (0.8) 518 (5.1) 32 (1.5) 540 (4.3)
France 5 (0.5) 511 (9.1) 17 (1.0) 520 (3.8) 36 (1.1) 536 (3.7) 21 (1.0) 559 (4.8) 20 (1.2) 547 (4.7)
Germany 8 (0.8) 447 (6.4) 14 (1.1) 464 (4.5) 26 (1.0) 499 (4.4) 19 (0.9) 532 (5.8) 33 (1.7) 542 (5.4)
Greece 5 (0.4) 450 (5.7) 22 (0.9) 454 (3.3) 43 (0.9) 485 (3.4) 18 (0.7) 509 (5.8) 12 (0.7) 519 (5.8)
Hong Kong 21 (1.2) 559 (9.4) 29 (1.0) 594 (5.9) 29 (0.9) 599 (7.4) 10 (0.7) 602 (7.8) 10 (0.9) 606 (9.2)
Hungary 4 (0.6) 455 (10.7) 8 (0.7) 479 (6.1) 25 (1.0) 517 (4.2) 21 (1.0) 545 (4.1) 42 (1.4) 569 (3.8)
Iceland 1 (0.2) ~ ~ 5 (0.8) 465 (9.6) 29 (1.4) 477 (4.9) 28 (1.2) 486 (5.7) 37 (1.7) 501 (6.6)
Iran, Islamic Rep. 37 (1.8) 415 (2.9) 32 (0.9) 432 (2.3) 17 (0.9) 438 (3.3) 6 (0.5) 437 (6.8) 7 (0.7) 452 (5.3)
Ireland 7 (0.6) 468 (7.6) 16 (0.8) 491 (5.9) 34 (1.0) 530 (5.0) 21 (0.7) 550 (5.1) 22 (1.2) 555 (6.3)
Israel 4 (0.6) 482 (14.7) 13 (1.6) 498 (7.7) 31 (1.9) 514 (7.1) 26 (1.4) 539 (8.0) 25 (2.0) 542 (7.6)
Japan – – – – – – – – – – – – – – – – – – – –
Korea 10 (0.6) 535 (6.1) 12 (0.8) 560 (6.4) 33 (0.9) 599 (3.6) 23 (0.8) 634 (3.6) 21 (0.9) 652 (4.1)
Kuwait 22 (1.5) 382 (3.0) 27 (1.4) 389 (3.4) 28 (1.3) 400 (4.2) 10 (0.8) 404 (5.3) 13 (1.2) 402 (4.0)
Latvia (LSS) 1 (0.3) ~ ~ 4 (0.6) 448 (7.9) 17 (1.0) 471 (4.3) 21 (1.1) 484 (5.0) 57 (1.4) 509 (3.5)
Lithuania 3 (0.4) 415 (7.1) 17 (0.9) 442 (4.5) 35 (1.2) 470 (4.1) 21 (0.9) 496 (4.6) 24 (1.1) 507 (5.2)
Netherlands 8 (1.0) 488 (10.7) 16 (1.3) 507 (10.1) 34 (1.3) 538 (7.3) 19 (0.9) 558 (7.7) 22 (1.7) 577 (7.4)
New Zealand 3 (0.4) 441 (8.2) 7 (0.6) 452 (6.5) 24 (0.8) 488 (4.7) 25 (0.7) 516 (4.8) 41 (1.4) 531 (5.2)
Norway 2 (0.3) ~ ~ 6 (0.4) 467 (5.2) 25 (0.9) 483 (3.0) 22 (0.7) 504 (3.2) 45 (1.2) 524 (3.1)
Portugal 10 (0.8) 428 (2.9) 26 (1.3) 443 (2.7) 32 (1.0) 454 (2.6) 15 (0.8) 472 (3.4) 17 (1.4) 475 (4.3)
Romania 24 (1.3) 459 (7.0) 22 (1.3) 466 (5.2) 19 (1.0) 476 (4.8) 11 (0.7) 498 (5.5) 24 (1.7) 523 (5.4)
Russian Federation 2 (0.3) ~ ~ 11 (0.8) 495 (10.6) 36 (1.3) 523 (5.2) 24 (0.8) 550 (4.4) 26 (1.3) 562 (4.8)
Scotland 11 (1.2) 441 (4.8) 17 (1.1) 468 (4.7) 28 (1.0) 490 (4.5) 19 (1.0) 525 (5.9) 25 (2.0) 540 (8.0)
Singapore 11 (0.8) 611 (4.8) 22 (0.9) 622 (5.5) 41 (0.8) 648 (4.8) 14 (0.7) 665 (6.8) 12 (1.0) 674 (6.1)
Slovak Republic 2 (0.3) ~ ~ 11 (0.6) 497 (6.8) 45 (1.1) 541 (3.2) 23 (0.9) 562 (4.3) 18 (1.0) 581 (5.9)
Slovenia 2 (0.4) ~ ~ 15 (0.9) 500 (4.8) 38 (1.2) 532 (3.5) 22 (0.9) 560 (4.7) 22 (1.1) 571 (4.4)
Spain 4 (0.4) 443 (6.1) 18 (1.1) 460 (3.1) 33 (1.0) 482 (2.6) 20 (0.8) 498 (3.2) 26 (1.2) 513 (3.0)
Sweden 3 (0.3) 468 (8.3) 8 (0.7) 464 (5.0) 24 (1.0) 503 (4.3) 24 (0.8) 524 (3.3) 41 (1.5) 541 (3.5)
Switzerland 8 (1.0) 480 (6.9) 16 (0.9) 511 (4.7) 30 (1.0) 542 (3.1) 20 (0.9) 568 (3.7) 26 (1.2) 579 (4.7)
Thailand 19 (1.2) 506 (4.7) 30 (1.0) 514 (5.1) 33 (1.2) 528 (6.5) 9 (0.6) 537 (8.1) 9 (1.0) 553 (9.2)*Eighth grade in most countries; see Table 2 for more information about the grades tested in each country.( ) Standard errors appear in parentheses. Because results are rounded to the nearest whole number, some totals may appear inconsistent.Countries shown in italics did not satisfy one or more guidelines for sample participation rates or student sampling (see Figure 1). Background datafor Bulgaria and South Africa not available.A dash (–) indicates data are not available. A tilde (~) indicates insufficient data to report achievement.
SO
UR
CE
: IE
A T
hird
Inte
rnat
iona
l Mat
hem
atic
s an
d S
cien
ce S
tudy
(T
IMS
S),
199
4-95
. Mis
sour
i and
Ore
gon
data
col
lect
ed in
199
7.

85
C H A P T E R 4
Table 4.3Students' Reports on the Highest Level of Education of Either Parent 1
Mathematics - Eighth Grade*
Country
Finished University 2Finished Upper
Secondary School But Not University 3
Finished Primary School But Not Upper
Secondary School 4Do Not Know
Percent of Students
Mean Achievement
Percent of Students
Mean Achievement
Percent of Students
Mean Achievement
Percent of Students
Mean Achievement
UNITED STATES 33 (1.4) 527 (5.9) 54 (1.3) 494 (4.0) 7 (0.8) 455 (4.8) 5 (0.4) 489 (8.5)MISSOURI 29 (2.1) 530 (9.8) 60 (1.8) 499 (5.9) 6 (0.7) 466 (11.7) 5 (0.6) 482 (12.3)OREGON 37 (2.7) 556 (8.4) 55 (2.3) 513 (7.6) 4 (0.5) 469 (12.3) 4 (0.6) 505 (14.5)Australia 28 (1.4) 572 (4.4) 37 (0.9) 528 (4.4) 24 (0.9) 510 (3.6) 11 (0.6) 494 (4.9)Austria 10 (0.7) 574 (7.2) 70 (1.1) 547 (3.7) 8 (0.9) 496 (7.4) 12 (0.9) 513 (6.1)Belgium (Fl) 20 (1.6) 599 (6.0) 34 (1.3) 572 (5.3) 21 (2.4) 538 (10.3) 25 (1.4) 548 (5.9)Belgium (Fr) 27 (1.6) 557 (3.9) 34 (1.3) 537 (3.9) 11 (1.3) 491 (6.2) 27 (1.6) 501 (7.4)Canada 37 (1.3) 544 (3.4) 39 (1.2) 526 (2.9) 13 (0.9) 510 (5.1) 10 (0.5) 504 (4.2)Colombia 15 (1.6) 410 (8.2) 28 (1.6) 396 (4.3) 47 (2.3) 378 (4.1) 10 (0.9) 371 (6.8)Cyprus r 15 (0.9) 521 (4.8) 29 (1.1) 502 (4.0) 52 (1.4) 455 (2.9) 4 (0.5) 454 (8.8)Czech Republic 21 (1.7) 604 (7.5) 47 (1.5) 571 (4.9) 25 (1.5) 532 (4.1) 7 (0.8) 516 (7.8)Denmark 13 (1.0) 528 (5.5) 46 (1.5) 512 (3.5) 8 (0.7) 488 (8.0) 33 (1.7) 498 (4.0)England – – – – – – – – – – – – – – – –France r 13 (1.2) 576 (5.8) 36 (1.3) 549 (3.6) 19 (1.2) 530 (4.1) 31 (1.3) 529 (3.8)Germany 11 (1.0) 553 (8.5) 32 (1.3) 526 (5.0) 38 (1.6) 504 (4.2) 19 (1.3) 488 (6.7)Greece 18 (1.1) 537 (6.3) 39 (1.3) 492 (4.5) 40 (1.8) 462 (2.9) 3 (0.3) 457 (8.1)Hong Kong 7 (1.0) 638 (8.6) 30 (1.2) 607 (6.6) 55 (1.8) 584 (5.9) 7 (0.7) 554 (12.6)Hungary r 24 (1.8) 594 (4.9) 66 (1.7) 539 (3.2) 11 (0.9) 492 (6.0) – – – –Iceland 25 (2.8) 505 (7.0) 44 (2.0) 495 (4.7) 15 (1.4) 467 (6.8) 15 (1.0) 472 (6.5)Iran, Islamic Rep. r 3 (0.6) 468 (7.1) 21 (1.8) 447 (2.5) 68 (2.2) 426 (2.5) 7 (1.0) 424 (5.6)Ireland 17 (1.3) 564 (7.6) 46 (1.0) 535 (4.7) 26 (1.2) 510 (5.7) 10 (0.7) 499 (6.6)Israel 37 (2.5) 552 (7.8) 45 (2.2) 518 (5.8) 10 (1.3) 486 (5.9) 8 (0.9) 506 (8.5)Japan – – – – – – – – – – – – – – – –Korea 22 (1.3) 654 (5.1) 47 (1.3) 607 (2.8) 26 (1.1) 575 (4.2) 5 (0.5) 573 (9.3)Kuwait s 3 (1.3) 429 (11.8) 3 (0.9) 387 (11.3) 92 (2.2) 390 (2.9) 1 (0.7) ~ ~Latvia (LSS) r 27 (1.5) 528 (5.5) 49 (1.4) 493 (3.7) 13 (1.0) 470 (6.2) 11 (1.0) 473 (6.4)Lithuania s 37 (1.6) 508 (4.4) 44 (1.6) 474 (4.1) 7 (1.0) 449 (6.3) 12 (1.2) 472 (6.4)Netherlands 12 (1.4) 570 (10.6) 55 (1.8) 549 (7.7) 10 (0.7) 524 (9.2) 23 (1.4) 522 (7.8)New Zealand 25 (1.3) 543 (6.0) 38 (1.1) 504 (4.4) 15 (0.8) 491 (5.7) 21 (1.1) 494 (5.4)Norway 25 (1.2) 524 (4.5) 38 (1.1) 505 (3.1) 9 (0.6) 487 (4.6) 27 (1.2) 495 (3.2)Portugal 9 (1.2) 494 (4.6) 13 (1.0) 473 (4.0) 73 (2.0) 447 (2.1) 5 (0.4) 452 (5.8)Romania 10 (1.3) 517 (8.7) 47 (1.5) 497 (4.9) 33 (1.9) 467 (7.2) 10 (0.9) 460 (6.5)Russian Federation 34 (1.8) 565 (4.9) 54 (1.6) 526 (6.4) 5 (0.5) 484 (8.0) 6 (0.8) 519 (10.8)Scotland 14 (1.4) 559 (8.4) 33 (1.4) 499 (5.3) 14 (0.8) 485 (5.5) 39 (1.3) 487 (5.6)Singapore 8 (1.0) 692 (7.5) 69 (1.0) 645 (5.0) 23 (1.2) 623 (4.9) – – – –Slovak Republic 20 (1.4) 588 (5.4) 50 (1.1) 551 (3.2) 23 (1.2) 517 (4.5) 6 (0.5) 521 (7.5)Slovenia 19 (1.1) 583 (4.4) 59 (1.4) 542 (3.4) 18 (1.3) 503 (4.6) 4 (0.4) 522 (9.0)Spain 15 (1.2) 517 (3.6) 21 (0.9) 502 (3.3) 54 (1.8) 479 (2.3) 10 (0.8) 478 (3.5)Sweden 22 (1.2) 544 (3.9) 34 (1.1) 524 (3.4) 9 (0.6) 494 (4.6) 35 (1.1) 511 (3.4)Switzerland 11 (0.8) 588 (5.4) 61 (1.3) 552 (2.6) 13 (0.9) 520 (5.1) 15 (1.0) 534 (4.7)Thailand 9 (1.4) 571 (9.5) 14 (1.4) 544 (8.9) 73 (2.6) 513 (4.4) 3 (0.5) 524 (12.3)
*Eighth grade in most countries; see Table 2 for more information about the grades tested in each country.1The response categories were defined by each country to conform to their own educational system and may not be strictly comparable across countries. See Figure 4.1 for country modifications to the definitions of educational levels. Also, no response category was provided for students whose parents had no formal education or did not finish primary school, except in France where a small percentage of students in this category are included in the missing responses.2In most countries, defined as completion of at least a 4-year degree program at a university or an equivalent institute of higher education. 3Finished upper secondary school with or without some tertiary education not equivalent to a university degree. In most countries, finishedsecondary corresponds to completion of an upper-secondary track terminating after 11 to 13 years of schooling.4Finished primary school or some secondary school not equivalent to completion of upper secondary.( ) Standard errors appear in parentheses. Because results are rounded to the nearest whole number, some totals may appear inconsistent.Countries shown in italics did not satisfy one or more guidelines for sample participation rates or student sampling (see Figure 1). Background datafor Bulgaria and South Africa not available.A dash (–) indicates data are not available. A tilde (~) indicates insufficient data to report achievement.An "r" indicates a 70-84% student response rate. An "s" indicates a 50-69% student response rate.Data for Singapore not obtained from students; entered at ministry level.
SO
UR
CE
: IE
A T
hird
Inte
rnat
iona
l Mat
hem
atic
s an
d S
cien
ce S
tudy
(T
IMS
S),
199
4-95
. Mis
sour
i and
Ore
gon
data
col
lect
ed in
199
7.
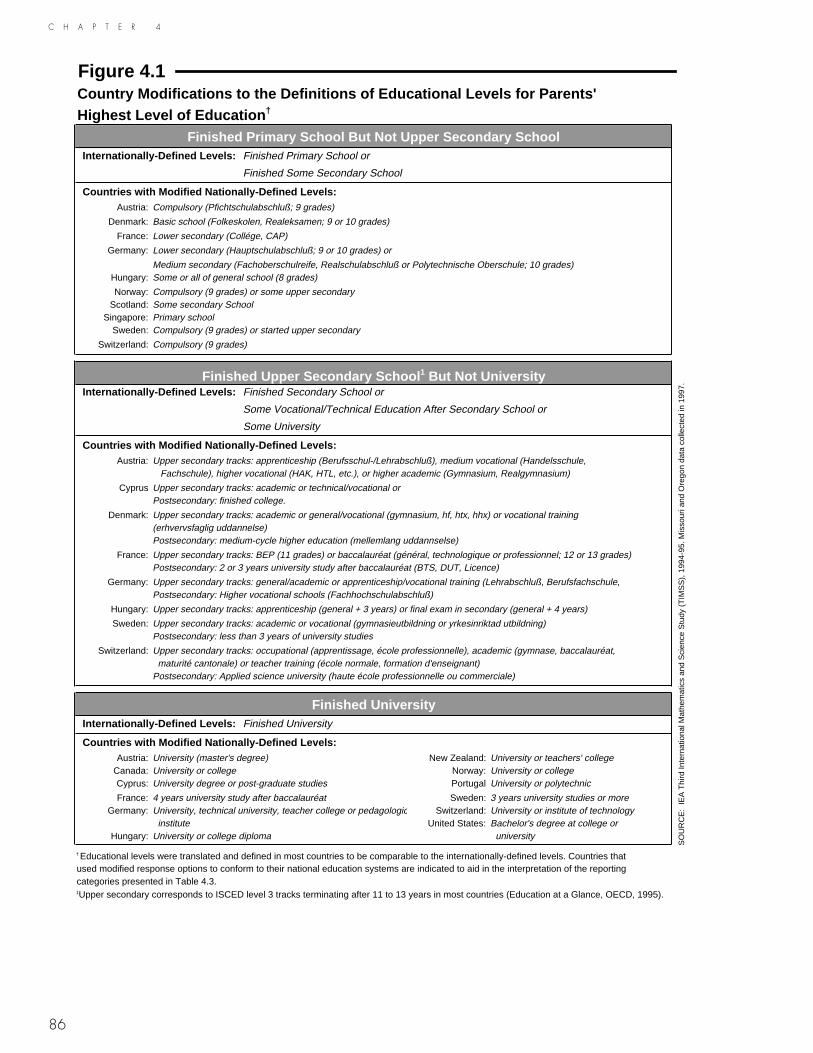
86
C H A P T E R 4
Figure 4.1Country Modifications to the Definitions of Educational Levels for Parents'Highest Level of Education †
Finished Primary School But Not Upper Secondary School Internationally-Defined Levels: Finished Primary School or
Finished Some Secondary School
Countries with Modified Nationally-Defined Levels:Austria: Compulsory (Pfichtschulabschluß; 9 grades)
Denmark: Basic school (Folkeskolen, Realeksamen; 9 or 10 grades)
France: Lower secondary (Collége, CAP)
Germany: Lower secondary (Hauptschulabschluß; 9 or 10 grades) or
Medium secondary (Fachoberschulreife, Realschulabschluß or Polytechnische Oberschule; 10 grades)Hungary: Some or all of general school (8 grades)
Norway: Compulsory (9 grades) or some upper secondaryScotland: Some secondary School
Singapore: Primary schoolSweden: Compulsory (9 grades) or started upper secondary
Switzerland: Compulsory (9 grades)
Finished Upper Secondary School 1 But Not University Internationally-Defined Levels: Finished Secondary School or
Some Vocational/Technical Education After Secondary School or
Some University
Countries with Modified Nationally-Defined Levels:Austria: Upper secondary tracks: apprenticeship (Berufsschul-/Lehrabschluß), medium vocational (Handelsschule,
Fachschule), higher vocational (HAK, HTL, etc.), or higher academic (Gymnasium, Realgymnasium)
Cyprus Upper secondary tracks: academic or technical/vocational orPostsecondary: finished college.
Denmark: Upper secondary tracks: academic or general/vocational (gymnasium, hf, htx, hhx) or vocational training(erhvervsfaglig uddannelse)Postsecondary: medium-cycle higher education (mellemlang uddannselse)
France: Upper secondary tracks: BEP (11 grades) or baccalauréat (général, technologique or professionnel; 12 or 13 grades)Postsecondary: 2 or 3 years university study after baccalauréat (BTS, DUT, Licence)
Germany: Upper secondary tracks: general/academic or apprenticeship/vocational training (Lehrabschluß, Berufsfachschule,Postsecondary: Higher vocational schools (Fachhochschulabschluß)
Hungary: Upper secondary tracks: apprenticeship (general + 3 years) or final exam in secondary (general + 4 years)
Sweden: Upper secondary tracks: academic or vocational (gymnasieutbildning or yrkesinriktad utbildning)Postsecondary: less than 3 years of university studies
Switzerland: Upper secondary tracks: occupational (apprentissage, école professionnelle), academic (gymnase, baccalauréat, maturité cantonale) or teacher training (école normale, formation d'enseignant)Postsecondary: Applied science university (haute école professionnelle ou commerciale)
Finished University Internationally-Defined Levels: Finished University
Countries with Modified Nationally-Defined Levels:Austria: University (master's degree) New Zealand: University or teachers' college
Canada: University or college Norway: University or collegeCyprus: University degree or post-graduate studies Portugal University or polytechnic
France: 4 years university study after baccalauréat Sweden: 3 years university studies or moreGermany: University, technical university, teacher college or pedagologic Switzerland: University or institute of technology
institute United States: Bachelor's degree at college orHungary: University or college diploma university
† Educational levels were translated and defined in most countries to be comparable to the internationally-defined levels. Countries thatused modified response options to conform to their national education systems are indicated to aid in the interpretation of the reportingcategories presented in Table 4.3.1Upper secondary corresponds to ISCED level 3 tracks terminating after 11 to 13 years in most countries (Education at a Glance, OECD, 1995).
SO
UR
CE
: IE
A T
hird
Inte
rnat
iona
l Mat
hem
atic
s an
d S
cien
ce S
tudy
(T
IMS
S),
199
4-95
. Mis
sour
i and
Ore
gon
data
col
lect
ed in
199
7.
C H A P T E R 4
87
The state results bracketed those for the United States, with 37% of the eighth graders in Oregon and 29% of those in Missouri reporting that at least one parent had finished university compared to 33% for the United States. For the U.S. and the states, 4% to 5% of the eighth graders did not know their parents’ educational level. In contrast, almost all students (90% or more) in Hong Kong, Iran, Kuwait, Portugal, and Thailand also reported knowing their parents’ educational levels, but for these countries, fewer than 10% of students reported that either parent had finished university.
Students who speak a language at home that is different from the language of the school may sometimes be at a disadvantage in learning situations. Table 4.4 presents eighth graders’ responses to the question of how often they spoke the language of the TIMSS mathematics test at home. In 25 of the TIMSS countries including the United States, 90% or more of the eighth graders responded that at home they always or almost always spoke the language in which they were tested. The results for Missouri (96%) and Oregon (93%) resembled those for the United States. In most of the coun-tries, students tested in the language almost always spoken in the home had higher mathematics achievement than their counterparts who reported speaking the language of the test only sometimes or never.
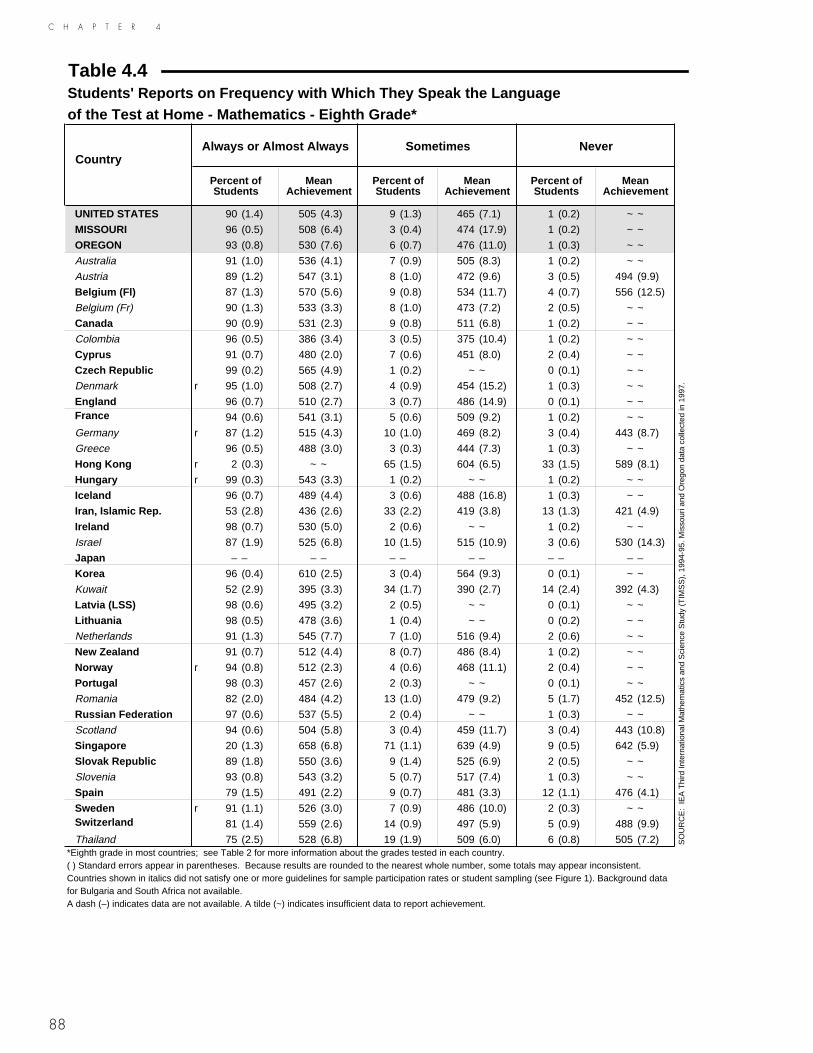
88
C H A P T E R 4
Table 4.4Students' Reports on Frequency with Which They Speak the Languageof the Test at Home - Mathematics - Eighth Grade*
CountryAlways or Almost Always Sometimes Never
Percent of Students
Mean Achievement
Percent of Students
Mean Achievement
Percent of Students
Mean Achievement
UNITED STATES 90 (1.4) 505 (4.3) 9 (1.3) 465 (7.1) 1 (0.2) ~ ~
MISSOURI 96 (0.5) 508 (6.4) 3 (0.4) 474 (17.9) 1 (0.2) ~ ~
OREGON 93 (0.8) 530 (7.6) 6 (0.7) 476 (11.0) 1 (0.3) ~ ~
Australia 91 (1.0) 536 (4.1) 7 (0.9) 505 (8.3) 1 (0.2) ~ ~
Austria 89 (1.2) 547 (3.1) 8 (1.0) 472 (9.6) 3 (0.5) 494 (9.9)
Belgium (Fl) 87 (1.3) 570 (5.6) 9 (0.8) 534 (11.7) 4 (0.7) 556 (12.5)
Belgium (Fr) 90 (1.3) 533 (3.3) 8 (1.0) 473 (7.2) 2 (0.5) ~ ~
Canada 90 (0.9) 531 (2.3) 9 (0.8) 511 (6.8) 1 (0.2) ~ ~
Colombia 96 (0.5) 386 (3.4) 3 (0.5) 375 (10.4) 1 (0.2) ~ ~
Cyprus 91 (0.7) 480 (2.0) 7 (0.6) 451 (8.0) 2 (0.4) ~ ~
Czech Republic 99 (0.2) 565 (4.9) 1 (0.2) ~ ~ 0 (0.1) ~ ~
Denmark r 95 (1.0) 508 (2.7) 4 (0.9) 454 (15.2) 1 (0.3) ~ ~
England 96 (0.7) 510 (2.7) 3 (0.7) 486 (14.9) 0 (0.1) ~ ~France 94 (0.6) 541 (3.1) 5 (0.6) 509 (9.2) 1 (0.2) ~ ~
Germany r 87 (1.2) 515 (4.3) 10 (1.0) 469 (8.2) 3 (0.4) 443 (8.7)
Greece 96 (0.5) 488 (3.0) 3 (0.3) 444 (7.3) 1 (0.3) ~ ~
Hong Kong r 2 (0.3) ~ ~ 65 (1.5) 604 (6.5) 33 (1.5) 589 (8.1)
Hungary r 99 (0.3) 543 (3.3) 1 (0.2) ~ ~ 1 (0.2) ~ ~
Iceland 96 (0.7) 489 (4.4) 3 (0.6) 488 (16.8) 1 (0.3) ~ ~
Iran, Islamic Rep. 53 (2.8) 436 (2.6) 33 (2.2) 419 (3.8) 13 (1.3) 421 (4.9)
Ireland 98 (0.7) 530 (5.0) 2 (0.6) ~ ~ 1 (0.2) ~ ~
Israel 87 (1.9) 525 (6.8) 10 (1.5) 515 (10.9) 3 (0.6) 530 (14.3)
Japan – – – – – – – – – – – –
Korea 96 (0.4) 610 (2.5) 3 (0.4) 564 (9.3) 0 (0.1) ~ ~
Kuwait 52 (2.9) 395 (3.3) 34 (1.7) 390 (2.7) 14 (2.4) 392 (4.3)
Latvia (LSS) 98 (0.6) 495 (3.2) 2 (0.5) ~ ~ 0 (0.1) ~ ~
Lithuania 98 (0.5) 478 (3.6) 1 (0.4) ~ ~ 0 (0.2) ~ ~
Netherlands 91 (1.3) 545 (7.7) 7 (1.0) 516 (9.4) 2 (0.6) ~ ~
New Zealand 91 (0.7) 512 (4.4) 8 (0.7) 486 (8.4) 1 (0.2) ~ ~
Norway r 94 (0.8) 512 (2.3) 4 (0.6) 468 (11.1) 2 (0.4) ~ ~
Portugal 98 (0.3) 457 (2.6) 2 (0.3) ~ ~ 0 (0.1) ~ ~
Romania 82 (2.0) 484 (4.2) 13 (1.0) 479 (9.2) 5 (1.7) 452 (12.5)
Russian Federation 97 (0.6) 537 (5.5) 2 (0.4) ~ ~ 1 (0.3) ~ ~
Scotland 94 (0.6) 504 (5.8) 3 (0.4) 459 (11.7) 3 (0.4) 443 (10.8)
Singapore 20 (1.3) 658 (6.8) 71 (1.1) 639 (4.9) 9 (0.5) 642 (5.9)
Slovak Republic 89 (1.8) 550 (3.6) 9 (1.4) 525 (6.9) 2 (0.5) ~ ~
Slovenia 93 (0.8) 543 (3.2) 5 (0.7) 517 (7.4) 1 (0.3) ~ ~
Spain 79 (1.5) 491 (2.2) 9 (0.7) 481 (3.3) 12 (1.1) 476 (4.1)
Sweden r 91 (1.1) 526 (3.0) 7 (0.9) 486 (10.0) 2 (0.3) ~ ~Switzerland 81 (1.4) 559 (2.6) 14 (0.9) 497 (5.9) 5 (0.9) 488 (9.9)
Thailand 75 (2.5) 528 (6.8) 19 (1.9) 509 (6.0) 6 (0.8) 505 (7.2)*Eighth grade in most countries; see Table 2 for more information about the grades tested in each country.( ) Standard errors appear in parentheses. Because results are rounded to the nearest whole number, some totals may appear inconsistent.Countries shown in italics did not satisfy one or more guidelines for sample participation rates or student sampling (see Figure 1). Background datafor Bulgaria and South Africa not available.A dash (–) indicates data are not available. A tilde (~) indicates insufficient data to report achievement.
SO
UR
CE
: IE
A T
hird
Inte
rnat
iona
l Mat
hem
atic
s an
d S
cien
ce S
tudy
(T
IMS
S),
199
4-95
. Mis
sour
i and
Ore
gon
data
col
lect
ed in
199
7.

C H A P T E R 4
89
What Are the Academic Expectations of Students, Their Families, and Their Friends?Tables 4.5, 4.6, and 4.7 present students’ reports about how they themselves, their mothers, and their friends feel about the importance of doing well in various academic and non-academic activities. The first three questions asked about the degree of agreement with the importance of doing well in the academic subjects of mathematics, science, and language, respectively. Nearly all eighth graders in the U.S. (96% to 97%) as well as in Missouri (95% to 97%) and Oregon (94% to 96%) agreed that it was important to do well in each of these three subjects. In almost every country, nearly all students agreed or strongly agreed that it was important to do well in math-ematics. The percentages were in the high 90s for many countries and exceeded 90% in virtually all countries. Similarly, approximately the same high percentages of students were in agreement with the importance of doing well in language. In many countries, somewhat fewer eighth-grade students agreed with the importance of doing well in science. Still, the percentages were relatively high, ranging from more than 90% agreement in a number of countries to a low of 68% in Switzerland and 72% in Germany.
For the most part, eighth-grade students including those in Missouri and Oregon, indi-cated that their mothers’ opinions about the importance of these academic activities corresponded very closely to their own feelings (Table 4.6). In contrast, however, stu-dents reported that their friends were not in as much agreement about the importance of academic success (Table 4.7). Although students’ friends purportedly were in general agreement with the importance of doing well in mathematics, the percentages were generally in the 80s rather than the 90s. In the United States, Oregon, and Missouri, only 75% to 76% of the eighth graders reported that their friends felt it was important to do well in mathematics. According to students, their friends were in the lowest degree of agreement about doing well in mathematics in Germany and Sweden (70% for both countries).
As with the students’ reports about their own feelings and those of their mothers, students indicated a close alignment in their friends’ degree of agreement about the importance of academic success in mathematics and in language. Apparently, even though the relative importance varies from group to group, students, their mothers, and their friends find it very nearly equally important to do well in mathematics and language. The results for the United States, Missouri, and Oregon, as presented in Table 4.7, were consistent with this pattern, with 72% to 74% of the students reporting their friends felt it was important to do well in language. According to students in some countries, however, their friends do not have nearly the same positive feeling about the importance of doing well in science. In a number of countries fewer than two-thirds of eighth-graders reported that their friends agreed or strongly agreed it was important to do well in science. In the United States, Missouri, and Oregon, however, eighth graders’ friends reportedly feel nearly as positive about doing well in science as they do about mathematics and language. From 69% to 73% of the students reported that their friends felt it was important to do well in science (Table 4.7).

90
C H A P T E R 4
For purposes of comparison, eighth-grade students also were asked about the impor-tance of two non-academic activities – having time to have fun and being good at sports. As can be seen in Table 4.5, in Missouri and Oregon, as well as in most coun-tries including the United States, very high percentages of the students (more than 90%) felt it was important to have time to have fun. The percentages in agreement were similar to those agreeing that it was important to do well in mathematics and lan-guage. Generally, there was less agreement about the importance of being good at sports. In the United States, Missouri, and Oregon, 83% to 88% of the eighth graders reported it was important to be good in sports (Table 4.5).
In nearly all countries, 80% or more of the students reported that their mothers agreed that it was important to have time to have fun (Table 4.6). For the United States, Missouri, and Oregon these figures were 93% to 94%. The exceptions were Hong Kong (74%), Iran (79%), Korea (58%), Kuwait (63%), and Singapore (79%), where students reported from 8% to 29% lower agreement for their mothers than for them-selves. According to students, their mothers give a moderate to high degree of support to the importance of being good at sports. In nearly all countries, the percentages of students reporting such agreement were in the 70s, 80s, and 90s. In the United States, Missouri, and Oregon, from 78% to 81% of the eighth graders reported that their mothers felt it was important to be good in sports.
As might be anticipated, students reported that most of their friends agreed that it was important to have fun – more than 90% in almost all countries (Table 4.7). In the United States, Missouri, and Oregon, 98% to 99% of the eight graders reported that their friends thought it was important to have time to have fun, and 86% to 90% that their friends thought it was important to be good at sports. Internationally, students reported that their friends generally were in moderate agreement that it was important to do well in sports. The percentages of their friends’ agreement as reported by stu-dents ranged from a low of 64% in Germany to a high of 96% in Colombia.
In summary, students in Missouri and Oregon reported views about the importance of doing well academically that were consistent with those reported by students in the United States as a whole. Considering that the students’ reports about their friends might be a better indicator than the students’ reports about their own views, it is dis-turbing to note that the friends of U.S. eighth graders reportedly place a relatively low importance on the value of doing well in mathematics compared to many other coun-tries. In contrast, U.S. eighth graders seem to have views about doing well in science that are more consistent with students in other countries, or even more positive. Whereas eighth graders in a number of other countries reported that their friends placed less importance on doing well in science than in mathematics and language, the U.S. results were similar for the three academic areas. U.S. eighth graders, including those in Missouri and Oregon, reported that nearly all of their friends think it is important to have fun, but this is consistent with the results for many other countries. U.S. eighth graders, however, were in higher ranges of having friends who placed importance on doing well in sports.

91
C H A P T E R 4
Table 4.5Students' Reports on Whether They Agree or Strongly Agree That It Is Important to Do Various Activities - Mathematics - Eighth Grade*
Percent of Students
CountryDo Well in
MathematicsDo Well in Science
Do Well in Language
Have Time to Have Fun
Be Good at Sports
UNITED STATES 97 (0.3) 96 (0.5) 96 (0.3) 99 (0.2) 88 (0.6)
MISSOURI 97 (0.4) 97 (0.5) 95 (0.5) 99 (0.2) 86 (0.7)
OREGON 96 (0.4) 94 (0.5) 94 (0.6) 99 (0.3) 83 (1.2)
Australia 96 (0.4) 89 (0.6) 95 (0.4) 98 (0.2) 85 (0.6)
Austria 94 (0.5) 82 (1.2) 93 (0.6) 98 (0.3) 82 (0.9)
Belgium (Fl) 98 (0.3) 93 (0.6) 98 (0.4) 98 (0.3) 80 (1.0)
Belgium (Fr) 98 (0.3) 94 (0.7) 98 (0.3) 98 (0.4) 87 (0.8)
Canada 98 (0.2) 94 (0.7) 97 (0.3) 99 (0.2) 86 (0.6)
Colombia 99 (0.2) 99 (0.2) 99 (0.2) 98 (0.3) 97 (0.3)
Cyprus 94 (0.5) 86 (1.0) 94 (0.6) 94 (0.5) 85 (1.0)
Czech Republic 98 (0.5) 88 (1.0) 98 (0.3) 98 (0.3) 84 (0.9)
Denmark 97 (0.4) 87 (1.0) 97 (0.4) 99 (0.3) 83 (0.8)
England 99 (0.2) 96 (0.5) 99 (0.3) 99 (0.3) 80 (1.1)
France 97 (0.4) 83 (1.2) 97 (0.5) 97 (0.4) 80 (0.8)
Germany 93 (0.6) 72 (1.0) 91 (0.6) 97 (0.4) 72 (1.1)
Greece 96 (0.4) 93 (0.5) 96 (0.4) 96 (0.4) 91 (0.6)
Hong Kong 96 (0.5) 90 (0.9) 96 (0.5) 94 (0.5) 83 (0.9)
Hungary 95 (0.5) 86 (0.8) 95 (0.5) 96 (0.5) 78 (0.9)
Iceland 97 (1.0) 90 (1.2) 97 (1.0) 98 (0.4) 90 (1.6)
Iran, Islamic Rep. 97 (0.4) 98 (0.4) 96 (0.6) 87 (1.1) 95 (0.7)
Ireland 97 (0.3) 86 (1.1) 96 (0.4) 99 (0.2) 85 (0.8)
Israel 98 (0.5) 85 (1.0) 89 (1.5) 98 (0.5) 84 (1.3)
Japan 92 (0.4) 87 (0.6) 91 (0.5) 99 (0.1) 83 (0.7)
Korea 94 (0.5) 91 (0.6) 93 (0.6) 87 (0.8) 86 (0.8)
Kuwait 96 (0.5) 96 (0.6) 96 (0.6) 85 (1.3) 81 (1.1)
Latvia (LSS) 97 (0.4) 84 (1.0) 97 (0.3) 97 (0.4) 87 (0.8)
Lithuania 93 (0.6) 78 (1.1) 96 (0.4) 94 (0.6) 93 (0.5)
Netherlands 97 (0.6) 95 (0.7) 99 (0.3) 98 (0.6) 78 (1.2)
New Zealand 97 (0.3) 92 (0.6) 96 (0.5) 99 (0.3) 86 (0.7)
Norway 96 (0.5) 92 (0.6) 96 (0.5) 99 (0.1) 79 (0.9)
Portugal 97 (0.3) 97 (0.3) 99 (0.2) 93 (0.5) 94 (0.5)
Romania 88 (0.8) 86 (0.8) 88 (0.8) 86 (1.0) 80 (1.1)
Russian Federation 97 (0.4) 95 (0.6) 97 (0.5) 98 (0.4) 88 (0.9)
Scotland 98 (0.4) 92 (0.7) 98 (0.3) 98 (0.3) 82 (0.9)
Singapore 99 (0.2) 99 (0.2) 100 (0.1) 96 (0.3) 89 (0.6)
Slovak Republic 96 (0.4) 86 (0.8) 96 (0.4) 98 (0.2) 91 (0.5)
Slovenia 96 (0.5) 86 (0.9) 96 (0.4) 95 (0.5) 87 (0.7)
Spain 99 (0.2) 99 (0.2) 99 (0.2) 99 (0.1) 95 (0.3)
Sweden 92 (0.6) 84 (0.8) 90 (0.6) 99 (0.2) 84 (0.7)
Switzerland 96 (0.4) 68 (1.1) 94 (0.4) 95 (0.6) 78 (0.9)
Thailand 93 (0.6) 94 (0.5) 96 (0.4) 95 (0.3) 91 (0.5)*Eighth grade in most countries; see Table 2 for more information about the grades tested in each country.( ) Standard errors appear in parentheses. Because results are rounded to the nearest whole number, some totals may appear inconsistent.Countries shown in italics did not satisfy one or more guidelines for sample participation rates or student sampling (see Figure 1). Background datafor Bulgaria and South Africa not available.
SO
UR
CE
: IE
A T
hird
Inte
rnat
iona
l Mat
hem
atic
s an
d S
cien
ce S
tudy
(T
IMS
S),
199
4-95
. Mis
sour
i and
Ore
gon
data
col
lect
ed in
199
7.

92
C H A P T E R 4
Table 4.6Students' Reports on Whether Their Mothers Agree or Strongly Agree That It Is Important to Do Various Activities - Mathematics - Eighth Grade*
Percent of Students
CountryDo Well in
MathematicsDo Well in Science
Do Well in Language
Have Time to Have Fun
Be Good at Sports
UNITED STATES 98 (0.2) 97 (0.2) 98 (0.2) 93 (0.4) 81 (0.8)
MISSOURI 97 (0.4) 98 (0.3) 97 (0.4) 94 (0.6) 78 (0.9)
OREGON 97 (0.5) 97 (0.4) 97 (0.5) 94 (0.5) 78 (1.6)
Australia 98 (0.2) 94 (0.4) 98 (0.2) 94 (0.4) 83 (0.7)
Austria 96 (0.4) 81 (1.0) 95 (0.5) 90 (0.7) 56 (1.1)
Belgium (Fl) 97 (0.4) 93 (0.8) 98 (0.4) 94 (0.5) 73 (1.2)
Belgium (Fr) 99 (0.3) 98 (0.3) 99 (0.3) 95 (0.6) 85 (0.7)
Canada 99 (0.1) 98 (0.3) 99 (0.1) 96 (0.4) 83 (0.7)
Colombia 99 (0.4) 99 (0.3) 99 (0.2) 93 (0.6) 94 (1.0)
Cyprus 95 (0.4) 89 (0.8) 95 (0.5) 91 (0.6) 80 (0.8)
Czech Republic 99 (0.2) 93 (0.8) 98 (0.3) 90 (0.7) 74 (1.1)
Denmark 99 (0.3) 95 (0.6) 99 (0.3) 98 (0.3) 81 (1.0)
England 99 (0.3) 96 (0.5) 99 (0.3) 94 (0.6) 74 (1.2)
France 98 (0.3) 88 (0.9) 99 (0.3) 91 (0.7) 74 (1.0)
Germany 94 (0.8) 71 (1.4) 93 (0.7) 88 (0.7) 48 (1.2)
Greece 96 (0.3) 94 (0.5) 96 (0.4) 89 (0.6) 83 (0.7)
Hong Kong 93 (0.6) 86 (0.7) 93 (0.6) 74 (0.9) 71 (1.3)
Hungary 96 (0.4) 85 (0.8) 96 (0.4) 96 (0.4) 73 (1.1)
Iceland 97 (0.8) 95 (1.3) 98 (0.5) 95 (0.7) 87 (1.6)
Iran, Islamic Rep. 96 (0.5) 96 (0.5) 95 (0.5) 79 (1.8) 90 (1.5)
Ireland 98 (0.3) 89 (1.0) 98 (0.2) 94 (0.5) 83 (0.8)
Israel 99 (0.4) 89 (0.9) 93 (0.6) 95 (0.7) 79 (1.4)
Japan – – – – – – – – – –
Korea 96 (0.4) 92 (0.5) 94 (0.5) 58 (1.1) 72 (0.9)
Kuwait 91 (0.9) r 91 (0.9) r 91 (1.0) r 63 (1.8) r 69 (1.5)
Latvia (LSS) 97 (0.4) 85 (1.1) 97 (0.5) 90 (0.8) 82 (0.9)
Lithuania 91 (0.6) 77 (1.1) 95 (0.5) 86 (0.8) 87 (0.9)
Netherlands 96 (0.5) 94 (0.7) 97 (0.4) 96 (0.4) 63 (1.4)
New Zealand 98 (0.3) 95 (0.4) 97 (0.3) 95 (0.5) 86 (0.8)
Norway 97 (0.4) 95 (0.5) 97 (0.4) 97 (0.3) 71 (1.1)
Portugal 96 (0.4) 98 (0.3) 98 (0.3) 87 (0.7) 91 (0.6)
Romania 93 (0.5) 94 (0.6) 90 (0.7) 83 (1.0) 76 (1.0)
Russian Federation 96 (0.3) 95 (0.4) 97 (0.4) 92 (0.6) 84 (0.7)
Scotland 98 (0.3) 93 (0.6) 99 (0.2) 94 (0.5) 77 (1.0)
Singapore 99 (0.2) 99 (0.2) 99 (0.1) 79 (0.8) 84 (0.8)
Slovak Republic 99 (0.2) 94 (0.5) 99 (0.2) 95 (0.4) 88 (0.6)
Slovenia 91 (0.7) 85 (0.7) 92 (0.6) 88 (0.7) 81 (0.9)
Spain 99 (0.2) 99 (0.2) 99 (0.2) 96 (0.4) 93 (0.5)
Sweden 96 (0.4) 92 (0.5) 95 (0.4) 97 (0.3) 83 (0.7)
Switzerland 96 (0.3) 69 (1.0) 95 (0.4) 83 (0.9) 59 (1.1)
Thailand 94 (0.5) 95 (0.4) 96 (0.4) 84 (0.9) 90 (0.5)*Eighth grade in most countries; see Table 2 for more information about the grades tested in each country.Data are reported as percent of students.( ) Standard errors appear in parentheses. Because results are rounded to the nearest whole number, some totals may appear inconsistent.Countries shown in italics did not satisfy one or more guidelines for sample participation rates or student sampling (see Figure 1). Background data for Bulgaria and South Africa not available.A dash (–) indicates data are not available.An "r" indicates a 70-84% student response rate.
SO
UR
CE
: IE
A T
hird
Inte
rnat
iona
l Mat
hem
atic
s an
d S
cien
ce S
tudy
(T
IMS
S),
199
4-95
. Mis
sour
i and
Ore
gon
data
col
lect
ed in
199
7.
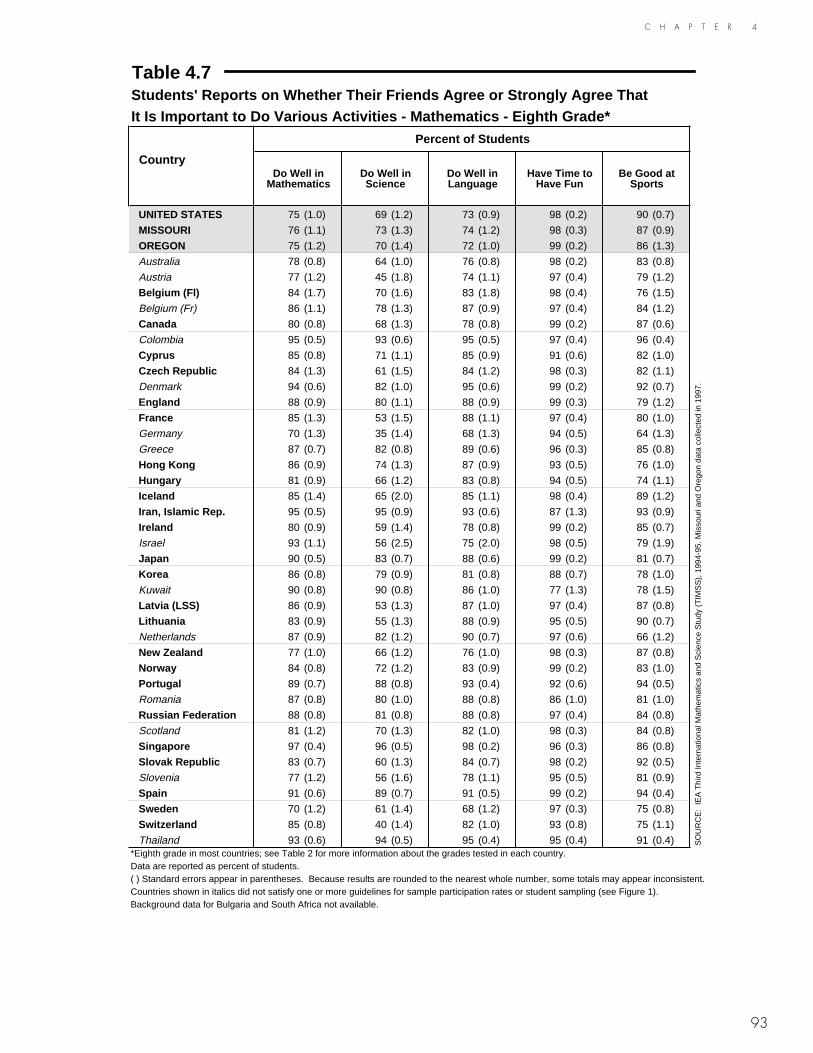
93
C H A P T E R 4
Table 4.7Students' Reports on Whether Their Friends Agree or Strongly Agree That It Is Important to Do Various Activities - Mathematics - Eighth Grade*
Percent of Students
CountryDo Well in
MathematicsDo Well in Science
Do Well in Language
Have Time to Have Fun
Be Good at Sports
UNITED STATES 75 (1.0) 69 (1.2) 73 (0.9) 98 (0.2) 90 (0.7)
MISSOURI 76 (1.1) 73 (1.3) 74 (1.2) 98 (0.3) 87 (0.9)
OREGON 75 (1.2) 70 (1.4) 72 (1.0) 99 (0.2) 86 (1.3)
Australia 78 (0.8) 64 (1.0) 76 (0.8) 98 (0.2) 83 (0.8)
Austria 77 (1.2) 45 (1.8) 74 (1.1) 97 (0.4) 79 (1.2)
Belgium (Fl) 84 (1.7) 70 (1.6) 83 (1.8) 98 (0.4) 76 (1.5)
Belgium (Fr) 86 (1.1) 78 (1.3) 87 (0.9) 97 (0.4) 84 (1.2)
Canada 80 (0.8) 68 (1.3) 78 (0.8) 99 (0.2) 87 (0.6)
Colombia 95 (0.5) 93 (0.6) 95 (0.5) 97 (0.4) 96 (0.4)
Cyprus 85 (0.8) 71 (1.1) 85 (0.9) 91 (0.6) 82 (1.0)
Czech Republic 84 (1.3) 61 (1.5) 84 (1.2) 98 (0.3) 82 (1.1)
Denmark 94 (0.6) 82 (1.0) 95 (0.6) 99 (0.2) 92 (0.7)
England 88 (0.9) 80 (1.1) 88 (0.9) 99 (0.3) 79 (1.2)
France 85 (1.3) 53 (1.5) 88 (1.1) 97 (0.4) 80 (1.0)
Germany 70 (1.3) 35 (1.4) 68 (1.3) 94 (0.5) 64 (1.3)
Greece 87 (0.7) 82 (0.8) 89 (0.6) 96 (0.3) 85 (0.8)
Hong Kong 86 (0.9) 74 (1.3) 87 (0.9) 93 (0.5) 76 (1.0)
Hungary 81 (0.9) 66 (1.2) 83 (0.8) 94 (0.5) 74 (1.1)
Iceland 85 (1.4) 65 (2.0) 85 (1.1) 98 (0.4) 89 (1.2)
Iran, Islamic Rep. 95 (0.5) 95 (0.9) 93 (0.6) 87 (1.3) 93 (0.9)
Ireland 80 (0.9) 59 (1.4) 78 (0.8) 99 (0.2) 85 (0.7)
Israel 93 (1.1) 56 (2.5) 75 (2.0) 98 (0.5) 79 (1.9)
Japan 90 (0.5) 83 (0.7) 88 (0.6) 99 (0.2) 81 (0.7)
Korea 86 (0.8) 79 (0.9) 81 (0.8) 88 (0.7) 78 (1.0)
Kuwait 90 (0.8) 90 (0.8) 86 (1.0) 77 (1.3) 78 (1.5)
Latvia (LSS) 86 (0.9) 53 (1.3) 87 (1.0) 97 (0.4) 87 (0.8)
Lithuania 83 (0.9) 55 (1.3) 88 (0.9) 95 (0.5) 90 (0.7)
Netherlands 87 (0.9) 82 (1.2) 90 (0.7) 97 (0.6) 66 (1.2)
New Zealand 77 (1.0) 66 (1.2) 76 (1.0) 98 (0.3) 87 (0.8)
Norway 84 (0.8) 72 (1.2) 83 (0.9) 99 (0.2) 83 (1.0)
Portugal 89 (0.7) 88 (0.8) 93 (0.4) 92 (0.6) 94 (0.5)
Romania 87 (0.8) 80 (1.0) 88 (0.8) 86 (1.0) 81 (1.0)
Russian Federation 88 (0.8) 81 (0.8) 88 (0.8) 97 (0.4) 84 (0.8)
Scotland 81 (1.2) 70 (1.3) 82 (1.0) 98 (0.3) 84 (0.8)
Singapore 97 (0.4) 96 (0.5) 98 (0.2) 96 (0.3) 86 (0.8)
Slovak Republic 83 (0.7) 60 (1.3) 84 (0.7) 98 (0.2) 92 (0.5)
Slovenia 77 (1.2) 56 (1.6) 78 (1.1) 95 (0.5) 81 (0.9)
Spain 91 (0.6) 89 (0.7) 91 (0.5) 99 (0.2) 94 (0.4)
Sweden 70 (1.2) 61 (1.4) 68 (1.2) 97 (0.3) 75 (0.8)
Switzerland 85 (0.8) 40 (1.4) 82 (1.0) 93 (0.8) 75 (1.1)
Thailand 93 (0.6) 94 (0.5) 95 (0.4) 95 (0.4) 91 (0.4)*Eighth grade in most countries; see Table 2 for more information about the grades tested in each country.Data are reported as percent of students.( ) Standard errors appear in parentheses. Because results are rounded to the nearest whole number, some totals may appear inconsistent.Countries shown in italics did not satisfy one or more guidelines for sample participation rates or student sampling (see Figure 1). Background data for Bulgaria and South Africa not available.
SO
UR
CE
: IE
A T
hird
Inte
rnat
iona
l Mat
hem
atic
s an
d S
cien
ce S
tudy
(T
IMS
S),
199
4-95
. Mis
sour
i and
Ore
gon
data
col
lect
ed in
199
7.

94
C H A P T E R 4
How Do Students Spend Their Out-of-School Time During the School Week?Even though education may be thought to be the dominant activity of school-aged children, young people actually spend much more of their time outside of school. Some of this out-of-school time is spent at furthering academic development – for example, in studying or doing homework in school subjects. Table 4.8 presents eighth-grade students’ reports about the average number of hours per day they spend studying or doing homework in mathematics, science, and other subjects. Students in many countries reported spending roughly an hour per day studying mathematics. The eighth graders in Missouri reported .7 hours per day and those in Oregon .8 hours per day, both consistent with the .8 hours reported by U.S. eighth graders. Eighth-graders in the Czech Republic, Denmark, Germany, the Netherlands, and Scotland were at the lower end of the range, reporting an average of about one-half hour per day (.5 to .6 of an hour). Those in Iran and Romania were at the top end, reporting about two hours of mathematics homework per day (2.0 and 1.8 hours, respectively). On average, students in nearly all countries reported spending somewhat less time per day studying science.
Participating countries showed some variation in the amount of time students spent doing homework each day across all school subjects. The most common response about the amount of homework done, reported by eighth graders in about half the countries, was an average of two to three hours per day, but there was a range. Students in Iran, Kuwait, and Romania reported spending the most time on homework, five or more hours per day. Students in the Czech Republic, Denmark, and Scotland reported spending the least amount of time per day on homework, less than two hours. Those in the U.S. reported spending 2.3 hours per day on homework, compared to 1.9 hours for the eighth graders in Missouri and 2.2 hours for those in Oregon.
The students also were asked about a variety of other ways they could spend their time out of school. Eighth graders were asked about watching television, playing computer games, playing or talking with friends, doing jobs at home, playing sports, and reading books for enjoyment. Their reports about the amount of time spent daily in each of these activities are shown in Table 4.9. Granted, some television programming and some computer games are targeted at developing children’s academic abilities, and leisure reading also can be related to higher academic achievement. Still, much fare on television is not educationally related, and eighth-grade students in many countries reported spending nearly as much time each day watching television – an average of two to three hours per day – as they did doing homework. The reports for Missouri were consistent with those of the U.S. as a whole, with students reporting that they watched 2.6 hours of television or videos on average each day. Eighth graders in Oregon reported less daily viewing on average, two hours each day. Eighth-graders in many countries also appear to spend several hours per day playing or talking with friends, and nearly two hours playing sports. Those in the United States, Oregon, and Missouri reported about two and one-half hours per day playing or talking with friends, and about two hours playing sports. The time spent on leisure activities is not additive, because students often do these activities simultaneously (e.g., talk with friends and watch television). Nevertheless, it does appear that in most countries at least as much time is spent in these largely non-academic activities as in studying and doing homework, and probably more time.

95
C H A P T E R 4
Table 4.8Students' Reports on How They Spend Their Daily Out-of-School Study Time 1
Mathematics - Eighth Grade*
Country
Average Hours Each Day Studying
Mathematics or Doing
Mathematics Homework After
School
Average Hours Each Day Studying Science or Doing
Science Homework After
School
Average Hours Each Day Studying
or Doing Homework in Other School
Subjects
Total Hours Each Day on Average
UNITED STATES 0.8 (0.02) 0.6 (0.01) 0.9 (0.02) 2.3 (0.04)
MISSOURI 0.7 (0.03) 0.5 (0.02) 0.7 (0.03) 1.9 (0.07)
OREGON 0.8 (0.03) 0.5 (0.03) 0.9 (0.03) 2.2 (0.07)
Australia 0.7 (0.02) 0.5 (0.01) 0.9 (0.02) 2.0 (0.04)
Austria 0.8 (0.02) 0.7 (0.03) 0.8 (0.02) 2.4 (0.07)
Belgium (Fl) 1.1 (0.03) 0.8 (0.02) 1.5 (0.03) 3.4 (0.07)
Belgium (Fr) 1.0 (0.02) 0.8 (0.02) 1.2 (0.03) 3.0 (0.07)
Canada 0.7 (0.02) 0.6 (0.02) 0.9 (0.03) 2.2 (0.07)
Colombia 1.3 (0.06) 1.2 (0.06) 2.0 (0.07) 4.6 (0.15)
Cyprus 1.2 (0.02) 0.9 (0.02) 1.5 (0.03) 3.6 (0.06)
Czech Republic 0.6 (0.02) 0.6 (0.02) 0.6 (0.02) 1.8 (0.05)
Denmark 0.5 (0.02) 0.3 (0.02) 0.5 (0.02) 1.4 (0.05)
England – – – – – – – –
France 0.9 (0.02) 0.6 (0.01) 1.2 (0.03) 2.7 (0.05)
Germany 0.6 (0.02) 0.6 (0.02) 0.8 (0.02) 2.0 (0.05)
Greece 1.2 (0.03) 1.2 (0.03) 2.0 (0.05) 4.4 (0.08)
Hong Kong 0.9 (0.02) 0.6 (0.02) 1.1 (0.03) 2.5 (0.06)
Hungary 0.8 (0.02) 1.1 (0.02) 1.2 (0.03) 3.1 (0.06)
Iceland 0.9 (0.03) 0.6 (0.03) 0.9 (0.03) 2.4 (0.07)
Iran, Islamic Rep. 2.0 (0.05) 1.9 (0.05) 2.5 (0.05) 6.4 (0.13)
Ireland 0.7 (0.02) 0.6 (0.01) 1.4 (0.03) 2.7 (0.05)
Israel 1.0 (0.04) 0.6 (0.03) 1.2 (0.05) 2.8 (0.10)
Japan 0.8 (0.01) 0.6 (0.01) 1.0 (0.02) 2.3 (0.04)
Korea 0.8 (0.02) 0.6 (0.02) 1.1 (0.02) 2.5 (0.05)
Kuwait 1.6 (0.04) 1.5 (0.05) 2.3 (0.06) 5.3 (0.13)
Latvia (LSS) 0.9 (0.02) 0.6 (0.02) 1.2 (0.03) 2.7 (0.05)
Lithuania 0.8 (0.02) 0.7 (0.02) 1.2 (0.04) 2.7 (0.06)
Netherlands 0.6 (0.01) 0.6 (0.01) 1.0 (0.03) 2.2 (0.04)
New Zealand 0.7 (0.02) 0.6 (0.01) 0.9 (0.02) 2.1 (0.05)
Norway 0.7 (0.02) 0.6 (0.01) 1.0 (0.02) 2.3 (0.04)
Portugal 1.0 (0.02) 0.9 (0.02) 1.1 (0.02) 3.0 (0.05)
Romania 1.8 (0.07) 1.6 (0.06) 1.6 (0.06) 5.0 (0.18)
Russian Federation 0.9 (0.02) 1.0 (0.02) 1.0 (0.02) 2.9 (0.05)
Scotland 0.6 (0.02) 0.5 (0.01) 0.7 (0.02) 1.8 (0.04)
Singapore 1.4 (0.02) 1.3 (0.02) 1.9 (0.03) 4.6 (0.04)
Slovak Republic 0.7 (0.01) 0.8 (0.02) 0.9 (0.02) 2.4 (0.04)
Slovenia 0.9 (0.02) 1.0 (0.02) 0.9 (0.02) 2.9 (0.05)
Spain 1.2 (0.02) 1.0 (0.02) 1.4 (0.03) 3.6 (0.06)
Sweden 0.7 (0.01) 0.7 (0.01) 0.9 (0.02) 2.3 (0.04)
Switzerland 0.9 (0.02) 0.7 (0.01) 1.0 (0.02) 2.7 (0.04)
Thailand 1.2 (0.03) 1.0 (0.02) 1.3 (0.02) 3.5 (0.06)*Eighth grade in most countries; see Table 2 for more information about the grades tested in each country.1Average hours based on: No Time = 0; Less Than 1 Hour = .5; 1-2 Hours =1.5; 3-5 Hours = 4; More Than 5 Hours = 7.( ) Standard errors appear in parentheses. Because results are rounded to the nearest whole number, some totals may appear inconsistent.Countries shown in italics did not satisfy one or more guidelines for sample participation rates or student sampling (see Figure 1).Background data for Bulgaria and South Africa not available.A dash (–) indicates data are not available.
SO
UR
CE
: IE
A T
hird
Inte
rnat
iona
l Mat
hem
atic
s an
d S
cien
ce S
tudy
(T
IMS
S),
199
4-95
. Mis
sour
i and
Ore
gon
data
col
llect
ed in
199
7.

96
C H A P T E R 4
Table 4.9 Students' Reports on How They Spend Their Daily Leisure Time 1
Mathematics - Eighth Grade*
Country
Average Hours Each Day Watching
Television or Videos
Average Hours Each Day Playing
Computer Games
Average Hours Each Day Playing or Talking
with Friends
Average Hours Each Day Doing
Jobs at Home
Average Hours Each Day Playing
Sports
Average Hours Each Day Reading
a Book for Enjoyment
UNITED STATES 2.6 (0.07) 0.7 (0.03) 2.5 (0.06) 1.2 (0.04) 2.2 (0.05) 0.7 (0.02)
MISSOURI 2.6 (0.07) 0.7 (0.03) 2.6 (0.10) 1.3 (0.05) 2.0 (0.05) 0.6 (0.02)
OREGON 2.0 (0.08) 0.7 (0.04) 2.4 (0.07) 1.2 (0.05) 1.9 (0.06) 0.8 (0.03)
Australia 2.4 (0.05) 0.6 (0.02) 1.4 (0.03) 0.9 (0.02) 1.6 (0.03) 0.6 (0.02)
Austria 1.9 (0.06) 0.6 (0.03) 2.9 (0.08) 0.8 (0.03) 1.9 (0.07) 0.8 (0.03)
Belgium (Fl) 2.0 (0.05) 0.5 (0.06) 1.6 (0.05) 1.1 (0.03) 1.8 (0.07) 0.7 (0.03)
Belgium (Fr) 1.9 (0.08) 0.7 (0.03) 1.7 (0.10) 0.8 (0.03) 1.8 (0.04) 0.8 (0.03)
Canada 2.3 (0.04) 0.5 (0.02) 2.2 (0.05) 1.0 (0.02) 1.9 (0.03) 0.8 (0.02)
Colombia 2.2 (0.07) r 0.4 (0.06) 1.9 (0.06) 2.3 (0.07) 1.9 (0.06) 0.9 (0.05)
Cyprus 2.3 (0.04) 0.8 (0.03) 1.7 (0.04) 1.0 (0.03) 1.4 (0.04) 0.8 (0.02)
Czech Republic 2.6 (0.05) 0.6 (0.03) 2.9 (0.09) 1.3 (0.04) 1.9 (0.06) 1.0 (0.03)
Denmark 2.2 (0.06) 0.7 (0.03) 2.8 (0.07) 1.1 (0.04) 1.7 (0.06) 0.7 (0.03)
England 2.7 (0.07) 0.9 (0.05) 2.5 (0.06) 0.8 (0.03) 1.5 (0.05) 0.7 (0.03)
France 1.5 (0.04) 0.5 (0.02) 1.5 (0.05) 0.9 (0.03) 1.7 (0.04) 0.8 (0.03)
Germany 1.9 (0.04) 0.8 (0.04) 3.5 (0.07) 0.9 (0.02) 1.7 (0.04) 0.7 (0.02)
Greece 2.1 (0.04) 0.7 (0.03) 1.5 (0.04) 0.9 (0.03) 1.8 (0.04) 1.0 (0.03)
Hong Kong 2.6 (0.05) 0.8 (0.03) 1.2 (0.04) 0.7 (0.02) 0.9 (0.03) 0.9 (0.02)
Hungary 3.0 (0.06) 0.7 (0.03) 2.3 (0.05) 2.0 (0.04) 1.7 (0.04) 1.2 (0.04)
Iceland 2.2 (0.05) 0.7 (0.06) 3.1 (0.06) 0.8 (0.03) 1.8 (0.06) 0.9 (0.06)
Iran, Islamic Rep. 1.8 (0.06) r 0.2 (0.02) 1.2 (0.04) 1.8 (0.06) 1.2 (0.09) 1.1 (0.04)
Ireland 2.1 (0.03) 0.5 (0.03) 1.5 (0.06) 0.9 (0.03) 1.4 (0.05) 0.6 (0.02)
Israel 3.3 (0.10) 0.9 (0.04) 2.4 (0.08) 1.2 (0.05) 1.9 (0.09) 1.0 (0.04)
Japan 2.6 (0.04) 0.6 (0.02) 1.9 (0.04) 0.6 (0.01) 1.3 (0.03) 0.9 (0.02)
Korea 2.0 (0.04) 0.3 (0.02) 0.9 (0.03) 0.5 (0.02) 0.5 (0.02) 0.8 (0.03)
Kuwait 1.9 (0.09) 0.7 (0.04) 1.5 (0.06) 1.2 (0.06) 1.5 (0.06) 1.0 (0.04)
Latvia (LSS) 2.6 (0.05) 0.7 (0.04) 2.1 (0.06) 1.5 (0.04) 1.2 (0.04) 1.1 (0.03)
Lithuania 2.8 (0.05) 0.9 (0.04) 2.7 (0.06) 1.2 (0.03) 1.2 (0.04) 1.0 (0.03)
Netherlands 2.5 (0.09) 0.7 (0.04) 2.8 (0.08) 0.9 (0.04) 1.8 (0.06) 0.6 (0.03)
New Zealand 2.5 (0.05) 0.7 (0.03) 1.5 (0.04) 0.9 (0.02) 1.5 (0.04) 0.8 (0.02)
Norway 2.5 (0.04) 0.8 (0.03) 3.2 (0.06) 1.1 (0.03) 1.9 (0.05) 0.7 (0.02)
Portugal 2.0 (0.04) 0.7 (0.03) 1.7 (0.05) 1.0 (0.04) 1.7 (0.04) 0.7 (0.02)
Romania 1.9 (0.06) 0.6 (0.05) 1.5 (0.06) 1.9 (0.08) 1.3 (0.05) 1.3 (0.07)
Russian Federation 2.9 (0.05) 1.0 (0.04) 2.9 (0.05) 1.5 (0.03) 1.0 (0.03) 1.3 (0.04)
Scotland 2.7 (0.05) 1.0 (0.04) 2.8 (0.08) 0.7 (0.02) 1.9 (0.05) 0.7 (0.02)
Singapore 2.7 (0.05) 0.6 (0.03) 1.5 (0.04) 1.0 (0.03) 0.7 (0.03) 1.1 (0.02)
Slovak Republic 2.7 (0.05) 0.6 (0.03) 2.9 (0.07) 1.5 (0.05) 1.8 (0.04) 1.0 (0.03)
Slovenia 2.0 (0.04) 0.6 (0.02) 1.7 (0.05) 1.6 (0.05) 1.6 (0.03) 0.9 (0.02)
Spain 1.8 (0.05) 0.3 (0.02) 1.8 (0.06) 1.1 (0.03) 1.7 (0.04) 0.6 (0.02)
Sweden 2.3 (0.04) 0.6 (0.02) 2.3 (0.05) 0.9 (0.02) 1.6 (0.04) 0.7 (0.02)
Switzerland 1.3 (0.03) 0.4 (0.02) 2.4 (0.05) 1.0 (0.03) 1.8 (0.03) 0.8 (0.02)
Thailand 2.1 (0.07) 0.3 (0.02) 1.2 (0.03) 1.6 (0.03) 1.1 (0.02) 1.0 (0.02)*Eighth grade in most countries; see Table 2 for more information about the grades tested in each country.1Average hours based on: No Time = 0; Less Than 1 Hour = .5; 1-2 Hours = 1.5; 3-5 Hours = 4; More Than 5 Hours = 7.( ) Standard errors appear in parentheses. Because results are rounded to the nearest whole number, some totals may appear inconsistent.Countries shown in italics did not satisfy one or more guidelines for sample participation rates or student sampling (see Figure 1). Background data for Bulgaria and South Africa not available.An "r" indicates a 70 - 84% student response rate.
SO
UR
CE
: IE
A T
hird
Inte
rnat
iona
l Mat
hem
atic
s an
d S
cien
ce S
tudy
(T
IMS
S),
199
4-95
. Mis
sour
i and
Ore
gon
data
col
lect
ed in
199
7.

C H A P T E R 4
97
Table 4.10 shows the relationship between time spent doing homework in all subjects and students’ average mathematics achievement. The relationship was curvilinear in many countries, with the highest achievement being associated with a moderate amount of homework per day (less than one hour). This pattern was noted in the United States as well as in Missouri and Oregon. In all three instances, the students who did some amount of mathematics homework each night had higher achievement than their counterparts who reported doing no homework. However, the students who reported one hour or more of homework did not have higher achievement than those who reported less than one hour of homework each night, and the results indicate somewhat lower achievement. The curvilinear pattern suggests that, compared to their higher-achieving counterparts, the lower-performing students may do less homework, either because they do not do it or because their teachers do not assign it, or more homework, perhaps because they need to spend the extra time to keep up academically. A direct positive relationship between time spent doing homework and mathematics achievement was found only in Korea, Romania, and Thailand. The only inverse rela-tionships were noted for Denmark, and to a lesser extent for Slovenia. Clearly, dif-ferent countries have different policies and practices about assigning homework.
The relationship between mathematics achievement and amount of time spent watching television each day was more consistent across countries than that with doing homework (see Table 4.11). In about half the TIMSS countries, the highest mathe-matics achievement was associated with watching from one to two hours of television per day. This was the most common response, reflecting from 33% to 54% of the stu-dents for all countries. Watching television for one to two hours each day also was the most common response for eighth graders in Missouri (40%) and in Oregon (42%). In Missouri, as for the United States, the pattern was consistent with that of students having the highest mathematics achievement. In Oregon, however, where 32% of the students reported watching less than one hour of television each night, there was a direct relationship between less television viewing per night and higher mathematics achievement. That watching less than one hour of television per day generally was associated with lower average mathematics achievement than watching one to two hours in many countries most likely has little to do with the influence of television viewing on mathematics achievement. For these students, low television viewing may be a surrogate socio-economic indicator, suggesting something about children’s access to television sets across countries. Because students with fewer socio-economic advantages generally perform less well than their counterparts academically, it may be that students who reported less than one hour watching television each day simply do not have television sets in their homes, or come from homes with only one television set, where they have less opportunity to spend a lot of time watching their choice of programming.

98
C H A P T E R 4
Table 4.10Students' Reports on Total Amount of Out-of-School Time Spent Studying Mathematicsor Doing Mathematics Homework on a Normal School Day - Mathematics - Eighth Grade*
CountryNo Time Less Than 1 Hour One Hour or More
Average
Percent of Students
Mean Achieve-
mentPercent of Students
Mean Achieve-
mentPercent of Students
Mean Achieve-
ment
Hours 1
UNITED STATES 18 (1.1) 467 (6.3) 55 (1.0) 513 (4.1) 27 (1.0) 502 (5.8) 0.8 (0.02)
MISSOURI 25 (1.7) 481 (6.9) 53 (1.5) 515 (6.7) 22 (1.7) 512 (10.3) 0.7 (0.03)
OREGON 17 (1.4) 482 (8.5) 57 (1.6) 538 (7.7) 27 (1.8) 528 (10.5) 0.8 (0.03)
Australia 16 (1.1) 483 (5.5) 63 (1.0) 545 (4.0) 21 (0.9) 527 (4.9) 0.7 (0.02)
Austria 7 (0.7) 527 (9.0) 66 (0.9) 548 (3.5) 27 (1.1) 528 (5.0) 0.8 (0.02)
Belgium (Fl) 3 (0.4) 518 (14.3) 51 (1.4) 576 (7.2) 46 (1.5) 557 (4.8) 1.1 (0.03)
Belgium (Fr) 8 (0.8) 475 (6.6) 51 (1.2) 546 (3.9) 41 (1.3) 517 (4.1) 1 (0.02)
Canada 15 (1.2) 521 (4.9) 61 (1.1) 538 (2.8) 24 (1.2) 509 (3.3) 0.7 (0.02)
Colombia 5 (0.6) 377 (5.1) 44 (1.7) 393 (3.0) 51 (1.8) 388 (3.9) 1.3 (0.06)
Cyprus 10 (0.6) 438 (5.5) 43 (1.0) 492 (2.5) 47 (0.8) 470 (2.6) 1.2 (0.02)
Czech Republic 14 (1.2) 554 (7.7) 70 (1.1) 572 (5.0) 16 (1.0) 539 (8.7) 0.6 (0.02)
Denmark 34 (1.8) 522 (4.3) 50 (1.7) 504 (3.9) 16 (1.0) 468 (4.3) 0.5 (0.02)
England – – – – – – – – – – – – – –
France 10 (0.8) 507 (7.4) 57 (1.3) 548 (3.5) 33 (1.3) 534 (3.5) 0.9 (0.02)
Germany 16 (1.1) 479 (6.5) 66 (1.3) 523 (4.5) 18 (0.8) 494 (4.9) 0.6 (0.02)
Greece 6 (0.5) 450 (7.6) 42 (1.1) 493 (3.6) 51 (1.2) 485 (3.1) 1.2 (0.03)
Hong Kong 14 (1.1) 537 (9.4) 52 (1.0) 595 (6.6) 34 (1.2) 605 (6.4) 0.9 (0.02)
Hungary 4 (0.4) 495 (8.8) 68 (1.1) 544 (3.7) 28 (1.2) 533 (4.6) 0.8 (0.02)
Iceland 5 (1.0) 469 (14.0) 64 (1.9) 498 (4.3) 32 (1.4) 477 (5.6) 0.9 (0.03)
Iran, Islamic Rep. 1 (0.3) ~ ~ 20 (1.0) 434 (2.8) 79 (1.1) 430 (2.4) 2 (0.05)
Ireland 6 (0.6) 475 (8.4) 71 (1.2) 539 (5.0) 23 (1.2) 517 (6.6) 0.7 (0.02)
Israel 5 (0.8) 527 (15.4) 53 (2.4) 540 (6.7) 41 (2.5) 505 (5.4) 1 (0.04)
Japan 14 (0.8) 579 (5.3) 56 (0.9) 609 (2.4) 30 (1.0) 610 (2.5) 0.8 (0.01)
Korea 20 (1.1) 578 (3.8) 47 (1.2) 605 (3.2) 33 (1.2) 630 (4.0) 0.8 (0.02)
Kuwait 5 (0.6) 372 (7.7) 37 (1.6) 400 (4.5) 58 (1.7) 390 (2.3) 1.6 (0.04)
Latvia (LSS) 4 (0.5) 473 (8.6) 64 (1.3) 505 (3.1) 32 (1.2) 481 (4.2) 0.9 (0.02)
Lithuania 8 (0.8) 465 (7.1) 68 (1.3) 484 (3.6) 24 (1.1) 474 (5.3) 0.8 (0.02)
Netherlands 6 (0.9) 538 (15.9) 83 (1.3) 548 (7.3) 11 (1.0) 498 (8.9) 0.6 (0.01)
New Zealand 13 (1.1) 474 (5.6) 69 (1.3) 520 (4.8) 18 (1.0) 494 (5.1) 0.7 (0.02)
Norway 7 (0.6) 481 (6.7) 72 (1.1) 513 (2.5) 21 (1.0) 483 (3.4) 0.7 (0.02)
Portugal 6 (0.5) 445 (5.6) 57 (1.2) 462 (2.7) 37 (1.1) 449 (2.9) 1 (0.02)
Romania 11 (0.8) 451 (9.0) 26 (1.5) 469 (5.6) 63 (1.8) 496 (4.2) 1.8 (0.07)
Russian Federation 6 (0.6) 500 (9.0) 59 (1.1) 540 (4.7) 36 (1.2) 540 (7.5) 0.9 (0.02)
Scotland 18 (1.5) 466 (5.5) 69 (1.3) 508 (6.2) 14 (1.0) 502 (6.4) 0.6 (0.02)
Singapore 4 (0.4) 609 (8.8) 19 (0.9) 655 (6.6) 77 (1.0) 643 (4.7) 1.4 (0.02)
Slovak Republic 9 (0.7) 547 (9.3) 71 (0.9) 554 (3.3) 20 (1.0) 526 (4.2) 0.7 (0.01)
Slovenia 6 (0.7) 555 (8.6) 59 (1.1) 552 (3.7) 35 (1.1) 520 (3.5) 0.9 (0.02)
Spain 4 (0.5) 445 (6.6) 44 (1.1) 496 (2.6) 52 (1.2) 484 (2.4) 1.2 (0.02)
Sweden 12 (0.9) 515 (5.8) 70 (1.0) 526 (2.9) 19 (0.9) 501 (4.4) 0.7 (0.01)
Switzerland 4 (0.3) 536 (7.7) 57 (1.3) 556 (3.5) 39 (1.3) 534 (3.5) 0.9 (0.02)
Thailand 4 (0.4) 496 (9.1) 40 (1.5) 513 (4.9) 55 (1.8) 533 (6.7) 1.2 (0.03)*Eighth grade in most countries; see Table 2 for more information about the grades tested in each country.1Average hours based on: No time = 0; Less than 1 hour = 0.5; 1-2 hours = 1.5; 3-4 hours = 3.5; More than 4 hours = 5.( ) Standard errors appear in parentheses. Because results are rounded to the nearest whole number, some totals may appear inconsistent.Countries shown in italics did not satisfy one or more guidelines for sample participation rates or student sampling (see Figure 1). Background datafor Bulgaria and South Africa not available.A dash (–) indicates data are not available. A tilde (~) indicates insufficient data to report achievement.
SO
UR
CE
: IE
A T
hird
Inte
rnat
iona
l Mat
hem
atic
s an
d S
cien
ce S
tudy
(T
IMS
S),
199
4-95
. Mis
sour
i and
Ore
gon
data
col
lect
ed in
199
7.

99
C H A P T E R 4
Table 4.11Students' Reports on the Hours Spent Each Day Watching Television and Videos Mathematics - Eighth Grade*
Less than 1 Hour 1 to 2 Hours 3 to 5 Hours More than 5 Hours
Country Percent of Students
Mean Achieve-
mentPercent of Students
Mean Achieve-
mentPercent of Students
Mean Achieve-
mentPercent of Students
Mean Achieve-
ment
UNITED STATES 22 (0.8) 504 (5.7) 40 (0.9) 513 (5.1) 25 (0.6) 501 (4.2) 13 (1.0) 461 (4.6)
MISSOURI 22 (1.1) 508 (7.6) 40 (1.6) 521 (6.8) 26 (1.1) 499 (7.4) 12 (0.9) 462 (8.3)
OREGON 32 (1.4) 537 (10.2) 42 (1.0) 531 (6.9) 19 (1.1) 519 (7.4) 8 (1.0) 475 (10.1)
Australia 24 (0.9) 539 (6.0) 41 (0.8) 539 (4.1) 27 (0.8) 528 (3.8) 9 (0.6) 487 (5.5)
Austria 25 (1.4) 540 (5.4) 53 (1.1) 546 (4.2) 17 (1.0) 539 (5.2) 5 (0.6) 497 (8.6)
Belgium (Fl) 24 (1.2) 580 (6.7) 52 (1.2) 575 (6.2) 19 (1.0) 535 (7.1) 5 (0.5) 514 (12.1)
Belgium (Fr) 33 (1.3) 536 (4.2) 44 (1.8) 536 (4.9) 17 (1.3) 522 (4.0) 6 (1.0) 445 (9.0)
Canada 22 (0.7) 522 (2.9) 46 (0.8) 534 (3.5) 25 (0.7) 532 (3.0) 7 (0.6) 504 (5.2)
Colombia 31 (1.5) 384 (4.9) 39 (1.2) 397 (3.3) 20 (1.2) 391 (5.2) 11 (1.0) 374 (5.3)
Cyprus 25 (1.1) 466 (4.4) 45 (1.1) 486 (2.7) 21 (0.8) 479 (3.7) 9 (0.7) 441 (5.7)
Czech Republic 15 (0.8) 556 (7.5) 45 (1.2) 575 (6.2) 31 (1.2) 562 (4.3) 9 (0.8) 531 (8.9)
Denmark 28 (1.1) 499 (3.9) 42 (1.2) 507 (4.0) 22 (1.0) 510 (4.5) 8 (0.7) 488 (6.0)
England 20 (1.3) 500 (8.1) 37 (1.2) 515 (3.9) 31 (1.2) 516 (3.7) 11 (0.9) 481 (6.1)
France 42 (1.3) 546 (3.9) 45 (1.1) 539 (2.9) 9 (0.7) 532 (5.5) 4 (0.5) 494 (10.8)
Germany 31 (1.0) 510 (6.2) 47 (1.1) 517 (4.5) 16 (0.8) 511 (5.9) 6 (0.6) 467 (7.4)
Greece 32 (0.9) 486 (3.5) 42 (0.7) 489 (3.7) 17 (0.7) 486 (4.9) 9 (0.5) 470 (5.7)
Hong Kong 22 (0.9) 582 (7.7) 39 (0.9) 599 (6.8) 28 (1.0) 599 (6.5) 11 (0.8) 556 (9.1)
Hungary 11 (0.7) 550 (6.2) 41 (1.1) 552 (4.0) 33 (0.9) 537 (3.9) 15 (1.0) 496 (5.2)
Iceland 24 (1.3) 475 (7.4) 47 (1.3) 494 (4.5) 22 (1.2) 498 (5.7) 7 (0.8) 473 (11.8)
Iran, Islamic Rep. 32 (1.3) 421 (3.1) 46 (0.9) 434 (2.9) 17 (0.9) 438 (4.1) 5 (0.6) 425 (7.9)
Ireland 20 (0.8) 517 (6.4) 51 (1.1) 539 (5.2) 23 (0.8) 531 (5.3) 5 (0.5) 486 (8.5)
Israel 9 (1.4) 506 (17.0) 33 (2.1) 536 (7.0) 44 (1.7) 525 (5.4) 14 (1.2) 505 (7.8)
Japan 9 (0.5) 606 (5.7) 53 (0.9) 615 (2.1) 30 (0.8) 596 (3.4) 9 (0.5) 569 (5.1)
Korea 32 (1.0) 612 (4.6) 40 (1.0) 618 (3.4) 20 (0.8) 595 (5.3) 7 (0.6) 570 (6.9)
Kuwait 39 (2.1) 386 (2.8) 38 (1.3) 398 (3.8) 14 (1.2) 400 (3.9) 9 (1.0) 384 (4.4)
Latvia (LSS) 16 (1.0) 474 (4.4) 44 (1.1) 500 (3.7) 29 (1.2) 509 (4.2) 10 (0.7) 475 (5.1)
Lithuania 12 (0.7) 469 (6.2) 44 (1.3) 480 (4.6) 32 (1.2) 483 (4.0) 12 (0.9) 472 (5.8)
Netherlands 17 (1.8) 544 (14.0) 47 (1.7) 556 (7.0) 27 (1.5) 529 (6.3) 9 (0.9) 496 (7.3)
New Zealand 24 (1.0) 506 (6.4) 38 (0.9) 521 (4.8) 26 (0.9) 510 (4.7) 12 (0.8) 474 (5.7)
Norway 15 (0.7) 508 (4.2) 48 (1.0) 509 (2.5) 30 (1.0) 503 (3.7) 7 (0.4) 470 (6.0)
Portugal 27 (1.0) 450 (3.3) 48 (0.9) 458 (2.9) 20 (0.8) 460 (3.3) 5 (0.5) 440 (5.3)
Romania 38 (1.4) 475 (5.6) 39 (1.2) 489 (5.5) 16 (0.9) 495 (5.6) 8 (0.7) 470 (7.7)
Russian Federation 12 (1.0) 515 (6.9) 42 (1.4) 538 (5.9) 32 (1.0) 547 (4.8) 14 (0.9) 535 (7.5)
Scotland 15 (0.7) 488 (7.2) 43 (1.0) 504 (6.9) 31 (1.0) 508 (5.9) 11 (0.7) 472 (4.8)
Singapore 7 (0.6) 657 (7.2) 50 (1.1) 650 (5.2) 37 (1.2) 636 (5.2) 6 (0.5) 619 (8.6)
Slovak Republic 14 (0.7) 561 (7.4) 47 (1.0) 550 (3.5) 28 (0.9) 547 (4.1) 11 (0.8) 523 (5.6)
Slovenia 23 (1.1) 546 (4.1) 54 (1.1) 541 (3.4) 19 (0.9) 540 (4.7) 4 (0.4) 518 (9.9)
Spain 33 (1.2) 481 (3.0) 46 (1.0) 494 (2.4) 17 (0.8) 489 (3.9) 4 (0.5) 464 (5.1)
Sweden 16 (0.7) 518 (4.9) 51 (0.9) 528 (3.3) 27 (0.8) 514 (3.7) 6 (0.5) 478 (5.5)
Switzerland 45 (1.5) 556 (4.1) 44 (1.3) 543 (3.2) 9 (0.7) 528 (6.6) 2 (0.2) ~ ~
Thailand 28 (1.4) 510 (4.7) 46 (1.0) 524 (6.4) 19 (1.1) 540 (7.3) 8 (0.7) 521 (6.9)*Eighth grade in most countries; see Table 2 for more information about the grades tested in each country.( ) Standard errors appear in parentheses. Because results are rounded to the nearest whole number, some totals may appear inconsistent.Countries shown in italics did not satisfy one or more guidelines for sample participation rates or student sampling (see Figure 1). Background datafor Bulgaria and South Africa not available.A tilde (~) indicates insufficient data to report achievement.
SO
UR
CE
: IE
A T
hird
Inte
rnat
iona
l Mat
hem
atic
s an
d S
cien
ce S
tudy
(T
IMS
S),
199
4-95
. Mis
sour
i and
Ore
gon
data
col
lect
ed in
199
7.

100
C H A P T E R 4
In general, beyond one to two hours of television viewing per day, the more television eighth graders reported watching, the lower their mathematics achievement. In all countries students watching more than five hours of television per day had the lowest average mathematics achievement. Countries where 10% or more of the students reported watching more than five hours of television each day included Colombia, England, Hong Kong, Hungary, Israel, Latvia (LSS), Lithuania, New Zealand, the Russian Federation, Scotland, the Slovak Republic, and the United States. In Mis-souri, 12% reported watching more than 5 hours each day, and in Oregon 8% did.
How Do Students Perceive Success in Mathematics?Table 4.12 presents eighth-grade students’ perceptions about doing well in mathe-matics. In all except four countries, the majority of students agreed or strongly agreed that they did well in mathematics. The four exceptions, where more than 50% of the students disagreed or strongly disagreed about doing well, were Hong Kong (62%), Japan (55%), Korea (62%), and Lithuania (51%). Notably, three of those countries were among the very highest performing countries. Countries where 80% or more of the eighth graders felt they were usually good at mathematics represented a range in mathematics performance – Australia, Canada, Colombia, Denmark, England, Greece, Iceland, Iran, Israel, Kuwait, New Zealand, Scotland, Sweden, and the United States. Eighty-four percent so agreed in Missouri and 85% in Oregon, compared with 86% in the United States as a whole.
Figure 4.2 indicates that, internationally, eighth-grade girls had lower self-perceptions than boys about how well they usually do in mathematics. This figure and the distri-butions shown in Table 4.12 also show that, on average, both boys and girls in the par-ticipating countries tended to agree (or sometimes disagree) about usually doing well in mathematics rather than report the extremes of strongly agreeing or disagreeing. For most countries both boys and girls tended to indicate that they did well in mathe-matics – a perception that did not always coincide with their achievement on the TIMSS mathematics test. Interestingly, in looking at Figure 4.2, it is apparent that the U.S. has among the most positive self-perceptions about doing well in mathematics, and that the results for Oregon and Missouri are consistent with those of the United States. Also, Missouri and Oregon as well as the United States are among the few par-ticipants where there is no gender gap in perceptions between boys and girls.
Students were asked about the necessity of various attributes or activities to do well in mathematics (see Table 4.13). There was enormous variation from country to country in the percentage of eighth-grade students agreeing that natural talent or ability were important to do well in mathematics. Forty-eight percent in Oregon and 51% in Mis-souri so agreed compared to 50% in the United States. Fewer than 50% of the students agreed in England, France, Iceland, the Netherlands, and Sweden compared to 90% or more in Colombia, Denmark, Hungary, and Iran. Internationally, relatively few stu-dents agreed that good luck was important to do well. Twenty-seven percent in Oregon and 30% in Missouri so agreed, compared to 32% in the United States. The countries where more than 50% of the eighth graders agreed that good luck was needed to do well in mathematics included Colombia, the Czech Republic, Hungary, Iran, Japan, Korea, Kuwait, Latvia (LSS), Lithuania, Romania, the Russian Federation, and the Slovak Republic.
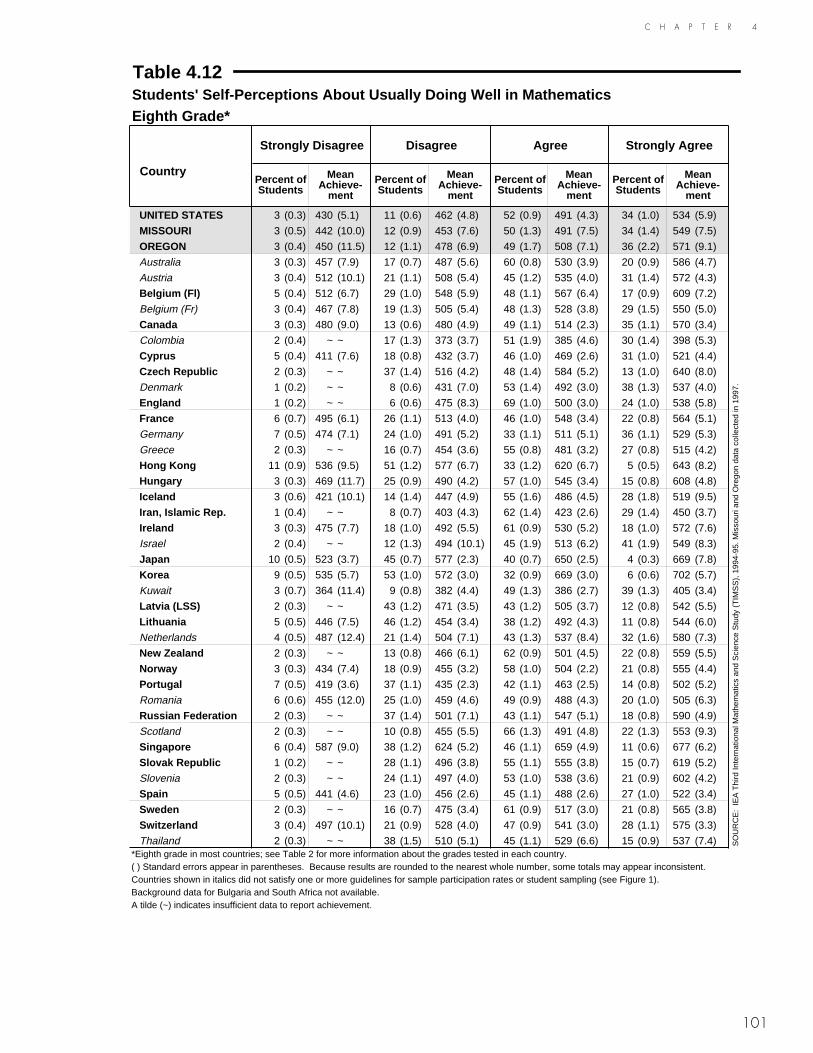
101
C H A P T E R 4
Table 4.12Students' Self-Perceptions About Usually Doing Well in MathematicsEighth Grade*
Strongly Disagree Disagree Agree Strongly Agree
CountryPercent of Students
Mean Achieve-
ment
Percent of Students
Mean Achieve-
ment
Percent of Students
Mean Achieve-
ment
Percent of Students
Mean Achieve-
ment
UNITED STATES 3 (0.3) 430 (5.1) 11 (0.6) 462 (4.8) 52 (0.9) 491 (4.3) 34 (1.0) 534 (5.9)
MISSOURI 3 (0.5) 442 (10.0) 12 (0.9) 453 (7.6) 50 (1.3) 491 (7.5) 34 (1.4) 549 (7.5)
OREGON 3 (0.4) 450 (11.5) 12 (1.1) 478 (6.9) 49 (1.7) 508 (7.1) 36 (2.2) 571 (9.1)
Australia 3 (0.3) 457 (7.9) 17 (0.7) 487 (5.6) 60 (0.8) 530 (3.9) 20 (0.9) 586 (4.7)
Austria 3 (0.4) 512 (10.1) 21 (1.1) 508 (5.4) 45 (1.2) 535 (4.0) 31 (1.4) 572 (4.3)
Belgium (Fl) 5 (0.4) 512 (6.7) 29 (1.0) 548 (5.9) 48 (1.1) 567 (6.4) 17 (0.9) 609 (7.2)
Belgium (Fr) 3 (0.4) 467 (7.8) 19 (1.3) 505 (5.4) 48 (1.3) 528 (3.8) 29 (1.5) 550 (5.0)
Canada 3 (0.3) 480 (9.0) 13 (0.6) 480 (4.9) 49 (1.1) 514 (2.3) 35 (1.1) 570 (3.4)
Colombia 2 (0.4) ~ ~ 17 (1.3) 373 (3.7) 51 (1.9) 385 (4.6) 30 (1.4) 398 (5.3)
Cyprus 5 (0.4) 411 (7.6) 18 (0.8) 432 (3.7) 46 (1.0) 469 (2.6) 31 (1.0) 521 (4.4)
Czech Republic 2 (0.3) ~ ~ 37 (1.4) 516 (4.2) 48 (1.4) 584 (5.2) 13 (1.0) 640 (8.0)
Denmark 1 (0.2) ~ ~ 8 (0.6) 431 (7.0) 53 (1.4) 492 (3.0) 38 (1.3) 537 (4.0)
England 1 (0.2) ~ ~ 6 (0.6) 475 (8.3) 69 (1.0) 500 (3.0) 24 (1.0) 538 (5.8)
France 6 (0.7) 495 (6.1) 26 (1.1) 513 (4.0) 46 (1.0) 548 (3.4) 22 (0.8) 564 (5.1)
Germany 7 (0.5) 474 (7.1) 24 (1.0) 491 (5.2) 33 (1.1) 511 (5.1) 36 (1.1) 529 (5.3)
Greece 2 (0.3) ~ ~ 16 (0.7) 454 (3.6) 55 (0.8) 481 (3.2) 27 (0.8) 515 (4.2)
Hong Kong 11 (0.9) 536 (9.5) 51 (1.2) 577 (6.7) 33 (1.2) 620 (6.7) 5 (0.5) 643 (8.2)
Hungary 3 (0.3) 469 (11.7) 25 (0.9) 490 (4.2) 57 (1.0) 545 (3.4) 15 (0.8) 608 (4.8)
Iceland 3 (0.6) 421 (10.1) 14 (1.4) 447 (4.9) 55 (1.6) 486 (4.5) 28 (1.8) 519 (9.5)
Iran, Islamic Rep. 1 (0.4) ~ ~ 8 (0.7) 403 (4.3) 62 (1.4) 423 (2.6) 29 (1.4) 450 (3.7)
Ireland 3 (0.3) 475 (7.7) 18 (1.0) 492 (5.5) 61 (0.9) 530 (5.2) 18 (1.0) 572 (7.6)
Israel 2 (0.4) ~ ~ 12 (1.3) 494 (10.1) 45 (1.9) 513 (6.2) 41 (1.9) 549 (8.3)
Japan 10 (0.5) 523 (3.7) 45 (0.7) 577 (2.3) 40 (0.7) 650 (2.5) 4 (0.3) 669 (7.8)
Korea 9 (0.5) 535 (5.7) 53 (1.0) 572 (3.0) 32 (0.9) 669 (3.0) 6 (0.6) 702 (5.7)
Kuwait 3 (0.7) 364 (11.4) 9 (0.8) 382 (4.4) 49 (1.3) 386 (2.7) 39 (1.3) 405 (3.4)
Latvia (LSS) 2 (0.3) ~ ~ 43 (1.2) 471 (3.5) 43 (1.2) 505 (3.7) 12 (0.8) 542 (5.5)
Lithuania 5 (0.5) 446 (7.5) 46 (1.2) 454 (3.4) 38 (1.2) 492 (4.3) 11 (0.8) 544 (6.0)
Netherlands 4 (0.5) 487 (12.4) 21 (1.4) 504 (7.1) 43 (1.3) 537 (8.4) 32 (1.6) 580 (7.3)
New Zealand 2 (0.3) ~ ~ 13 (0.8) 466 (6.1) 62 (0.9) 501 (4.5) 22 (0.8) 559 (5.5)
Norway 3 (0.3) 434 (7.4) 18 (0.9) 455 (3.2) 58 (1.0) 504 (2.2) 21 (0.8) 555 (4.4)
Portugal 7 (0.5) 419 (3.6) 37 (1.1) 435 (2.3) 42 (1.1) 463 (2.5) 14 (0.8) 502 (5.2)
Romania 6 (0.6) 455 (12.0) 25 (1.0) 459 (4.6) 49 (0.9) 488 (4.3) 20 (1.0) 505 (6.3)
Russian Federation 2 (0.3) ~ ~ 37 (1.4) 501 (7.1) 43 (1.1) 547 (5.1) 18 (0.8) 590 (4.9)
Scotland 2 (0.3) ~ ~ 10 (0.8) 455 (5.5) 66 (1.3) 491 (4.8) 22 (1.3) 553 (9.3)
Singapore 6 (0.4) 587 (9.0) 38 (1.2) 624 (5.2) 46 (1.1) 659 (4.9) 11 (0.6) 677 (6.2)
Slovak Republic 1 (0.2) ~ ~ 28 (1.1) 496 (3.8) 55 (1.1) 555 (3.8) 15 (0.7) 619 (5.2)
Slovenia 2 (0.3) ~ ~ 24 (1.1) 497 (4.0) 53 (1.0) 538 (3.6) 21 (0.9) 602 (4.2)
Spain 5 (0.5) 441 (4.6) 23 (1.0) 456 (2.6) 45 (1.1) 488 (2.6) 27 (1.0) 522 (3.4)
Sweden 2 (0.3) ~ ~ 16 (0.7) 475 (3.4) 61 (0.9) 517 (3.0) 21 (0.8) 565 (3.8)
Switzerland 3 (0.4) 497 (10.1) 21 (0.9) 528 (4.0) 47 (0.9) 541 (3.0) 28 (1.1) 575 (3.3)
Thailand 2 (0.3) ~ ~ 38 (1.5) 510 (5.1) 45 (1.1) 529 (6.6) 15 (0.9) 537 (7.4)*Eighth grade in most countries; see Table 2 for more information about the grades tested in each country.( ) Standard errors appear in parentheses. Because results are rounded to the nearest whole number, some totals may appear inconsistent.Countries shown in italics did not satisfy one or more guidelines for sample participation rates or student sampling (see Figure 1). Background data for Bulgaria and South Africa not available.A tilde (~) indicates insufficient data to report achievement.
SO
UR
CE
: IE
A T
hird
Inte
rnat
iona
l Mat
hem
atic
s an
d S
cien
ce S
tudy
(T
IMS
S),
199
4-95
. Mis
sour
i and
Ore
gon
data
col
lect
ed in
199
7.
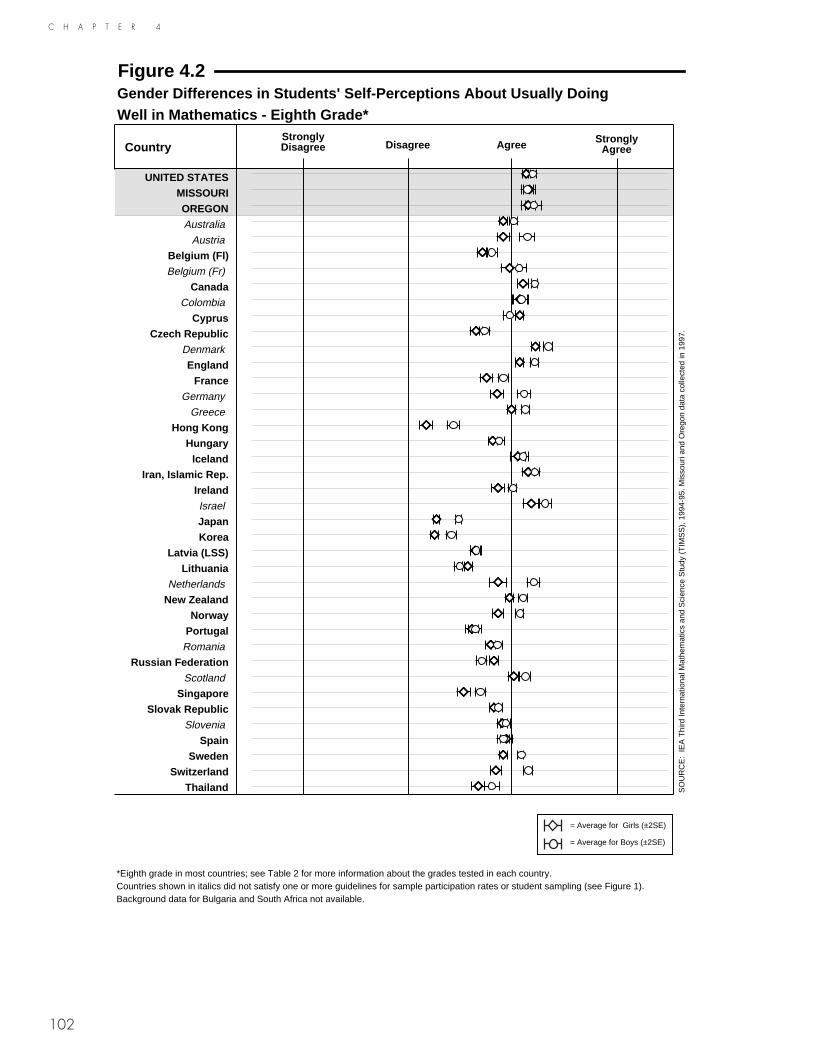
102
C H A P T E R 4
Figure 4.2Gender Differences in Students' Self-Perceptions About Usually DoingWell in Mathematics - Eighth Grade*
Country
UNITED STATES MISSOURI OREGON Australia
Austria
Belgium (Fl) Belgium (Fr)
Canada Colombia
Cyprus Czech Republic
Denmark
England France
Germany
Greece
Hong Kong Hungary
Iceland Iran, Islamic Rep.
Ireland Israel
Japan Korea
Latvia (LSS) Lithuania
Netherlands
New Zealand Norway
Portugal Romania
Russian Federation Scotland
Singapore Slovak Republic
Slovenia
Spain Sweden
Switzerland Thailand
*Eighth grade in most countries; see Table 2 for more information about the grades tested in each country.Countries shown in italics did not satisfy one or more guidelines for sample participation rates or student sampling (see Figure 1).Background data for Bulgaria and South Africa not available.
Strongly AgreeAgreeDisagree
Strongly Disagree
SO
UR
CE
: IE
A T
hird
Inte
rnat
iona
l Mat
hem
atic
s an
d S
cien
ce S
tudy
(T
IMS
S),
199
4-95
. Mis
sour
i and
Ore
gon
data
col
lect
ed in
199
7.
= Average for Girls (±2SE)
= Average for Boys (±2SE)
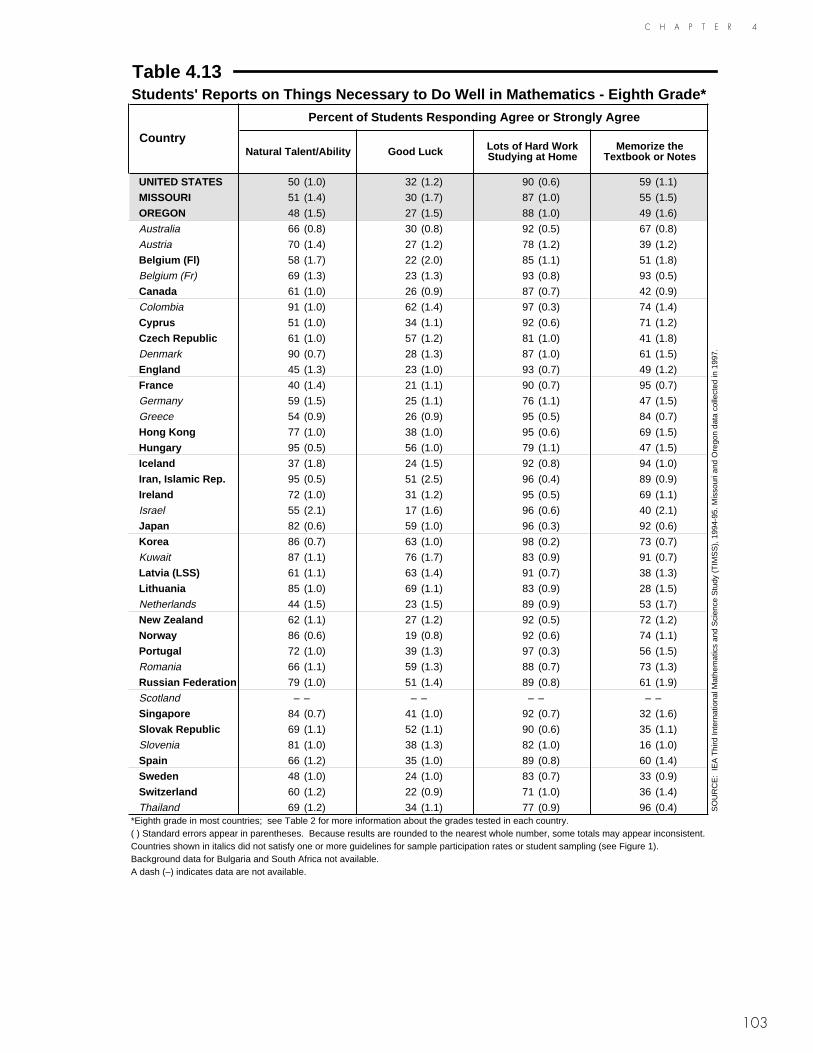
103
C H A P T E R 4
Table 4.13Students' Reports on Things Necessary to Do Well in Mathematics - Eighth Grade*
Percent of Students Responding Agree or Strongly Agree
CountryNatural Talent/Ability Good Luck Lots of Hard Work
Studying at HomeMemorize the
Textbook or Notes
UNITED STATES 50 (1.0) 32 (1.2) 90 (0.6) 59 (1.1)
MISSOURI 51 (1.4) 30 (1.7) 87 (1.0) 55 (1.5)
OREGON 48 (1.5) 27 (1.5) 88 (1.0) 49 (1.6)
Australia 66 (0.8) 30 (0.8) 92 (0.5) 67 (0.8)
Austria 70 (1.4) 27 (1.2) 78 (1.2) 39 (1.2)
Belgium (Fl) 58 (1.7) 22 (2.0) 85 (1.1) 51 (1.8)
Belgium (Fr) 69 (1.3) 23 (1.3) 93 (0.8) 93 (0.5)
Canada 61 (1.0) 26 (0.9) 87 (0.7) 42 (0.9)
Colombia 91 (1.0) 62 (1.4) 97 (0.3) 74 (1.4)
Cyprus 51 (1.0) 34 (1.1) 92 (0.6) 71 (1.2)
Czech Republic 61 (1.0) 57 (1.2) 81 (1.0) 41 (1.8)
Denmark 90 (0.7) 28 (1.3) 87 (1.0) 61 (1.5)
England 45 (1.3) 23 (1.0) 93 (0.7) 49 (1.2)
France 40 (1.4) 21 (1.1) 90 (0.7) 95 (0.7)
Germany 59 (1.5) 25 (1.1) 76 (1.1) 47 (1.5)
Greece 54 (0.9) 26 (0.9) 95 (0.5) 84 (0.7)
Hong Kong 77 (1.0) 38 (1.0) 95 (0.6) 69 (1.5)
Hungary 95 (0.5) 56 (1.0) 79 (1.1) 47 (1.5)
Iceland 37 (1.8) 24 (1.5) 92 (0.8) 94 (1.0)
Iran, Islamic Rep. 95 (0.5) 51 (2.5) 96 (0.4) 89 (0.9)
Ireland 72 (1.0) 31 (1.2) 95 (0.5) 69 (1.1)
Israel 55 (2.1) 17 (1.6) 96 (0.6) 40 (2.1)
Japan 82 (0.6) 59 (1.0) 96 (0.3) 92 (0.6)
Korea 86 (0.7) 63 (1.0) 98 (0.2) 73 (0.7)
Kuwait 87 (1.1) 76 (1.7) 83 (0.9) 91 (0.7)
Latvia (LSS) 61 (1.1) 63 (1.4) 91 (0.7) 38 (1.3)
Lithuania 85 (1.0) 69 (1.1) 83 (0.9) 28 (1.5)
Netherlands 44 (1.5) 23 (1.5) 89 (0.9) 53 (1.7)
New Zealand 62 (1.1) 27 (1.2) 92 (0.5) 72 (1.2)
Norway 86 (0.6) 19 (0.8) 92 (0.6) 74 (1.1)
Portugal 72 (1.0) 39 (1.3) 97 (0.3) 56 (1.5)
Romania 66 (1.1) 59 (1.3) 88 (0.7) 73 (1.3)
Russian Federation 79 (1.0) 51 (1.4) 89 (0.8) 61 (1.9)
Scotland – – – – – – – –
Singapore 84 (0.7) 41 (1.0) 92 (0.7) 32 (1.6)
Slovak Republic 69 (1.1) 52 (1.1) 90 (0.6) 35 (1.1)
Slovenia 81 (1.0) 38 (1.3) 82 (1.0) 16 (1.0)
Spain 66 (1.2) 35 (1.0) 89 (0.8) 60 (1.4)
Sweden 48 (1.0) 24 (1.0) 83 (0.7) 33 (0.9)
Switzerland 60 (1.2) 22 (0.9) 71 (1.0) 36 (1.4)
Thailand 69 (1.2) 34 (1.1) 77 (0.9) 96 (0.4)*Eighth grade in most countries; see Table 2 for more information about the grades tested in each country.( ) Standard errors appear in parentheses. Because results are rounded to the nearest whole number, some totals may appear inconsistent.Countries shown in italics did not satisfy one or more guidelines for sample participation rates or student sampling (see Figure 1). Background data for Bulgaria and South Africa not available.A dash (–) indicates data are not available.
SO
UR
CE
: IE
A T
hird
Inte
rnat
iona
l Mat
hem
atic
s an
d S
cien
ce S
tudy
(T
IMS
S),
199
4-95
. Mis
sour
i and
Ore
gon
data
col
lect
ed in
199
7.
104
C H A P T E R 4
Internationally, there was a high degree of agreement among students that lots of hard work studying at home was necessary in order to do well in mathematics. Percentages of agreement were in the 80s and 90s for most countries, and in the 70s for Austria, Germany, Hungary, Switzerland, and Thailand. Eighty-eight percent in Oregon and 87% in Missouri so agreed, compared to 90% in the U.S. The variation was substantial from country to country regarding students’ agreement with the necessity of memo-rizing the textbook or notes. In Belgium (French), France, Iceland, Japan, Kuwait, and Thailand, 90% or more of the eighth-grade students agreed or strongly agreed that memorization was important to doing well in mathematics. In contrast, fewer than 40% so agreed in Austria, Latvia (LSS), Lithuania, Singapore, the Slovak Republic, Slovenia, Sweden, and Switzerland. The U.S. eighth graders, as a whole, were in the middle with 59%, as were those in Missouri (55%) and Oregon (49%).
Students also were asked about why they need to do well in mathematics. Students could agree with any or all of the three areas of possible motivation presented in Table 4.14, including getting their desired job, to please their parents, and to get into their desired secondary school or university. There were substantial differences from country to country in students’ responses. In Colombia, Cyprus, Iran, Kuwait, and Scotland, 50% or more of the eighth graders strongly agreed that they needed to do well in mathematics to get their desired job. The majority of students in nearly all countries either agreed or strongly agreed that getting their desired job was a moti-vating factor, except Korea, where 53% of the students disagreed or strongly dis-agreed. In the United States, 86% of the students reported getting their desired job was a motivating factor, and the results were similar in Missouri (84%) and Oregon (85%).
In Iran, Kuwait, and Thailand, 50% or more of the students strongly agreed that they needed to do well in mathematics to please their parents. Even though in most coun-tries the majority of the eighth-grade students agreed at some level that pleasing their parents was important, 50% or more disagreed or strongly disagreed in Denmark, Iceland, Japan, the Netherlands, Slovenia, and Sweden. In the United States 80% agreed or strongly agreed, which was exactly the same as in Missouri, and nearly the same as in Oregon (82%). Internationally, the reason most frequently cited by students for needing to do well in mathematics was to get into students’ desired secondary school or university. With the exception of Austria, Belgium (Flemish), Germany, the Netherlands, and Switzerland, three-fourths or more of the students strongly agreed or agreed that this was a motivating factor for doing well in mathematics. The United States was no exception, with 96% so agreeing. The corresponding figures were 94% for Missouri and 95% for Oregon.
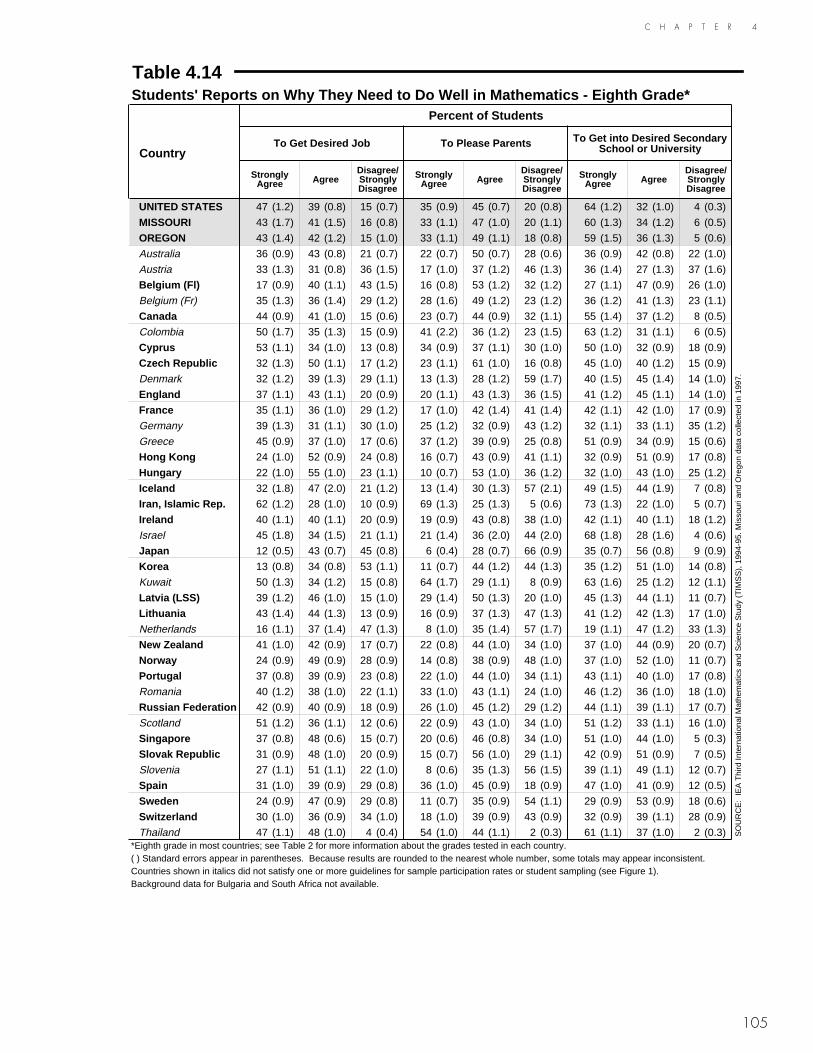
105
C H A P T E R 4
Table 4.14Students' Reports on Why They Need to Do Well in Mathematics - Eighth Grade*
Percent of Students
CountryTo Get Desired Job To Please Parents To Get into Desired Secondary
School or University
Strongly Agree Agree
Disagree/ Strongly Disagree
Strongly Agree Agree
Disagree/ Strongly Disagree
Strongly Agree Agree
Disagree/ Strongly Disagree
UNITED STATES 47 (1.2) 39 (0.8) 15 (0.7) 35 (0.9) 45 (0.7) 20 (0.8) 64 (1.2) 32 (1.0) 4 (0.3)
MISSOURI 43 (1.7) 41 (1.5) 16 (0.8) 33 (1.1) 47 (1.0) 20 (1.1) 60 (1.3) 34 (1.2) 6 (0.5)
OREGON 43 (1.4) 42 (1.2) 15 (1.0) 33 (1.1) 49 (1.1) 18 (0.8) 59 (1.5) 36 (1.3) 5 (0.6)
Australia 36 (0.9) 43 (0.8) 21 (0.7) 22 (0.7) 50 (0.7) 28 (0.6) 36 (0.9) 42 (0.8) 22 (1.0)
Austria 33 (1.3) 31 (0.8) 36 (1.5) 17 (1.0) 37 (1.2) 46 (1.3) 36 (1.4) 27 (1.3) 37 (1.6)
Belgium (Fl) 17 (0.9) 40 (1.1) 43 (1.5) 16 (0.8) 53 (1.2) 32 (1.2) 27 (1.1) 47 (0.9) 26 (1.0)
Belgium (Fr) 35 (1.3) 36 (1.4) 29 (1.2) 28 (1.6) 49 (1.2) 23 (1.2) 36 (1.2) 41 (1.3) 23 (1.1)
Canada 44 (0.9) 41 (1.0) 15 (0.6) 23 (0.7) 44 (0.9) 32 (1.1) 55 (1.4) 37 (1.2) 8 (0.5)
Colombia 50 (1.7) 35 (1.3) 15 (0.9) 41 (2.2) 36 (1.2) 23 (1.5) 63 (1.2) 31 (1.1) 6 (0.5)
Cyprus 53 (1.1) 34 (1.0) 13 (0.8) 34 (0.9) 37 (1.1) 30 (1.0) 50 (1.0) 32 (0.9) 18 (0.9)
Czech Republic 32 (1.3) 50 (1.1) 17 (1.2) 23 (1.1) 61 (1.0) 16 (0.8) 45 (1.0) 40 (1.2) 15 (0.9)
Denmark 32 (1.2) 39 (1.3) 29 (1.1) 13 (1.3) 28 (1.2) 59 (1.7) 40 (1.5) 45 (1.4) 14 (1.0)
England 37 (1.1) 43 (1.1) 20 (0.9) 20 (1.1) 43 (1.3) 36 (1.5) 41 (1.2) 45 (1.1) 14 (1.0)
France 35 (1.1) 36 (1.0) 29 (1.2) 17 (1.0) 42 (1.4) 41 (1.4) 42 (1.1) 42 (1.0) 17 (0.9)
Germany 39 (1.3) 31 (1.1) 30 (1.0) 25 (1.2) 32 (0.9) 43 (1.2) 32 (1.1) 33 (1.1) 35 (1.2)
Greece 45 (0.9) 37 (1.0) 17 (0.6) 37 (1.2) 39 (0.9) 25 (0.8) 51 (0.9) 34 (0.9) 15 (0.6)
Hong Kong 24 (1.0) 52 (0.9) 24 (0.8) 16 (0.7) 43 (0.9) 41 (1.1) 32 (0.9) 51 (0.9) 17 (0.8)
Hungary 22 (1.0) 55 (1.0) 23 (1.1) 10 (0.7) 53 (1.0) 36 (1.2) 32 (1.0) 43 (1.0) 25 (1.2)
Iceland 32 (1.8) 47 (2.0) 21 (1.2) 13 (1.4) 30 (1.3) 57 (2.1) 49 (1.5) 44 (1.9) 7 (0.8)
Iran, Islamic Rep. 62 (1.2) 28 (1.0) 10 (0.9) 69 (1.3) 25 (1.3) 5 (0.6) 73 (1.3) 22 (1.0) 5 (0.7)
Ireland 40 (1.1) 40 (1.1) 20 (0.9) 19 (0.9) 43 (0.8) 38 (1.0) 42 (1.1) 40 (1.1) 18 (1.2)
Israel 45 (1.8) 34 (1.5) 21 (1.1) 21 (1.4) 36 (2.0) 44 (2.0) 68 (1.8) 28 (1.6) 4 (0.6)
Japan 12 (0.5) 43 (0.7) 45 (0.8) 6 (0.4) 28 (0.7) 66 (0.9) 35 (0.7) 56 (0.8) 9 (0.9)
Korea 13 (0.8) 34 (0.8) 53 (1.1) 11 (0.7) 44 (1.2) 44 (1.3) 35 (1.2) 51 (1.0) 14 (0.8)
Kuwait 50 (1.3) 34 (1.2) 15 (0.8) 64 (1.7) 29 (1.1) 8 (0.9) 63 (1.6) 25 (1.2) 12 (1.1)
Latvia (LSS) 39 (1.2) 46 (1.0) 15 (1.0) 29 (1.4) 50 (1.3) 20 (1.0) 45 (1.3) 44 (1.1) 11 (0.7)
Lithuania 43 (1.4) 44 (1.3) 13 (0.9) 16 (0.9) 37 (1.3) 47 (1.3) 41 (1.2) 42 (1.3) 17 (1.0)
Netherlands 16 (1.1) 37 (1.4) 47 (1.3) 8 (1.0) 35 (1.4) 57 (1.7) 19 (1.1) 47 (1.2) 33 (1.3)
New Zealand 41 (1.0) 42 (0.9) 17 (0.7) 22 (0.8) 44 (1.0) 34 (1.0) 37 (1.0) 44 (0.9) 20 (0.7)
Norway 24 (0.9) 49 (0.9) 28 (0.9) 14 (0.8) 38 (0.9) 48 (1.0) 37 (1.0) 52 (1.0) 11 (0.7)
Portugal 37 (0.8) 39 (0.9) 23 (0.8) 22 (1.0) 44 (1.0) 34 (1.1) 43 (1.1) 40 (1.0) 17 (0.8)
Romania 40 (1.2) 38 (1.0) 22 (1.1) 33 (1.0) 43 (1.1) 24 (1.0) 46 (1.2) 36 (1.0) 18 (1.0)
Russian Federation 42 (0.9) 40 (0.9) 18 (0.9) 26 (1.0) 45 (1.2) 29 (1.2) 44 (1.1) 39 (1.1) 17 (0.7)
Scotland 51 (1.2) 36 (1.1) 12 (0.6) 22 (0.9) 43 (1.0) 34 (1.0) 51 (1.2) 33 (1.1) 16 (1.0)
Singapore 37 (0.8) 48 (0.6) 15 (0.7) 20 (0.6) 46 (0.8) 34 (1.0) 51 (1.0) 44 (1.0) 5 (0.3)
Slovak Republic 31 (0.9) 48 (1.0) 20 (0.9) 15 (0.7) 56 (1.0) 29 (1.1) 42 (0.9) 51 (0.9) 7 (0.5)
Slovenia 27 (1.1) 51 (1.1) 22 (1.0) 8 (0.6) 35 (1.3) 56 (1.5) 39 (1.1) 49 (1.1) 12 (0.7)
Spain 31 (1.0) 39 (0.9) 29 (0.8) 36 (1.0) 45 (0.9) 18 (0.9) 47 (1.0) 41 (0.9) 12 (0.5)
Sweden 24 (0.9) 47 (0.9) 29 (0.8) 11 (0.7) 35 (0.9) 54 (1.1) 29 (0.9) 53 (0.9) 18 (0.6)
Switzerland 30 (1.0) 36 (0.9) 34 (1.0) 18 (1.0) 39 (0.9) 43 (0.9) 32 (0.9) 39 (1.1) 28 (0.9)
Thailand 47 (1.1) 48 (1.0) 4 (0.4) 54 (1.0) 44 (1.1) 2 (0.3) 61 (1.1) 37 (1.0) 2 (0.3)*Eighth grade in most countries; see Table 2 for more information about the grades tested in each country.( ) Standard errors appear in parentheses. Because results are rounded to the nearest whole number, some totals may appear inconsistent.Countries shown in italics did not satisfy one or more guidelines for sample participation rates or student sampling (see Figure 1). Background data for Bulgaria and South Africa not available.
SO
UR
CE
: IE
A T
hird
Inte
rnat
iona
l Mat
hem
atic
s an
d S
cien
ce S
tudy
(T
IMS
S),
199
4-95
. Mis
sour
i and
Ore
gon
data
col
lect
ed in
199
7.
106
C H A P T E R 4
What Are Students’ Attitudes Towards Mathematics?To collect information on eighth-grade students’ perceptions of mathematics, TIMSS asked them a series of questions about its utility, importance, and enjoyability. Students’ perceptions about the value of learning mathematics may be considered as both an input and outcome variable, because their attitudes towards the subject can be related to educational achievement in ways that reinforce higher or lower performance. That is, students who do well in mathematics generally have more positive attitudes towards the subject, and those who have more positive attitudes tend to perform better.
Table 4.15 provides students’ responses to the question about how much they like or dislike mathematics, together with their average mathematics achievement. As antici-pated, within nearly every country, a clear positive relationship can be observed between a stronger liking of mathematics and higher achievement. Compared to 70% of the students in the United States, 67% of the students in Missouri reported liking mathematics to some extent as did 62% in Oregon. In both states, the results followed the international pattern of students with higher degrees of liking having higher math-ematics achievement. Even though the majority of eighth-graders in nearly every country indicated they liked mathematics to some degree, clearly not all students feel positive about this subject area. In Austria, the Czech Republic, Germany, Hungary, Japan, Korea, Lithuania, and the Netherlands, more than 40% of the eighth-grade stu-dents reported disliking mathematics.
The data in Figure 4.3 reveal that, on average, eighth graders of both genders were rel-atively neutral about liking mathematics. The United States, Missouri, and Oregon were consistent in this regard. The results in the United States and Oregon also were consistent with most countries in terms of no significant gender differences in stu-dents’ reports about liking mathematics. In contrast, the finding in Missouri where girls reported significantly more liking of mathematics than did boys was unique for TIMSS. In no country did girls report a significantly stronger liking of the subject area than did boys. However, boys reported liking mathematics better than girls did in several countries, including Austria, France, Germany, Hong Kong, Japan, Norway, and Switzerland.
To gain some understanding about eighth-graders’ view about the utility of mathe-matics and their enjoyment of it as a school subject, TIMSS asked students to state their level of agreement with the following four statements: 1) I would like a job that involved using mathematics, 2) Mathematics is important to everyone’s life, 3) Math-ematics is boring, and 4) I enjoy learning mathematics. The results for these four questions were averaged with students’ responses to the question about liking mathe-matics to form an index of their overall attitudes towards mathematics.

107
C H A P T E R 4
Table 4.15Students' Reports on How Much They Like Mathematics - Eighth Grade*
CountryDislike a Lot Dislike Like Like a Lot
Percent of Students
Mean Achieve-
ment
Percent of Students
Mean Achieve-
ment
Percent of Students
Mean Achieve-
ment
Percent of Students
Mean Achieve-
ment
UNITED STATES 12 (0.7) 463 (5.2) 17 (0.7) 492 (5.2) 47 (0.8) 504 (4.8) 23 (1.0) 519 (6.1)
MISSOURI 15 (1.0) 466 (8.5) 19 (1.2) 502 (7.3) 47 (1.3) 508 (7.0) 20 (1.1) 532 (8.4)
OREGON 14 (0.9) 487 (9.2) 23 (1.6) 515 (8.8) 43 (1.5) 529 (8.1) 19 (1.8) 559 (10.5)
Australia 12 (0.6) 480 (5.2) 24 (0.7) 523 (4.8) 51 (0.7) 541 (4.1) 13 (0.7) 563 (5.0)
Austria 16 (1.0) 517 (6.2) 26 (1.1) 529 (4.7) 41 (1.1) 548 (3.6) 17 (1.2) 558 (6.3)
Belgium (Fl) 11 (0.8) 520 (7.3) 21 (1.0) 558 (4.9) 49 (1.1) 566 (6.7) 18 (1.1) 602 (6.2)
Belgium (Fr) 11 (1.2) 489 (8.2) 19 (1.0) 514 (5.7) 48 (1.1) 529 (3.9) 22 (1.2) 557 (7.1)
Canada 10 (0.5) 498 (4.7) 16 (0.7) 521 (3.6) 54 (1.1) 527 (2.9) 20 (0.9) 553 (3.4)
Colombia 8 (0.6) 367 (6.9) 14 (1.1) 378 (3.9) 55 (1.3) 388 (3.1) 23 (1.4) 392 (6.6)
Cyprus 14 (0.9) 423 (3.5) 13 (0.5) 449 (4.3) 46 (1.0) 473 (2.7) 28 (1.0) 515 (3.4)
Czech Republic 14 (0.8) 533 (6.0) 36 (1.2) 550 (5.4) 41 (1.4) 578 (6.0) 8 (0.6) 606 (8.0)
Denmark 5 (0.6) 480 (7.9) 17 (1.1) 477 (4.3) 46 (1.2) 503 (4.0) 32 (1.5) 522 (3.9)
England 5 (0.5) 473 (8.5) 15 (1.0) 499 (6.5) 56 (1.2) 507 (3.2) 24 (1.1) 518 (4.6)
France 12 (1.0) 506 (5.7) 20 (1.1) 524 (4.6) 51 (1.3) 544 (3.3) 17 (1.0) 566 (5.5)
Germany 23 (1.2) 481 (4.8) 22 (1.1) 508 (6.8) 31 (1.1) 525 (5.0) 24 (1.1) 522 (5.7)
Greece 11 (0.6) 453 (5.0) 15 (0.6) 468 (4.3) 49 (1.0) 480 (3.4) 25 (1.0) 517 (3.6)
Hong Kong 12 (0.8) 545 (10.1) 23 (0.9) 569 (7.0) 48 (1.0) 598 (6.1) 17 (0.9) 629 (6.5)
Hungary 12 (0.8) 496 (7.4) 30 (1.2) 522 (4.3) 47 (1.1) 549 (3.8) 11 (0.7) 589 (6.1)
Iceland 6 (0.9) 447 (15.0) 15 (1.1) 480 (5.9) 56 (1.7) 488 (4.7) 23 (1.5) 503 (5.5)
Iran, Islamic Rep. 7 (0.6) 407 (5.2) 8 (0.7) 412 (5.2) 47 (1.5) 421 (2.8) 38 (1.5) 446 (2.8)
Ireland 9 (0.7) 492 (7.1) 18 (1.0) 520 (5.4) 53 (1.2) 531 (5.1) 21 (1.1) 549 (8.0)
Israel 10 (1.3) 513 (9.8) 24 (1.4) 523 (8.2) 45 (1.7) 522 (5.5) 21 (1.3) 536 (8.5)
Japan 11 (0.7) 550 (4.1) 36 (1.0) 585 (2.6) 43 (1.0) 625 (2.3) 10 (0.5) 649 (4.1)
Korea 6 (0.3) 536 (8.0) 36 (1.2) 569 (3.6) 44 (1.2) 628 (3.3) 14 (0.8) 676 (5.0)
Kuwait 8 (1.4) 371 (5.6) 8 (0.8) 391 (4.8) 40 (1.6) 391 (3.1) 44 (2.1) 398 (3.1)
Latvia (LSS) 7 (0.7) 469 (6.2) 26 (1.2) 475 (4.2) 56 (1.3) 499 (3.6) 11 (0.8) 536 (5.8)
Lithuania 12 (0.8) 457 (6.1) 35 (1.3) 463 (4.1) 44 (1.4) 488 (4.1) 9 (0.7) 519 (8.7)
Netherlands 13 (1.8) 494 (17.1) 30 (1.3) 535 (7.5) 50 (1.8) 554 (6.2) 8 (0.8) 567 (9.2)
New Zealand 9 (0.6) 475 (6.0) 19 (0.8) 500 (4.9) 51 (0.9) 508 (5.0) 21 (0.9) 533 (6.1)
Norway 11 (0.7) 454 (3.9) 26 (0.9) 485 (3.3) 47 (1.0) 514 (2.9) 16 (0.7) 540 (4.2)
Portugal 10 (0.7) 421 (3.8) 19 (1.0) 439 (3.4) 53 (1.0) 456 (2.5) 18 (1.1) 485 (4.0)
Romania 11 (0.7) 458 (7.3) 18 (0.7) 460 (5.4) 52 (1.0) 483 (4.1) 19 (1.0) 516 (5.6)
Russian Federation 5 (0.5) 499 (8.9) 22 (1.0) 510 (7.2) 58 (1.2) 540 (5.4) 15 (0.8) 574 (5.1)
Scotland 7 (0.6) 458 (6.4) 19 (0.9) 493 (5.3) 57 (1.0) 498 (6.0) 17 (1.0) 529 (9.8)
Singapore 4 (0.4) 583 (8.8) 14 (0.7) 613 (6.4) 54 (0.9) 642 (4.8) 28 (1.1) 671 (5.5)
Slovak Republic 15 (0.6) 496 (4.4) 25 (1.0) 526 (4.2) 49 (1.1) 559 (3.7) 11 (0.7) 613 (4.5)
Slovenia 11 (1.0) 511 (6.7) 23 (1.1) 519 (4.5) 52 (1.5) 540 (3.5) 14 (0.8) 606 (4.7)
Spain 13 (0.8) 459 (3.6) 24 (0.8) 473 (3.0) 45 (0.9) 491 (2.5) 18 (0.8) 516 (3.6)
Sweden 11 (0.7) 479 (4.9) 29 (1.0) 510 (3.2) 48 (1.1) 526 (3.3) 13 (0.7) 547 (5.1)
Switzerland 10 (0.7) 508 (7.0) 22 (1.1) 543 (4.1) 48 (0.9) 549 (3.2) 20 (0.8) 563 (4.6)
Thailand 3 (0.4) 502 (11.7) 15 (1.1) 503 (5.8) 59 (1.3) 519 (5.5) 23 (1.5) 548 (7.9)*Eighth grade in most countries; see Table 2 for more information about the grades tested in each country.( ) Standard errors appear in parentheses. Because results are rounded to the nearest whole number, some totals may appear inconsistent.Countries shown in italics did not satisfy one or more guidelines for sample participation rates or student sampling (see Figure 1). Background data for Bulgaria and South Africa not available.
SO
UR
CE
: IE
A T
hird
Inte
rnat
iona
l Mat
hem
atic
s an
d S
cien
ce S
tudy
(T
IMS
S),
199
4-95
. Mis
sour
i and
Ore
gon
data
col
lect
ed in
197
7.
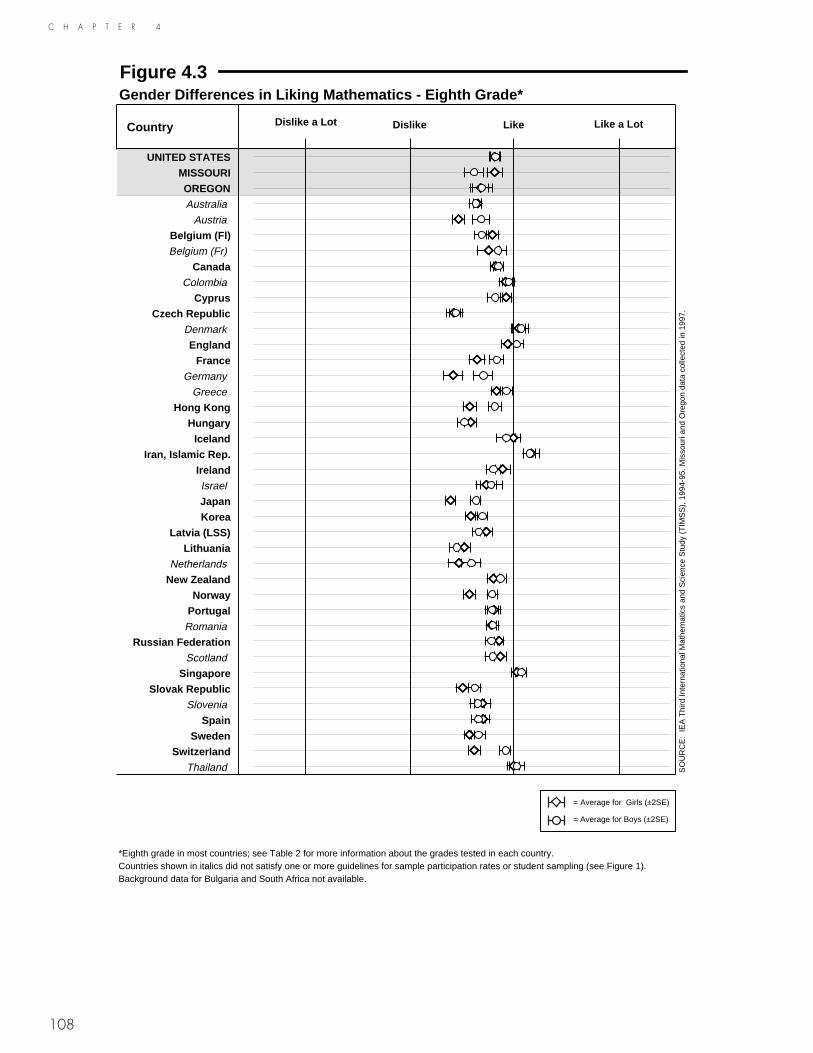
108
C H A P T E R 4
Figure 4.3Gender Differences in Liking Mathematics - Eighth Grade*
Country
UNITED STATES MISSOURI OREGON Australia
Austria
Belgium (Fl) Belgium (Fr)
Canada Colombia
Cyprus Czech Republic
Denmark
England France
Germany
Greece
Hong Kong Hungary
Iceland Iran, Islamic Rep.
Ireland Israel
Japan Korea
Latvia (LSS) Lithuania
Netherlands
New Zealand Norway
Portugal Romania
Russian Federation Scotland
Singapore Slovak Republic
Slovenia
Spain Sweden
Switzerland Thailand
*Eighth grade in most countries; see Table 2 for more information about the grades tested in each country.Countries shown in italics did not satisfy one or more guidelines for sample participation rates or student sampling (see Figure 1).Background data for Bulgaria and South Africa not available.
Like a LotLikeDislikeDislike a Lot
SO
UR
CE
: IE
A T
hird
Inte
rnat
iona
l Mat
hem
atic
s an
d S
cien
ce S
tudy
(T
IMS
S),
199
4-95
. Mis
sour
i and
Ore
gon
data
col
lect
ed in
199
7.
= Average for Girls (±2SE)
= Average for Boys (±2SE)

C H A P T E R 4
109
The data for the index in Table 4.16 reveal that eighth-grade students in Missouri and Oregon generally had positive attitudes towards mathematics, and that those students with more positive attitudes had higher average mathematics achievement. These findings are consistent with the results for the TIMSS countries. On average, across the five questions comprising the mathematics attitude index, the majority of students in each TIMSS country expressed positive or strongly positive attitudes about mathe-matics. Very few students (usually only 2% to 3%) consistently had strongly negative opinions about all aspects of the subject. Since these results seem slightly more sup-portive than students’ liking of the subject alone, it may be that students understand the utility of mathematics to a greater extent than they actually like doing it.
Gender differences for the index of overall attitudes are portrayed in Figure 4.4. In many countries, girls and boys reported similar overall attitudes about mathematics, and this was true in the United States as it was in Oregon. Once again, even though girls in Missouri had significantly more positive attitudes towards mathematics than did boys, this was not a finding in any of the TIMSS countries. The countries where boys’ attitudes were significantly more positive than those of girls included Austria, England, France, Germany, Greece, Hong Kong, Japan, the Netherlands, Norway, Sweden, and Switzerland. Interestingly, the index of overall attitudes towards mathe-matics showed gender differences in a somewhat different set of countries than the single question about liking mathematics. For the countries showing a gender dif-ference on the attitudes index but not on the liking question, it is possible that boys more than girls perceive the relevance of mathematics.

110
C H A P T E R 4
Table 4.16Students' Overall Attitudes 1 Towards Mathematics - Eighth Grade*
Strongly Negative Negative Positive Strongly Positive
Country Percent of Students
Mean Achieve-
ment
Percent of Students
Mean Achieve-
ment
Percent of Students
Mean Achieve-
ment
Percent of Students
Mean Achieve-
ment
UNITED STATES 4 (0.3) 481 (7.5) 26 (0.9) 483 (5.0) 55 (1.0) 503 (4.8) 15 (0.7) 526 (6.8)
MISSOURI 5 (0.7) 477 (11.5) 28 (1.4) 490 (7.6) 55 (1.3) 508 (7.1) 12 (1.1) 539 (10.1)
OREGON 4 (0.6) 488 (12.8) 31 (2.0) 507 (9.0) 51 (1.5) 529 (8.1) 13 (1.4) 570 (11.7)
Australia 4 (0.3) 492 (8.3) 32 (0.9) 514 (4.5) 55 (0.8) 540 (4.3) 9 (0.6) 561 (5.9)
Austria 4 (0.5) 527 (11.1) 38 (1.1) 532 (4.1) 47 (0.9) 542 (3.5) 12 (0.9) 560 (7.4)
Belgium (Fl) 4 (0.5) 535 (10.7) 33 (1.1) 547 (5.2) 52 (1.2) 572 (6.4) 11 (0.9) 604 (8.8)
Belgium (Fr) 3 (0.5) 507 (10.0) 28 (1.3) 514 (5.4) 53 (1.4) 526 (4.0) 15 (0.9) 558 (5.4)
Canada 3 (0.3) 510 (9.1) 23 (0.8) 512 (3.5) 58 (0.7) 528 (2.7) 16 (0.7) 554 (3.3)
Colombia 1 (0.5) ~ ~ 11 (1.2) 387 (8.2) 61 (1.5) 385 (3.7) 26 (1.2) 387 (5.9)
Cyprus 2 (0.4) ~ ~ 19 (1.1) 435 (3.3) 53 (0.9) 471 (2.6) 26 (1.0) 513 (3.8)
Czech Republic 3 (0.3) 543 (10.4) 39 (1.4) 544 (6.1) 52 (1.4) 574 (5.6) 6 (0.6) 613 (10.1)
Denmark 1 (0.2) ~ ~ 16 (1.1) 479 (4.8) 57 (1.3) 502 (3.5) 26 (1.4) 523 (4.7)
England 1 (0.3) ~ ~ 17 (1.0) 497 (5.9) 64 (1.1) 509 (3.0) 18 (1.0) 514 (6.0)
France 3 (0.5) 520 (7.7) 27 (1.5) 518 (4.5) 54 (1.1) 543 (3.2) 16 (1.0) 564 (5.7)
Germany 5 (0.5) 498 (8.0) 38 (1.4) 498 (5.2) 43 (1.1) 518 (5.3) 13 (0.8) 521 (6.3)
Greece 2 (0.3) ~ ~ 21 (0.8) 467 (3.9) 57 (0.9) 482 (3.7) 20 (0.8) 512 (3.7)
Hong Kong 3 (0.4) 530 (16.4) 31 (1.0) 561 (7.8) 57 (1.1) 601 (6.1) 9 (0.6) 640 (6.6)
Hungary 2 (0.3) ~ ~ 38 (1.2) 518 (4.1) 53 (1.3) 547 (3.7) 7 (0.6) 592 (7.2)
Iceland 2 (0.5) ~ ~ 24 (1.6) 478 (5.5) 59 (1.5) 489 (4.9) 14 (1.2) 499 (6.5)
Iran, Islamic Rep. 2 (0.3) ~ ~ 15 (1.2) 409 (3.1) 54 (1.6) 426 (2.7) 30 (1.3) 446 (2.9)
Ireland 2 (0.3) ~ ~ 26 (1.1) 515 (5.3) 59 (1.2) 530 (5.3) 13 (0.9) 551 (8.1)
Israel 2 (0.5) ~ ~ 25 (1.9) 523 (7.9) 56 (1.7) 524 (6.4) 17 (1.4) 527 (8.8)
Japan 4 (0.4) 558 (7.1) 44 (1.2) 592 (2.7) 48 (1.3) 619 (2.0) 3 (0.2) 649 (8.7)
Korea 2 (0.2) ~ ~ 48 (1.1) 581 (3.0) 46 (1.1) 630 (3.4) 5 (0.4) 680 (9.9)
Kuwait 3 (0.6) 372 (6.9) 15 (1.6) 385 (4.4) 48 (1.7) 390 (3.3) 34 (1.9) 400 (2.6)
Latvia (LSS) 1 (0.2) ~ ~ 28 (1.3) 478 (4.1) 62 (1.3) 496 (3.7) 8 (0.7) 526 (5.9)
Lithuania 2 (0.4) ~ ~ 38 (1.3) 467 (3.9) 53 (1.4) 480 (4.1) 7 (0.6) 513 (9.3)
Netherlands 4 (0.5) 506 (14.7) 40 (1.9) 526 (9.1) 50 (1.8) 554 (6.2) 6 (0.8) 570 (10.6)
New Zealand 2 (0.3) ~ ~ 23 (0.9) 491 (4.4) 60 (0.9) 511 (5.0) 15 (0.8) 530 (6.4)
Norway 3 (0.3) 456 (8.3) 30 (0.9) 481 (2.9) 55 (0.8) 511 (2.7) 12 (0.7) 538 (4.6)
Portugal 2 (0.3) ~ ~ 24 (1.2) 436 (3.0) 58 (1.0) 456 (2.5) 16 (1.1) 480 (3.9)
Romania 1 (0.1) ~ ~ 25 (1.0) 465 (5.7) 60 (1.0) 480 (4.2) 15 (0.9) 520 (6.2)
Russian Federation 1 (0.2) ~ ~ 24 (1.1) 512 (5.4) 63 (1.2) 538 (6.1) 12 (0.8) 570 (5.5)
Scotland 7 (0.6) 458 (6.4) 19 (0.9) 493 (5.3) 57 (1.0) 498 (6.0) 17 (1.0) 529 (9.8)
Singapore 1 (0.2) ~ ~ 16 (0.8) 609 (6.2) 62 (0.9) 646 (4.9) 20 (1.0) 666 (5.7)
Slovak Republic 1 (0.3) ~ ~ 30 (1.0) 516 (3.7) 60 (1.0) 556 (3.7) 9 (0.6) 601 (5.4)
Slovenia 3 (0.4) 535 (11.2) 33 (1.3) 519 (3.7) 57 (1.4) 546 (3.5) 8 (0.7) 601 (6.8)
Spain 3 (0.4) 459 (5.9) 33 (1.0) 474 (2.8) 52 (1.0) 491 (2.2) 13 (0.8) 513 (4.3)
Sweden 2 (0.3) ~ ~ 33 (1.1) 503 (3.3) 55 (0.9) 523 (3.2) 10 (0.7) 553 (5.0)
Switzerland 3 (0.3) 532 (9.2) 28 (1.1) 540 (4.1) 53 (1.2) 549 (3.0) 16 (0.6) 554 (5.5)
Thailand 0 (0.1) ~ ~ 12 (1.1) 503 (7.3) 72 (1.0) 520 (5.3) 16 (1.2) 551 (9.1)1Index of overall attitudes towards mathematics is based on average of responses to the following statements: 1) I would like a job that involved using mathematics; 2) Mathematics is important to everyone's life; 3) Mathematics is boring (reversed scale); 4) I enjoy learning mathematics; 5) I like mathematics. *Eighth grade in most countries; see Table 2 for more information about the grades tested in each country.( ) Standard errors appear in parentheses. Because results are rounded to the nearest whole number, some totals may appear inconsistent.Countries shown in italics did not satisfy one or more guidelines for sample participation rates or student sampling (see Figure 1). Background data for Bulgaria and South Africa not available.A tilde (~) indicates insufficient data to report achievement.
SO
UR
CE
: IE
A T
hird
Inte
rnat
iona
l Mat
hem
atic
s an
d S
cien
ce S
tudy
(T
IMS
S),
199
4-95
. Mis
sour
i and
Ore
gon
data
col
lect
ed in
199
7.

111
C H A P T E R 4
Figure 4.4Gender Differences in Students' Overall Attitudes 1 Towards MathematicsEighth Grade*
Country
UNITED STATES MISSOURI OREGON Australia
Austria
Belgium (Fl) Belgium (Fr)
Canada Colombia
Cyprus Czech Republic
Denmark
England France
Germany
Greece
Hong Kong Hungary
Iceland Iran, Islamic Rep.
Ireland Israel
Japan Korea
Latvia (LSS) Lithuania
Netherlands
New Zealand Norway
Portugal Romania
Russian Federation Scotland
Singapore Slovak Republic
Slovenia
Spain Sweden
Switzerland Thailand
1Index of overall attitudes towards mathematics is based on average of responses to the following statements: 1) I would like a job that involved using mathematics; 2) Mathematics is important to everyone's life; 3) Mathematics is boring (reversed scale); 4) I enjoy learning mathematics; 5) I like mathematics. *Eighth grade in most countries; see Table 2 for more information about the grades tested in each country.Countries shown in italics did not satisfy one or more guidelines for sample participation rates or student sampling (see Figure 1).Background data for Bulgaria and South Africa not available.
Strongly PositivePositiveNegative
Strongly Negative
SO
UR
CE
: IE
A T
hird
Inte
rnat
iona
l Mat
hem
atic
s an
d S
cien
ce S
tudy
(T
IMS
S),
199
4-95
. Mis
sour
i and
Ore
gon
data
col
lect
ed in
199
7.
= Average for Girls (±2SE)
= Average for Boys (±2SE)

112

C H A P T E R 5
113
Chapter 5TEACHERS AND MATHEMATICS INSTRUCTION
Teachers and the instructional approaches they use are fundamental in building stu-dents’ mathematical understanding. Primary among their many duties and responsibil-ities, teachers structure and guide the pace of individual, small-group, and whole-class work to present new material, engage students in mathematical tasks, and help deepen students’ grasp of the mathematics being studied. Teachers may help students use technology and tools to investigate mathematical ideas, analyze students’ work for misconceptions, and promote positive attitudes about mathematics. They also may assign homework and conduct informal as well as formal assessments to monitor progress in student learning, make ongoing instructional decisions, and evaluate achievement outcomes.
Effective teaching is a complex endeavor requiring knowledge about the subject matter of mathematics, understanding of the ways in which students learn, and the ability to use successful pedagogical approaches. It can be fostered through institu-tional support and adequate resources. Teachers also can support each other in planning instructional strategies, devising real-world applications of mathematical concepts, and developing sequences that move students from concrete tasks to the ability to think for themselves and explore mathematical theories.
TIMSS administered a background questionnaire to teachers to gather information about their backgrounds, training, and how they think about mathematics. The ques-tionnaire also asked about how they spend their time related to their teaching tasks and the instructional approaches they use in their classrooms. Information was collected about the materials used in instruction, the activities students do in class, the use of calculators and computers in mathematics lessons, the role of homework, and the reliance on different types of assessment approaches.
This chapter presents the results of teachers’ responses to some of these questions. Because the sampling for the teacher questionnaires was based on participating stu-dents, the responses to the mathematics teacher questionnaire do not necessarily rep-resent all of the eighth-grade mathematics teachers for each of the TIMSS partici-pants. Rather, they represent teachers of the representative samples of students assessed. It is important to note that in this report, the student is always the unit of analysis, even when information from the teachers’ questionnaires is being reported. Using the student as the unit of analysis makes it possible to describe the instruction received by representative samples of students. Although this approach may provide a different perspective from that obtained by simply collecting information from teachers, it is consistent with the TIMSS goals of providing information about the edu-cational contexts and performance of students.
The tables in this chapter contain special notations regarding the availability of teacher responses. For a country where teacher responses are available for 70% to 84% of the students, an “r” is included next to the data for that country. When teacher responses

114
C H A P T E R 5
are available for 50% to 69% of the students, an “s” is included next to the data for that country. When teacher responses are available for less than 50% of the students, an “x” replaces the data.
Who Delivers Mathematics Instruction?This section provides information about the mathematics teaching force for each of the TIMSS participants, in terms of certification, degrees, age, gender, and years of teaching experience.
Table 5.1 contains teachers’ reports on their age and gender. In many countries, the overwhelming majority of students were taught by teachers in their 30s and 40s and this pattern prevailed in Missouri (74% of the students). In the United States, 63% of the students were taught by teachers in their 30s and 40s, and 19% by teachers 50 years or older. As in a number of TIMSS countries, the teaching force in Oregon was comparatively older, with 71% of the students having mathematics teachers in their 40s or older. The TIMSS participants where 70% or more of the eighth-grade students had mathematics teachers in their 40s or older included the Czech Republic, Denmark, France, Germany, Norway, Romania, the Slovak Republic, and Spain. Very few coun-tries seemed to have a comparatively younger teaching force.
In about one-fourth of the TIMSS countries, approximately equivalent percentages of eighth-grade students were taught mathematics by male teachers and female teachers (Table 5.1). However, in Missouri two-thirds of the students had female teachers, a finding which mirrors the results for the United States as well as a number of other TIMSS countries. At least 70% of the eighth-grade students had female mathematics teachers in the Czech Republic, Hungary, Israel, Latvia (LSS), Lithuania, the Russian Federation, the Slovak Republic, and Slovenia. In Oregon, more of the students (60%) had male mathematics teachers than female teachers. This pattern of at least 60% of students having male mathematics teachers was found in the Scandinavian countries as well as in Canada, Colombia, Germany, Greece, Hong Kong, Iceland, Iran, Japan, the Netherlands, Spain, and Switzerland.
As might be expected from the differences in teachers’ ages from country to country, the TIMSS data indicate differences in teachers’ experience across countries (see Table 5.2). Those countries with younger teaching forces tended to have more students taught by less experienced teachers. At least half the eighth-grade students had math-ematics teachers with 10 years or less of experience in Hong Kong, Iran, Korea, Kuwait, Portugal, and Thailand. In contrast, at least half the students had mathematics teachers with more than 20 years of experience in Belgium (French), the Czech Republic, France, Romania, the Slovak Republic, and Spain. Both Missouri and Oregon fell between these two extremes as did the United States. However, consistent with the differences in teachers’ ages, the teachers in Oregon were somewhat more experienced than those in the United States as a whole (68% compared to 61% of the students were taught mathematics by teachers with 11 or more years of experience). In Missouri, 58% of the students were taught by teachers with 11 or more years of experience.

115
C H A P T E R 5
Table 5.1Teachers' Reports on Their Age and Gender - Mathematics - Eighth Grade*
Percent of Students Taught by Teachers Percent of Students Taught by Teachers
Country29 Years or
Under 30 - 39 Years 40 - 49 Years 50 Years or Older Female Male
UNITED STATES 17 (3.0) 19 (3.2) 44 (4.4) 19 (2.9) 65 (4.0) 35 (4.0)
MISSOURI 14 (2.0) 28 (5.2) 46 (5.0) 11 (2.1) 67 (4.9) 33 (4.9)
OREGON 13 (1.3) 17 (2.6) 54 (4.1) 17 (3.3) 40 (3.8) 60 (3.8)
Australia 22 (2.6) 27 (3.2) 41 (3.3) 10 (1.9) 44 (3.3) 56 (3.3)
Austria r 9 (2.6) 38 (3.8) 42 (4.6) 10 (2.7) r 48 (4.4) 52 (4.4)
Belgium (Fl) 13 (3.1) 28 (4.2) 30 (4.2) 29 (4.9) 66 (4.3) 34 (4.3)
Belgium (Fr) s 5 (2.3) 26 (5.0) 46 (6.0) 23 (5.1) s 51 (5.5) 49 (5.5)
Canada 15 (2.4) 21 (3.1) 39 (3.9) 26 (3.2) 38 (4.3) 62 (4.3)
Colombia 23 (4.4) 25 (4.1) 40 (4.5) 12 (2.9) 34 (4.2) 66 (4.2)
Cyprus 0 (0.0) 38 (4.7) 47 (5.2) 15 (3.5) r 61 (5.6) 39 (5.6)
Czech Republic 8 (2.4) 20 (3.6) 41 (4.7) 31 (4.8) 82 (3.2) 18 (3.2)
Denmark 2 (1.4) 22 (4.0) 52 (4.7) 24 (4.0) 35 (4.5) 65 (4.5)
England s 17 (2.5) 23 (3.1) 43 (2.8) 17 (2.4) s 45 (3.6) 55 (3.6)
France 11 (2.7) 17 (3.7) 48 (5.0) 24 (3.8) 43 (4.5) 57 (4.5)
Germany s 0 (0.0) 13 (3.5) 36 (5.2) 51 (5.3) s 33 (4.9) 67 (4.9)
Greece 0 (0.4) 33 (4.4) 54 (4.2) 12 (4.2) 30 (3.8) 70 (3.8)
Hong Kong 48 (6.1) 29 (5.1) 11 (3.7) 12 (3.8) 40 (5.2) 60 (5.2)
Hungary 10 (2.5) 31 (4.4) 42 (4.4) 18 (3.1) 87 (3.1) 13 (3.1)
Iceland r 12 (4.9) 39 (7.0) 29 (6.0) 20 (6.9) r 39 (5.6) 61 (5.6)
Iran, Islamic Rep. 44 (4.8) 36 (5.1) 17 (3.0) 2 (1.6) 37 (4.8) 63 (4.8)
Ireland 17 (3.6) 34 (4.3) 35 (4.1) 14 (3.1) 57 (4.0) 43 (4.0)
Israel r 12 (4.8) 27 (7.3) 41 (7.8) 20 (6.3) r 95 (2.4) 5 (2.4)
Japan 22 (3.2) 43 (3.7) 25 (3.5) 10 (2.5) 28 (3.8) 72 (3.8)
Korea 26 (3.7) 43 (4.4) 12 (3.2) 19 (3.0) 45 (3.9) 55 (3.9)
Kuwait 40 (4.1) 40 (4.0) 16 (3.5) 3 (2.8) 51 (1.9) 49 (1.9)
Latvia (LSS) 15 (3.5) 41 (5.1) 20 (3.8) 24 (4.2) 90 (2.8) 10 (2.8)
Lithuania 8 (2.3) 36 (4.1) 22 (3.5) 34 (4.4) 87 (2.6) 13 (2.6)
Netherlands 6 (2.5) 33 (5.2) 50 (5.2) 11 (2.9) 22 (4.1) 78 (4.1)
New Zealand 12 (2.5) 38 (4.2) 35 (3.8) 15 (3.3) 42 (4.1) 58 (4.1)
Norway 7 (2.1) 23 (3.8) 39 (4.1) 31 (3.5) 32 (3.9) 68 (3.9)
Portugal 45 (4.5) 35 (4.1) 14 (2.2) 6 (2.2) 68 (3.8) 32 (3.8)
Romania 11 (2.4) 18 (3.1) 41 (4.3) 30 (4.0) 64 (4.0) 36 (4.0)
Russian Federation 18 (3.6) 29 (3.3) 33 (3.1) 21 (3.2) 97 (1.2) 3 (1.2)
Scotland 14 (3.3) 28 (4.4) 40 (4.9) 18 (3.2) 45 (4.6) 55 (4.6)
Singapore 26 (4.1) 18 (3.2) 33 (4.6) 23 (3.8) 60 (4.5) 40 (4.5)
Slovak Republic 7 (2.0) 22 (3.6) 50 (4.7) 22 (3.7) 79 (3.9) 21 (3.9)
Slovenia r 9 (3.0) 59 (4.9) 22 (4.4) 10 (2.5) r 87 (3.6) 13 (3.6)
Spain 0 (0.4) 24 (3.6) 48 (4.3) 28 (3.7) 37 (4.1) 63 (4.1)
Sweden 10 (2.2) 22 (3.5) 27 (3.2) 41 (4.3) 33 (3.3) 67 (3.3)
Switzerland 10 (3.5) 27 (3.9) 37 (4.4) 25 (3.9) 13 (2.3) 87 (2.3)
Thailand r 25 (5.0) 43 (6.2) 29 (6.2) 3 (2.3) r 61 (6.2) 39 (6.2)*Eighth grade in most countries; see Table 2 for more information about the grades tested in each country.Countries shown in italics did not satisfy one or more guidelines for sample participation rates or student sampling (see Figure 1). Background data for Bulgaria and South Africa not available.( ) Standard errors appear in parentheses. Because results are rounded to the nearest whole number, some totals may appear inconsistent. An "r" indicates teacher response data available for 70-84% of students. An "s" indicates teacher response data available for 50-69% of students.
SO
UR
CE
: IE
A T
hird
Inte
rnat
iona
l Mat
hem
atic
s an
d S
cien
ce S
tudy
(T
IMS
S),
199
4-95
. Mis
sour
i and
Ore
gon
data
col
lect
ed in
199
7.

116
C H A P T E R 5
Table 5.2Teachers' Reports on Their Years of Teaching Experience - Mathematics - Eighth Grade*
0-5 Years 6-10 Years 11-20 Years More than 20 Years
CountryPercent of Students
Mean Achieve-
mentPercent of Students
Mean Achieve-
mentPercent of Students
Mean Achieve-
mentPercent of Students
Mean Achieve-
ment
UNITED STATES 25 (3.4) 484 (6.3) 14 (2.7) 488 (9.8) 25 (3.2) 501 (7.3) 36 (3.3) 513 (7.5)
MISSOURI 18 (3.2) 493 (10.1) 25 (5.3) 525 (9.9) 27 (4.1) 499 (8.1) 31 (3.9) 504 (3.8)
OREGON 17 (1.9) 520 (6.0) 15 (2.9) 476 (7.1) 36 (3.7) 535 (9.6) 32 (3.6) 539 (8.5)
Australia 18 (2.3) 517 (8.5) 19 (2.6) 528 (11.6) 35 (2.8) 540 (8.5) 28 (2.6) 533 (8.5)
Austria r 7 (2.3) 516 (19.7) 13 (2.5) 546 (9.5) 51 (4.0) 554 (6.7) 28 (3.6) 549 (8.8)
Belgium (Fl) 10 (2.8) 556 (17.9) 9 (2.2) 590 (14.5) 32 (4.8) 554 (13.4) 49 (4.9) 575 (10.6)
Belgium (Fr) s 8 (3.2) 536 (12.3) 8 (2.3) 528 (13.8) 31 (5.2) 558 (7.0) 54 (4.8) 543 (6.4)
Canada 17 (2.6) 527 (6.7) 15 (2.9) 527 (5.0) 22 (3.6) 526 (7.6) 46 (3.8) 528 (3.8)
Colombia 18 (3.0) 409 (7.7) 22 (5.0) 375 (11.7) 27 (4.3) 385 (6.0) 33 (4.2) 385 (5.0)
Cyprus r 30 (4.6) 474 (4.6) 19 (4.3) 474 (7.6) 25 (5.0) 467 (6.4) 26 (4.7) 471 (5.5)
Czech Republic 12 (3.1) 566 (17.7) 9 (1.9) 538 (8.6) 17 (4.1) 584 (11.4) 62 (4.7) 562 (5.7)
Denmark 4 (1.9) 487 (2.6) 4 (2.0) 493 (14.4) 47 (4.9) 504 (3.3) 45 (4.8) 508 (4.4)
England s 19 (2.5) 522 (10.8) 11 (2.1) 518 (13.5) 39 (3.5) 512 (8.1) 31 (3.0) 515 (11.3)
France 11 (2.5) 539 (8.1) 11 (3.1) 529 (10.2) 26 (4.6) 540 (8.8) 52 (4.3) 538 (5.4)
Germany s 10 (2.2) 534 (14.5) 14 (4.3) 471 (12.1) 32 (5.1) 521 (10.6) 44 (5.5) 516 (9.3)
Greece 16 (3.1) 464 (7.2) 20 (3.4) 469 (5.3) 47 (4.3) 490 (3.5) 17 (4.4) 503 (12.0)
Hong Kong 53 (5.9) 585 (9.7) 14 (3.3) 606 (16.3) 18 (4.2) 574 (19.2) 15 (3.9) 596 (19.8)
Hungary 13 (2.9) 530 (12.7) 10 (2.8) 510 (7.4) 38 (4.1) 537 (5.6) 38 (4.1) 547 (5.2)
Iceland r 19 (5.1) 478 (5.3) 14 (3.8) 480 (8.5) 33 (7.1) 492 (7.3) 35 (7.7) 496 (10.6)
Iran, Islamic Rep. 38 (4.5) 417 (3.7) 24 (4.8) 437 (3.8) 24 (4.3) 433 (3.2) 14 (3.0) 440 (4.8)
Ireland 13 (3.0) 513 (16.3) 17 (3.5) 507 (12.6) 42 (4.6) 535 (8.4) 28 (4.5) 523 (10.0)
Israel r 16 (6.1) 490 (9.1) 12 (4.3) 555 (15.9) 45 (7.4) 510 (8.3) 27 (7.4) 548 (13.7)
Japan 19 (3.3) 606 (5.0) 25 (3.5) 607 (4.3) 36 (3.8) 598 (3.5) 19 (2.9) 614 (4.0)
Korea 28 (3.5) 610 (4.7) 29 (3.9) 622 (5.6) 23 (3.7) 597 (5.6) 20 (3.1) 606 (5.5)
Kuwait r 30 (6.3) 397 (2.5) 33 (7.9) 388 (3.0) 31 (7.3) 388 (4.8) 6 (4.0) 418 (8.5)
Latvia (LSS) 12 (3.4) 496 (7.0) 16 (3.4) 482 (8.8) 38 (5.0) 496 (5.5) 34 (5.1) 490 (5.8)
Lithuania r 5 (1.8) 455 (9.2) 15 (3.3) 465 (11.0) 33 (4.2) 482 (8.4) 47 (4.3) 481 (5.2)
Netherlands 13 (3.6) 530 (19.5) 21 (3.6) 525 (10.2) 42 (5.3) 548 (17.8) 24 (4.0) 556 (9.3)
New Zealand 17 (3.1) 497 (7.5) 28 (4.0) 515 (7.9) 34 (4.1) 517 (9.2) 20 (3.4) 487 (9.4)
Norway 12 (2.7) 499 (10.7) 10 (2.5) 500 (6.1) 35 (4.0) 508 (4.0) 43 (4.6) 503 (3.4)
Portugal 51 (4.7) 449 (3.0) 16 (3.1) 447 (5.4) 27 (3.9) 462 (4.3) 6 (2.3) 477 (8.6)
Romania 10 (2.3) 452 (14.2) 15 (3.1) 466 (9.9) 14 (3.1) 496 (12.8) 61 (4.2) 486 (5.7)
Russian Federation 16 (3.7) 541 (25.2) 14 (2.5) 532 (9.7) 29 (4.0) 526 (7.1) 41 (5.0) 538 (6.6)
Scotland 17 (3.4) 483 (9.2) 12 (3.2) 484 (14.3) 42 (4.4) 496 (8.5) 29 (4.3) 507 (12.3)
Singapore 30 (4.5) 617 (9.4) 11 (2.8) 658 (14.0) 11 (3.0) 664 (13.4) 48 (4.6) 652 (7.0)
Slovak Republic 6 (1.9) 556 (13.3) 15 (3.3) 531 (8.5) 21 (3.5) 539 (8.2) 58 (4.5) 553 (4.6)
Slovenia r 4 (1.9) 537 (23.2) 19 (4.0) 533 (6.0) 55 (5.0) 542 (5.5) 22 (3.8) 550 (6.2)
Spain 3 (0.8) 472 (17.7) 8 (2.4) 486 (7.6) 39 (4.3) 488 (3.8) 50 (4.3) 488 (3.1)
Sweden 16 (2.4) 529 (7.1) 15 (2.8) 512 (9.5) 26 (3.1) 518 (6.2) 44 (4.1) 520 (4.4)
Switzerland 14 (3.3) 540 (10.1) 6 (1.8) 545 (19.0) 37 (4.6) 549 (8.4) 42 (4.9) 548 (7.4)
Thailand s 48 (6.6) 517 (9.0) 11 (2.6) 499 (9.4) 35 (6.2) 540 (11.0) 5 (3.4) 615 (17.7)*Eighth grade in most countries; see Table 2 for more information about the grades tested in each country.Countries shown in italics did not satisfy one or more guidelines for sample participation rates or student sampling (see Figure 1). Background data for Bulgaria and South Africa not available.( ) Standard errors appear in parentheses. Because results are rounded to the nearest whole number, some totals may appear inconsistent. An "r" indicates teacher response data available for 70-84% of students. An "s" indicates teacher response data available for 50-69% of students.
SO
UR
CE
: IE
A T
hird
Inte
rnat
iona
l Mat
hem
atic
s an
d S
cien
ce S
tudy
(T
IMS
S),
199
4-95
. Mis
sour
i and
Ore
gon
data
col
lect
ed in
199
7.

C H A P T E R 5
117
The relationship between years of teaching experience and mathematics achievement was not consistent across countries. In about one-fourth of the countries, including the United States, the eighth-grade students with the most experienced teachers (more than 20 years) had higher mathematics achievement than did those with less experi-enced teachers (5 years or fewer). This may reflect the practice of giving teachers with more seniority the more advanced classes. Although the higher achieving students had more experienced teachers in Oregon, the results for Missouri were more similar to countries showing no clear pattern of performance differences in relation to years of teaching experience. In Missouri, there was little difference in students’ performance in relation to years of teaching experience.
What Are Teachers’ Perceptions About Mathematics?Figure 5.1 depicts the percentages of eighth-grade students whose mathematics teachers reported certain beliefs about mathematics and the way mathematics should be taught. Teachers in many countries indicated a fairly practical view of mathematics, seeing it essentially as a way of modeling the real world. However, there was variation across countries in the amount of agreement with this view of the nature of mathe-matics. In Thailand and Iran, nearly all students had teachers who agreed or strongly agreed that mathematics is primarily a formal way of representing the real world. In about a dozen countries including the United States, many students (about 80%) had teachers with this point of view, and the results in Missouri and Oregon were similar to those for the United States. However, several of the Central or Eastern European countries (Slovenia, the Russian Federation, the Czech Republic, and Hungary), were at the other end of the continuum with 40% or fewer of the students’ having mathe-matics teachers that agreed with this view.
There appeared to be nearly uniform agreement by teachers across countries about the inherent nature of mathematical abilities. In most countries, 80% or more of the stu-dents had teachers who agreed that some students have a natural talent for mathe-matics and others do not. Even though the United States and Missouri fit this general pattern, fewer students in Oregon (68%) had teachers agreeing with this statement.
Regarding perceptions about how to teach mathematics, teachers’ opinions varied across countries concerning whether or not more practice during class is an effective approach to help students having difficulty. As indicated in Figure 5.1, at least 80% of the eighth-grade students in the Czech Republic, Cyprus, Greece, Iran, the Slovak Republic, Thailand, Kuwait, Portugal, and Romania had teachers who agreed or strongly agreed with this approach. Conversely, fewer than 20% of the students in the Russian Federation and Norway had teachers who agreed with this approach. The results for Oregon were similar to those for the Russian Federation and Norway, and those for Missouri and the United States also were towards this end of the continuum of countries.
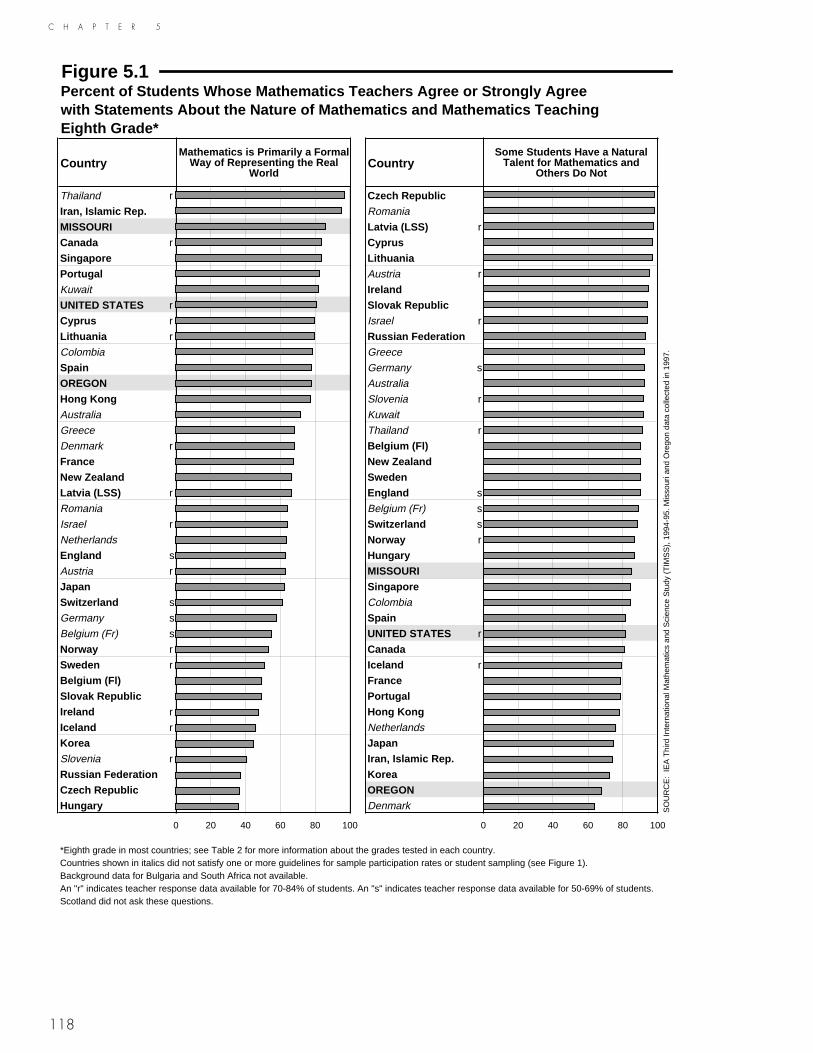
118
C H A P T E R 5
Figure 5.1Percent of Students Whose Mathematics Teachers Agree or Strongly Agreewith Statements About the Nature of Mathematics and Mathematics TeachingEighth Grade*
CountryMathematics is Primarily a Formal
Way of Representing the Real World
CountrySome Students Have a Natural
Talent for Mathematics and Others Do Not
Thailand r Czech RepublicIran, Islamic Rep. Romania
MISSOURI Latvia (LSS) r
Canada r CyprusSingapore LithuaniaPortugal Austria r
Kuwait IrelandUNITED STATES r Slovak RepublicCyprus r Israel r
Lithuania r Russian FederationColombia Greece
Spain Germany s
OREGON Australia
Hong Kong Slovenia r
Australia Kuwait
Greece Thailand r
Denmark r Belgium (Fl)France New ZealandNew Zealand SwedenLatvia (LSS) r England s
Romania Belgium (Fr) s
Israel r Switzerland s
Netherlands Norway r
England s HungaryAustria r MISSOURIJapan SingaporeSwitzerland s Colombia
Germany s SpainBelgium (Fr) s UNITED STATES r
Norway r CanadaSweden r Iceland r
Belgium (Fl) FranceSlovak Republic PortugalIreland r Hong KongIceland r Netherlands
Korea JapanSlovenia r Iran, Islamic Rep.Russian Federation KoreaCzech Republic OREGONHungary Denmark
*Eighth grade in most countries; see Table 2 for more information about the grades tested in each country.Countries shown in italics did not satisfy one or more guidelines for sample participation rates or student sampling (see Figure 1). Background data for Bulgaria and South Africa not available.An "r" indicates teacher response data available for 70-84% of students. An "s" indicates teacher response data available for 50-69% of students.Scotland did not ask these questions.
0 20 40 60 80 100 0 20 40 60 80 100
SO
UR
CE
: IE
A T
hird
Inte
rnat
iona
l Mat
hem
atic
s an
d S
cien
ce S
tudy
(T
IMS
S),
199
4-95
. Mis
sour
i and
Ore
gon
data
col
lect
ed in
199
7.

119
C H A P T E R 5
Figure 5.1 (Continued)Percent of Students Whose Mathematics Teachers Agree or Strongly Agreewith Statements About the Nature of Mathematics and Mathematics TeachingEighth Grade*
CountryIf Students Are Having Difficulty, an Effective Approach Is to Give
Them More Practice by Themselves During Class
CountryMore Than One Representation
(Picture, Concrete Materials, Symbol, etc.) Should Be Used in
Teaching a Mathematics Topic
Czech Republic OREGON
Cyprus FranceGreece MISSOURIIran, Islamic Rep. Russian FederationSlovak Republic SwedenThailand r Czech RepublicKuwait PortugalPortugal UNITED STATES r
Romania CanadaIreland r JapanHong Kong Norway r
Germany s Australia
Netherlands New ZealandSwitzerland s SpainAustria r Germany s
Israel r SingaporeBelgium (Fr) s Iran, Islamic Rep.Latvia (LSS) r Colombia
Colombia Hong KongSingapore Slovak RepublicBelgium (Fl) Switzerland s
Korea Slovenia r
England s England s
Iceland r Greece
Lithuania r KoreaCanada r Ireland r
New Zealand Romania
Spain Iceland r
Australia Netherlands
Sweden r Cyprus r
Denmark Austria r
Slovenia r Israel r
Japan Denmark
MISSOURI Latvia (LSS) r
France Kuwait
UNITED STATES r Belgium (Fr) s
OREGON Belgium (Fl)Russian Federation LithuaniaNorway r Hungary
Thailand r
*Eighth grade in most countries; see Table 2 for more information about the grades tested in each country.Countries shown in italics did not satisfy one or more guidelines for sample participation rates or student sampling (see Figure 1). Background data for Bulgaria and South Africa not available.An "r" indicates teacher response data available for 70-84% of students. An "s" indicates teacher response data available for 50-69% of students.Scotland did not ask these questions. Hungary did not ask teachers their opinions about the effectiveness of more individual practice.
0 20 40 60 80 100 0 20 40 60 80 100
SO
UR
CE
: IE
A T
hird
Inte
rnat
iona
l Mat
hem
atic
s an
d S
cien
ce S
tudy
(T
IMS
S),
199
4-95
. Mis
sour
i and
Ore
gon
data
col
lect
ed in
199
7.
120
C H A P T E R 5
There was nearly complete agreement by teachers across countries, however, that more than one representation should be used in teaching a mathematics topic (Figure 5.1). Oregon and Missouri joined the countries topping the list. In only Hungary and Thailand did fewer than 80% of the eighth-grade students have teachers that agreed with this approach. This instructional approach is particularly useful in helping stu-dents with different learning styles understand key ideas. Also, using data in different formats reinforces the idea of mathematics as a network of interconnected concepts and procedures.
TIMSS also queried teachers about the cognitive demands of mathematics, asking them to rate the importance of various skills for success in the discipline. Figure 5.2 shows the percentages of students whose teachers rated each of four different skills as very important. Across the participating countries, fewer students had teachers who felt the ability to remember formulas and procedures was very important compared to the other cognitive demands of which they were asked. There was a range, however, with teachers of approximately 70% of the eighth-grade students in Kuwait and Ireland rating this ability as very important compared to those of fewer than 20% of the students in Slovenia, Sweden, Korea, Austria, Portugal, Israel, Denmark, the Czech Republic, and Switzerland. The results for the United States and Missouri fell in the middle (approximately 40%), while somewhat fewer students in Oregon had teachers agreeing that memorization was important.

C H A P T E R 5
121
Internationally, there was considerable variation in teachers’ responses to the statement about the importance of thinking creatively, from nearly all of the students in Cyprus having teachers that agreed with this statement to only about 20% in France (Figure 5.2). Again, the United States and Missouri were mid range (about 60%), but here somewhat more students in Oregon had teachers agreeing with the statement. When teachers were asked about the importance of understanding how mathematics is used in the real world, Missouri topped the list of the TIMSS countries, and teachers in the United States as a whole were also in high agreement. About 80% of the stu-dents in the U.S. had mathematics teachers agreeing with this statement, and the cor-responding figure for Oregon was near 70%. Interestingly, fewer than 40% of the eighth-grade students in Israel, Austria, Belgium (Flemish), Switzerland, Ireland, England, and France had teachers who felt it was very important to think creatively, and fewer than 40% in Latvia (LSS), Korea, Thailand, Belgium (Flemish), Hong Kong, France, Israel, the Netherlands, Switzerland, and Ireland had teachers who felt it was very important to understand how mathematics is used in the real world. With the current calls from business and industry for helping students improve their ability to apply mathematics and solve practical problems in job-related situations, it might be rather surprising that teachers in these countries do not place more importance on these latter two aspects of mathematics.
In all countries except the Czech Republic, Switzerland, the Netherlands, and Austria, the majority of students had teachers who felt it was very important to be able to provide reasons to support mathematical solutions. The results for Oregon and Mis-souri were similar to those in nine countries including the United States, where 80% or more of the students had teachers that so agreed.
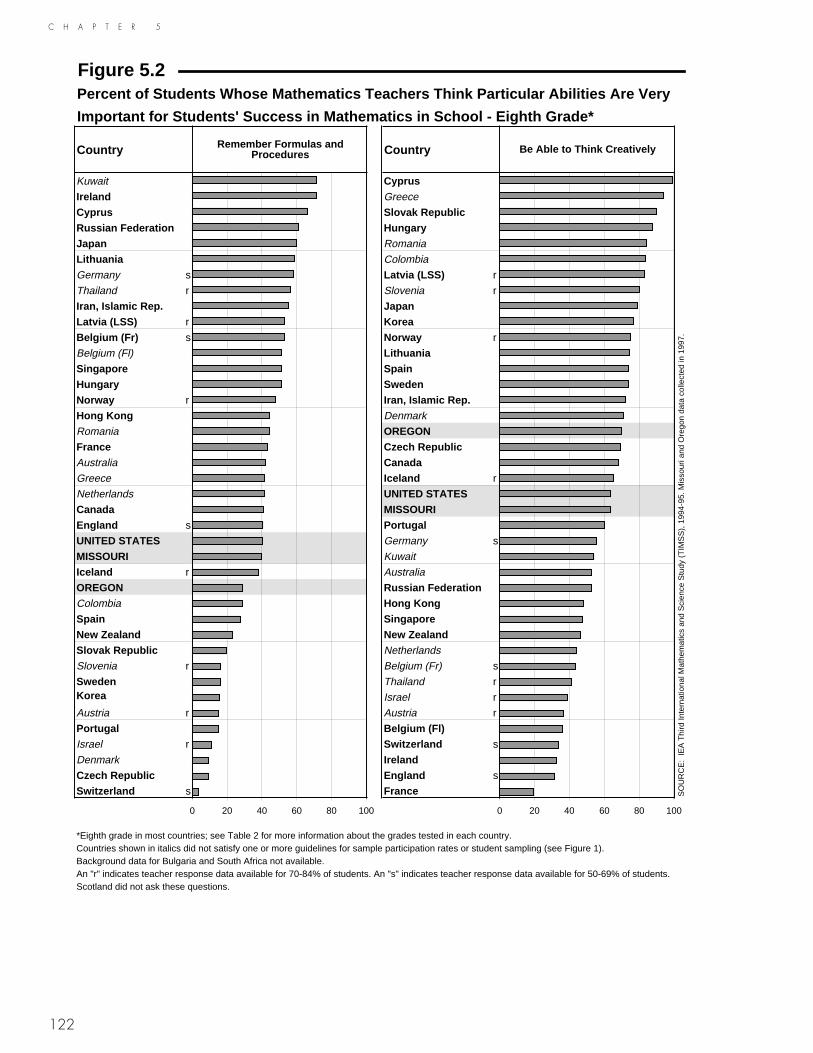
122
C H A P T E R 5
Figure 5.2Percent of Students Whose Mathematics Teachers Think Particular Abilities Are Very
Important for Students' Success in Mathematics in School - Eighth Grade*
Country Remember Formulas and Procedures Country Be Able to Think Creatively
Kuwait CyprusIreland Greece
Cyprus Slovak RepublicRussian Federation HungaryJapan Romania
Lithuania Colombia
Germany s Latvia (LSS) r
Thailand r Slovenia r
Iran, Islamic Rep. JapanLatvia (LSS) r KoreaBelgium (Fr) s Norway r
Belgium (Fl) LithuaniaSingapore SpainHungary SwedenNorway r Iran, Islamic Rep.Hong Kong Denmark
Romania OREGONFrance Czech RepublicAustralia CanadaGreece Iceland r
Netherlands UNITED STATESCanada MISSOURIEngland s PortugalUNITED STATES Germany s
MISSOURI Kuwait
Iceland r Australia
OREGON Russian FederationColombia Hong KongSpain SingaporeNew Zealand New ZealandSlovak Republic Netherlands
Slovenia r Belgium (Fr) s
Sweden Thailand rKorea Israel r
Austria r Austria r
Portugal Belgium (Fl)Israel r Switzerland s
Denmark IrelandCzech Republic England s
Switzerland s France
*Eighth grade in most countries; see Table 2 for more information about the grades tested in each country.Countries shown in italics did not satisfy one or more guidelines for sample participation rates or student sampling (see Figure 1). Background data for Bulgaria and South Africa not available.An "r" indicates teacher response data available for 70-84% of students. An "s" indicates teacher response data available for 50-69% of students.Scotland did not ask these questions.
0 20 40 60 80 100 0 20 40 60 80 100
SO
UR
CE
: IE
A T
hird
Inte
rnat
iona
l Mat
hem
atic
s an
d S
cien
ce S
tudy
(T
IMS
S),
199
4-95
. Mis
sour
i and
Ore
gon
data
col
lect
ed in
199
7.

123
C H A P T E R 5
Figure 5.2 (Continued)Percent of Students Whose Mathematics Teachers Think Particular Abilities Are Very
Important for Students' Success in Mathematics in School - Eighth Grade*
Country Understand How Mathematics Is Used in the Real World Country Be Able to Provide Reasons to
Support Their Conclusions
MISSOURI Greece
Greece CanadaCanada CyprusUNITED STATES SpainSpain Russian FederationIceland r OREGONHungary Iran, Islamic Rep.Cyprus r MISSOURIDenmark Iceland r
Romania Colombia
Lithuania UNITED STATESPortugal FranceNorway r Romania
OREGON Norway r
Slovak Republic Germany s
Colombia PortugalKuwait SingaporeSlovenia r Belgium (Fr) s
Sweden Australia
Iran, Islamic Rep. England s
New Zealand JapanGermany s SwedenAustralia Slovenia r
Belgium (Fr) s New ZealandCzech Republic LithuaniaJapan HungaryAustria r Belgium (Fl)Russian Federation Denmark
England s Slovak RepublicSingapore Thailand r
Latvia (LSS) r Israel r
Korea Latvia (LSS) r
Thailand r IrelandBelgium (Fl) KoreaHong Kong Hong KongFrance Kuwait
Israel r Czech RepublicNetherlands Switzerland s
Switzerland s Netherlands
Ireland Austria r
*Eighth grade in most countries; see Table 2 for more information about the grades tested in each country.Countries shown in italics did not satisfy one or more guidelines for sample participation rates or student sampling (see Figure 1). Background data for Bulgaria and South Africa not available.An "r" indicates teacher response data available for 70-84% of students. An "s" indicates teacher response data available for 50-69% of students.Scotland did not ask these questions.
0 20 40 60 80 100 0 20 40 60 80 100
SO
UR
CE
: IE
A T
hird
Inte
rnat
iona
l Mat
hem
atic
s an
d S
cien
ce S
tudy
(T
IMS
S),
199
4-95
. Mis
sour
i and
Ore
gon
data
col
lect
ed in
199
7.

124
C H A P T E R 5
How Do Teachers Spend Their School-Related Time?The data in Table 5.3 reveal that in a number of countries, eighth-grade mathematics teachers are specialists. In Belgium (Flemish), Belgium (French), Cyprus, England, France, Kuwait, Lithuania, the Netherlands, New Zealand, Portugal, the Russian Fed-eration, Scotland, and Slovenia, the majority of eighth-grade students had teachers who spent at least 75% of their formally scheduled school time teaching mathematics. In the United States, Missouri, and Oregon slightly less than one-third of the students were taught by such teachers. In Oregon, the majority of the students (55%) take mathematics from teachers who devote less than half of their time to teaching mathe-matics.
For most participating countries, there was little difference in students’ achievement according to whether they were taught by specialists, and this was the case for the United States and Missouri. However, in Oregon and some countries (e.g., Austria, England, France, Germany, Ireland, and Switzerland) those students with specialists for teachers had higher average mathematics achievement. In Switzerland, this is at least partially because specialists teach the students in the higher tracks and gener-alists the students in lower tracks. Generally, it is important to keep in mind the com-plexity of the relationships between instruction and achievement. In tracked systems, many characteristics of instruction can be related to the track.
As shown in Table 5.4, teachers in most countries reported that mathematics classes typically meet for at least 2 hours per week, but less than 3.5 hours. However, from 3.5 up to nearly 5 hours of weekly class time was reported for 50% or more of the students in a number of countries including the United States. As might be expected the amount of instructional time provided in Oregon and Missouri was commensurate with that provided in the United States. The data reveal no clear pattern between the number of in-class instructional hours and mathematics achievement either across or between countries.
In addition to their formally scheduled duties, teachers were asked about the number of hours per week spent on selected school-related activities outside the regular school day. Table 5.5 presents the results. For example, on average, eighth grade students in the United States had mathematics teachers who reported spending 2.7 hours per week preparing or grading tests, and another 2.7 hours per week reading and grading papers. Their teachers spent 2.4 hours per week on lesson planning and 2.7 hours combined on meetings with students and parents. They spent 0.9 hours on professional reading and development and 3.6 hours on record keeping and administrative tasks combined. Teachers’ reports in Missouri closely paralleled those for the United States as a whole, as did those from the teachers in Oregon. However, the teachers in Oregon reported spending somewhat less time than their colleagues in preparing or grading tests and meeting with students outside classroom time. Even though differences were reported from country to country, teachers reported similar demands on their time. Across countries, teachers reported that grading tests, grading student work, and lesson planning were the most time consuming activities, averaging as much as 10 hours per week in Singapore. In general, teachers also reported several hours per week spent on keeping students’ records and other administrative tasks.
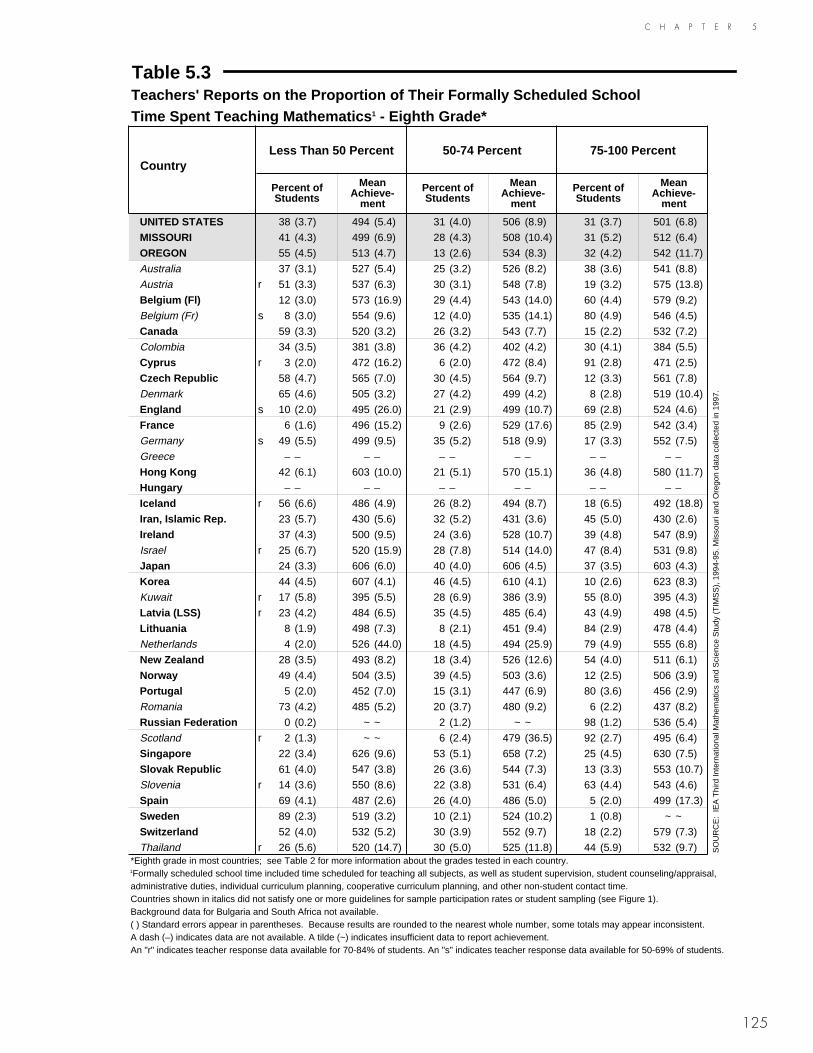
125
C H A P T E R 5
Table 5.3Teachers' Reports on the Proportion of Their Formally Scheduled SchoolTime Spent Teaching Mathematics 1 - Eighth Grade*
CountryLess Than 50 Percent 50-74 Percent 75-100 Percent
Percent of Students
Mean Achieve-
ment
Percent of Students
Mean Achieve-
ment
Percent of Students
Mean Achieve-
ment
UNITED STATES 38 (3.7) 494 (5.4) 31 (4.0) 506 (8.9) 31 (3.7) 501 (6.8)
MISSOURI 41 (4.3) 499 (6.9) 28 (4.3) 508 (10.4) 31 (5.2) 512 (6.4)
OREGON 55 (4.5) 513 (4.7) 13 (2.6) 534 (8.3) 32 (4.2) 542 (11.7)
Australia 37 (3.1) 527 (5.4) 25 (3.2) 526 (8.2) 38 (3.6) 541 (8.8)
Austria r 51 (3.3) 537 (6.3) 30 (3.1) 548 (7.8) 19 (3.2) 575 (13.8)
Belgium (Fl) 12 (3.0) 573 (16.9) 29 (4.4) 543 (14.0) 60 (4.4) 579 (9.2)
Belgium (Fr) s 8 (3.0) 554 (9.6) 12 (4.0) 535 (14.1) 80 (4.9) 546 (4.5)
Canada 59 (3.3) 520 (3.2) 26 (3.2) 543 (7.7) 15 (2.2) 532 (7.2)
Colombia 34 (3.5) 381 (3.8) 36 (4.2) 402 (4.2) 30 (4.1) 384 (5.5)
Cyprus r 3 (2.0) 472 (16.2) 6 (2.0) 472 (8.4) 91 (2.8) 471 (2.5)
Czech Republic 58 (4.7) 565 (7.0) 30 (4.5) 564 (9.7) 12 (3.3) 561 (7.8)
Denmark 65 (4.6) 505 (3.2) 27 (4.2) 499 (4.2) 8 (2.8) 519 (10.4)
England s 10 (2.0) 495 (26.0) 21 (2.9) 499 (10.7) 69 (2.8) 524 (4.6)
France 6 (1.6) 496 (15.2) 9 (2.6) 529 (17.6) 85 (2.9) 542 (3.4)
Germany s 49 (5.5) 499 (9.5) 35 (5.2) 518 (9.9) 17 (3.3) 552 (7.5)
Greece – – – – – – – – – – – –
Hong Kong 42 (6.1) 603 (10.0) 21 (5.1) 570 (15.1) 36 (4.8) 580 (11.7)
Hungary – – – – – – – – – – – –
Iceland r 56 (6.6) 486 (4.9) 26 (8.2) 494 (8.7) 18 (6.5) 492 (18.8)
Iran, Islamic Rep. 23 (5.7) 430 (5.6) 32 (5.2) 431 (3.6) 45 (5.0) 430 (2.6)
Ireland 37 (4.3) 500 (9.5) 24 (3.6) 528 (10.7) 39 (4.8) 547 (8.9)
Israel r 25 (6.7) 520 (15.9) 28 (7.8) 514 (14.0) 47 (8.4) 531 (9.8)
Japan 24 (3.3) 606 (6.0) 40 (4.0) 606 (4.5) 37 (3.5) 603 (4.3)
Korea 44 (4.5) 607 (4.1) 46 (4.5) 610 (4.1) 10 (2.6) 623 (8.3)
Kuwait r 17 (5.8) 395 (5.5) 28 (6.9) 386 (3.9) 55 (8.0) 395 (4.3)
Latvia (LSS) r 23 (4.2) 484 (6.5) 35 (4.5) 485 (6.4) 43 (4.9) 498 (4.5)
Lithuania 8 (1.9) 498 (7.3) 8 (2.1) 451 (9.4) 84 (2.9) 478 (4.4)
Netherlands 4 (2.0) 526 (44.0) 18 (4.5) 494 (25.9) 79 (4.9) 555 (6.8)
New Zealand 28 (3.5) 493 (8.2) 18 (3.4) 526 (12.6) 54 (4.0) 511 (6.1)
Norway 49 (4.4) 504 (3.5) 39 (4.5) 503 (3.6) 12 (2.5) 506 (3.9)
Portugal 5 (2.0) 452 (7.0) 15 (3.1) 447 (6.9) 80 (3.6) 456 (2.9)
Romania 73 (4.2) 485 (5.2) 20 (3.7) 480 (9.2) 6 (2.2) 437 (8.2)
Russian Federation 0 (0.2) ~ ~ 2 (1.2) ~ ~ 98 (1.2) 536 (5.4)
Scotland r 2 (1.3) ~ ~ 6 (2.4) 479 (36.5) 92 (2.7) 495 (6.4)
Singapore 22 (3.4) 626 (9.6) 53 (5.1) 658 (7.2) 25 (4.5) 630 (7.5)
Slovak Republic 61 (4.0) 547 (3.8) 26 (3.6) 544 (7.3) 13 (3.3) 553 (10.7)
Slovenia r 14 (3.6) 550 (8.6) 22 (3.8) 531 (6.4) 63 (4.4) 543 (4.6)
Spain 69 (4.1) 487 (2.6) 26 (4.0) 486 (5.0) 5 (2.0) 499 (17.3)
Sweden 89 (2.3) 519 (3.2) 10 (2.1) 524 (10.2) 1 (0.8) ~ ~
Switzerland 52 (4.0) 532 (5.2) 30 (3.9) 552 (9.7) 18 (2.2) 579 (7.3)
Thailand r 26 (5.6) 520 (14.7) 30 (5.0) 525 (11.8) 44 (5.9) 532 (9.7)*Eighth grade in most countries; see Table 2 for more information about the grades tested in each country.1Formally scheduled school time included time scheduled for teaching all subjects, as well as student supervision, student counseling/appraisal,administrative duties, individual curriculum planning, cooperative curriculum planning, and other non-student contact time.Countries shown in italics did not satisfy one or more guidelines for sample participation rates or student sampling (see Figure 1). Background data for Bulgaria and South Africa not available.( ) Standard errors appear in parentheses. Because results are rounded to the nearest whole number, some totals may appear inconsistent. A dash (–) indicates data are not available. A tilde (~) indicates insufficient data to report achievement.An "r" indicates teacher response data available for 70-84% of students. An "s" indicates teacher response data available for 50-69% of students.
SO
UR
CE
: IE
A T
hird
Inte
rnat
iona
l Mat
hem
atic
s an
d S
cien
ce S
tudy
(T
IMS
S),
199
4-95
. Mis
sour
i and
Ore
gon
data
col
lect
ed in
199
7.

126
C H A P T E R 5
Table 5.4Teachers' Reports on Average Number of Hours Mathematics Is Taught Weekly
to Their Mathematics Classes - Eighth Grade*
CountryLess Than 2 Hours 2 Hours to < 3.5 3.5 Hours to < 5 5 Hours or More
Percent of Students
Mean Achieve-
ment
Percent of Students
Mean Achieve-
ment
Percent of Students
Mean Achieve-
ment
Percent of Students
Mean Achieve-
ment
UNITED STATES s 8 (1.4) 492 (26.2) 24 (3.4) 501 (9.9) 58 (4.4) 507 (5.4) 11 (2.8) 498 (10.0)
MISSOURI r 14 (3.4) 506 (11.1) 22 (3.7) 510 (9.6) 46 (5.3) 504 (7.5) 19 (5.1) 490 (9.2)
OREGON r 13 (3.2) 511 (17.1) 23 (4.6) 540 (14.3) 57 (3.8) 542 (6.6) 7 (1.6) 491 (12.5)
Australia r 5 (1.7) 528 (19.5) 50 (3.7) 518 (6.2) 44 (3.7) 552 (7.6) 1 (0.7) ~ ~
Austria r 0 (0.0) ~ ~ 99 (0.1) 549 (4.1) 1 (0.1) ~ ~ 0 (0.0) ~ ~
Belgium (Fl) s 0 (0.0) ~ ~ 50 (4.4) 572 (5.6) 50 (4.4) 603 (5.4) 0 (0.0) ~ ~
Belgium (Fr) s 0 (0.0) ~ ~ 3 (1.8) 486 (12.9) 83 (4.2) 544 (4.7) 14 (3.8) 564 (10.0)
Canada 3 (1.2) 528 (11.8) 31 (3.8) 521 (5.0) 50 (3.6) 537 (4.3) 17 (3.1) 520 (10.2)
Colombia r 4 (2.0) 389 (8.2) 25 (5.5) 367 (8.8) 58 (5.4) 397 (3.9) 13 (3.3) 390 (8.2)
Cyprus x x x x x x x x x x x x x x x x
Czech Republic 1 (0.9) ~ ~ 6 (2.0) 587 (17.2) 90 (2.7) 561 (5.1) 3 (1.6) 535 (10.2)
Denmark – – – – – – – – – – – – – – – –
England – – – – – – – – – – – – – – – –
France r 2 (1.4) ~ ~ 10 (3.2) 532 (13.4) 87 (3.3) 539 (3.9) 2 (1.3) ~ ~
Germany s 2 (1.5) ~ ~ 85 (3.1) 523 (5.3) 12 (2.9) 463 (13.3) 1 (0.9) ~ ~
Greece 4 (1.7) 459 (10.8) 88 (2.8) 486 (3.5) 3 (1.6) 459 (12.3) 4 (1.6) 480 (8.9)
Hong Kong 5 (2.4) 612 (47.4) 26 (5.2) 590 (19.5) 63 (5.8) 590 (7.6) 6 (2.9) 567 (30.1)
Hungary 0 (0.0) ~ ~ 75 (3.6) 538 (3.9) 23 (3.6) 536 (7.0) 1 (1.0) ~ ~
Iceland r 0 (0.0) ~ ~ 90 (2.9) 492 (5.3) 8 (2.9) 467 (3.5) 1 (0.2) ~ ~
Iran, Islamic Rep. – – – – – – – – – – – – – – – –
Ireland r 1 (0.7) ~ ~ 86 (3.7) 524 (6.4) 12 (3.4) 555 (15.2) 1 (1.1) ~ ~
Israel r 6 (4.1) 523 (13.7) 41 (8.0) 520 (12.7) 47 (8.1) 514 (9.2) 6 (3.7) 579 (22.6)
Japan 4 (1.8) 607 (24.3) 91 (2.3) 602 (2.7) 4 (1.4) 649 (18.5) 0 (0.5) ~ ~
Korea 1 (0.7) ~ ~ 90 (3.0) 610 (2.8) 5 (1.8) 608 (13.8) 5 (2.3) 604 (19.5)
Kuwait 2 (1.5) ~ ~ 21 (5.6) 396 (5.7) 76 (5.7) 391 (2.4) 1 (1.0) ~ ~
Latvia (LSS) 1 (0.5) ~ ~ 30 (4.8) 491 (5.8) 62 (5.3) 492 (4.3) 8 (2.6) 489 (15.0)
Lithuania 1 (0.8) ~ ~ 61 (4.1) 482 (5.0) 29 (3.9) 481 (7.5) 9 (2.3) 448 (13.8)
Netherlands 3 (1.9) 529 (54.2) 97 (1.9) 542 (8.1) 0 (0.0) ~ ~ 0 (0.0) ~ ~
New Zealand 5 (1.8) 484 (11.6) 42 (4.3) 514 (7.1) 50 (4.3) 507 (6.4) 3 (1.5) 503 (27.3)
Norway r 7 (2.6) 502 (5.0) 80 (3.9) 508 (3.1) 8 (2.8) 502 (7.7) 5 (2.1) 513 (7.7)
Portugal 1 (0.8) ~ ~ 89 (2.9) 455 (2.7) 10 (2.8) 452 (7.8) 0 (0.0) ~ ~
Romania 8 (2.6) 497 (17.6) 80 (3.5) 481 (5.0) 9 (2.5) 482 (12.4) 2 (0.6) ~ ~
Russian Federation 0 (0.0) ~ ~ 17 (3.6) 519 (8.6) 70 (5.6) 533 (5.1) 14 (4.8) 567 (18.0)
Scotland 5 (2.0) 473 (14.8) 35 (4.4) 500 (11.6) 60 (4.6) 494 (7.1) 0 (0.0) ~ ~
Singapore 0 (0.0) ~ ~ 52 (4.7) 654 (6.9) 48 (4.7) 633 (7.6) 0 (0.0) ~ ~
Slovak Republic 0 (0.0) ~ ~ 2 (1.3) ~ ~ 86 (3.0) 544 (3.2) 11 (2.9) 561 (11.0)
Slovenia r 0 (0.0) ~ ~ 87 (3.4) 542 (4.0) 12 (3.3) 525 (9.5) 1 (0.8) ~ ~
Spain r 2 (1.1) ~ ~ 28 (4.0) 480 (5.5) 62 (4.7) 490 (3.6) 8 (2.6) 494 (9.2)
Sweden r 3 (1.2) 506 (24.2) 97 (1.3) 520 (3.2) 0 (0.4) ~ ~ 0 (0.3) ~ ~
Switzerland s 2 (1.4) ~ ~ 14 (3.4) 520 (17.8) 71 (3.5) 557 (6.5) 13 (3.0) 566 (12.4)
Thailand x x x x x x x x x x x x x x x x*Eighth grade in most countries; see Table 2 for more information about the grades tested in each country.Countries shown in italics did not satisfy one or more guidelines for sample participation rates or student sampling (see Figure 1). Background data for Bulgaria and South Africa not available.( ) Standard errors appear in parentheses. Because results are rounded to the nearest whole number, some totals may appear inconsistent. A dash (–) indicates data are not available. A tilde (~) indicates insufficient data to report achievement.An "r" indicates teacher response data available for 70-84% of students. An "s" indicates teacher response data available for 50-69% of students.An "x" indicates teacher response data available for <50% of students.
SO
UR
CE
: IE
A T
hird
Inte
rnat
iona
l Mat
hem
atic
s an
d S
cien
ce S
tudy
(T
IMS
S),
199
4-95
. Mis
sour
i and
Ore
gon
data
col
lect
ed in
199
7.
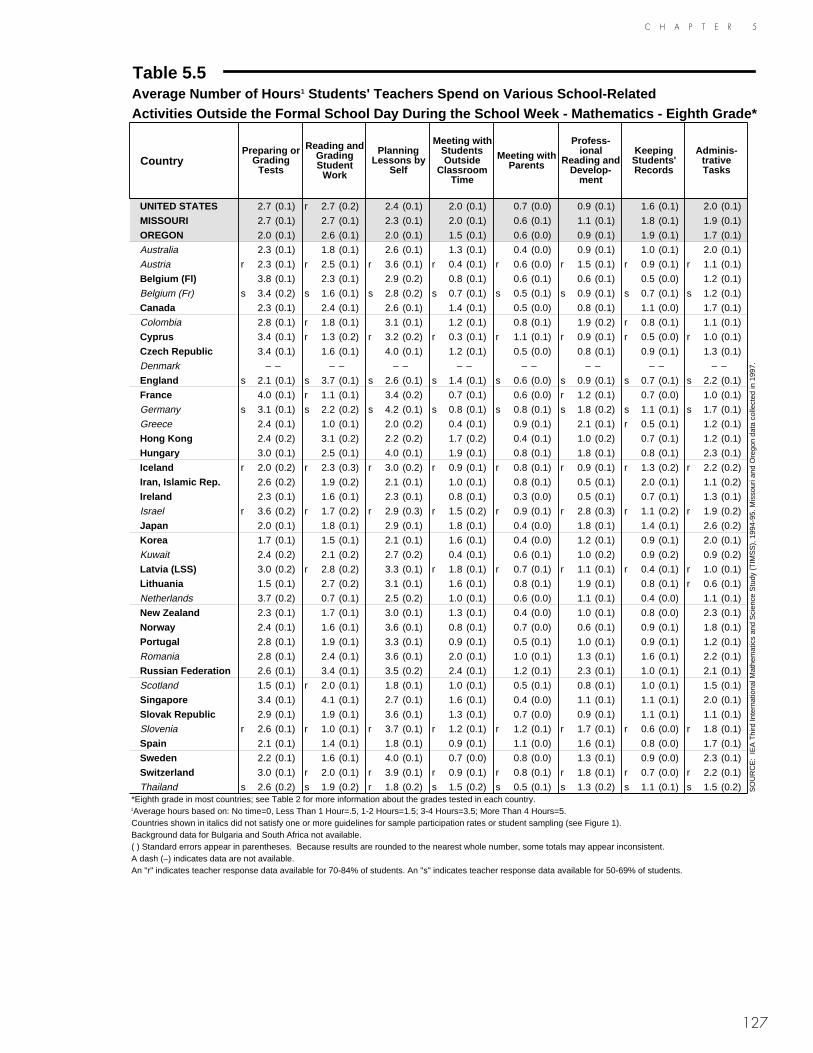
127
C H A P T E R 5
Table 5.5Average Number of Hours 1 Students' Teachers Spend on Various School-RelatedActivities Outside the Formal School Day During the School Week - Mathematics - Eighth Grade*
CountryPreparing or
Grading Tests
Reading and Grading Student
Work
Planning Lessons by
Self
Meeting with Students Outside
Classroom Time
Meeting with Parents
Profess-ional
Reading and Develop-
ment
Keeping Students' Records
Adminis-trative Tasks
UNITED STATES 2.7 (0.1) r 2.7 (0.2) 2.4 (0.1) 2.0 (0.1) 0.7 (0.0) 0.9 (0.1) 1.6 (0.1) 2.0 (0.1)
MISSOURI 2.7 (0.1) 2.7 (0.1) 2.3 (0.1) 2.0 (0.1) 0.6 (0.1) 1.1 (0.1) 1.8 (0.1) 1.9 (0.1)
OREGON 2.0 (0.1) 2.6 (0.1) 2.0 (0.1) 1.5 (0.1) 0.6 (0.0) 0.9 (0.1) 1.9 (0.1) 1.7 (0.1)
Australia 2.3 (0.1) 1.8 (0.1) 2.6 (0.1) 1.3 (0.1) 0.4 (0.0) 0.9 (0.1) 1.0 (0.1) 2.0 (0.1)
Austria r 2.3 (0.1) r 2.5 (0.1) r 3.6 (0.1) r 0.4 (0.1) r 0.6 (0.0) r 1.5 (0.1) r 0.9 (0.1) r 1.1 (0.1)
Belgium (Fl) 3.8 (0.1) 2.3 (0.1) 2.9 (0.2) 0.8 (0.1) 0.6 (0.1) 0.6 (0.1) 0.5 (0.0) 1.2 (0.1)
Belgium (Fr) s 3.4 (0.2) s 1.6 (0.1) s 2.8 (0.2) s 0.7 (0.1) s 0.5 (0.1) s 0.9 (0.1) s 0.7 (0.1) s 1.2 (0.1)
Canada 2.3 (0.1) 2.4 (0.1) 2.6 (0.1) 1.4 (0.1) 0.5 (0.0) 0.8 (0.1) 1.1 (0.0) 1.7 (0.1)
Colombia 2.8 (0.1) r 1.8 (0.1) 3.1 (0.1) 1.2 (0.1) 0.8 (0.1) 1.9 (0.2) r 0.8 (0.1) 1.1 (0.1)
Cyprus 3.4 (0.1) r 1.3 (0.2) r 3.2 (0.2) r 0.3 (0.1) r 1.1 (0.1) r 0.9 (0.1) r 0.5 (0.0) r 1.0 (0.1)
Czech Republic 3.4 (0.1) 1.6 (0.1) 4.0 (0.1) 1.2 (0.1) 0.5 (0.0) 0.8 (0.1) 0.9 (0.1) 1.3 (0.1)
Denmark – – – – – – – – – – – – – – – –
England s 2.1 (0.1) s 3.7 (0.1) s 2.6 (0.1) s 1.4 (0.1) s 0.6 (0.0) s 0.9 (0.1) s 0.7 (0.1) s 2.2 (0.1)
France 4.0 (0.1) r 1.1 (0.1) 3.4 (0.2) 0.7 (0.1) 0.6 (0.0) r 1.2 (0.1) 0.7 (0.0) 1.0 (0.1)
Germany s 3.1 (0.1) s 2.2 (0.2) s 4.2 (0.1) s 0.8 (0.1) s 0.8 (0.1) s 1.8 (0.2) s 1.1 (0.1) s 1.7 (0.1)
Greece 2.4 (0.1) 1.0 (0.1) 2.0 (0.2) 0.4 (0.1) 0.9 (0.1) 2.1 (0.1) r 0.5 (0.1) 1.2 (0.1)
Hong Kong 2.4 (0.2) 3.1 (0.2) 2.2 (0.2) 1.7 (0.2) 0.4 (0.1) 1.0 (0.2) 0.7 (0.1) 1.2 (0.1)
Hungary 3.0 (0.1) 2.5 (0.1) 4.0 (0.1) 1.9 (0.1) 0.8 (0.1) 1.8 (0.1) 0.8 (0.1) 2.3 (0.1)
Iceland r 2.0 (0.2) r 2.3 (0.3) r 3.0 (0.2) r 0.9 (0.1) r 0.8 (0.1) r 0.9 (0.1) r 1.3 (0.2) r 2.2 (0.2)
Iran, Islamic Rep. 2.6 (0.2) 1.9 (0.2) 2.1 (0.1) 1.0 (0.1) 0.8 (0.1) 0.5 (0.1) 2.0 (0.1) 1.1 (0.2)
Ireland 2.3 (0.1) 1.6 (0.1) 2.3 (0.1) 0.8 (0.1) 0.3 (0.0) 0.5 (0.1) 0.7 (0.1) 1.3 (0.1)
Israel r 3.6 (0.2) r 1.7 (0.2) r 2.9 (0.3) r 1.5 (0.2) r 0.9 (0.1) r 2.8 (0.3) r 1.1 (0.2) r 1.9 (0.2)
Japan 2.0 (0.1) 1.8 (0.1) 2.9 (0.1) 1.8 (0.1) 0.4 (0.0) 1.8 (0.1) 1.4 (0.1) 2.6 (0.2)
Korea 1.7 (0.1) 1.5 (0.1) 2.1 (0.1) 1.6 (0.1) 0.4 (0.0) 1.2 (0.1) 0.9 (0.1) 2.0 (0.1)
Kuwait 2.4 (0.2) 2.1 (0.2) 2.7 (0.2) 0.4 (0.1) 0.6 (0.1) 1.0 (0.2) 0.9 (0.2) 0.9 (0.2)
Latvia (LSS) 3.0 (0.2) r 2.8 (0.2) 3.3 (0.1) r 1.8 (0.1) r 0.7 (0.1) r 1.1 (0.1) r 0.4 (0.1) r 1.0 (0.1)
Lithuania 1.5 (0.1) 2.7 (0.2) 3.1 (0.1) 1.6 (0.1) 0.8 (0.1) 1.9 (0.1) 0.8 (0.1) r 0.6 (0.1)
Netherlands 3.7 (0.2) 0.7 (0.1) 2.5 (0.2) 1.0 (0.1) 0.6 (0.0) 1.1 (0.1) 0.4 (0.0) 1.1 (0.1)
New Zealand 2.3 (0.1) 1.7 (0.1) 3.0 (0.1) 1.3 (0.1) 0.4 (0.0) 1.0 (0.1) 0.8 (0.0) 2.3 (0.1)
Norway 2.4 (0.1) 1.6 (0.1) 3.6 (0.1) 0.8 (0.1) 0.7 (0.0) 0.6 (0.1) 0.9 (0.1) 1.8 (0.1)
Portugal 2.8 (0.1) 1.9 (0.1) 3.3 (0.1) 0.9 (0.1) 0.5 (0.1) 1.0 (0.1) 0.9 (0.1) 1.2 (0.1)
Romania 2.8 (0.1) 2.4 (0.1) 3.6 (0.1) 2.0 (0.1) 1.0 (0.1) 1.3 (0.1) 1.6 (0.1) 2.2 (0.1)
Russian Federation 2.6 (0.1) 3.4 (0.1) 3.5 (0.2) 2.4 (0.1) 1.2 (0.1) 2.3 (0.1) 1.0 (0.1) 2.1 (0.1)
Scotland 1.5 (0.1) r 2.0 (0.1) 1.8 (0.1) 1.0 (0.1) 0.5 (0.1) 0.8 (0.1) 1.0 (0.1) 1.5 (0.1)
Singapore 3.4 (0.1) 4.1 (0.1) 2.7 (0.1) 1.6 (0.1) 0.4 (0.0) 1.1 (0.1) 1.1 (0.1) 2.0 (0.1)
Slovak Republic 2.9 (0.1) 1.9 (0.1) 3.6 (0.1) 1.3 (0.1) 0.7 (0.0) 0.9 (0.1) 1.1 (0.1) 1.1 (0.1)
Slovenia r 2.6 (0.1) r 1.0 (0.1) r 3.7 (0.1) r 1.2 (0.1) r 1.2 (0.1) r 1.7 (0.1) r 0.6 (0.0) r 1.8 (0.1)
Spain 2.1 (0.1) 1.4 (0.1) 1.8 (0.1) 0.9 (0.1) 1.1 (0.0) 1.6 (0.1) 0.8 (0.0) 1.7 (0.1)
Sweden 2.2 (0.1) 1.6 (0.1) 4.0 (0.1) 0.7 (0.0) 0.8 (0.0) 1.3 (0.1) 0.9 (0.0) 2.3 (0.1)
Switzerland 3.0 (0.1) r 2.0 (0.1) r 3.9 (0.1) r 0.9 (0.1) r 0.8 (0.1) r 1.8 (0.1) r 0.7 (0.0) r 2.2 (0.1)
Thailand s 2.6 (0.2) s 1.9 (0.2) r 1.8 (0.2) s 1.5 (0.2) s 0.5 (0.1) s 1.3 (0.2) s 1.1 (0.1) s 1.5 (0.2)*Eighth grade in most countries; see Table 2 for more information about the grades tested in each country.1Average hours based on: No time=0, Less Than 1 Hour=.5, 1-2 Hours=1.5; 3-4 Hours=3.5; More Than 4 Hours=5.Countries shown in italics did not satisfy one or more guidelines for sample participation rates or student sampling (see Figure 1). Background data for Bulgaria and South Africa not available.( ) Standard errors appear in parentheses. Because results are rounded to the nearest whole number, some totals may appear inconsistent. A dash (–) indicates data are not available.An "r" indicates teacher response data available for 70-84% of students. An "s" indicates teacher response data available for 50-69% of students.
SO
UR
CE
: IE
A T
hird
Inte
rnat
iona
l Mat
hem
atic
s an
d S
cien
ce S
tudy
(T
IMS
S),
199
4-95
. Mis
sour
i and
Ore
gon
data
col
lect
ed in
199
7.

128
C H A P T E R 5
Opportunities to meet with colleagues to plan curriculum or teaching approaches enable teachers to expand their views of mathematics, their resources for teaching, and their repertoire of teaching and learning skills. Table 5.6 contains teachers’ reports on how often they meet with other teachers in their subject area to discuss and plan curriculum or teaching approaches. Teachers of the majority of the students reported weekly or even daily planning meetings in Belgium (French), Colombia, Cyprus, the Czech Republic, England, Hungary, Israel, Kuwait, Latvia (LSS), Lithuania, Norway, Scotland, the Slovak Republic, Slovenia, and Sweden. In the remaining countries, however, most students had mathematics teachers who reported only limited opportu-nities to plan curriculum or teaching approaches with other teachers (monthly or even yearly meetings). The United States was in this latter category, with teachers of nearly two-thirds of the students reporting meeting monthly or less frequently. In Oregon, teachers’ reports resembled those for the United States, but in Missouri this figure rose to 82%. Teachers of 36% of the eighth graders in Missouri reported meeting only once or twice a year.

129
C H A P T E R 5
Table 5.6Teachers' Reports on How Often They Meet with Other Teachers in Their Subject Areato Discuss and Plan Curriculum or Teaching Approaches - Mathematics - Eighth Grade*
Percent of Students Taught by Teachers
Country Meeting Never or Once/Twice a Year
Meeting Monthly or Every Other Month
Meeting Once, Twice, or Three Times a
WeekMeeting Almost
Every Day
UNITED STATES 29 (3.7) 37 (3.9) 26 (3.7) 8 (2.4)
MISSOURI 36 (5.0) 46 (5.1) 14 (3.3) 4 (1.5)
OREGON 24 (3.8) 44 (4.5) 28 (3.2) 4 (1.6)
Australia 12 (2.2) 52 (3.3) 24 (2.8) 12 (2.4)
Austria r 17 (2.9) 37 (4.0) 36 (3.7) 9 (3.0)
Belgium (Fl) 52 (4.8) 29 (4.1) 15 (3.3) 4 (1.7)
Belgium (Fr) s 19 (4.0) 29 (4.9) 41 (5.4) 11 (3.6)
Canada 29 (3.0) 33 (3.2) 30 (3.7) 8 (2.5)
Colombia 17 (3.6) 32 (4.3) 48 (4.6) 4 (1.7)
Cyprus 3 (1.8) 4 (1.6) 77 (3.8) 17 (3.0)
Czech Republic 12 (2.7) 30 (4.8) 37 (5.3) 21 (3.9)
Denmark – – – – – – – –
England s 7 (1.7) 33 (3.3) 52 (3.8) 9 (1.4)
France 35 (5.2) 32 (4.9) 30 (4.5) 3 (1.9)
Germany s 42 (5.8) 33 (4.8) 15 (3.9) 10 (3.1)
Greece 41 (4.1) 28 (4.9) 22 (3.9) 9 (2.5)
Hong Kong 30 (5.2) 53 (5.8) 16 (4.1) 1 (1.2)
Hungary 2 (1.3) 10 (2.7) 41 (4.4) 46 (4.2)
Iceland r 23 (4.3) 31 (6.0) 41 (7.2) 4 (3.7)
Iran, Islamic Rep. 21 (5.3) 38 (5.3) 35 (4.3) 6 (2.3)
Ireland 63 (4.4) 25 (4.0) 11 (3.0) 2 (1.2)
Israel r 5 (3.5) 20 (6.8) 53 (8.0) 21 (5.0)
Japan 23 (3.6) 28 (3.8) 46 (4.3) 3 (1.3)
Korea 23 (3.6) 37 (4.1) 37 (4.4) 3 (1.8)
Kuwait 2 (1.6) 2 (2.2) 67 (6.6) 29 (5.9)
Latvia (LSS) r 19 (3.7) 31 (3.8) 28 (4.1) 22 (3.8)
Lithuania 14 (2.6) 29 (4.3) 26 (3.5) 31 (3.8)
Netherlands 12 (3.6) 65 (5.6) 21 (4.2) 1 (1.4)
New Zealand 10 (2.5) 43 (4.0) 45 (4.0) 2 (1.0)
Norway 6 (2.1) 17 (3.4) 71 (3.8) 6 (2.0)
Portugal 7 (1.9) 72 (3.9) 18 (3.2) 3 (1.7)
Romania 7 (2.1) 45 (4.0) 24 (3.4) 24 (3.4)
Russian Federation 8 (3.0) 55 (4.3) 25 (3.8) 12 (3.3)
Scotland 5 (2.2) 20 (3.9) 69 (4.2) 6 (2.3)
Singapore 10 (3.1) 68 (4.5) 16 (3.4) 6 (2.4)
Slovak Republic 3 (1.4) 23 (3.6) 30 (4.1) 44 (4.3)
Slovenia r 2 (1.4) 26 (4.5) 26 (4.2) 46 (4.4)
Spain 16 (3.0) 43 (4.4) 39 (4.6) 2 (1.2)
Sweden 9 (2.3) 17 (2.7) 49 (3.9) 24 (3.2)
Switzerland r 38 (3.8) 33 (3.8) 26 (3.5) 3 (1.4)
Thailand r 53 (6.2) 31 (5.7) 12 (4.1) 4 (2.6)*Eighth grade in most countries; see Table 2 for more information about the grades tested in each country.Countries shown in italics did not satisfy one or more guidelines for sample participation rates or student sampling (see Figure 1). Background data for Bulgaria and South Africa not available.( ) Standard errors appear in parentheses. Because results are rounded to the nearest whole number, some totals may appear inconsistent. A dash (–) indicates data are not available.An "r" indicates teacher response data available for 70-84% of students. An "s" indicates teacher response data available for 50-69% of students.
SO
UR
CE
: IE
A T
hird
Inte
rnat
iona
l Mat
hem
atic
s an
d S
cien
ce S
tudy
(T
IMS
S),
199
4-95
. Mis
sour
i and
Ore
gon
data
col
lect
ed in
199
7.
130
C H A P T E R 5
How Are Mathematics Classes Organized?Instructional organization can subsume many factors, including the diversity of the students placed into classrooms, the availability of instructional resources, the typical size of classes, and practices regarding in-class grouping. Often, how instruction is organized can influence the implemented curriculum and the opportunities of students.
Figure 5.3 presents teachers reports about several factors that might limit how they teach their mathematics classes. The results are presented visually via pie graphs. The percentage of students whose teachers reported that a particular factor limited how they taught mathematics either “quite a lot” or “a great deal” also is shown next to each graph. In most countries, a substantial number of teachers reported that the dif-fering academic abilities of their students limited how they teach mathematics. However, fewer than half of the U.S. students (44%) and of those in Missouri (42%) and Oregon (36%) were in such classes. In general, fewer teachers reported that stu-dents with special needs limited instruction. Comparatively few students appear to be in such mathematics classes in the United States (i.e., United States 15%, Missouri 19%, and Oregon 13%). In many countries about half the students appear to be in classes adversely affected by disruptive students, and the U.S. teachers noted this as a limiting factor for 39% of the students. According to their teachers, more students than in the United States were in such classes in Missouri (47%) and fewer were in Oregon (28%).
Compared to many countries, U.S. classrooms appear to have adequate equipment for use in demonstrations and to be in adequate physical facilities (Figure 5.3). Still, teachers of 29% of the students in Missouri noted shortage of equipment as a limiting factor compared to 13% in Oregon and 20% for the United States as a whole. In a number of the TIMSS countries, teachers reported that high student/teacher ratios were a limiting instructional factor for the majority of the students. Again, this appeared to be somewhat less of a problem in the United States, with 29% of the students in such classes. However, teachers reported this as a limiting factor for 44% of the stu-dents in Missouri and 40% of the students in Oregon.
Table 5.7 presents teachers’ reports about the size of eighth-grade mathematics classes for the TIMSS countries. The data reveal rather large variations from country to country. According to teachers, mathematics classes were relatively small in a number of countries. For example, 90% or more of the students were in mathematics classes of 30 or fewer students in Belgium (Flemish), Belgium (French), the Czech Republic, Denmark, France, Germany, Hungary, Iceland, Latvia (LSS), Lithuania, the Nether-lands, Norway, Portugal, the Russian Federation, Scotland, Slovenia, Sweden, and Switzerland. At the other end of the spectrum, 93% of the students in Korea and 48% in Colombia were in mathematics classes with more than 40 students. Similar to the results for the United States, 73% of the eighth graders in Oregon were in mathe-matics classes with 30 or fewer students, and only 7% were in classes of 41 or more students. In Missouri, 71% of the students were in classes with 30 or fewer students, but 23% of the students were in classes of 41 or more students.
Extensive research about class size in relation to achievement indicates that the existence of such a relationship is dependent on the situation. Dramatic reductions in class size can be related to gains in achievement, but the chief effects of smaller classes often are in relation to teacher attitudes and instructional behaviors. The

C H A P T E R 5
131
TIMSS data illustrates the complexity of this issue. Across countries, the four highest-performing countries at the eighth grade – Singapore, Korea, Japan, and Hong Kong – are among those with the largest mathematics classes. Within countries, several show little or no relationship between achievement and class size, often because students are mostly all in classes of similar size. Within other countries, there appears to be a cur-vilinear relationship, or those students with higher achievement appear to be in larger classes. In some countries, larger classes may represent the more usual situation for mathematics teaching, with smaller classes used primarily for students needing reme-diation or for those students in the less-advanced tracks.
Teachers can adopt a variety of organizational and interactive approaches in mathe-matics class. Whole-class instruction can be very efficient, because it requires less time on management functions and provides more time for developing mathematics concepts. Teachers can make presentations, conduct discussions, or demonstrate pro-cedures and applications to all students simultaneously. Both whole-class and inde-pendent work have been standard features of mathematics classrooms. Students also can benefit from the type of cooperative learning that occurs with effective use of small-group work. Because they can help each other, students in groups can often handle challenging situations beyond their individual capabilities. Further, the positive affective impact of working together mirrors the use of mathematics in the workplace.

132
C H A P T E R 5
Figure 5.3Teachers' Reports on Factors Limiting How They Teach ClassMathematics - Eighth Grade*
Percent of Students Whose Teachers Report Each Factor Limiting How TheyTeach Class "Quite a Lot" or "A Great Deal"
CountryStudents with
DifferentAcademicAbilities
Students withSpecial Needs
DisruptiveStudents
Shortage ofEquipment for
Use inDemonstrations
and OtherExercises
InadequatePhysicalFacilities
High Student /Teacher Ratio
UNITED STATESr
44r
15r
39r
20r
13r
29
MISSOURIr
42r
19r
47r
29r
13r
44
OREGONr
36r
13r
28r
13r
14r
40
Australiar
50r
26r
51r
24r
19r
41
Austriar
34r
5r
13r
12r
10r
19
Belgium (Fl) 34 7 30 10 13 27
Belgium (Fr)s
49s
1s
28s
12s
17s
28
Canadar
57r
24 39r
22r
12 32
Colombia 28 52 46 42r
43r
53
Cyprusr
84r
55r
65r
36r
39r
85
Czech Republic 72 12 30 23 15 38
Denmark 41 7 38 32 28 32
Englands
32s
16s
24s
16s
18s
24
France 62 9 35 13 13 38
Germanys
54s
12s
38s
15s
19s
38
Greece 86 47 41 53 49 80
Hong Kong 71 19 52 19 18 80
Hungary 92 52 55 47 35 46
Icelandr
92r
40r
64r
33r
36r
65
Iran, Islamic Rep. 89 63 50 69 55 62
*Eighth grade in most countries; see Table 2 for more information about the grades tested in each country.Countries shown in italics did not satisfy one or more guidelines for sample participation rates or student sampling (see Figure 1).Background data for Bulgaria and South Africa not available.An "r" indicates teacher response data available for 70-84% of students. An "s" indicates teacher response data available for 50-69% of students.
Percent for "Quite a Lot" or "A Great Deal"
SO
UR
CE
: IE
A T
hird
Inte
rnat
iona
l Mat
hem
atic
s an
d S
cien
ce S
tudy
(T
IMS
S),
199
4-95
. Mis
sour
i and
Ore
gon
data
col
lect
ed in
199
7.

133
C H A P T E R 5
Figure 5.3 (Continued)Teachers' Reports on What Factors Limit How They Teach ClassMathematics - Eighth Grade*
Percent of Students Whose Teachers Report Each Factor Limiting How TheyTeach Class "Quite a Lot" or "A Great Deal"
CountryStudents with
DifferentAcademicAbilities
Students withSpecial Needs
DisruptiveStudents
Shortage ofEquipment for
Use inDemonstrations
and OtherExercises
InadequatePhysicalFacilities
HighStudent/Teacher
Ratio
Ireland 61r
28 41r
10r
14 39
Israelr
63r
5r
6r
25r
16r
23
Japan 63 – – 12 – 42
Korea 77 38 60 31 36 67
Kuwait 67 49 51 46 28 89
Latvia (LSS)r
81r
31r
22r
46r
29 29
Lithuania 89r
21 37 73 28 48
Netherlands 21 0 15 4 10 15
New Zealand 53 24 46 26 17 37
Norwayr
67r
27r
31r
35r
16r
54
Portugal 70 54 54 38 37 57
Romania 72 45 51 68 69 65
Russian Federation 77 21 18 66 47 42
Scotland 57 11 35 14 20 54
Singapore 55 13 44 25 15 60
Slovak Republic 64 11 39 40 1 34
Sloveniar
49r
6r
48r
31r
34r
52
Spainr
80r
58r
64r
39r
28r
66
Swedenr
50r
22r
32r
14r
14r
47
Switzerlands
62s
10s
26s
8s
5s
30
Thailandr
82r
34r
31r
80r
75r
66
*Eighth grade in most countries; see Table 2 for more information about the grades tested in each country.Countries shown in italics did not satisfy one or more guidelines for sample participation rates or student sampling (see Figure 1).Background data for Bulgaria and South Africa not available.A dash (–) indicates data are not available.An "r" indicates teacher response data available for 70-84% of students. An "s" indicates teacher response data available for 50-69% of students.
SO
UR
CE
: IE
A T
hird
Inte
rnat
iona
l Mat
hem
atic
s an
d S
cien
ce S
tudy
(T
IMS
S),
199
4-95
. Mis
sour
i and
Ore
gon
data
col
lect
ed in
199
7.
Percent for "Quite a Lot" or "A Great Deal"
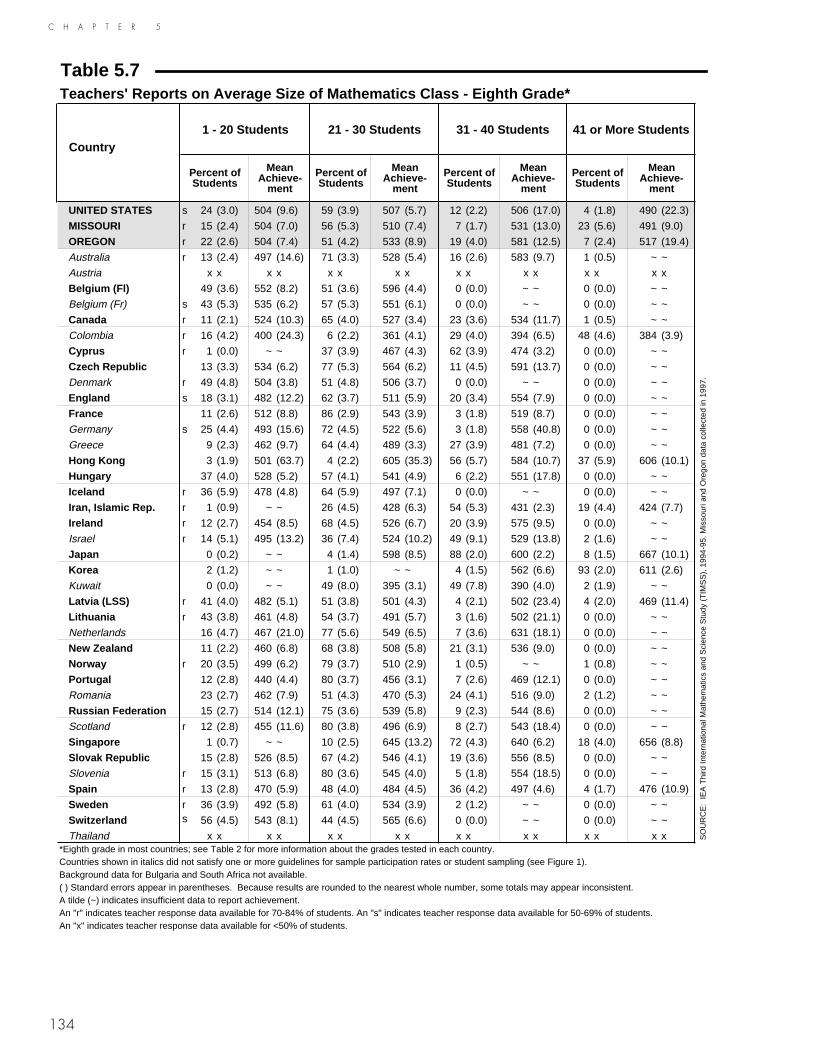
134
C H A P T E R 5
Table 5.7Teachers' Reports on Average Size of Mathematics Class - Eighth Grade*
Country1 - 20 Students 21 - 30 Students 31 - 40 Students 41 or More Students
Percent of Students
Mean Achieve-
ment
Percent of Students
Mean Achieve-
ment
Percent of Students
Mean Achieve-
ment
Percent of Students
Mean Achieve-
ment
UNITED STATES s 24 (3.0) 504 (9.6) 59 (3.9) 507 (5.7) 12 (2.2) 506 (17.0) 4 (1.8) 490 (22.3)
MISSOURI r 15 (2.4) 504 (7.0) 56 (5.3) 510 (7.4) 7 (1.7) 531 (13.0) 23 (5.6) 491 (9.0)
OREGON r 22 (2.6) 504 (7.4) 51 (4.2) 533 (8.9) 19 (4.0) 581 (12.5) 7 (2.4) 517 (19.4)
Australia r 13 (2.4) 497 (14.6) 71 (3.3) 528 (5.4) 16 (2.6) 583 (9.7) 1 (0.5) ~ ~
Austria x x x x x x x x x x x x x x x x
Belgium (Fl) 49 (3.6) 552 (8.2) 51 (3.6) 596 (4.4) 0 (0.0) ~ ~ 0 (0.0) ~ ~
Belgium (Fr) s 43 (5.3) 535 (6.2) 57 (5.3) 551 (6.1) 0 (0.0) ~ ~ 0 (0.0) ~ ~
Canada r 11 (2.1) 524 (10.3) 65 (4.0) 527 (3.4) 23 (3.6) 534 (11.7) 1 (0.5) ~ ~
Colombia r 16 (4.2) 400 (24.3) 6 (2.2) 361 (4.1) 29 (4.0) 394 (6.5) 48 (4.6) 384 (3.9)
Cyprus r 1 (0.0) ~ ~ 37 (3.9) 467 (4.3) 62 (3.9) 474 (3.2) 0 (0.0) ~ ~
Czech Republic 13 (3.3) 534 (6.2) 77 (5.3) 564 (6.2) 11 (4.5) 591 (13.7) 0 (0.0) ~ ~
Denmark r 49 (4.8) 504 (3.8) 51 (4.8) 506 (3.7) 0 (0.0) ~ ~ 0 (0.0) ~ ~
England s 18 (3.1) 482 (12.2) 62 (3.7) 511 (5.9) 20 (3.4) 554 (7.9) 0 (0.0) ~ ~
France 11 (2.6) 512 (8.8) 86 (2.9) 543 (3.9) 3 (1.8) 519 (8.7) 0 (0.0) ~ ~
Germany s 25 (4.4) 493 (15.6) 72 (4.5) 522 (5.6) 3 (1.8) 558 (40.8) 0 (0.0) ~ ~
Greece 9 (2.3) 462 (9.7) 64 (4.4) 489 (3.3) 27 (3.9) 481 (7.2) 0 (0.0) ~ ~
Hong Kong 3 (1.9) 501 (63.7) 4 (2.2) 605 (35.3) 56 (5.7) 584 (10.7) 37 (5.9) 606 (10.1)
Hungary 37 (4.0) 528 (5.2) 57 (4.1) 541 (4.9) 6 (2.2) 551 (17.8) 0 (0.0) ~ ~
Iceland r 36 (5.9) 478 (4.8) 64 (5.9) 497 (7.1) 0 (0.0) ~ ~ 0 (0.0) ~ ~
Iran, Islamic Rep. r 1 (0.9) ~ ~ 26 (4.5) 428 (6.3) 54 (5.3) 431 (2.3) 19 (4.4) 424 (7.7)
Ireland r 12 (2.7) 454 (8.5) 68 (4.5) 526 (6.7) 20 (3.9) 575 (9.5) 0 (0.0) ~ ~
Israel r 14 (5.1) 495 (13.2) 36 (7.4) 524 (10.2) 49 (9.1) 529 (13.8) 2 (1.6) ~ ~
Japan 0 (0.2) ~ ~ 4 (1.4) 598 (8.5) 88 (2.0) 600 (2.2) 8 (1.5) 667 (10.1)
Korea 2 (1.2) ~ ~ 1 (1.0) ~ ~ 4 (1.5) 562 (6.6) 93 (2.0) 611 (2.6)
Kuwait 0 (0.0) ~ ~ 49 (8.0) 395 (3.1) 49 (7.8) 390 (4.0) 2 (1.9) ~ ~
Latvia (LSS) r 41 (4.0) 482 (5.1) 51 (3.8) 501 (4.3) 4 (2.1) 502 (23.4) 4 (2.0) 469 (11.4)
Lithuania r 43 (3.8) 461 (4.8) 54 (3.7) 491 (5.7) 3 (1.6) 502 (21.1) 0 (0.0) ~ ~
Netherlands 16 (4.7) 467 (21.0) 77 (5.6) 549 (6.5) 7 (3.6) 631 (18.1) 0 (0.0) ~ ~
New Zealand 11 (2.2) 460 (6.8) 68 (3.8) 508 (5.8) 21 (3.1) 536 (9.0) 0 (0.0) ~ ~
Norway r 20 (3.5) 499 (6.2) 79 (3.7) 510 (2.9) 1 (0.5) ~ ~ 1 (0.8) ~ ~
Portugal 12 (2.8) 440 (4.4) 80 (3.7) 456 (3.1) 7 (2.6) 469 (12.1) 0 (0.0) ~ ~
Romania 23 (2.7) 462 (7.9) 51 (4.3) 470 (5.3) 24 (4.1) 516 (9.0) 2 (1.2) ~ ~
Russian Federation 15 (2.7) 514 (12.1) 75 (3.6) 539 (5.8) 9 (2.3) 544 (8.6) 0 (0.0) ~ ~
Scotland r 12 (2.8) 455 (11.6) 80 (3.8) 496 (6.9) 8 (2.7) 543 (18.4) 0 (0.0) ~ ~
Singapore 1 (0.7) ~ ~ 10 (2.5) 645 (13.2) 72 (4.3) 640 (6.2) 18 (4.0) 656 (8.8)
Slovak Republic 15 (2.8) 526 (8.5) 67 (4.2) 546 (4.1) 19 (3.6) 556 (8.5) 0 (0.0) ~ ~
Slovenia r 15 (3.1) 513 (6.8) 80 (3.6) 545 (4.0) 5 (1.8) 554 (18.5) 0 (0.0) ~ ~
Spain r 13 (2.8) 470 (5.9) 48 (4.0) 484 (4.5) 36 (4.2) 497 (4.6) 4 (1.7) 476 (10.9)
Sweden r 36 (3.9) 492 (5.8) 61 (4.0) 534 (3.9) 2 (1.2) ~ ~ 0 (0.0) ~ ~
Switzerland s 56 (4.5) 543 (8.1) 44 (4.5) 565 (6.6) 0 (0.0) ~ ~ 0 (0.0) ~ ~
Thailand x x x x x x x x x x x x x x x x*Eighth grade in most countries; see Table 2 for more information about the grades tested in each country.Countries shown in italics did not satisfy one or more guidelines for sample participation rates or student sampling (see Figure 1). Background data for Bulgaria and South Africa not available.( ) Standard errors appear in parentheses. Because results are rounded to the nearest whole number, some totals may appear inconsistent. A tilde (~) indicates insufficient data to report achievement.An "r" indicates teacher response data available for 70-84% of students. An "s" indicates teacher response data available for 50-69% of students.An "x" indicates teacher response data available for <50% of students.
SO
UR
CE
: IE
A T
hird
Inte
rnat
iona
l Mat
hem
atic
s an
d S
cien
ce S
tudy
(T
IMS
S),
199
4-95
. Mis
sour
i and
Ore
gon
data
col
lect
ed in
199
7.

C H A P T E R 5
135
Figure 5.4 provides a pictorial view of the emphasis on individual, small-group, and whole-class work as reported by the mathematics teachers in the TIMSS countries. Because learning may be enhanced with teacher guidance and monitoring individual and small-group activities, the frequency of lessons using each of these organizational approaches is shown both with and without assistance of the teacher. Internationally, teachers reported that students working together as a class with the teacher teaching the whole class is a frequently used instructional approach. In Oregon and Missouri, as well as in most countries approximately 50% or even more of the eighth-grade stu-dents were taught this way during most or every lesson. In contrast, students working together as a class and responding to each other appeared to be a much less common approach, generally used for a third or fewer of the students on a frequent basis (except in Israel).
Equally as popular as having students working together as a class with the teacher teaching the whole class, was having students work individually with assistance from the teacher. This approach was relatively frequent in the U.S. (50% of the students in most lessons), although it was reported more frequently in Missouri (63%) than in Oregon (42%). Compared to most of the TIMSS countries including the United States, teachers in Oregon reported a high degree of group work, both in terms of having it teacher assisted (48% of the students in most lessons) and unassisted (24%).
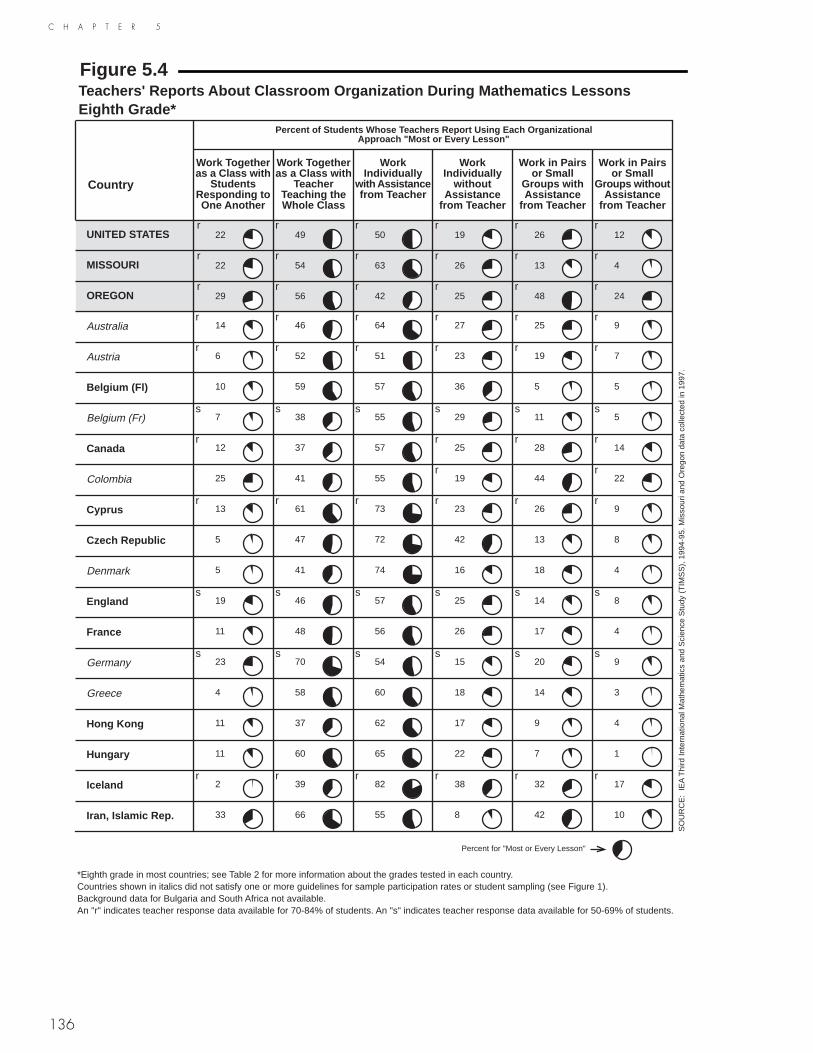
136
C H A P T E R 5
Figure 5.4Teachers' Reports About Classroom Organization During Mathematics LessonsEighth Grade*
Percent of Students Whose Teachers Report Using Each OrganizationalApproach "Most or Every Lesson"
Country
Work Togetheras a Class with
StudentsResponding toOne Another
Work Togetheras a Class with
TeacherTeaching theWhole Class
WorkIndividually
with Assistancefrom Teacher
WorkIndividually
withoutAssistance
from Teacher
Work in Pairsor Small
Groups withAssistance
from Teacher
Work in Pairsor Small
Groups withoutAssistance
from Teacher
UNITED STATESr
22r
49r
50r
19r
26r
12
MISSOURIr
22r
54r
63r
26r
13r
4
OREGONr
29r
56r
42r
25r
48r
24
Australiar
14r
46r
64r
27r
25r
9
Austriar
6r
52r
51r
23r
19r
7
Belgium (Fl) 10 59 57 36 5 5
Belgium (Fr)s
7s
38s
55s
29s
11s
5
Canadar
12 37 57r
25r
28r
14
Colombia 25 41 55r
19 44r
22
Cyprusr
13r
61r
73r
23r
26r
9
Czech Republic 5 47 72 42 13 8
Denmark 5 41 74 16 18 4
Englands
19s
46s
57s
25s
14s
8
France 11 48 56 26 17 4
Germanys
23s
70s
54s
15s
20s
9
Greece 4 58 60 18 14 3
Hong Kong 11 37 62 17 9 4
Hungary 11 60 65 22 7 1
Icelandr
2r
39r
82r
38r
32r
17
Iran, Islamic Rep. 33 66 55 8 42 10
*Eighth grade in most countries; see Table 2 for more information about the grades tested in each country.Countries shown in italics did not satisfy one or more guidelines for sample participation rates or student sampling (see Figure 1).Background data for Bulgaria and South Africa not available.An "r" indicates teacher response data available for 70-84% of students. An "s" indicates teacher response data available for 50-69% of students.
SO
UR
CE
: IE
A T
hird
Inte
rnat
iona
l Mat
hem
atic
s an
d S
cien
ce S
tudy
(T
IMS
S),
199
4-95
. Mis
sour
i and
Ore
gon
data
col
lect
ed in
199
7.
Percent for "Most or Every Lesson"
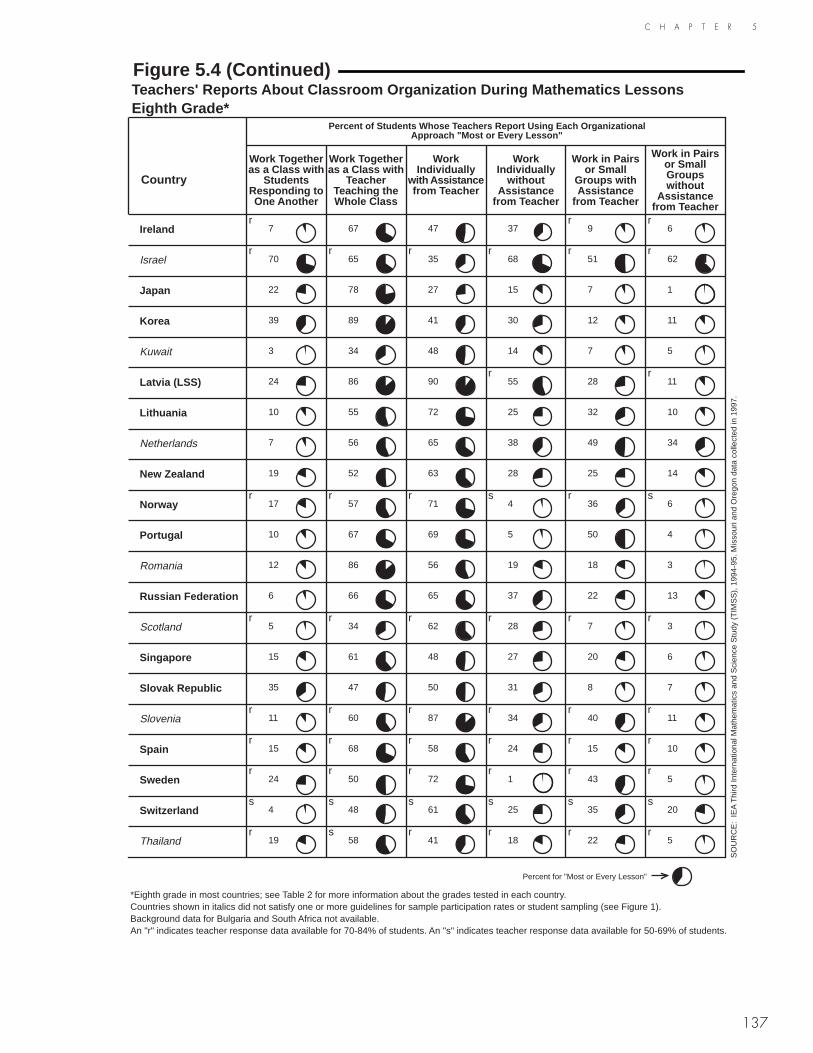
137
C H A P T E R 5
Figure 5.4 (Continued)Teachers' Reports About Classroom Organization During Mathematics LessonsEighth Grade*
Percent of Students Whose Teachers Report Using Each OrganizationalApproach "Most or Every Lesson"
Country
Work Togetheras a Class with
StudentsResponding toOne Another
Work Togetheras a Class with
TeacherTeaching theWhole Class
WorkIndividually
with Assistancefrom Teacher
WorkIndividually
withoutAssistance
from Teacher
Work in Pairsor Small
Groups withAssistance
from Teacher
Work in Pairsor SmallGroupswithout
Assistancefrom Teacher
Irelandr
7 67 47 37r
9r
6
Israelr
70r
65r
35r
68r
51r
62
Japan 22 78 27 15 7 1
Korea 39 89 41 30 12 11
Kuwait 3 34 48 14 7 5
Latvia (LSS) 24 86 90r
55 28r
11
Lithuania 10 55 72 25 32 10
Netherlands 7 56 65 38 49 34
New Zealand 19 52 63 28 25 14
Norwayr
17r
57r
71s
4r
36s
6
Portugal 10 67 69 5 50 4
Romania 12 86 56 19 18 3
Russian Federation 6 66 65 37 22 13
Scotlandr
5r
34r
62r
28r
7r
3
Singapore 15 61 48 27 20 6
Slovak Republic 35 47 50 31 8 7
Sloveniar
11r
60r
87r
34r
40r
11
Spainr
15r
68r
58r
24r
15r
10
Swedenr
24r
50r
72r
1r
43r
5
Switzerlands
4s
48s
61s
25s
35s
20
Thailandr
19s
58r
41r
18r
22r
5
*Eighth grade in most countries; see Table 2 for more information about the grades tested in each country.Countries shown in italics did not satisfy one or more guidelines for sample participation rates or student sampling (see Figure 1).Background data for Bulgaria and South Africa not available.An "r" indicates teacher response data available for 70-84% of students. An "s" indicates teacher response data available for 50-69% of students.
SO
UR
CE
: IE
A T
hird
Inte
rnat
iona
l Mat
hem
atic
s an
d S
cien
ce S
tudy
(T
IMS
S),
199
4-95
. Mis
sour
i and
Ore
gon
data
col
lect
ed in
199
7.
Percent for "Most or Every Lesson"
138
C H A P T E R 5
What Activities Do Students Do in Their Mathematics Lessons?As shown in Table 5.8, mathematics teachers in the participating countries generally reported heavier reliance on curriculum guides than textbooks or examination specifi-cations in deciding which topics to teach. In contrast, in almost all countries, the textbook was the major written source mathematics teachers used in deciding how to present a topic to their classes. The United States as well as Missouri and Oregon fol-lowed the international patterns. In both Missouri and Oregon about three-fourths of the students were in mathematics classrooms where teachers reported relying on cur-riculum guides in deciding what to teach and about one-fourth were in classrooms where teachers used the textbook for this purpose. In Missouri, the percentages essen-tially were reversed for deciding how to present a topic. Twenty percent of the stu-dents in classes where teachers used the curriculum guide and 80% in classes where teachers used the textbook. In Oregon, 96% of the students were in classes where teachers used textbooks as the major source of written information in deciding how to present a topic.
The types of activities teachers asked eighth-grade students to do in mathematics classes varied from country to country. Teachers were asked how often they asked stu-dents to practice computational skills, and the responses are shown in Table 5.9. It appears that in most countries, the majority of the students practice computation in most or every lesson. The results for the United States as well as for Missouri and Oregon were consistent with the international patterns.
The data in Table 5.10 reveal that the majority of students in most countries also were asked to do some type of mathematics reasoning tasks in most or every lesson. The activities TIMSS asked about included explaining the reasoning behind an idea, using tables, charts, or graphs to represent and analyze relationships, working on problems for which there is no immediately obvious solution, and/or writing equations to rep-resent relationships. The results for the United States as well as Missouri and Oregon were consistent with those for most countries. Approximately three-fourths of the stu-dents were asked to do reasoning tasks in most or every lesson, however, in Cyprus, Romania, and the Russian Federation, 55% or more of the students were asked to do at least one of these types of reasoning tasks in every lesson.
Teachers were not asked about the emphasis placed on using things from everyday life in solving mathematics problems, but students were (see Table 5.11). According to eighth-grade students, internationally, only a moderate emphasis is placed on doing these types of problems in mathematics class. Only in Canada, Cyprus, England, Greece, Iran, Latvia(LSS), New Zealand, Spain, and the United States did more than 50% of the students report being asked to do such problems on a frequent basis (pretty often or almost always). The results for Missouri and Oregon were nearly identical to those for the United States, with just about half the students being asked to do such types of problems on a regular basis.
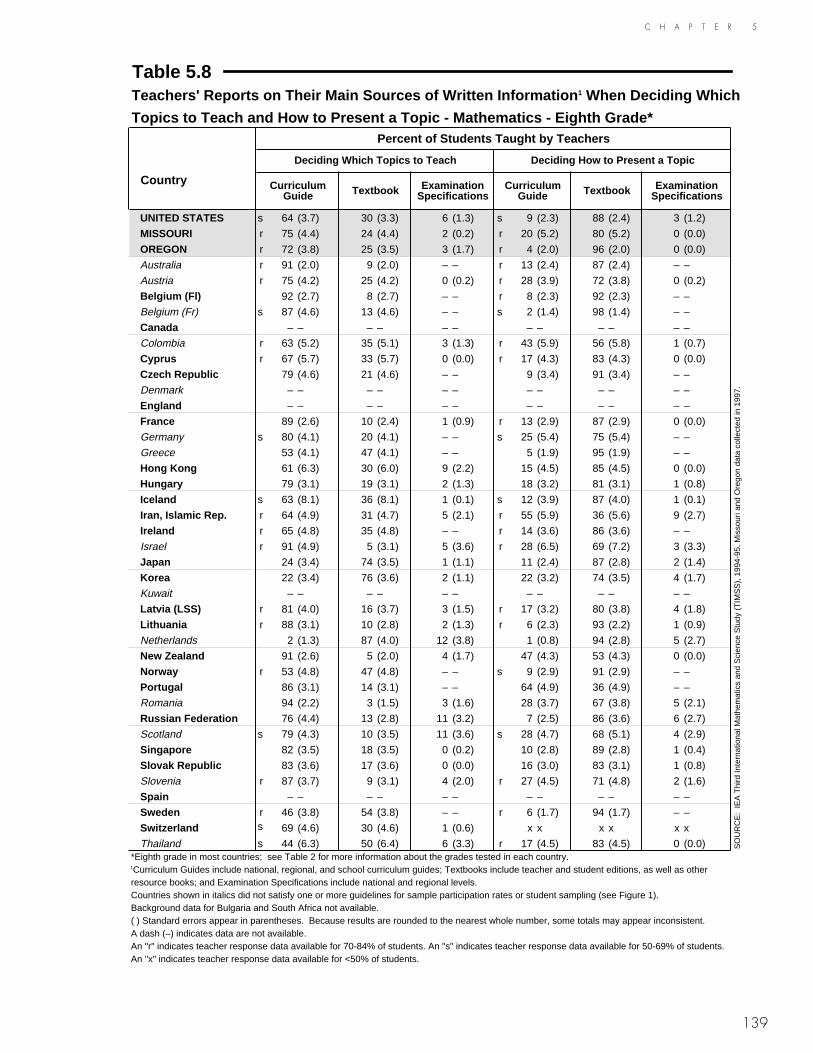
139
C H A P T E R 5
Table 5.8Teachers' Reports on Their Main Sources of Written Information 1 When Deciding Which
Topics to Teach and How to Present a Topic - Mathematics - Eighth Grade*Percent of Students Taught by Teachers
Deciding Which Topics to Teach Deciding How to Present a Topic
Country Curriculum Guide Textbook Examination
SpecificationsCurriculum
Guide Textbook Examination Specifications
UNITED STATES s 64 (3.7) 30 (3.3) 6 (1.3) s 9 (2.3) 88 (2.4) 3 (1.2)
MISSOURI r 75 (4.4) 24 (4.4) 2 (0.2) r 20 (5.2) 80 (5.2) 0 (0.0)
OREGON r 72 (3.8) 25 (3.5) 3 (1.7) r 4 (2.0) 96 (2.0) 0 (0.0)
Australia r 91 (2.0) 9 (2.0) – – r 13 (2.4) 87 (2.4) – –
Austria r 75 (4.2) 25 (4.2) 0 (0.2) r 28 (3.9) 72 (3.8) 0 (0.2)
Belgium (Fl) 92 (2.7) 8 (2.7) – – r 8 (2.3) 92 (2.3) – –
Belgium (Fr) s 87 (4.6) 13 (4.6) – – s 2 (1.4) 98 (1.4) – –
Canada – – – – – – – – – – – –
Colombia r 63 (5.2) 35 (5.1) 3 (1.3) r 43 (5.9) 56 (5.8) 1 (0.7)
Cyprus r 67 (5.7) 33 (5.7) 0 (0.0) r 17 (4.3) 83 (4.3) 0 (0.0)
Czech Republic 79 (4.6) 21 (4.6) – – 9 (3.4) 91 (3.4) – –
Denmark – – – – – – – – – – – –
England – – – – – – – – – – – –
France 89 (2.6) 10 (2.4) 1 (0.9) r 13 (2.9) 87 (2.9) 0 (0.0)
Germany s 80 (4.1) 20 (4.1) – – s 25 (5.4) 75 (5.4) – –
Greece 53 (4.1) 47 (4.1) – – 5 (1.9) 95 (1.9) – –
Hong Kong 61 (6.3) 30 (6.0) 9 (2.2) 15 (4.5) 85 (4.5) 0 (0.0)
Hungary 79 (3.1) 19 (3.1) 2 (1.3) 18 (3.2) 81 (3.1) 1 (0.8)
Iceland s 63 (8.1) 36 (8.1) 1 (0.1) s 12 (3.9) 87 (4.0) 1 (0.1)
Iran, Islamic Rep. r 64 (4.9) 31 (4.7) 5 (2.1) r 55 (5.9) 36 (5.6) 9 (2.7)
Ireland r 65 (4.8) 35 (4.8) – – r 14 (3.6) 86 (3.6) – –
Israel r 91 (4.9) 5 (3.1) 5 (3.6) r 28 (6.5) 69 (7.2) 3 (3.3)
Japan 24 (3.4) 74 (3.5) 1 (1.1) 11 (2.4) 87 (2.8) 2 (1.4)
Korea 22 (3.4) 76 (3.6) 2 (1.1) 22 (3.2) 74 (3.5) 4 (1.7)
Kuwait – – – – – – – – – – – –
Latvia (LSS) r 81 (4.0) 16 (3.7) 3 (1.5) r 17 (3.2) 80 (3.8) 4 (1.8)
Lithuania r 88 (3.1) 10 (2.8) 2 (1.3) r 6 (2.3) 93 (2.2) 1 (0.9)
Netherlands 2 (1.3) 87 (4.0) 12 (3.8) 1 (0.8) 94 (2.8) 5 (2.7)
New Zealand 91 (2.6) 5 (2.0) 4 (1.7) 47 (4.3) 53 (4.3) 0 (0.0)
Norway r 53 (4.8) 47 (4.8) – – s 9 (2.9) 91 (2.9) – –
Portugal 86 (3.1) 14 (3.1) – – 64 (4.9) 36 (4.9) – –
Romania 94 (2.2) 3 (1.5) 3 (1.6) 28 (3.7) 67 (3.8) 5 (2.1)
Russian Federation 76 (4.4) 13 (2.8) 11 (3.2) 7 (2.5) 86 (3.6) 6 (2.7)
Scotland s 79 (4.3) 10 (3.5) 11 (3.6) s 28 (4.7) 68 (5.1) 4 (2.9)
Singapore 82 (3.5) 18 (3.5) 0 (0.2) 10 (2.8) 89 (2.8) 1 (0.4)
Slovak Republic 83 (3.6) 17 (3.6) 0 (0.0) 16 (3.0) 83 (3.1) 1 (0.8)
Slovenia r 87 (3.7) 9 (3.1) 4 (2.0) r 27 (4.5) 71 (4.8) 2 (1.6)
Spain – – – – – – – – – – – –
Sweden r 46 (3.8) 54 (3.8) – – r 6 (1.7) 94 (1.7) – –
Switzerland s 69 (4.6) 30 (4.6) 1 (0.6) x x x x x x
Thailand s 44 (6.3) 50 (6.4) 6 (3.3) r 17 (4.5) 83 (4.5) 0 (0.0)*Eighth grade in most countries; see Table 2 for more information about the grades tested in each country.1Curriculum Guides include national, regional, and school curriculum guides; Textbooks include teacher and student editions, as well as otherresource books; and Examination Specifications include national and regional levels.Countries shown in italics did not satisfy one or more guidelines for sample participation rates or student sampling (see Figure 1). Background data for Bulgaria and South Africa not available.( ) Standard errors appear in parentheses. Because results are rounded to the nearest whole number, some totals may appear inconsistent. A dash (–) indicates data are not available.An "r" indicates teacher response data available for 70-84% of students. An "s" indicates teacher response data available for 50-69% of students.An "x" indicates teacher response data available for <50% of students.
SO
UR
CE
: IE
A T
hird
Inte
rnat
iona
l Mat
hem
atic
s an
d S
cien
ce S
tudy
(T
IMS
S),
199
4-95
. Mis
sour
i and
Ore
gon
data
col
lect
ed in
199
7.

140
C H A P T E R 5
Table 5.9Teachers' Reports on How Often They Ask Students to Practice Computational Skills
Mathematics - Eighth Grade*
Country
Never or Almost Never Some Lessons Most Lessons Every Lesson
Percent of Students
Mean Achievement
Percent of Students
Mean Achieve-
ment
Percent of Students
Mean Achieve-
ment
Percent of Students
Mean Achievement
UNITED STATES r 11 (1.9) 536 (12.9) 31 (3.4) 510 (9.2) 38 (4.4) 485 (6.2) 21 (3.9) 499 (10.4)
MISSOURI r 12 (4.8) 531 (16.6) 27 (5.0) 524 (8.9) 44 (5.1) 490 (6.2) 17 (4.0) 495 (11.7)
OREGON r 9 (2.5) 575 (8.8) 32 (3.8) 534 (10.5) 42 (3.9) 535 (9.8) 17 (2.5) 507 (8.0)
Australia r 10 (2.2) 527 (16.0) 40 (3.4) 544 (7.0) 38 (3.5) 529 (7.0) 13 (2.2) 507 (14.1)
Austria r 3 (1.7) 607 (12.8) 27 (3.6) 568 (7.3) 49 (3.7) 546 (7.0) 21 (2.7) 517 (10.3)
Belgium (Fl) 0 (0.0) ~ ~ 33 (3.8) 603 (6.6) 49 (4.7) 574 (7.9) 18 (3.8) 524 (17.4)
Belgium (Fr) s 4 (4.0) 553 (0.0) 28 (5.2) 530 (8.4) 52 (6.0) 548 (6.6) 16 (4.4) 551 (15.3)
Canada 4 (1.7) 529 (5.1) 36 (4.0) 527 (6.2) 42 (4.1) 531 (5.6) 18 (2.8) 525 (11.2)
Colombia 2 (1.2) ~ ~ 13 (2.9) 391 (8.7) 50 (5.0) 383 (3.9) 35 (5.0) 391 (9.1)
Cyprus r 5 (1.3) 490 (24.7) 38 (5.3) 464 (4.8) 42 (5.3) 469 (3.8) 15 (4.1) 477 (11.2)
Czech Republic 0 (0.0) ~ ~ 23 (4.8) 558 (7.6) 37 (4.6) 567 (8.3) 40 (5.2) 559 (8.2)
Denmark 2 (1.4) ~ ~ 51 (4.1) 507 (4.1) 42 (4.3) 500 (3.6) 6 (2.1) 497 (14.9)
England s 7 (1.6) 542 (20.8) 52 (2.6) 515 (6.0) 34 (2.8) 506 (8.0) 8 (1.9) 539 (17.3)
France 6 (2.1) 534 (10.2) 44 (4.8) 549 (4.5) 44 (4.2) 536 (5.4) 7 (2.1) 517 (15.7)
Germany s 17 (3.3) 479 (12.1) 51 (5.0) 522 (8.4) 25 (4.4) 525 (11.2) 7 (2.8) 501 (26.4)
Greece 7 (2.0) 456 (9.6) 52 (4.3) 482 (4.8) 33 (3.8) 491 (4.5) 8 (2.1) 491 (11.8)
Hong Kong 21 (5.3) 591 (16.1) 23 (4.9) 598 (17.0) 35 (5.1) 575 (13.2) 21 (4.4) 595 (15.4)
Hungary 0 (0.0) ~ ~ 13 (3.1) 543 (10.8) 51 (4.3) 536 (5.1) 35 (4.3) 537 (5.5)
Iceland r 0 (0.0) ~ ~ 12 (4.4) 489 (6.5) 40 (6.1) 479 (6.9) 49 (6.7) 498 (7.7)
Iran, Islamic Rep. 7 (2.8) 416 (14.3) 51 (5.6) 431 (2.3) 29 (5.3) 432 (3.8) 13 (3.3) 432 (6.9)
Ireland 19 (3.9) 524 (14.8) 29 (4.2) 527 (10.7) 37 (4.5) 527 (9.7) 15 (3.1) 531 (19.1)
Israel r 18 (5.9) 518 (18.9) 36 (7.4) 520 (11.2) 41 (6.3) 522 (12.8) 4 (2.6) 545 (44.6)
Japan – – – – – – – – – – – – – – – –
Korea 19 (3.4) 610 (5.9) 53 (4.3) 609 (3.7) 24 (4.0) 612 (5.3) 4 (1.3) 603 (10.8)
Kuwait 1 (0.6) ~ ~ 28 (6.0) 390 (2.4) 51 (7.4) 391 (3.1) 20 (5.9) 393 (5.5)
Latvia (LSS) – – – – – – – – – – – – – – – –
Lithuania 0 (0.0) ~ ~ 2 (1.0) ~ ~ 30 (3.7) 482 (7.5) 68 (3.9) 476 (4.7)
Netherlands – – – – – – – – – – – – – – – –
New Zealand 7 (2.3) 519 (17.9) 45 (3.8) 509 (6.2) 40 (3.6) 505 (6.4) 7 (2.2) 509 (21.2)
Norway r 5 (2.0) 506 (7.9) 59 (4.4) 505 (3.4) 34 (4.4) 509 (4.5) 2 (1.2) ~ ~
Portugal – – – – – – – – – – – – – – – –
Romania 0 (0.0) ~ ~ 12 (2.6) 476 (15.0) 35 (4.1) 482 (8.4) 53 (4.4) 483 (6.2)
Russian Federation 0 (0.4) ~ ~ 13 (2.3) 517 (12.4) 43 (3.6) 545 (9.0) 44 (3.5) 530 (7.9)
Scotland – – – – – – – – – – – – – – – –
Singapore 20 (3.7) 645 (11.6) 30 (4.2) 644 (9.4) 36 (4.4) 639 (7.4) 13 (3.3) 652 (15.2)
Slovak Republic 3 (1.3) 533 (16.2) 35 (4.6) 545 (6.3) 36 (4.2) 550 (5.7) 27 (4.1) 541 (5.8)
Slovenia r 0 (0.0) ~ ~ 21 (4.3) 535 (8.2) 36 (5.5) 551 (6.0) 43 (5.4) 533 (4.8)
Spain r 30 (4.1) 481 (4.8) 42 (4.8) 490 (4.3) 23 (4.3) 491 (7.3) 4 (2.4) 477 (7.0)
Sweden r 2 (0.9) ~ ~ 18 (2.6) 512 (6.8) 51 (3.7) 523 (4.5) 29 (3.6) 515 (6.6)
Switzerland s 4 (1.9) 545 (30.8) 21 (4.0) 560 (18.4) 59 (5.0) 552 (5.9) 16 (3.7) 548 (12.4)
Thailand r 0 (0.0) ~ ~ 13 (4.6) 547 (20.5) 42 (5.9) 519 (10.1) 45 (6.5) 529 (9.6)*Eighth grade in most countries; see Table 2 for more information about the grades tested in each country.Countries shown in italics did not satisfy one or more guidelines for sample participation rates or student sampling (see Figure 1). Background data for Bulgaria and South Africa not available.( ) Standard errors appear in parentheses. Because results are rounded to the nearest whole number, some totals may appear inconsistent. A dash (–) indicates data are not available. A tilde (~) indicates insufficient data to report achievement.An "r" indicates teacher response data available for 70-84% of students. An "s" indicates teacher response data available for 50-69% of students.
SO
UR
CE
: IE
A T
hird
Inte
rnat
iona
l Mat
hem
atic
s an
d S
cien
ce S
tudy
(T
IMS
S),
199
4-95
. Mis
sour
i and
Ore
gon
data
col
lect
ed in
199
7.

141
C H A P T E R 5
Table 5.10Teachers' Reports on How Often They Ask Students to Do Reasoning Tasks 1
Mathematics - Eighth Grade*
Country
Never or Almost Never Some Lessons Most Lessons Every Lesson
Percent of Students
Mean Achieve-
ment
Percent of Students
Mean Achieve-
ment
Percent of Students
Mean Achieve-
ment
Percent of Students
Mean Achieve-
ment
UNITED STATES r 0 (0.0) ~ ~ 24 (3.4) 495 (8.1) 50 (3.5) 498 (5.9) 26 (3.3) 514 (10.2)
MISSOURI r 0 (0.0) ~ ~ 28 (5.2) 485 (7.5) 53 (5.5) 506 (6.2) 19 (3.3) 531 (16.0)
OREGON r 0 (0.0) ~ ~ 22 (3.7) 504 (16.6) 60 (4.4) 542 (4.7) 18 (3.7) 541 (19.3)
Australia r 1 (0.9) ~ ~ 38 (3.0) 520 (8.6) 48 (3.2) 538 (6.0) 13 (2.4) 547 (8.5)
Austria r 0 (0.0) ~ ~ 25 (3.4) 539 (10.2) 57 (4.5) 548 (6.4) 18 (3.4) 561 (10.3)
Belgium (Fl) 0 (0.3) ~ ~ 25 (4.3) 549 (13.7) 56 (4.7) 577 (8.4) 19 (3.4) 604 (9.2)
Belgium (Fr) s 0 (0.0) ~ ~ 21 (4.3) 531 (8.7) 48 (6.1) 542 (6.1) 31 (5.7) 556 (9.3)
Canada 0 (0.0) ~ ~ 19 (3.0) 527 (8.1) 62 (3.8) 529 (4.0) 19 (3.6) 529 (8.7)
Colombia 0 (0.0) ~ ~ 18 (3.5) 377 (4.4) 56 (5.1) 392 (3.4) 26 (5.0) 382 (11.7)
Cyprus r 0 (0.0) ~ ~ 4 (2.2) 468 (41.8) 39 (4.8) 469 (5.6) 58 (5.2) 471 (2.8)
Czech Republic 0 (0.0) ~ ~ 9 (3.4) 570 (20.6) 56 (5.5) 558 (7.3) 36 (5.1) 566 (8.0)
Denmark 4 (2.6) 477 (8.1) 59 (4.8) 507 (3.4) 31 (4.5) 504 (4.3) 5 (2.3) 500 (16.6)
England s 0 (0.0) ~ ~ 25 (2.7) 506 (9.5) 60 (3.0) 518 (5.4) 14 (2.1) 524 (12.3)
France 0 (0.0) ~ ~ 32 (4.3) 528 (5.2) 48 (4.7) 550 (5.5) 20 (3.8) 537 (9.9)
Germany s 1 (1.0) ~ ~ 24 (4.4) 515 (13.5) 58 (4.8) 518 (7.6) 17 (3.9) 510 (11.4)
Greece 1 (0.6) ~ ~ 15 (2.9) 475 (6.7) 47 (4.1) 485 (4.8) 37 (3.9) 488 (6.4)
Hong Kong 1 (1.2) ~ ~ 33 (5.5) 595 (12.6) 58 (5.6) 584 (9.8) 8 (3.2) 578 (28.7)
Hungary 0 (0.0) ~ ~ 8 (2.4) 502 (6.6) 54 (4.6) 538 (5.2) 38 (4.5) 543 (5.8)
Iceland r 1 (1.3) ~ ~ 72 (6.4) 489 (5.1) 22 (5.9) 497 (15.0) 5 (2.3) 468 (19.5)
Iran, Islamic Rep. 0 (0.0) ~ ~ 30 (6.3) 427 (5.6) 47 (6.0) 429 (3.0) 23 (4.5) 434 (4.0)
Ireland 1 (0.6) ~ ~ 55 (4.8) 525 (8.1) 33 (4.3) 520 (8.8) 12 (3.3) 562 (18.0)
Israel r 3 (2.7) 474 (0.0) 9 (4.3) 532 (12.5) 68 (8.1) 528 (9.9) 20 (5.9) 502 (15.7)
Japan 0 (0.0) ~ ~ 7 (2.2) 594 (5.1) 55 (4.4) 604 (2.9) 37 (4.3) 608 (4.4)
Korea 1 (0.7) ~ ~ 3 (1.5) 640 (9.6) 72 (3.7) 608 (3.0) 24 (3.4) 612 (6.8)
Kuwait 2 (2.4) ~ ~ 49 (5.9) 392 (3.4) 41 (5.2) 392 (3.1) 8 (4.1) 386 (3.2)
Latvia (LSS) r 0 (0.0) ~ ~ 16 (3.6) 482 (8.6) 60 (4.8) 490 (4.2) 24 (4.4) 499 (7.1)
Lithuania 0 (0.0) ~ ~ 15 (2.8) 467 (10.6) 59 (4.4) 475 (5.5) 26 (4.0) 490 (6.4)
Netherlands – – – – – – – – – – – – – – – –
New Zealand 0 (0.0) ~ ~ 35 (3.4) 493 (6.9) 53 (3.9) 514 (6.6) 12 (2.7) 525 (12.7)
Norway r 0 (0.0) ~ ~ 47 (4.4) 506 (4.0) 48 (4.3) 508 (3.6) 5 (2.2) 509 (13.0)
Portugal 0 (0.0) ~ ~ 16 (3.1) 454 (5.7) 66 (4.0) 454 (3.1) 18 (3.5) 456 (6.5)
Romania 0 (0.0) ~ ~ 5 (1.7) 444 (21.5) 22 (3.2) 476 (9.4) 74 (3.4) 486 (4.9)
Russian Federation 0 (0.0) ~ ~ 6 (1.9) 508 (13.3) 39 (4.0) 525 (6.1) 55 (4.8) 545 (7.0)
Scotland – – – – – – – – – – – – – – – –
Singapore 0 (0.0) ~ ~ 34 (4.1) 637 (9.5) 57 (4.5) 648 (6.2) 8 (2.3) 642 (20.7)
Slovak Republic 0 (0.0) ~ ~ 5 (2.0) 531 (7.2) 66 (4.0) 545 (4.0) 29 (3.9) 548 (5.7)
Slovenia r 0 (0.0) ~ ~ 13 (3.4) 537 (7.0) 77 (4.6) 541 (4.2) 10 (3.2) 539 (6.9)
Spain r 0 (0.0) ~ ~ 15 (3.3) 469 (5.2) 67 (4.2) 488 (3.5) 18 (3.3) 497 (6.2)
Sweden r 1 (0.5) ~ ~ 35 (3.8) 515 (6.6) 46 (3.7) 520 (4.0) 18 (2.8) 523 (7.5)
Switzerland s 2 (1.6) ~ ~ 31 (4.7) 538 (12.0) 52 (5.0) 556 (7.3) 15 (3.2) 583 (8.9)
Thailand r 0 (0.0) ~ ~ 49 (6.7) 525 (11.5) 34 (6.2) 521 (10.8) 17 (4.7) 544 (11.3)*Eighth grade in most countries; see Table 2 for more information about the grades tested in each country.1Based on most frequent response for: explain reasoning behind an idea; represent and analyze relationships using tables, charts or graphs; work on problems for which there is no immediately obvious method of solution; and write equations to represent relationships.Countries shown in italics did not satisfy one or more guidelines for sample participation rates or student sampling (see Figure 1). Background data for Bulgaria and South Africa not available.( ) Standard errors appear in parentheses. Because results are rounded to the nearest whole number, some totals may appear inconsistent. A dash (–) indicates data are not available. A tilde (~) indicates insufficient data to report achievement.An "r" indicates teacher response data available for 70-84% of students. An "s" indicates teacher response data available for 50-69% of students.
SO
UR
CE
: IE
A T
hird
Inte
rnat
iona
l Mat
hem
atic
s an
d S
cien
ce S
tudy
(T
IMS
S),
199
4-95
. Mis
sour
i and
Ore
gon
data
col
lect
ed in
199
7.

142
C H A P T E R 5
Table 5.11Students' Reports on Using Things from Everyday Life in Solving Mathematics Problems
Eighth Grade*
CountryNever Once in a While Pretty Often Almost Always
Percent of Students
Mean Achieve-
ment
Percent of Students
Mean Achieve-
ment
Percent of Students
Mean Achieve-
ment
Percent of Students
Mean Achieve-
ment
UNITED STATES 14 (0.8) 491 (6.3) 34 (1.1) 515 (4.7) 31 (1.0) 504 (5.0) 21 (0.9) 481 (5.4)
MISSOURI 14 (1.1) 495 (9.6) 35 (1.3) 530 (6.8) 32 (1.3) 499 (6.8) 20 (0.9) 475 (8.1)
OREGON 10 (0.8) 524 (11.7) 37 (1.4) 537 (8.4) 34 (1.3) 524 (7.7) 20 (1.2) 510 (10.9)
Australia 14 (0.6) 512 (5.4) 39 (0.9) 543 (3.9) 34 (0.8) 536 (4.7) 13 (0.6) 513 (5.5)
Austria 21 (1.1) 536 (4.6) 44 (1.2) 546 (4.1) 23 (0.8) 545 (4.8) 12 (0.8) 519 (6.3)
Belgium (Fl) 34 (1.5) 563 (5.0) 41 (1.4) 576 (7.8) 20 (1.0) 567 (5.6) 5 (0.5) 512 (10.2)
Belgium (Fr) 39 (1.5) 525 (4.4) 39 (1.4) 543 (4.1) 15 (1.0) 514 (7.7) 8 (0.7) 510 (11.8)
Canada 13 (1.0) 528 (6.9) 36 (0.8) 534 (2.3) 34 (1.0) 530 (3.3) 17 (0.6) 517 (3.9)
Colombia 20 (1.6) 386 (4.9) 32 (1.5) 392 (4.5) 23 (1.0) 392 (4.5) 25 (1.2) 382 (5.5)
Cyprus 18 (1.0) 464 (3.6) 28 (0.9) 483 (3.4) 38 (1.0) 481 (3.5) 16 (0.9) 462 (4.4)
Czech Republic 16 (0.8) 553 (5.6) 41 (1.1) 565 (5.8) 34 (1.3) 573 (5.5) 9 (0.6) 552 (8.3)
Denmark 28 (1.3) 494 (4.7) 51 (1.5) 510 (3.5) 16 (1.3) 508 (5.2) 5 (0.5) 485 (11.0)
England 11 (0.9) 509 (7.4) 36 (1.2) 508 (4.3) 41 (1.3) 512 (2.7) 12 (0.8) 487 (6.9)
France 24 (1.5) 526 (3.7) 38 (1.0) 543 (3.2) 26 (1.3) 549 (4.5) 12 (0.8) 536 (5.8)
Germany 26 (1.4) 505 (4.8) 45 (1.5) 519 (5.1) 19 (1.1) 511 (6.7) 10 (0.8) 488 (6.6)
Greece 16 (0.8) 467 (5.3) 28 (0.9) 482 (3.9) 36 (1.1) 496 (3.8) 20 (0.7) 484 (4.3)
Hong Kong 26 (1.3) 578 (7.8) 45 (1.1) 599 (6.7) 20 (0.9) 593 (7.2) 8 (0.6) 570 (10.7)
Hungary 29 (1.2) 537 (4.5) 48 (1.2) 545 (4.0) 18 (0.8) 534 (6.3) 6 (0.5) 508 (9.7)
Iceland 35 (2.6) 491 (6.4) 36 (2.4) 497 (4.8) 21 (1.3) 482 (6.9) 8 (1.2) 451 (10.6)
Iran, Islamic Rep. 15 (0.9) 424 (5.6) 24 (1.0) 429 (4.1) 28 (1.2) 432 (2.5) 33 (1.0) 432 (3.4)
Ireland 39 (1.3) 529 (5.0) 33 (0.9) 543 (5.6) 18 (0.9) 524 (7.2) 9 (0.7) 495 (7.5)
Israel 19 (1.9) 527 (10.7) 41 (1.5) 533 (8.6) 23 (1.5) 516 (6.3) 16 (1.1) 511 (6.7)
Japan 25 (1.1) 594 (3.8) 57 (0.9) 608 (2.1) 16 (0.8) 612 (3.4) 2 (0.2) ~ ~
Korea 31 (1.1) 604 (3.4) 50 (1.0) 613 (3.3) 13 (0.7) 613 (6.7) 5 (0.5) 571 (10.8)
Kuwait 22 (1.4) 399 (3.9) 35 (1.7) 396 (3.2) 23 (1.7) 390 (3.7) 21 (1.5) 381 (3.8)
Latvia (LSS) 8 (0.9) 494 (7.2) 18 (0.9) 498 (5.3) 29 (1.0) 495 (4.0) 45 (1.4) 492 (3.9)
Lithuania 20 (1.0) 479 (5.1) 39 (1.0) 481 (4.1) 27 (1.1) 480 (4.8) 14 (0.8) 466 (6.4)
Netherlands 27 (1.5) 522 (10.0) 48 (1.5) 549 (6.1) 17 (1.1) 558 (7.1) 8 (0.7) 545 (11.1)
New Zealand 8 (0.6) 488 (7.1) 38 (1.0) 516 (5.1) 39 (1.1) 512 (4.7) 15 (0.7) 495 (5.9)
Norway 31 (1.2) 493 (3.1) 46 (1.1) 508 (2.5) 18 (0.9) 522 (4.5) 6 (0.5) 487 (8.2)
Portugal 20 (0.9) 457 (3.5) 36 (1.0) 459 (3.1) 24 (0.9) 452 (3.4) 20 (0.9) 448 (3.2)
Romania 15 (0.8) 483 (5.9) 41 (1.2) 492 (4.9) 23 (0.8) 479 (5.2) 21 (0.9) 469 (5.2)
Russian Federation 17 (1.1) 532 (5.0) 52 (1.2) 542 (5.0) 21 (1.6) 541 (9.4) 9 (0.8) 502 (8.5)
Scotland 17 (1.0) 492 (6.2) 35 (1.1) 511 (6.1) 33 (1.1) 502 (6.6) 15 (0.9) 479 (8.4)
Singapore 20 (0.9) 633 (6.3) 41 (1.0) 652 (5.2) 30 (0.9) 645 (5.7) 10 (0.5) 627 (5.9)
Slovak Republic 36 (1.6) 531 (3.7) 43 (1.2) 560 (4.4) 16 (0.9) 557 (5.3) 5 (0.5) 527 (11.2)
Slovenia 15 (0.9) 536 (4.1) 55 (1.2) 543 (3.8) 21 (0.9) 546 (5.0) 8 (0.8) 522 (7.0)
Spain 15 (1.0) 469 (3.6) 31 (1.1) 492 (2.7) 26 (1.0) 495 (2.8) 27 (1.1) 486 (3.1)
Sweden 29 (1.1) 509 (3.8) 41 (0.9) 525 (3.6) 23 (0.8) 525 (3.9) 7 (0.6) 517 (5.8)
Switzerland 17 (1.0) 543 (5.1) 51 (1.1) 552 (3.0) 25 (1.2) 549 (4.3) 7 (0.6) 523 (8.9)
Thailand 19 (0.8) 513 (5.4) 44 (0.9) 524 (5.3) 26 (0.9) 530 (8.1) 11 (0.7) 517 (7.5)*Eighth grade in most countries; see Table 2 for more information about the grades tested in each country.Countries shown in italics did not satisfy one or more guidelines for sample participation rates or student sampling (see Figure 1). Background data for Bulgaria and South Africa not available.( ) Standard errors appear in parentheses. Because results are rounded to the nearest whole number, some totals may appear inconsistent. A tilde (~) indicates insufficient data to report achievement.
SO
UR
CE
: IE
A T
hird
Inte
rnat
iona
l Mat
hem
atic
s an
d S
cien
ce S
tudy
(T
IMS
S),
199
4-95
. Mis
sour
i and
Ore
gon
data
col
lect
ed in
199
7.

C H A P T E R 5
143
How Are Calculators and Computers Used?As shown in Table 5.12, nearly all eighth-grade students reported having a calculator in the home, except in Iran (61%), Romania (62%), and Thailand (68%). In the United States, Missouri, and Oregon 98% to 99% reported a calculator in the home. Interna-tionally, fewer students reported a computer in the home, even though more than three-fourths did so in Denmark, England, Iceland, Ireland, Israel, the Netherlands, and Scotland. Between 50% and 75% so reported in Australia, Austria, Belgium (Flemish), Belgium (French), Canada, Germany, Kuwait, New Zealand, Norway, Sweden, Switzerland, and the United States. Compared to 59% for the United States, 64% of the students in Missouri and 76% of the students in Oregon reported having a computer in the home. Fewer than 20% of the eighth-grade students reported home computers in Colombia, Iran, Latvia (LSS), Romania, and Thailand.
Table 5.13 provides teachers’ reports about how often calculators are used in eighth-grade mathematics classes. Even though calculators appear to be widely available in most countries, teachers reported considerable variation from country to country in the frequency of calculator use in mathematics classrooms. Although using calculators can take the drudgery out of mathematics and free the learner to concentrate on higher-order problem-solving skills, another point of view is that permitting unrestricted use of calculators may damage students’ mastery of basic skills in mathematics.
According to teachers in many of the TIMSS countries, three-fourths or more of the eighth-grade students use calculators almost every day in their mathematics classes. The figures were 84% to 85% for Missouri and Oregon, compared to 62% for the United States. The exceptions to at least weekly usage for the majority of the students were Belgium (Flemish), Greece, Iran, Ireland, Japan, Korea, Romania, and Thailand. Interestingly, Oregon joined England, Iceland, and the Netherlands in reporting that virtually all students used calculators in mathematics class to some extent. In Missouri, teachers reported that 6% of the students never or hardly ever used calculators, which compared to 8% for the U.S. as a whole. As revealed in Table 5.14, teachers reported that students use calculators for a variety of purposes. Across countries, no single use appears to predominate, although checking answers, routine computation, and solving complex problems are frequent purposes in many countries. Using calculators on tests and exams was often less frequent than other uses, ranging from 0% of the students in Japan and Thailand to 64% in Austria. The United States as well as Missouri and Oregon followed the international patterns.
Students’ reports about the frequency of calculator usage in mathematics classes are presented in Table 5.15. Because different response categories were used for the student and teacher versions of the question, a direct comparison is difficult. Interna-tionally, it does appear that fewer students than teachers indicated nearly always using calculators. However, combining the two most frequent categories for students (pretty often and almost always) and comparing those percentages of responses to the two most frequent response categories for teachers (almost every day and once or twice a week) yields a fair degree of agreement between teachers’ and students’ reports. For Missouri and Oregon, students reports of pretty often and almost always corresponded to teachers reports of almost every day.
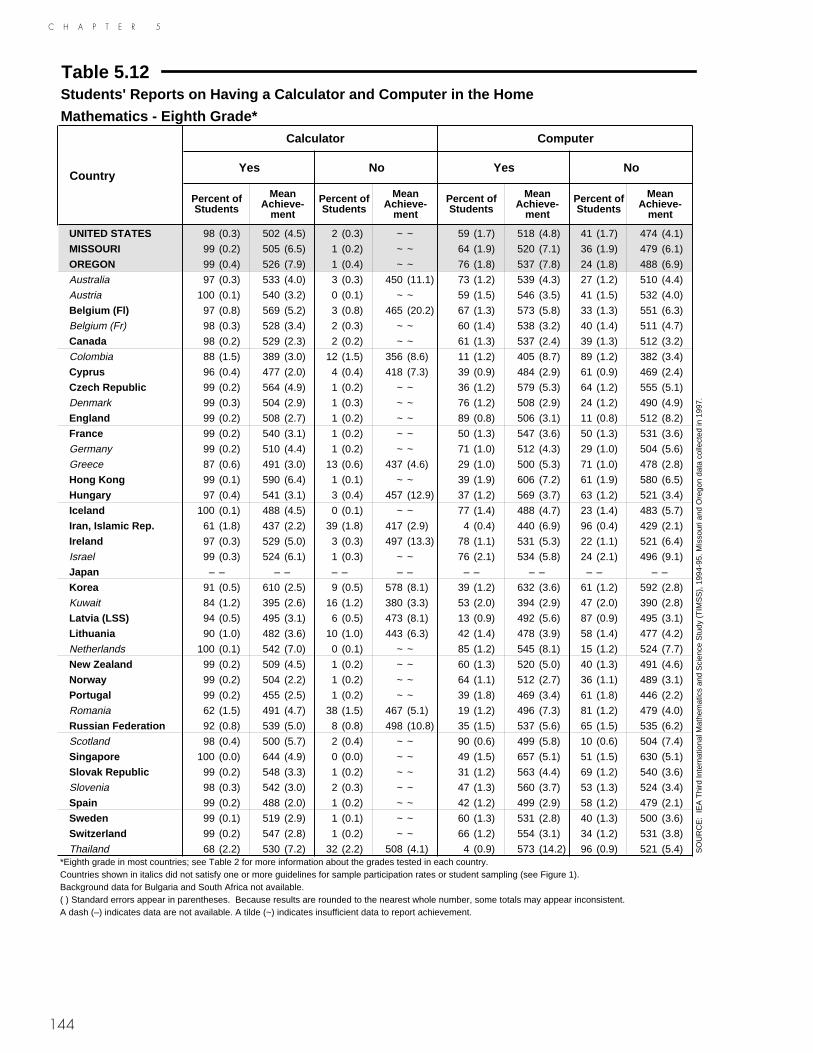
144
C H A P T E R 5
Table 5.12Students' Reports on Having a Calculator and Computer in the Home
Mathematics - Eighth Grade*Calculator Computer
CountryYes No Yes No
Percent of Students
Mean Achieve-
ment
Percent of Students
Mean Achieve-
ment
Percent of Students
Mean Achieve-
ment
Percent of Students
Mean Achieve-
ment
UNITED STATES 98 (0.3) 502 (4.5) 2 (0.3) ~ ~ 59 (1.7) 518 (4.8) 41 (1.7) 474 (4.1)
MISSOURI 99 (0.2) 505 (6.5) 1 (0.2) ~ ~ 64 (1.9) 520 (7.1) 36 (1.9) 479 (6.1)
OREGON 99 (0.4) 526 (7.9) 1 (0.4) ~ ~ 76 (1.8) 537 (7.8) 24 (1.8) 488 (6.9)
Australia 97 (0.3) 533 (4.0) 3 (0.3) 450 (11.1) 73 (1.2) 539 (4.3) 27 (1.2) 510 (4.4)
Austria 100 (0.1) 540 (3.2) 0 (0.1) ~ ~ 59 (1.5) 546 (3.5) 41 (1.5) 532 (4.0)
Belgium (Fl) 97 (0.8) 569 (5.2) 3 (0.8) 465 (20.2) 67 (1.3) 573 (5.8) 33 (1.3) 551 (6.3)
Belgium (Fr) 98 (0.3) 528 (3.4) 2 (0.3) ~ ~ 60 (1.4) 538 (3.2) 40 (1.4) 511 (4.7)
Canada 98 (0.2) 529 (2.3) 2 (0.2) ~ ~ 61 (1.3) 537 (2.4) 39 (1.3) 512 (3.2)
Colombia 88 (1.5) 389 (3.0) 12 (1.5) 356 (8.6) 11 (1.2) 405 (8.7) 89 (1.2) 382 (3.4)
Cyprus 96 (0.4) 477 (2.0) 4 (0.4) 418 (7.3) 39 (0.9) 484 (2.9) 61 (0.9) 469 (2.4)
Czech Republic 99 (0.2) 564 (4.9) 1 (0.2) ~ ~ 36 (1.2) 579 (5.3) 64 (1.2) 555 (5.1)
Denmark 99 (0.3) 504 (2.9) 1 (0.3) ~ ~ 76 (1.2) 508 (2.9) 24 (1.2) 490 (4.9)
England 99 (0.2) 508 (2.7) 1 (0.2) ~ ~ 89 (0.8) 506 (3.1) 11 (0.8) 512 (8.2)
France 99 (0.2) 540 (3.1) 1 (0.2) ~ ~ 50 (1.3) 547 (3.6) 50 (1.3) 531 (3.6)
Germany 99 (0.2) 510 (4.4) 1 (0.2) ~ ~ 71 (1.0) 512 (4.3) 29 (1.0) 504 (5.6)
Greece 87 (0.6) 491 (3.0) 13 (0.6) 437 (4.6) 29 (1.0) 500 (5.3) 71 (1.0) 478 (2.8)
Hong Kong 99 (0.1) 590 (6.4) 1 (0.1) ~ ~ 39 (1.9) 606 (7.2) 61 (1.9) 580 (6.5)
Hungary 97 (0.4) 541 (3.1) 3 (0.4) 457 (12.9) 37 (1.2) 569 (3.7) 63 (1.2) 521 (3.4)
Iceland 100 (0.1) 488 (4.5) 0 (0.1) ~ ~ 77 (1.4) 488 (4.7) 23 (1.4) 483 (5.7)
Iran, Islamic Rep. 61 (1.8) 437 (2.2) 39 (1.8) 417 (2.9) 4 (0.4) 440 (6.9) 96 (0.4) 429 (2.1)
Ireland 97 (0.3) 529 (5.0) 3 (0.3) 497 (13.3) 78 (1.1) 531 (5.3) 22 (1.1) 521 (6.4)
Israel 99 (0.3) 524 (6.1) 1 (0.3) ~ ~ 76 (2.1) 534 (5.8) 24 (2.1) 496 (9.1)
Japan – – – – – – – – – – – – – – – –
Korea 91 (0.5) 610 (2.5) 9 (0.5) 578 (8.1) 39 (1.2) 632 (3.6) 61 (1.2) 592 (2.8)
Kuwait 84 (1.2) 395 (2.6) 16 (1.2) 380 (3.3) 53 (2.0) 394 (2.9) 47 (2.0) 390 (2.8)
Latvia (LSS) 94 (0.5) 495 (3.1) 6 (0.5) 473 (8.1) 13 (0.9) 492 (5.6) 87 (0.9) 495 (3.1)
Lithuania 90 (1.0) 482 (3.6) 10 (1.0) 443 (6.3) 42 (1.4) 478 (3.9) 58 (1.4) 477 (4.2)
Netherlands 100 (0.1) 542 (7.0) 0 (0.1) ~ ~ 85 (1.2) 545 (8.1) 15 (1.2) 524 (7.7)
New Zealand 99 (0.2) 509 (4.5) 1 (0.2) ~ ~ 60 (1.3) 520 (5.0) 40 (1.3) 491 (4.6)
Norway 99 (0.2) 504 (2.2) 1 (0.2) ~ ~ 64 (1.1) 512 (2.7) 36 (1.1) 489 (3.1)
Portugal 99 (0.2) 455 (2.5) 1 (0.2) ~ ~ 39 (1.8) 469 (3.4) 61 (1.8) 446 (2.2)
Romania 62 (1.5) 491 (4.7) 38 (1.5) 467 (5.1) 19 (1.2) 496 (7.3) 81 (1.2) 479 (4.0)
Russian Federation 92 (0.8) 539 (5.0) 8 (0.8) 498 (10.8) 35 (1.5) 537 (5.6) 65 (1.5) 535 (6.2)
Scotland 98 (0.4) 500 (5.7) 2 (0.4) ~ ~ 90 (0.6) 499 (5.8) 10 (0.6) 504 (7.4)
Singapore 100 (0.0) 644 (4.9) 0 (0.0) ~ ~ 49 (1.5) 657 (5.1) 51 (1.5) 630 (5.1)
Slovak Republic 99 (0.2) 548 (3.3) 1 (0.2) ~ ~ 31 (1.2) 563 (4.4) 69 (1.2) 540 (3.6)
Slovenia 98 (0.3) 542 (3.0) 2 (0.3) ~ ~ 47 (1.3) 560 (3.7) 53 (1.3) 524 (3.4)
Spain 99 (0.2) 488 (2.0) 1 (0.2) ~ ~ 42 (1.2) 499 (2.9) 58 (1.2) 479 (2.1)
Sweden 99 (0.1) 519 (2.9) 1 (0.1) ~ ~ 60 (1.3) 531 (2.8) 40 (1.3) 500 (3.6)
Switzerland 99 (0.2) 547 (2.8) 1 (0.2) ~ ~ 66 (1.2) 554 (3.1) 34 (1.2) 531 (3.8)
Thailand 68 (2.2) 530 (7.2) 32 (2.2) 508 (4.1) 4 (0.9) 573 (14.2) 96 (0.9) 521 (5.4)*Eighth grade in most countries; see Table 2 for more information about the grades tested in each country.Countries shown in italics did not satisfy one or more guidelines for sample participation rates or student sampling (see Figure 1). Background data for Bulgaria and South Africa not available.( ) Standard errors appear in parentheses. Because results are rounded to the nearest whole number, some totals may appear inconsistent. A dash (–) indicates data are not available. A tilde (~) indicates insufficient data to report achievement.
SO
UR
CE
: IE
A T
hird
Inte
rnat
iona
l Mat
hem
atic
s an
d S
cien
ce S
tudy
(T
IMS
S),
199
4-95
. Mis
sour
i and
Ore
gon
data
col
lect
ed in
199
7.
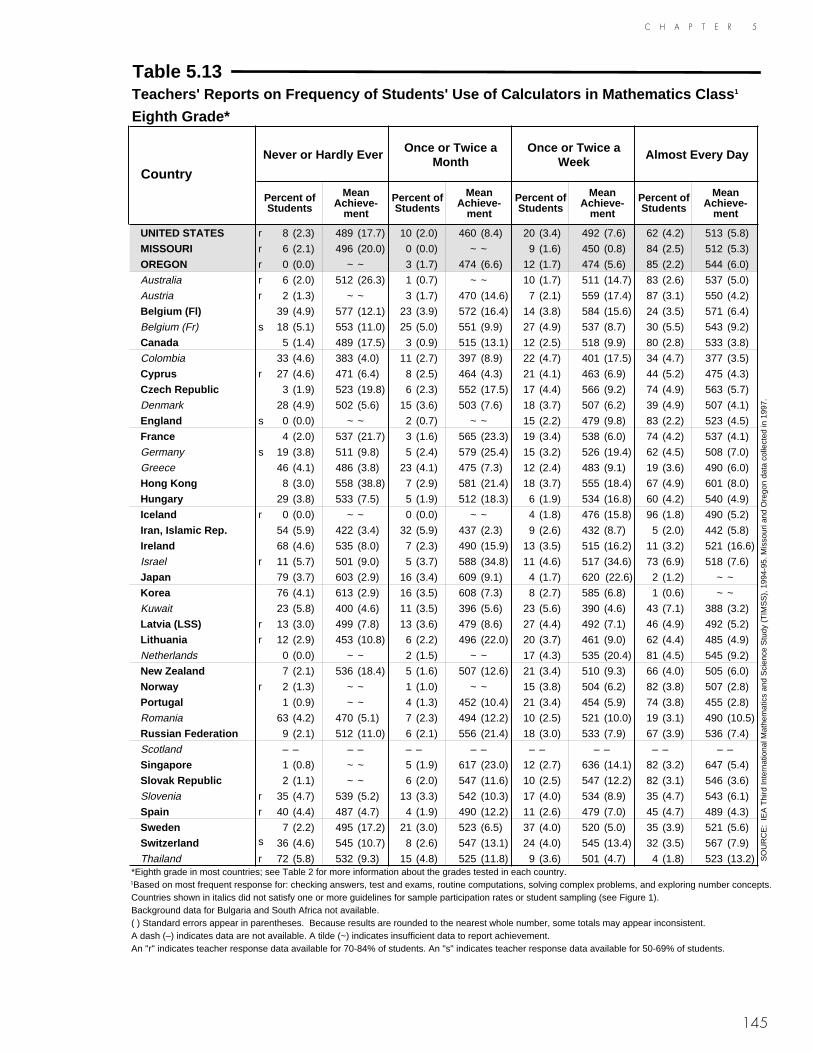
145
C H A P T E R 5
Table 5.13Teachers' Reports on Frequency of Students' Use of Calculators in Mathematics Class 1
Eighth Grade*
CountryNever or Hardly Ever Once or Twice a
MonthOnce or Twice a
WeekAlmost Every Day
Percent of Students
Mean Achieve-
ment
Percent of Students
Mean Achieve-
ment
Percent of Students
Mean Achieve-
ment
Percent of Students
Mean Achieve-
ment
UNITED STATES r 8 (2.3) 489 (17.7) 10 (2.0) 460 (8.4) 20 (3.4) 492 (7.6) 62 (4.2) 513 (5.8)
MISSOURI r 6 (2.1) 496 (20.0) 0 (0.0) ~ ~ 9 (1.6) 450 (0.8) 84 (2.5) 512 (5.3)
OREGON r 0 (0.0) ~ ~ 3 (1.7) 474 (6.6) 12 (1.7) 474 (5.6) 85 (2.2) 544 (6.0)
Australia r 6 (2.0) 512 (26.3) 1 (0.7) ~ ~ 10 (1.7) 511 (14.7) 83 (2.6) 537 (5.0)
Austria r 2 (1.3) ~ ~ 3 (1.7) 470 (14.6) 7 (2.1) 559 (17.4) 87 (3.1) 550 (4.2)
Belgium (Fl) 39 (4.9) 577 (12.1) 23 (3.9) 572 (16.4) 14 (3.8) 584 (15.6) 24 (3.5) 571 (6.4)
Belgium (Fr) s 18 (5.1) 553 (11.0) 25 (5.0) 551 (9.9) 27 (4.9) 537 (8.7) 30 (5.5) 543 (9.2)
Canada 5 (1.4) 489 (17.5) 3 (0.9) 515 (13.1) 12 (2.5) 518 (9.9) 80 (2.8) 533 (3.8)
Colombia 33 (4.6) 383 (4.0) 11 (2.7) 397 (8.9) 22 (4.7) 401 (17.5) 34 (4.7) 377 (3.5)
Cyprus r 27 (4.6) 471 (6.4) 8 (2.5) 464 (4.3) 21 (4.1) 463 (6.9) 44 (5.2) 475 (4.3)
Czech Republic 3 (1.9) 523 (19.8) 6 (2.3) 552 (17.5) 17 (4.4) 566 (9.2) 74 (4.9) 563 (5.7)
Denmark 28 (4.9) 502 (5.6) 15 (3.6) 503 (7.6) 18 (3.7) 507 (6.2) 39 (4.9) 507 (4.1)
England s 0 (0.0) ~ ~ 2 (0.7) ~ ~ 15 (2.2) 479 (9.8) 83 (2.2) 523 (4.5)
France 4 (2.0) 537 (21.7) 3 (1.6) 565 (23.3) 19 (3.4) 538 (6.0) 74 (4.2) 537 (4.1)
Germany s 19 (3.8) 511 (9.8) 5 (2.4) 579 (25.4) 15 (3.2) 526 (19.4) 62 (4.5) 508 (7.0)
Greece 46 (4.1) 486 (3.8) 23 (4.1) 475 (7.3) 12 (2.4) 483 (9.1) 19 (3.6) 490 (6.0)
Hong Kong 8 (3.0) 558 (38.8) 7 (2.9) 581 (21.4) 18 (3.7) 555 (18.4) 67 (4.9) 601 (8.0)
Hungary 29 (3.8) 533 (7.5) 5 (1.9) 512 (18.3) 6 (1.9) 534 (16.8) 60 (4.2) 540 (4.9)
Iceland r 0 (0.0) ~ ~ 0 (0.0) ~ ~ 4 (1.8) 476 (15.8) 96 (1.8) 490 (5.2)
Iran, Islamic Rep. 54 (5.9) 422 (3.4) 32 (5.9) 437 (2.3) 9 (2.6) 432 (8.7) 5 (2.0) 442 (5.8)
Ireland 68 (4.6) 535 (8.0) 7 (2.3) 490 (15.9) 13 (3.5) 515 (16.2) 11 (3.2) 521 (16.6)
Israel r 11 (5.7) 501 (9.0) 5 (3.7) 588 (34.8) 11 (4.6) 517 (34.6) 73 (6.9) 518 (7.6)
Japan 79 (3.7) 603 (2.9) 16 (3.4) 609 (9.1) 4 (1.7) 620 (22.6) 2 (1.2) ~ ~
Korea 76 (4.1) 613 (2.9) 16 (3.5) 608 (7.3) 8 (2.7) 585 (6.8) 1 (0.6) ~ ~
Kuwait 23 (5.8) 400 (4.6) 11 (3.5) 396 (5.6) 23 (5.6) 390 (4.6) 43 (7.1) 388 (3.2)
Latvia (LSS) r 13 (3.0) 499 (7.8) 13 (3.6) 479 (8.6) 27 (4.4) 492 (7.1) 46 (4.9) 492 (5.2)
Lithuania r 12 (2.9) 453 (10.8) 6 (2.2) 496 (22.0) 20 (3.7) 461 (9.0) 62 (4.4) 485 (4.9)
Netherlands 0 (0.0) ~ ~ 2 (1.5) ~ ~ 17 (4.3) 535 (20.4) 81 (4.5) 545 (9.2)
New Zealand 7 (2.1) 536 (18.4) 5 (1.6) 507 (12.6) 21 (3.4) 510 (9.3) 66 (4.0) 505 (6.0)
Norway r 2 (1.3) ~ ~ 1 (1.0) ~ ~ 15 (3.8) 504 (6.2) 82 (3.8) 507 (2.8)
Portugal 1 (0.9) ~ ~ 4 (1.3) 452 (10.4) 21 (3.4) 454 (5.9) 74 (3.8) 455 (2.8)
Romania 63 (4.2) 470 (5.1) 7 (2.3) 494 (12.2) 10 (2.5) 521 (10.0) 19 (3.1) 490 (10.5)
Russian Federation 9 (2.1) 512 (11.0) 6 (2.1) 556 (21.4) 18 (3.0) 533 (7.9) 67 (3.9) 536 (7.4)
Scotland – – – – – – – – – – – – – – – –
Singapore 1 (0.8) ~ ~ 5 (1.9) 617 (23.0) 12 (2.7) 636 (14.1) 82 (3.2) 647 (5.4)
Slovak Republic 2 (1.1) ~ ~ 6 (2.0) 547 (11.6) 10 (2.5) 547 (12.2) 82 (3.1) 546 (3.6)
Slovenia r 35 (4.7) 539 (5.2) 13 (3.3) 542 (10.3) 17 (4.0) 534 (8.9) 35 (4.7) 543 (6.1)
Spain r 40 (4.4) 487 (4.7) 4 (1.9) 490 (12.2) 11 (2.6) 479 (7.0) 45 (4.7) 489 (4.3)
Sweden 7 (2.2) 495 (17.2) 21 (3.0) 523 (6.5) 37 (4.0) 520 (5.0) 35 (3.9) 521 (5.6)
Switzerland s 36 (4.6) 545 (10.7) 8 (2.6) 547 (13.1) 24 (4.0) 545 (13.4) 32 (3.5) 567 (7.9)
Thailand r 72 (5.8) 532 (9.3) 15 (4.8) 525 (11.8) 9 (3.6) 501 (4.7) 4 (1.8) 523 (13.2)*Eighth grade in most countries; see Table 2 for more information about the grades tested in each country.1Based on most frequent response for: checking answers, test and exams, routine computations, solving complex problems, and exploring number concepts.Countries shown in italics did not satisfy one or more guidelines for sample participation rates or student sampling (see Figure 1). Background data for Bulgaria and South Africa not available.( ) Standard errors appear in parentheses. Because results are rounded to the nearest whole number, some totals may appear inconsistent. A dash (–) indicates data are not available. A tilde (~) indicates insufficient data to report achievement.An "r" indicates teacher response data available for 70-84% of students. An "s" indicates teacher response data available for 50-69% of students.
SO
UR
CE
: IE
A T
hird
Inte
rnat
iona
l Mat
hem
atic
s an
d S
cien
ce S
tudy
(T
IMS
S),
199
4-95
. Mis
sour
i and
Ore
gon
data
col
lect
ed in
199
7.

146
C H A P T E R 5
Table 5.14Teachers' Reports on Ways in Which Calculators Are Used at Least Once or
Twice a Week - Mathematics - Eighth Grade*Percent of Students by Type of Use
CountryNever or
Hardly Ever Use
Calculators
Checking Answers
Tests and Exams
Routine Computations
Solving Complex Problems
Exploring Number
Concepts
UNITED STATES r 8 (2.3) r 71 (3.8) r 47 (4.2) r 68 (3.6) r 76 (3.4) r 58 (3.9)
MISSOURI r 6 (2.1) r 82 (4.7) r 61 (5.5) r 86 (2.6) r 81 (4.8) r 74 (4.7)
OREGON r 0 (0.0) r 95 (1.7) r 50 (4.5) r 86 (2.3) r 85 (2.5) r 77 (3.5)
Australia r 6 (2.0) r 84 (3.0) r 47 (3.5) r 92 (2.1) r 76 (3.1) r 48 (3.9)
Austria r 2 (1.3) r 91 (2.9) r 64 (4.2) r 91 (2.2) r 70 (4.6) s 28 (3.7)
Belgium (Fl) 39 (4.9) 24 (3.4) 10 (2.5) 28 (4.3) 15 (3.2) 10 (2.3)
Belgium (Fr) s 18 (5.1) s 53 (6.3) s 16 (4.3) s 41 (5.8) s 39 (5.7) s 24 (5.5)
Canada 5 (1.4) 85 (2.4) r 52 (4.4) 82 (2.5) 86 (2.7) r 63 (4.2)
Colombia 33 (4.6) 33 (4.4) 18 (3.8) 34 (4.7) 32 (4.4) 30 (4.9)
Cyprus r 27 (4.6) r 57 (5.3) r 4 (2.3) r 51 (5.8) r 35 (4.3) r 21 (4.6)
Czech Republic 3 (1.9) 80 (4.2) 22 (5.1) 67 (5.2) 80 (4.0) 16 (5.2)
Denmark 28 (4.9) 52 (4.9) r 5 (2.0) 48 (5.1) 33 (4.4) 25 (4.2)
England s 0 (0.0) s 86 (2.4) s 42 (3.4) s 96 (1.0) s 73 (2.6) s 55 (3.4)
France 4 (2.0) r 91 (2.8) r 57 (4.8) 82 (3.5) 50 (5.0) r 39 (5.3)
Germany s 19 (3.8) s 67 (4.8) s 39 (4.9) s 72 (4.4) s 64 (5.4) s 27 (5.5)
Greece 46 (4.1) 24 (3.5) 2 (1.0) 21 (3.5) 21 (3.4) 8 (2.4)
Hong Kong 8 (3.0) 74 (5.0) 53 (6.1) 79 (5.1) 62 (5.8) 29 (5.4)
Hungary 29 (3.8) r 56 (5.1) r 14 (2.9) r 43 (4.4) r 53 (4.7) r 53 (4.4)
Iceland r 0 (0.0) r 91 (3.8) r 51 (8.4) r 97 (2.1) r 99 (0.1) r 69 (6.2)
Iran, Islamic Rep. 54 (5.9) 4 (1.6) 2 (1.7) 8 (2.4) 8 (2.8) 6 (1.6)
Ireland 68 (4.6) 18 (4.0) 4 (2.0) r 17 (3.9) r 7 (2.5) r 4 (1.8)
Israel r 11 (5.7) r 75 (6.4) r 57 (7.9) r 72 (6.3) r 56 (7.4) r 43 (8.5)
Japan 79 (3.7) 1 (0.6) 0 (0.0) 3 (1.5) 2 (0.7) 3 (1.4)
Korea 76 (4.1) 1 (0.9) 1 (0.6) 6 (2.5) 4 (1.6) 1 (0.8)
Kuwait 23 (5.8) 51 (7.4) 25 (6.5) 52 (6.9) 48 (6.8) 22 (6.6)
Latvia (LSS) r 13 (3.0) r 50 (4.9) r 8 (2.8) r 59 (4.2) r 49 (5.2) r 17 (3.9)
Lithuania r 12 (2.9) r 72 (4.1) r 9 (2.9) r 66 (4.1) r 58 (4.5) r 18 (3.7)
Netherlands 0 (0.0) 83 (4.5) 50 (6.1) 97 (1.8) 67 (4.9) 46 (5.3)
New Zealand 7 (2.1) 41 (4.3) 20 (3.1) 85 (3.0) 70 (4.0) 54 (4.5)
Norway r 2 (1.3) r 93 (2.4) r 24 (4.0) r 91 (2.8) r 72 (4.7) r 35 (4.8)
Portugal 1 (0.9) 86 (2.6) 31 (3.5) 76 (3.4) 67 (3.7) 55 (4.2)
Romania 63 (4.2) 20 (3.4) 1 (1.1) 25 (3.3) 11 (2.7) 9 (2.3)
Russian Federation 9 (2.1) 73 (4.5) 15 (2.8) 76 (3.9) 45 (5.2) 6 (1.7)
Scotland – – – – – – – – – – – –
Singapore 1 (0.8) 89 (2.7) 47 (4.7) 83 (3.4) 82 (3.7) 57 (4.4)
Slovak Republic 2 (1.1) 79 (3.7) 31 (4.1) 72 (4.6) 77 (3.8) 60 (4.3)
Slovenia r 35 (4.7) r 39 (5.2) r 4 (2.1) r 38 (5.3) r 28 (4.6) r 6 (2.5)
Spain r 40 (4.4) r 46 (4.6) r 16 (3.4) r 35 (4.4) r 39 (4.8) r 29 (4.2)
Sweden 7 (2.2) r 42 (4.1) r 13 (2.8) r 57 (4.1) r 60 (3.6) r 25 (3.5)
Switzerland s 36 (4.6) s 47 (4.9) s 16 (2.7) s 48 (4.3) s 35 (3.9) s 17 (2.8)
Thailand r 72 (5.8) r 7 (3.0) r 0 (0.0) r 5 (2.4) r 9 (3.2) s 10 (3.6)*Eighth grade in most countries; see Table 2 for more information about the grades tested in each country.Countries shown in italics did not satisfy one or more guidelines for sample participation rates or student sampling (see Figure 1). Background data for Bulgaria and South Africa not available.( ) Standard errors appear in parentheses. Because results are rounded to the nearest whole number, some totals may appear inconsistent. A dash (–) indicates data are not available.An "r" indicates teacher response data available for 70-84% of students. An "s" indicates teacher response data available for 50-69% of students.
SO
UR
CE
: IE
A T
hird
Inte
rnat
iona
l Mat
hem
atic
s an
d S
cien
ce S
tudy
(T
IMS
S),
199
4-95
. Mis
sour
i and
Ore
gon
data
col
lect
ed in
199
7.

147
C H A P T E R 5
Table 5.15Students' Reports on Frequency of Using Calculators in Mathematics Class - Eighth Grade*
CountryNever Once in a While Pretty Often Almost Always
Percent of Students
Mean Achieve-
ment
Percent of Students
Mean Achieve-
ment
Percent of Students
Mean Achieve-
ment
Percent of Students
Mean Achieve-
ment
UNITED STATES 10 (1.6) 464 (9.4) 20 (1.6) 498 (5.8) 26 (1.2) 501 (5.3) 44 (2.7) 511 (5.6)
MISSOURI 4 (1.4) 483 (39.4) 11 (1.5) 489 (12.4) 24 (1.7) 512 (8.3) 61 (3.0) 506 (7.8)
OREGON 2 (0.4) ~ ~ 8 (1.3) 499 (11.0) 30 (1.2) 516 (8.1) 60 (2.1) 537 (8.5)
Australia 4 (1.1) 495 (28.4) 10 (0.9) 509 (7.5) 31 (1.1) 533 (4.4) 55 (1.9) 539 (4.6)
Austria 2 (0.7) ~ ~ 7 (0.8) 515 (9.9) 17 (1.2) 542 (7.2) 74 (2.1) 542 (3.3)
Belgium (Fl) 34 (4.1) 571 (12.4) 36 (2.4) 577 (6.1) 20 (2.5) 556 (10.5) 10 (1.6) 530 (11.7)
Belgium (Fr) 37 (2.7) 526 (4.6) 41 (1.9) 543 (3.9) 14 (1.6) 516 (8.4) 9 (1.1) 491 (8.6)
Canada 6 (1.2) 493 (8.7) 22 (1.6) 523 (3.6) 33 (1.2) 532 (3.0) 38 (2.2) 534 (4.4)
Colombia 54 (2.5) 394 (3.2) 26 (1.3) 382 (4.4) 9 (0.9) 393 (6.9) 11 (1.1) 371 (4.1)
Cyprus 30 (2.0) 480 (3.5) 39 (1.4) 477 (3.1) 21 (1.0) 475 (4.2) 10 (0.9) 452 (4.5)
Czech Republic 5 (1.2) 552 (12.0) 33 (2.5) 553 (6.1) 37 (2.1) 578 (6.8) 24 (1.9) 560 (5.5)
Denmark 32 (3.7) 506 (4.0) 37 (2.6) 499 (4.2) 19 (1.7) 514 (6.3) 12 (1.7) 498 (5.0)
England 0 (0.1) ~ ~ 9 (0.9) 467 (6.6) 46 (1.6) 507 (4.3) 45 (1.8) 517 (3.3)
France 2 (0.9) ~ ~ 27 (1.5) 539 (4.0) 40 (1.3) 548 (3.4) 30 (1.4) 530 (5.1)
Germany 25 (2.8) 502 (7.1) 19 (1.7) 527 (9.1) 20 (1.5) 517 (7.6) 35 (2.0) 504 (6.2)
Greece 51 (2.6) 482 (3.9) 26 (1.3) 494 (4.0) 14 (1.1) 489 (5.6) 9 (1.0) 473 (6.0)
Hong Kong 8 (2.3) 572 (27.9) 9 (1.2) 567 (15.8) 33 (1.9) 593 (6.4) 49 (2.5) 595 (7.0)
Hungary 20 (2.2) 521 (6.2) 39 (1.9) 539 (4.0) 24 (1.3) 547 (5.9) 17 (1.3) 547 (5.7)
Iceland 1 (0.3) ~ ~ 6 (0.9) 474 (10.9) 32 (2.0) 491 (5.5) 61 (2.3) 487 (4.8)
Iran, Islamic Rep. 79 (1.4) 432 (2.4) 13 (1.0) 435 (4.7) 4 (0.5) 415 (4.4) 4 (0.5) 400 (6.5)
Ireland 79 (1.7) 535 (5.3) 14 (1.0) 517 (7.0) 4 (0.6) 493 (9.4) 3 (0.5) 484 (11.7)
Israel 7 (1.8) 517 (12.5) 21 (2.2) 536 (7.6) 27 (1.6) 532 (8.6) 45 (3.4) 515 (6.2)
Japan 75 (2.3) 607 (2.1) 21 (1.9) 603 (3.4) 3 (0.7) 575 (7.0) 0 (0.1) ~ ~
Korea 93 (0.5) 613 (2.5) 5 (0.4) 570 (9.7) 1 (0.3) ~ ~ 1 (0.2) ~ ~
Kuwait 27 (2.9) 394 (3.3) 35 (1.9) 395 (3.6) 23 (1.5) 391 (3.9) 14 (1.9) 387 (3.7)
Latvia (LSS) 14 (1.4) 502 (5.7) 27 (1.4) 499 (4.1) 35 (1.3) 492 (4.1) 24 (2.0) 487 (5.2)
Lithuania 17 (1.7) 476 (6.5) 34 (1.5) 472 (3.9) 24 (1.2) 484 (4.5) 25 (1.7) 482 (5.8)
Netherlands 1 (0.2) ~ ~ 9 (1.3) 514 (16.9) 36 (1.7) 547 (7.2) 54 (2.1) 544 (7.4)
New Zealand 6 (1.1) 519 (13.3) 20 (1.7) 503 (6.9) 37 (1.3) 511 (5.3) 36 (2.0) 510 (6.1)
Norway 4 (1.0) 465 (9.6) 25 (1.7) 497 (3.3) 39 (1.2) 509 (3.1) 33 (1.9) 508 (3.1)
Portugal 3 (0.6) 455 (7.3) 27 (1.6) 457 (3.1) 34 (1.2) 454 (3.5) 35 (1.5) 454 (2.8)
Romania 57 (1.7) 484 (4.7) 25 (1.2) 490 (5.4) 9 (0.6) 475 (6.8) 9 (0.8) 465 (7.3)
Russian Federation 9 (1.4) 538 (11.3) 37 (2.3) 537 (7.2) 25 (1.6) 537 (5.3) 29 (1.6) 534 (5.7)
Scotland 2 (0.7) ~ ~ 16 (1.5) 498 (7.0) 48 (1.5) 501 (5.3) 34 (2.0) 498 (8.8)
Singapore 1 (0.4) ~ ~ 16 (1.5) 613 (6.0) 54 (1.2) 648 (5.0) 29 (1.7) 655 (5.6)
Slovak Republic 4 (0.7) 550 (13.7) 24 (1.7) 543 (4.9) 37 (1.3) 554 (4.3) 35 (1.7) 544 (4.5)
Slovenia 44 (3.0) 544 (4.1) 38 (2.2) 540 (4.2) 10 (1.0) 534 (7.9) 8 (0.8) 535 (8.5)
Spain 49 (3.3) 493 (2.9) 23 (1.9) 492 (3.4) 12 (1.1) 479 (5.3) 17 (2.0) 471 (4.3)
Sweden 4 (0.9) 482 (13.1) 42 (2.2) 520 (3.2) 36 (1.7) 527 (3.9) 18 (2.2) 511 (5.2)
Switzerland 45 (2.9) 538 (4.6) 22 (1.6) 552 (5.1) 16 (1.2) 553 (5.5) 16 (1.3) 561 (6.3)
Thailand 59 (2.2) 514 (4.7) 34 (1.7) 535 (8.0) 5 (0.8) 543 (16.3) 2 (0.3) ~ ~*Eighth grade in most countries; see Table 2 for more information about the grades tested in each country.Countries shown in italics did not satisfy one or more guidelines for sample participation rates or student sampling (see Figure 1). Background data for Bulgaria and South Africa not available.( ) Standard errors appear in parentheses. Because results are rounded to the nearest whole number, some totals may appear inconsistent. A tilde (~) indicates insufficient data to report achievement.
SO
UR
CE
: IE
A T
hird
Inte
rnat
iona
l Mat
hem
atic
s an
d S
cien
ce S
tudy
(T
IMS
S),
199
4-95
. Mis
sour
i and
Ore
gon
data
col
lect
ed in
199
7.
148
C H A P T E R 5
Table 5.16 contains teachers’ reports about how often computers are used in mathe-matics class to solve exercises or problems, and Table 5.17 contains students’ responses to a similar question. Internationally, substantial percentages of teachers and students agreed that the computer is almost never used in most students’ mathe-matics lessons. Teachers and students agreed on moderate use of computers (more than 20% of the students in some lessons) in Austria, Denmark, England, Sweden, and the United States. For both teachers and students, the reports about computer use in Oregon and Missouri were nearly identical to those for the United States as a whole. That is, teachers reported that approximately 20% of the students use computers in at least some lessons. According to students, 10% use computers almost always or pretty often, while 21% use them once in a while.

149
C H A P T E R 5
Table 5.16Teachers' Reports on Frequency of Using Computers in Mathematics Class to
Solve Exercises or Problems - Eighth Grade*
CountryNever or Almost Never Some Lessons Most or Every Lesson
Percent of Students
Mean Achievement
Percent of Students
Mean Achievement
Percent of Students
Mean Achievement
UNITED STATES r 76 (3.1) 502 (5.9) 21 (3.2) 497 (9.1) 3 (1.7) 506 (22.2)
MISSOURI r 79 (4.8) 503 (5.3) 20 (4.8) 510 (16.2) 1 (0.1) ~ ~
OREGON r 81 (3.3) 529 (6.6) 19 (3.3) 551 (10.9) 0 (0.0) ~ ~
Australia r 78 (3.2) 531 (5.3) 21 (3.2) 535 (9.6) 0 (0.2) ~ ~
Austria r 69 (4.5) 551 (5.6) 29 (4.4) 542 (7.3) 1 (0.5) ~ ~
Belgium (Fl) 99 (0.7) 574 (4.6) 1 (0.7) ~ ~ 0 (0.0) ~ ~
Belgium (Fr) s 95 (2.4) 543 (4.4) 4 (2.2) 555 (25.7) 1 (1.0) ~ ~
Canada 82 (3.5) 533 (2.9) 18 (3.5) 511 (10.3) 1 (0.5) ~ ~
Colombia 94 (2.2) 387 (3.8) 5 (2.0) 391 (12.9) 1 (0.9) ~ ~
Cyprus r 89 (3.3) 468 (2.9) 11 (3.3) 476 (11.4) 0 (0.0) ~ ~
Czech Republic 74 (5.4) 560 (6.4) 23 (5.1) 568 (8.8) 4 (2.8) 549 (0.7)
Denmark 38 (4.5) 500 (4.5) 62 (4.5) 507 (2.9) 0 (0.0) ~ ~
England s 52 (3.9) 517 (5.9) 45 (3.7) 514 (6.9) 2 (1.0) ~ ~
France 86 (3.2) 541 (3.3) 14 (3.2) 536 (11.5) 0 (0.0) ~ ~
Germany s 87 (3.1) 510 (5.8) 13 (3.1) 550 (12.3) 0 (0.0) ~ ~
Greece 85 (2.9) 481 (3.3) 12 (2.5) 500 (7.7) 2 (1.4) ~ ~
Hong Kong 90 (3.5) 590 (7.3) 9 (3.7) 576 (29.4) 1 (1.2) ~ ~
Hungary – – – – – – – – – – – –
Iceland – – – – – – – – – – – –
Iran, Islamic Rep. 93 (5.5) 429 (2.3) 6 (5.5) 435 (18.2) 1 (1.0) ~ ~
Ireland 99 (0.9) 528 (6.0) 1 (0.9) ~ ~ 0 (0.0) ~ ~
Israel – – – – – – – – – – – –
Japan 90 (2.7) 604 (2.5) 9 (2.6) 612 (10.1) 1 (0.5) ~ ~
Korea 96 (1.6) 610 (2.5) 3 (1.3) 618 (21.6) 1 (1.0) ~ ~
Kuwait 73 (7.1) 393 (2.9) 21 (6.5) 387 (3.4) 6 (3.5) 389 (10.6)
Latvia (LSS) r 97 (1.6) 490 (3.3) 3 (1.6) 494 (14.9) 0 (0.0) ~ ~
Lithuania 94 (1.8) 480 (4.1) 6 (1.8) 450 (12.3) 0 (0.0) ~ ~
Netherlands – – – – – – – – – – – –
New Zealand 86 (3.1) 506 (4.4) 14 (3.1) 526 (15.7) 0 (0.0) ~ ~
Norway r 90 (2.6) 507 (2.7) 10 (2.6) 509 (5.1) 0 (0.0) ~ ~
Portugal 97 (1.5) 454 (2.6) 3 (1.5) 482 (23.2) 0 (0.0) ~ ~
Romania 96 (1.7) 481 (4.4) 4 (1.7) 512 (20.6) 0 (0.0) ~ ~
Russian Federation 78 (2.6) 533 (6.8) 15 (2.2) 537 (6.9) 6 (2.4) 566 (14.6)
Scotland – – – – – – – – – – – –
Singapore 92 (2.7) 643 (5.3) 8 (2.7) 652 (15.3) 0 (0.0) ~ ~
Slovak Republic 95 (1.5) 543 (3.3) 4 (1.3) 592 (13.5) 1 (0.8) ~ ~
Slovenia r 69 (4.5) 539 (4.5) 27 (4.5) 545 (7.2) 4 (2.1) 527 (21.9)
Spain r 89 (3.1) 488 (2.6) 11 (3.1) 472 (9.1) 0 (0.0) ~ ~
Sweden r 74 (2.9) 519 (4.1) 25 (2.9) 515 (7.3) 0 (0.3) ~ ~
Switzerland s 87 (3.2) 549 (5.6) 13 (3.3) 577 (13.0) 1 (0.8) ~ ~
Thailand r 97 (2.0) 527 (7.5) 1 (1.5) ~ ~ 2 (1.3) ~ ~*Eighth grade in most countries; see Table 2 for more information about the grades tested in each country.Countries shown in italics did not satisfy one or more guidelines for sample participation rates or student sampling (see Figure 1). Background data for Bulgaria and South Africa not available.( ) Standard errors appear in parentheses. Because results are rounded to the nearest whole number, some totals may appear inconsistent. A dash (–) indicates data are not available. A tilde (~) indicates insufficient data to report achievement.An "r" indicates teacher response data available for 70-84% of students. An "s" indicates teacher response data available for 50-69% of students.
SO
UR
CE
: IE
A T
hird
Inte
rnat
iona
l Mat
hem
atic
s an
d S
cien
ce S
tudy
(T
IMS
S),
199
4-95
. Mis
sour
i and
Ore
gon
data
col
lect
ed in
199
7.

150
C H A P T E R 5
Table 5.17Students' Reports on Frequency of Using Computers in Mathematics Class
Eighth Grade*
CountryNever Once in a While
Almost Always or Pretty Often
Percent of Students
Mean Achievement
Percent of Students
Mean Achievement
Percent of Students
Mean Achievement
UNITED STATES 69 (2.5) 504 (4.6) 21 (1.8) 514 (6.8) 10 (1.5) 458 (7.5)
MISSOURI 69 (4.9) 509 (7.1) 21 (3.5) 518 (9.2) 10 (2.1) 448 (8.7)
OREGON 70 (3.3) 530 (8.4) 21 (2.1) 530 (8.2) 10 (1.5) 485 (12.7)
Australia 77 (2.1) 536 (4.4) 18 (1.7) 536 (7.6) 5 (0.9) 477 (11.4)
Austria 62 (2.6) 545 (3.8) 32 (2.2) 540 (5.4) 6 (0.8) 487 (7.9)
Belgium (Fl) 94 (1.1) 568 (5.7) 4 (0.9) 544 (15.7) 2 (0.6) ~ ~
Belgium (Fr) 94 (1.4) 532 (3.3) 3 (0.7) 531 (22.2) 4 (0.9) 437 (20.4)
Canada 82 (1.4) 532 (2.4) 13 (1.3) 528 (8.4) 5 (0.4) 476 (6.7)
Colombia 95 (0.5) 389 (2.9) 3 (0.4) 390 (6.9) 3 (0.3) 370 (5.9)
Cyprus 73 (0.9) 485 (1.8) 16 (0.9) 459 (4.9) 11 (0.8) 432 (4.3)
Czech Republic 88 (2.9) 564 (5.1) 8 (1.9) 560 (12.5) 4 (1.8) 570 (18.0)
Denmark 40 (3.6) 505 (4.0) 51 (3.0) 507 (3.6) 9 (1.3) 486 (8.4)
England 45 (2.6) 512 (4.9) 46 (2.3) 514 (4.3) 9 (1.2) 457 (6.8)
France 88 (2.4) 542 (3.3) 8 (2.0) 531 (10.8) 4 (0.8) 492 (9.6)
Germany 84 (2.1) 511 (4.6) 11 (1.9) 533 (9.3) 5 (0.7) 455 (7.7)
Greece 83 (1.0) 490 (2.9) 10 (0.7) 471 (6.4) 7 (0.6) 443 (6.2)
Hong Kong 91 (0.7) 592 (6.2) 6 (0.5) 580 (11.4) 3 (0.4) 559 (16.7)
Hungary 92 (0.8) 539 (3.2) 5 (0.8) 548 (12.3) 2 (0.4) ~ ~
Iceland 81 (2.4) 494 (4.4) 11 (1.3) 479 (5.1) 8 (1.6) 442 (9.8)
Iran, Islamic Rep. 92 (0.8) 432 (2.3) 3 (0.4) 416 (5.2) 4 (0.5) 399 (5.6)
Ireland 96 (1.1) 531 (5.0) 3 (0.9) 498 (30.4) 1 (0.3) ~ ~
Israel 76 (4.5) 530 (6.9) 12 (2.6) 523 (11.5) 11 (3.0) 489 (15.7)
Japan 77 (3.3) 604 (2.9) 19 (2.6) 611 (4.6) 4 (1.2) 604 (14.5)
Korea 93 (0.7) 611 (2.4) 5 (0.5) 587 (9.4) 2 (0.3) ~ ~
Kuwait 78 (1.8) 398 (2.8) 8 (1.0) 380 (6.6) 14 (1.4) 371 (3.1)
Latvia (LSS) 91 (1.1) 497 (3.1) 6 (0.9) 484 (8.5) 3 (0.4) 458 (12.9)
Lithuania 92 (1.0) 481 (3.4) 5 (0.8) 456 (8.8) 3 (0.5) 456 (13.2)
Netherlands 81 (3.4) 536 (7.8) 18 (3.3) 575 (13.8) 2 (0.4) ~ ~
New Zealand 79 (2.5) 512 (4.5) 17 (2.1) 514 (8.7) 4 (0.6) 442 (9.1)
Norway 88 (1.5) 508 (2.4) 10 (1.5) 487 (6.1) 2 (0.3) ~ ~
Portugal 97 (0.6) 455 (2.5) 2 (0.6) ~ ~ 1 (0.2) ~ ~
Romania 78 (1.2) 487 (4.5) 8 (0.7) 471 (8.7) 14 (0.9) 468 (8.8)
Russian Federation 94 (0.8) 538 (5.7) 4 (0.6) 528 (6.8) 2 (0.3) ~ ~
Scotland 54 (3.1) 504 (6.9) 37 (2.5) 503 (6.1) 9 (1.3) 459 (4.7)
Singapore 90 (1.5) 644 (5.2) 8 (1.4) 653 (8.2) 2 (0.4) ~ ~
Slovak Republic 94 (1.0) 549 (3.5) 5 (1.0) 539 (9.6) 1 (0.2) ~ ~
Slovenia 89 (0.7) 547 (3.1) 7 (0.6) 494 (7.0) 3 (0.4) 492 (10.1)
Spain 93 (1.3) 490 (2.0) 4 (0.8) 466 (7.5) 3 (0.7) 452 (12.4)
Sweden 61 (3.2) 527 (3.5) 30 (2.7) 521 (3.8) 9 (1.1) 467 (5.6)
Switzerland 82 (2.1) 549 (3.2) 14 (1.8) 546 (6.0) 4 (0.6) 512 (16.9)
Thailand 91 (1.0) 522 (5.8) 6 (0.6) 535 (10.3) 3 (0.5) 509 (9.2)*Eighth grade in most countries; see Table 2 for more information about the grades tested in each country.Countries shown in italics did not satisfy one or more guidelines for sample participation rates or student sampling (see Figure 1). Background data for Bulgaria and South Africa not available.( ) Standard errors appear in parentheses. Because results are rounded to the nearest whole number, some totals may appear inconsistent. A tilde (~) indicates insufficient data to report achievement.
SO
UR
CE
: IE
A T
hird
Inte
rnat
iona
l Mat
hem
atic
s an
d S
cien
ce S
tudy
(T
IMS
S),
199
4-95
. Mis
sour
i and
Ore
gon
data
col
lect
ed in
199
7.
C H A P T E R 5
151
How Much Homework Are Students Assigned?Although teachers often give students time to begin or review homework assignments in class, homework is generally considered a method of extending the time spent on regular classroom lessons. Table 5.18 presents teachers’ reports about how often they assigned homework and the typical lengths of such assignments. Internationally, most eighth-grade students were assigned mathematics homework at least three times a week. Most typically, for the majority of students the assignments were 30 minutes or less in length. Homework assignments were more than 30 minutes for the majority of students in Cyprus, Greece, Romania, the Russian Federation, Singapore, and Thailand. For students in Missouri, teachers reported that 89% were assigned homework at least three times a week, with 67% receiving assignments of 30 minutes or less and 22% receiving longer assignments. In Oregon, 82% were assigned homework this fre-quently, with 56% receiving shorter assignments and 26% receiving longer ones.
Homework generally has its biggest impact when it is commented on and graded by teachers. Table 5.19 presents teachers’ reports about their use of students’ written mathematics homework. In Missouri and Oregon, as well as in most countries including the United States, for at least 70% of the students, teachers reported at least some-times, if not always, correcting homework assignments and returning those assign-ments to students. The exceptions were France, Germany, Hungary, Iceland, Japan, the Netherlands, Portugal, the Slovak Republic, and Slovenia.
Many teachers do not count mathematics homework directly in determining grades, but use it more as a method to monitor students’ understanding and to correct miscon-ceptions. In general, for the TIMSS countries, teachers reported that mathematics homework assignments contributed only sometimes to students’ grades or marks (Table 5.19). In some countries, however, it had even less impact on grades. According to their teachers, homework never or only rarely contributed to the grades for the majority of the students in Austria, Belgium (Flemish), the Czech Republic, Denmark, France, Germany, Hungary, Ireland, Japan, Korea, Latvia (LSS), Lithuania, the Neth-erlands, Norway, Singapore, the Slovak Republic, Slovenia, Sweden, and Switzerland. In contrast, teachers reported that homework always contributed to the grades for the majority of the students in Cyprus, England, Portugal, the Russian Federation, and the United States. Teachers in the United States indicated that homework always con-tributed towards grades for 68% of the students, which was the most reported by any country. The results for Missouri at 66% paralleled those for the U.S. In comparison, teachers in Oregon reported that homework always counted towards grades for 79% of the students.

152
C H A P T E R 5
Table 5.18Teachers' Reports About the Amount of Mathematics Homework Assigned - Eighth Grade*
Percent of Students Taught by Teachers
CountryNever
Assigning
Assigning Homework Less Than Once a
Week
Assigning Homework Once or Twice a Week
Assigning Homework Three Times a Week or
More Often
Homework 30 Minutes or Less
More Than 30 Minutes
30 Minutes or Less
More Than 30 Minutes
30 Minutes or Less
More Than 30 Minutes
UNITED STATES r 0 (0.1) 3 (1.3) 0 (0.0) 7 (1.8) 3 (0.9) 64 (2.9) 23 (3.1)
MISSOURI r 0 (0.2) 1 (0.1) 0 (0.0) 10 (1.5) 0 (0.0) 67 (4.3) 22 (4.1)
OREGON r 0 (0.0) 4 (1.7) 0 (0.0) 14 (3.9) 1 (0.8) 56 (4.6) 26 (3.3)
Australia r 1 (0.8) 6 (1.6) 0 (0.2) 21 (2.6) 4 (1.9) 62 (3.4) 5 (1.7)
Austria r 0 (0.0) 1 (0.5) 0 (0.0) 24 (4.4) 3 (1.4) 63 (5.0) 10 (2.1)
Belgium (Fl) 0 (0.0) 17 (3.5) 2 (1.1) 52 (4.8) 10 (2.6) 15 (2.9) 5 (2.1)
Belgium (Fr) 1 (1.2) 2 (1.4) 0 (0.0) 30 (5.1) 5 (2.2) 55 (5.5) 7 (2.8)
Canada r 2 (1.1) 2 (0.9) 1 (0.7) 22 (3.4) 2 (0.9) 59 (3.7) 13 (2.7)
Colombia 0 (0.0) 1 (0.9) 1 (0.8) 17 (4.7) 13 (2.9) 29 (4.2) 39 (4.2)
Cyprus r 0 (0.0) 0 (0.0) 0 (0.0) 0 (0.0) 0 (0.0) 50 (5.3) 50 (5.3)
Czech Republic 0 (0.4) 14 (4.5) 0 (0.0) 62 (5.2) 0 (0.3) 23 (3.5) 1 (0.6)
Denmark 0 (0.0) 4 (1.8) 0 (0.0) 42 (4.7) 3 (1.6) 49 (5.2) 2 (1.0)
England 0 (0.0) 3 (1.0) 1 (0.6) 44 (3.8) 47 (3.7) 3 (1.4) 2 (1.1)
France 0 (0.0) 0 (0.0) 2 (0.9) 7 (2.5) 4 (1.2) 77 (3.9) 10 (2.8)
Germany 1 (1.4) 1 (1.4) 0 (0.0) 22 (4.4) 0 (0.0) 73 (5.0) 3 (1.8)
Greece 0 (0.0) 1 (0.9) 0 (0.0) 0 (0.0) 0 (0.2) 31 (3.4) 67 (3.5)
Hong Kong 1 (1.4) 4 (2.2) 3 (1.8) 25 (4.7) 15 (4.1) 38 (6.0) 14 (4.1)
Hungary 0 (0.0) 1 (0.7) 0 (0.0) 2 (1.3) 0 (0.0) 82 (3.0) 15 (3.1)
Iceland 0 (0.0) 0 (0.0) 0 (0.0) 5 (2.0) 1 (1.0) 75 (5.5) 19 (5.5)
Iran, Islamic Rep. 0 (0.0) 1 (0.5) 3 (1.4) 10 (3.0) 59 (4.4) 2 (1.1) 26 (4.3)
Ireland 0 (0.0) 0 (0.0) 0 (0.0) 1 (0.9) 0 (0.0) 94 (2.2) 5 (2.0)
Israel r 0 (0.0) 1 (1.2) 0 (0.0) 3 (2.2) 0 (0.0) 48 (7.1) 48 (6.8)
Japan 0 (0.0) 27 (4.0) 4 (1.7) 37 (3.7) 10 (2.3) 16 (2.9) 6 (1.5)
Korea 0 (0.0) 5 (1.6) 8 (2.2) 27 (3.7) 21 (3.3) 21 (3.2) 18 (3.4)
Kuwait 0 (0.0) 0 (0.0) 0 (0.0) 19 (6.0) 2 (2.0) 60 (7.8) 18 (6.0)
Latvia (LSS) 0 (0.0) 0 (0.0) 0 (0.0) 8 (2.8) 1 (0.9) 83 (3.9) 9 (2.4)
Lithuania 0 (0.0) 0 (0.0) 0 (0.0) 2 (1.3) 0 (0.0) 76 (3.9) 22 (3.9)
Netherlands 1 (1.2) 1 (0.9) 0 (0.0) 12 (3.5) 2 (1.4) 81 (4.2) 4 (2.2)
New Zealand 0 (0.0) 5 (1.9) 2 (0.1) 34 (4.3) 4 (1.5) 54 (4.2) 2 (1.2)
Norway r 0 (0.0) 0 (0.0) 0 (0.0) 7 (2.7) 8 (2.7) 67 (4.3) 18 (4.0)
Portugal 0 (0.0) 1 (0.9) 1 (0.5) 30 (4.0) 2 (1.1) 57 (4.1) 9 (2.4)
Romania 0 (0.0) 0 (0.0) 0 (0.0) 1 (0.8) 1 (0.6) 11 (2.8) 87 (2.8)
Russian Federation 0 (0.0) 0 (0.0) 0 (0.0) 2 (0.9) 1 (0.8) 42 (3.5) 55 (3.4)
Scotland r 0 (0.4) 20 (4.3) 4 (2.0) 46 (5.1) 6 (2.3) 24 (4.1) 0 (0.0)
Singapore 0 (0.0) 1 (0.9) 0 (0.0) 3 (1.5) 11 (3.1) 26 (4.1) 58 (4.5)
Slovak Republic 0 (0.0) 1 (0.9) 0 (0.0) 12 (2.8) 1 (0.7) 83 (3.4) 4 (1.7)
Slovenia r 0 (0.0) 0 (0.0) 0 (0.0) 2 (1.4) 0 (0.0) 74 (4.4) 24 (4.2)
Spain r 0 (0.0) 4 (1.6) 0 (0.0) 18 (3.3) 9 (2.7) 47 (4.4) 22 (3.7)
Sweden r 0 (0.4) 19 (3.0) 7 (1.9) 45 (4.0) 26 (3.3) 2 (1.2) 1 (1.2)
Switzerland 0 (0.0) 1 (0.4) 1 (0.3) 26 (4.2) 4 (1.5) 61 (4.4) 6 (2.3)
Thailand r 0 (0.0) 0 (0.0) 0 (0.0) 7 (3.5) 20 (4.8) 16 (4.6) 58 (6.6)*Eighth grade in most countries; see Table 2 for more information about the grades tested in each country.Countries shown in italics did not satisfy one or more guidelines for sample participation rates or student sampling (see Figure 1). Background data for Bulgaria and South Africa not available.( ) Standard errors appear in parentheses. Because results are rounded to the nearest whole number, some totals may appear inconsistent. A dash (–) indicates data are not available.An "r" indicates teacher response data available for 70-84% of students.
SO
UR
CE
: IE
A T
hird
Inte
rnat
iona
l Mat
hem
atic
s an
d S
cien
ce S
tudy
(T
IMS
S),
199
4-95
. Mis
sour
i and
Ore
gon
data
col
lect
ed in
199
7.
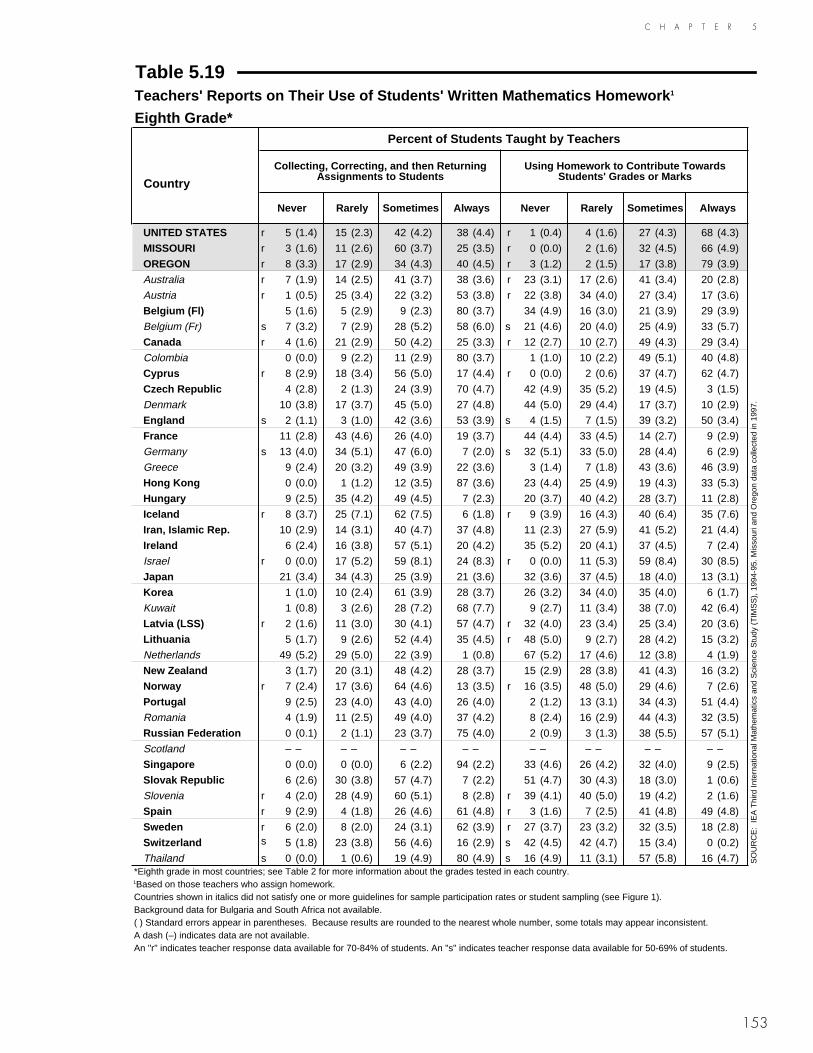
153
C H A P T E R 5
Table 5.19Teachers' Reports on Their Use of Students' Written Mathematics Homework 1
Eighth Grade*Percent of Students Taught by Teachers
Country
Collecting, Correcting, and then Returning Assignments to Students
Using Homework to Contribute Towards Students' Grades or Marks
Never Rarely Sometimes Always Never Rarely Sometimes Always
UNITED STATES r 5 (1.4) 15 (2.3) 42 (4.2) 38 (4.4) r 1 (0.4) 4 (1.6) 27 (4.3) 68 (4.3)
MISSOURI r 3 (1.6) 11 (2.6) 60 (3.7) 25 (3.5) r 0 (0.0) 2 (1.6) 32 (4.5) 66 (4.9)
OREGON r 8 (3.3) 17 (2.9) 34 (4.3) 40 (4.5) r 3 (1.2) 2 (1.5) 17 (3.8) 79 (3.9)
Australia r 7 (1.9) 14 (2.5) 41 (3.7) 38 (3.6) r 23 (3.1) 17 (2.6) 41 (3.4) 20 (2.8)
Austria r 1 (0.5) 25 (3.4) 22 (3.2) 53 (3.8) r 22 (3.8) 34 (4.0) 27 (3.4) 17 (3.6)
Belgium (Fl) 5 (1.6) 5 (2.9) 9 (2.3) 80 (3.7) 34 (4.9) 16 (3.0) 21 (3.9) 29 (3.9)
Belgium (Fr) s 7 (3.2) 7 (2.9) 28 (5.2) 58 (6.0) s 21 (4.6) 20 (4.0) 25 (4.9) 33 (5.7)
Canada r 4 (1.6) 21 (2.9) 50 (4.2) 25 (3.3) r 12 (2.7) 10 (2.7) 49 (4.3) 29 (3.4)
Colombia 0 (0.0) 9 (2.2) 11 (2.9) 80 (3.7) 1 (1.0) 10 (2.2) 49 (5.1) 40 (4.8)
Cyprus r 8 (2.9) 18 (3.4) 56 (5.0) 17 (4.4) r 0 (0.0) 2 (0.6) 37 (4.7) 62 (4.7)
Czech Republic 4 (2.8) 2 (1.3) 24 (3.9) 70 (4.7) 42 (4.9) 35 (5.2) 19 (4.5) 3 (1.5)
Denmark 10 (3.8) 17 (3.7) 45 (5.0) 27 (4.8) 44 (5.0) 29 (4.4) 17 (3.7) 10 (2.9)
England s 2 (1.1) 3 (1.0) 42 (3.6) 53 (3.9) s 4 (1.5) 7 (1.5) 39 (3.2) 50 (3.4)
France 11 (2.8) 43 (4.6) 26 (4.0) 19 (3.7) 44 (4.4) 33 (4.5) 14 (2.7) 9 (2.9)
Germany s 13 (4.0) 34 (5.1) 47 (6.0) 7 (2.0) s 32 (5.1) 33 (5.0) 28 (4.4) 6 (2.9)
Greece 9 (2.4) 20 (3.2) 49 (3.9) 22 (3.6) 3 (1.4) 7 (1.8) 43 (3.6) 46 (3.9)
Hong Kong 0 (0.0) 1 (1.2) 12 (3.5) 87 (3.6) 23 (4.4) 25 (4.9) 19 (4.3) 33 (5.3)
Hungary 9 (2.5) 35 (4.2) 49 (4.5) 7 (2.3) 20 (3.7) 40 (4.2) 28 (3.7) 11 (2.8)
Iceland r 8 (3.7) 25 (7.1) 62 (7.5) 6 (1.8) r 9 (3.9) 16 (4.3) 40 (6.4) 35 (7.6)
Iran, Islamic Rep. 10 (2.9) 14 (3.1) 40 (4.7) 37 (4.8) 11 (2.3) 27 (5.9) 41 (5.2) 21 (4.4)
Ireland 6 (2.4) 16 (3.8) 57 (5.1) 20 (4.2) 35 (5.2) 20 (4.1) 37 (4.5) 7 (2.4)
Israel r 0 (0.0) 17 (5.2) 59 (8.1) 24 (8.3) r 0 (0.0) 11 (5.3) 59 (8.4) 30 (8.5)
Japan 21 (3.4) 34 (4.3) 25 (3.9) 21 (3.6) 32 (3.6) 37 (4.5) 18 (4.0) 13 (3.1)
Korea 1 (1.0) 10 (2.4) 61 (3.9) 28 (3.7) 26 (3.2) 34 (4.0) 35 (4.0) 6 (1.7)
Kuwait 1 (0.8) 3 (2.6) 28 (7.2) 68 (7.7) 9 (2.7) 11 (3.4) 38 (7.0) 42 (6.4)
Latvia (LSS) r 2 (1.6) 11 (3.0) 30 (4.1) 57 (4.7) r 32 (4.0) 23 (3.4) 25 (3.4) 20 (3.6)
Lithuania 5 (1.7) 9 (2.6) 52 (4.4) 35 (4.5) r 48 (5.0) 9 (2.7) 28 (4.2) 15 (3.2)
Netherlands 49 (5.2) 29 (5.0) 22 (3.9) 1 (0.8) 67 (5.2) 17 (4.6) 12 (3.8) 4 (1.9)
New Zealand 3 (1.7) 20 (3.1) 48 (4.2) 28 (3.7) 15 (2.9) 28 (3.8) 41 (4.3) 16 (3.2)
Norway r 7 (2.4) 17 (3.6) 64 (4.6) 13 (3.5) r 16 (3.5) 48 (5.0) 29 (4.6) 7 (2.6)
Portugal 9 (2.5) 23 (4.0) 43 (4.0) 26 (4.0) 2 (1.2) 13 (3.1) 34 (4.3) 51 (4.4)
Romania 4 (1.9) 11 (2.5) 49 (4.0) 37 (4.2) 8 (2.4) 16 (2.9) 44 (4.3) 32 (3.5)
Russian Federation 0 (0.1) 2 (1.1) 23 (3.7) 75 (4.0) 2 (0.9) 3 (1.3) 38 (5.5) 57 (5.1)
Scotland – – – – – – – – – – – – – – – –
Singapore 0 (0.0) 0 (0.0) 6 (2.2) 94 (2.2) 33 (4.6) 26 (4.2) 32 (4.0) 9 (2.5)
Slovak Republic 6 (2.6) 30 (3.8) 57 (4.7) 7 (2.2) 51 (4.7) 30 (4.3) 18 (3.0) 1 (0.6)
Slovenia r 4 (2.0) 28 (4.9) 60 (5.1) 8 (2.8) r 39 (4.1) 40 (5.0) 19 (4.2) 2 (1.6)
Spain r 9 (2.9) 4 (1.8) 26 (4.6) 61 (4.8) r 3 (1.6) 7 (2.5) 41 (4.8) 49 (4.8)
Sweden r 6 (2.0) 8 (2.0) 24 (3.1) 62 (3.9) r 27 (3.7) 23 (3.2) 32 (3.5) 18 (2.8)
Switzerland s 5 (1.8) 23 (3.8) 56 (4.6) 16 (2.9) s 42 (4.5) 42 (4.7) 15 (3.4) 0 (0.2)
Thailand s 0 (0.0) 1 (0.6) 19 (4.9) 80 (4.9) s 16 (4.9) 11 (3.1) 57 (5.8) 16 (4.7)*Eighth grade in most countries; see Table 2 for more information about the grades tested in each country.1Based on those teachers who assign homework.Countries shown in italics did not satisfy one or more guidelines for sample participation rates or student sampling (see Figure 1). Background data for Bulgaria and South Africa not available.( ) Standard errors appear in parentheses. Because results are rounded to the nearest whole number, some totals may appear inconsistent. A dash (–) indicates data are not available.An "r" indicates teacher response data available for 70-84% of students. An "s" indicates teacher response data available for 50-69% of students.
SO
UR
CE
: IE
A T
hird
Inte
rnat
iona
l Mat
hem
atic
s an
d S
cien
ce S
tudy
(T
IMS
S),
199
4-95
. Mis
sour
i and
Ore
gon
data
col
lect
ed in
199
7.

154
C H A P T E R 5
What Assessment and Evaluation Procedures Do Teachers Use?Teachers in participating countries were asked about the importance they place on dif-ferent types of assessment and how they use assessment information. Their responses to these two questions are presented in Tables 5.20 and 5.21, respectively. The weight given to each type of assessment varied greatly from country to country. Interna-tionally, the least weight reportedly was given to external standardized tests and teacher-made objective tests. In most participating countries, fewer than 50% of the eighth-grade students had mathematics teachers who reported giving quite a lot or a great deal of weight to either of these types of assessments. The Hungarian teachers reported the heaviest emphasis on projects or practical exercises. They reported relying on this type of assessment for 90% of the students, with the next highest coun-tries being Colombia with 77%, Denmark with 74%, and Israel with 70%. However, the most heavily weighted types of assessment were teacher-made tests requiring explanations, observations of students, and students’ responses in class. One or more of these assessment types was weighted heavily for 80% or more of the eighth-grade students in many European and Eastern European countries. Teachers were in less agreement about assessment approaches within Australia, Canada, England, Hong Kong, Israel, Japan, Korea, New Zealand, Singapore, Slovenia, Switzerland, Thailand, and the United States, where no type of assessment was weighted heavily for as many as 80% of the students. In contrast to teachers reports internationally, teachers in Mis-souri and Oregon agreed that they placed the heaviest emphasis on homework as a method of assessment, using it for more than 70% of their students. Teacher-made tests requiring explanations and projects or practical exercises were the next most emphasized, each being used for about 40% of the students in both states.
As might be anticipated, mathematics teachers in most countries reported using assessment information to provide grades or marks, to provide student feedback, to diagnose learning problems, and to plan future lessons. Teachers in fewer countries reported considerable use of assessment information to report to parents or for the purpose of tracking or making program assignments. In Missouri and Oregon, teachers reported using assessment information for about 90% of their students in three major ways: to provide grades, to provide student feedback, and to plan for future lessons. Compared to many TIMSS countries, they reported less use of assessment information to diagnose learning problems (for about 70% of the students) and more use of assessment information to report to parents (for about 80% of the stu-dents). Like the teachers in most countries they used assessment information least often to assign students to programs or tracks. However, teachers in Oregon used assessment information for this purpose more frequently (for 46% of the students) than did teachers in Missouri (for 35% of the students).
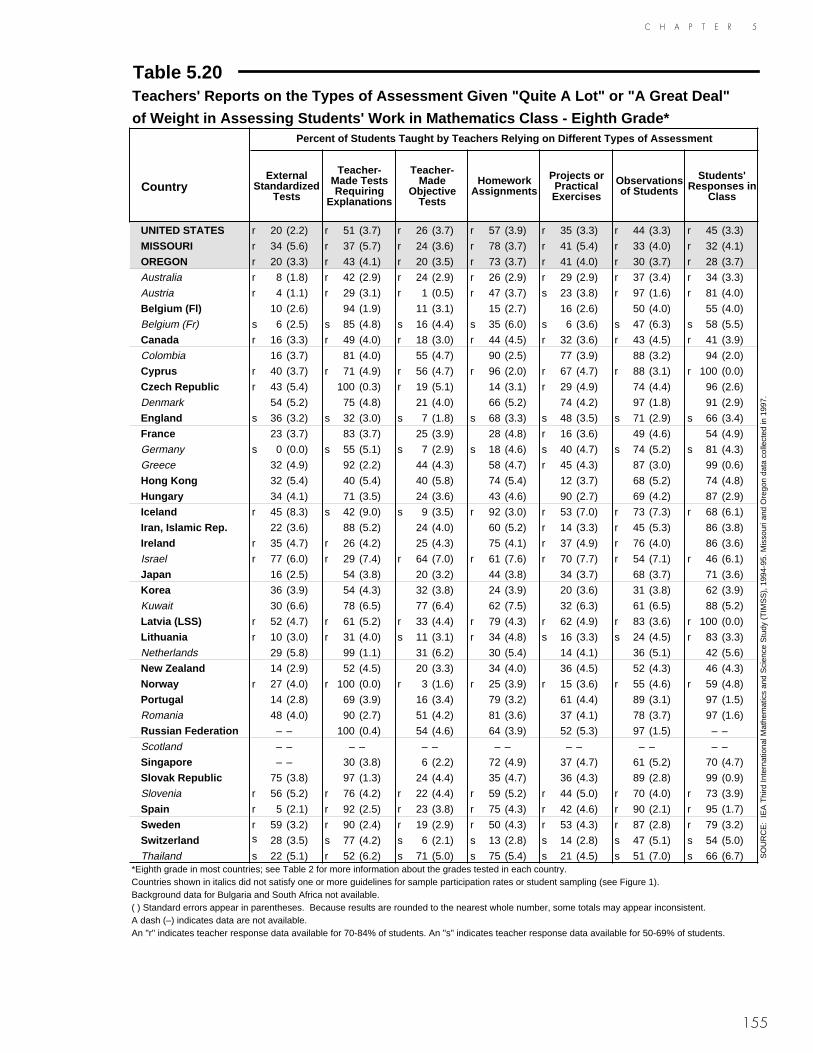
155
C H A P T E R 5
Table 5.20Teachers' Reports on the Types of Assessment Given "Quite A Lot" or "A Great Deal"
of Weight in Assessing Students' Work in Mathematics Class - Eighth Grade* Percent of Students Taught by Teachers Relying on Different Types of Assessment
CountryExternal
Standardized Tests
Teacher-Made Tests Requiring
Explanations
Teacher-Made
Objective Tests
Homework Assignments
Projects or Practical Exercises
Observations of Students
Students' Responses in
Class
UNITED STATES r 20 (2.2) r 51 (3.7) r 26 (3.7) r 57 (3.9) r 35 (3.3) r 44 (3.3) r 45 (3.3)
MISSOURI r 34 (5.6) r 37 (5.7) r 24 (3.6) r 78 (3.7) r 41 (5.4) r 33 (4.0) r 32 (4.1)
OREGON r 20 (3.3) r 43 (4.1) r 20 (3.5) r 73 (3.7) r 41 (4.0) r 30 (3.7) r 28 (3.7)
Australia r 8 (1.8) r 42 (2.9) r 24 (2.9) r 26 (2.9) r 29 (2.9) r 37 (3.4) r 34 (3.3)
Austria r 4 (1.1) r 29 (3.1) r 1 (0.5) r 47 (3.7) s 23 (3.8) r 97 (1.6) r 81 (4.0)
Belgium (Fl) 10 (2.6) 94 (1.9) 11 (3.1) 15 (2.7) 16 (2.6) 50 (4.0) 55 (4.0)
Belgium (Fr) s 6 (2.5) s 85 (4.8) s 16 (4.4) s 35 (6.0) s 6 (3.6) s 47 (6.3) s 58 (5.5)
Canada r 16 (3.3) r 49 (4.0) r 18 (3.0) r 44 (4.5) r 32 (3.6) r 43 (4.5) r 41 (3.9)
Colombia 16 (3.7) 81 (4.0) 55 (4.7) 90 (2.5) 77 (3.9) 88 (3.2) 94 (2.0)
Cyprus r 40 (3.7) r 71 (4.9) r 56 (4.7) r 96 (2.0) r 67 (4.7) r 88 (3.1) r 100 (0.0)
Czech Republic r 43 (5.4) 100 (0.3) r 19 (5.1) 14 (3.1) r 29 (4.9) 74 (4.4) 96 (2.6)
Denmark 54 (5.2) 75 (4.8) 21 (4.0) 66 (5.2) 74 (4.2) 97 (1.8) 91 (2.9)
England s 36 (3.2) s 32 (3.0) s 7 (1.8) s 68 (3.3) s 48 (3.5) s 71 (2.9) s 66 (3.4)
France 23 (3.7) 83 (3.7) 25 (3.9) 28 (4.8) r 16 (3.6) 49 (4.6) 54 (4.9)
Germany s 0 (0.0) s 55 (5.1) s 7 (2.9) s 18 (4.6) s 40 (4.7) s 74 (5.2) s 81 (4.3)
Greece 32 (4.9) 92 (2.2) 44 (4.3) 58 (4.7) r 45 (4.3) 87 (3.0) 99 (0.6)
Hong Kong 32 (5.4) 40 (5.4) 40 (5.8) 74 (5.4) 12 (3.7) 68 (5.2) 74 (4.8)
Hungary 34 (4.1) 71 (3.5) 24 (3.6) 43 (4.6) 90 (2.7) 69 (4.2) 87 (2.9)
Iceland r 45 (8.3) s 42 (9.0) s 9 (3.5) r 92 (3.0) r 53 (7.0) r 73 (7.3) r 68 (6.1)
Iran, Islamic Rep. 22 (3.6) 88 (5.2) 24 (4.0) 60 (5.2) r 14 (3.3) r 45 (5.3) 86 (3.8)
Ireland r 35 (4.7) r 26 (4.2) 25 (4.3) 75 (4.1) r 37 (4.9) r 76 (4.0) 86 (3.6)
Israel r 77 (6.0) r 29 (7.4) r 64 (7.0) r 61 (7.6) r 70 (7.7) r 54 (7.1) r 46 (6.1)
Japan 16 (2.5) 54 (3.8) 20 (3.2) 44 (3.8) 34 (3.7) 68 (3.7) 71 (3.6)
Korea 36 (3.9) 54 (4.3) 32 (3.8) 24 (3.9) 20 (3.6) 31 (3.8) 62 (3.9)
Kuwait 30 (6.6) 78 (6.5) 77 (6.4) 62 (7.5) 32 (6.3) 61 (6.5) 88 (5.2)
Latvia (LSS) r 52 (4.7) r 61 (5.2) r 33 (4.4) r 79 (4.3) r 62 (4.9) r 83 (3.6) r 100 (0.0)
Lithuania r 10 (3.0) r 31 (4.0) s 11 (3.1) r 34 (4.8) s 16 (3.3) s 24 (4.5) r 83 (3.3)
Netherlands 29 (5.8) 99 (1.1) 31 (6.2) 30 (5.4) 14 (4.1) 36 (5.1) 42 (5.6)
New Zealand 14 (2.9) 52 (4.5) 20 (3.3) 34 (4.0) 36 (4.5) 52 (4.3) 46 (4.3)
Norway r 27 (4.0) r 100 (0.0) r 3 (1.6) r 25 (3.9) r 15 (3.6) r 55 (4.6) r 59 (4.8)
Portugal 14 (2.8) 69 (3.9) 16 (3.4) 79 (3.2) 61 (4.4) 89 (3.1) 97 (1.5)
Romania 48 (4.0) 90 (2.7) 51 (4.2) 81 (3.6) 37 (4.1) 78 (3.7) 97 (1.6)
Russian Federation – – 100 (0.4) 54 (4.6) 64 (3.9) 52 (5.3) 97 (1.5) – –
Scotland – – – – – – – – – – – – – –
Singapore – – 30 (3.8) 6 (2.2) 72 (4.9) 37 (4.7) 61 (5.2) 70 (4.7)
Slovak Republic 75 (3.8) 97 (1.3) 24 (4.4) 35 (4.7) 36 (4.3) 89 (2.8) 99 (0.9)
Slovenia r 56 (5.2) r 76 (4.2) r 22 (4.4) r 59 (5.2) r 44 (5.0) r 70 (4.0) r 73 (3.9)
Spain r 5 (2.1) r 92 (2.5) r 23 (3.8) r 75 (4.3) r 42 (4.6) r 90 (2.1) r 95 (1.7)
Sweden r 59 (3.2) r 90 (2.4) r 19 (2.9) r 50 (4.3) r 53 (4.3) r 87 (2.8) r 79 (3.2)
Switzerland s 28 (3.5) s 77 (4.2) s 6 (2.1) s 13 (2.8) s 14 (2.8) s 47 (5.1) s 54 (5.0)
Thailand s 22 (5.1) r 52 (6.2) s 71 (5.0) s 75 (5.4) s 21 (4.5) s 51 (7.0) s 66 (6.7)*Eighth grade in most countries; see Table 2 for more information about the grades tested in each country.Countries shown in italics did not satisfy one or more guidelines for sample participation rates or student sampling (see Figure 1). Background data for Bulgaria and South Africa not available.( ) Standard errors appear in parentheses. Because results are rounded to the nearest whole number, some totals may appear inconsistent. A dash (–) indicates data are not available.An "r" indicates teacher response data available for 70-84% of students. An "s" indicates teacher response data available for 50-69% of students.
SO
UR
CE
: IE
A T
hird
Inte
rnat
iona
l Mat
hem
atic
s an
d S
cien
ce S
tudy
(T
IMS
S),
199
4-95
. Mis
sour
i and
Ore
gon
data
col
lect
ed in
199
7.

156
C H A P T E R 5
Table 5.21Teachers' Reports on Ways Assessment Information Is Used "Quite A Lot"
or "A Great Deal" - Mathematics - Eighth Grade*Percent of Students Taught by Teachers Using Assessment Information
CountryTo Provide Grades or
Marks
To Provide Student
Feedback
To Diagnose Learning Problems
To Report to Parents
To Assign Students to Programs or
Tracks
To Plan for Future
Lessons
UNITED STATES r 96 (1.0) r 91 (2.4) r 80 (2.8) r 82 (2.6) r 30 (3.1) r 86 (2.4)
MISSOURI r 88 (3.5) r 93 (2.1) r 76 (4.7) r 82 (3.5) r 35 (5.0) r 93 (3.1)
OREGON r 95 (2.2) r 95 (1.5) r 67 (4.2) r 85 (2.8) r 46 (4.3) r 87 (3.5)
Australia r 86 (2.8) r 89 (2.3) r 75 (3.5) r 76 (3.1) r 55 (3.9) r 73 (3.0)
Austria – – r 72 (3.8) r 75 (3.7) r 39 (4.3) r 17 (3.5) r 53 (3.9)
Belgium (Fl) r 70 (4.1) r 78 (3.7) r 88 (2.7) r 80 (3.8) r 84 (3.3) r 54 (4.8)
Belgium (Fr) s 92 (3.1) s 81 (4.3) s 92 (2.9) s 61 (5.6) – – s 89 (3.0)
Canada 87 (2.6) 92 (1.8) 84 (3.1) 79 (3.0) 52 (3.6) 79 (3.2)
Colombia 68 (4.3) 90 (2.5) 92 (2.5) 53 (5.2) 37 (5.3) 94 (2.2)
Cyprus r 100 (0.0) r 93 (3.2) r 96 (2.5) r 96 (2.3) r 60 (6.0) r 91 (3.2)
Czech Republic 94 (3.2) 93 (2.7) 100 (0.5) 67 (4.5) 38 (5.2) 98 (1.3)
Denmark 26 (4.3) 85 (3.6) r 85 (3.6) 54 (5.2) 68 (4.7) 85 (3.6)
England s 91 (1.8) s 91 (1.8) s 84 (2.3) s 81 (2.7) s 78 (2.6) s 85 (2.1)
France 89 (2.9) 93 (2.4) 90 (3.0) 61 (4.3) 36 (4.4) 91 (2.6)
Germany s 84 (4.3) s 86 (3.6) s 89 (3.6) s 48 (5.5) s 28 (4.8) s 86 (3.8)
Greece 97 (1.4) 88 (2.8) 90 (2.0) 89 (3.7) 41 (4.2) 77 (3.4)
Hong Kong 72 (5.1) 82 (4.7) 81 (4.9) 13 (4.1) 13 (4.1) 74 (4.4)
Hungary 58 (4.2) 71 (3.9) 95 (2.0) 81 (3.5) 83 (3.5) 79 (3.7)
Iceland r 84 (6.2) r 71 (7.7) r 82 (6.8) r 78 (7.3) r 10 (4.5) r 91 (4.5)
Iran, Islamic Rep. 83 (3.6) r 71 (4.1) 81 (3.8) 63 (4.5) 62 (4.2) 79 (3.4)
Ireland r 72 (4.3) 83 (3.5) r 84 (3.5) 76 (3.8) r 54 (4.6) 85 (3.5)
Israel r 14 (5.9) r 14 (4.2) r 20 (5.8) r 27 (7.3) r 36 (6.2) r 7 (3.8)
Japan 73 (3.6) 60 (3.9) 66 (3.6) 9 (2.1) 29 (3.3) 58 (3.9)
Korea 39 (3.7) 42 (4.3) 65 (3.8) 10 (2.7) 3 (1.4) 56 (4.3)
Kuwait 70 (7.1) 75 (5.0) r 81 (6.2) r 53 (6.3) r 66 (7.2) r 83 (5.8)
Latvia (LSS) r 97 (1.6) r 69 (4.3) r 96 (2.1) r 39 (4.7) r 42 (4.9) r 95 (2.2)
Lithuania r 78 (4.1) 52 (4.4) r 54 (4.5) 54 (4.8) 45 (4.6) r 78 (4.1)
Netherlands 86 (3.6) 68 (5.6) 65 (5.3) 57 (5.7) 68 (5.4) 50 (5.7)
New Zealand 87 (2.9) 87 (2.7) 81 (3.0) 86 (3.1) 45 (4.2) 76 (3.4)
Norway r 69 (4.6) r 77 (4.4) r 47 (5.2) r 31 (4.1) r 57 (5.0) r 82 (3.9)
Portugal 92 (2.3) 80 (3.7) 95 (2.0) 64 (4.5) 43 (4.1) 90 (2.7)
Romania 94 (1.8) 90 (2.5) 94 (1.9) 75 (3.6) 78 (3.1) 95 (1.8)
Russian Federation 90 (2.8) 97 (1.2) 98 (1.2) 25 (4.2) 90 (2.7) 98 (1.0)
Scotland – – – – – – – – – – – –
Singapore 71 (3.7) 87 (3.3) 88 (3.2) 39 (4.4) 31 (4.4) 76 (4.3)
Slovak Republic 74 (4.0) 79 (3.4) 90 (2.7) 68 (4.3) 12 (2.8) 78 (4.2)
Slovenia r 73 (4.1) r 97 (2.0) r 95 (2.4) r 76 (4.7) r 40 (5.2) r 92 (2.9)
Spain r 95 (2.1) r 93 (2.3) r 90 (2.8) r 86 (3.5) r 72 (4.1) r 92 (2.6)
Sweden r 73 (3.6) r 91 (2.4) r 85 (2.9) r 53 (4.2) r 32 (3.7) r 93 (1.9)
Switzerland s 85 (3.5) s 92 (2.7) s 88 (2.9) s 47 (4.3) s 23 (3.3) s 80 (4.2)
Thailand r 65 (6.2) r 77 (5.4) s 84 (4.7) s 41 (6.4) s 72 (5.1) s 87 (4.2)*Eighth grade in most countries; see Table 2 for more information about the grades tested in each country.Countries shown in italics did not satisfy one or more guidelines for sample participation rates or student sampling (see Figure 1). Background data for Bulgaria and South Africa not available.( ) Standard errors appear in parentheses. Because results are rounded to the nearest whole number, some totals may appear inconsistent. A dash (–) indicates data are not available.An "r" indicates teacher response data available for 70-84% of students. An "s" indicates teacher response data available for 50-69% of students.
SO
UR
CE
: IE
A T
hird
Inte
rnat
iona
l Mat
hem
atic
s an
d S
cien
ce S
tudy
(T
IMS
S),
199
4-95
. Mis
sour
i and
Ore
gon
data
col
lect
ed in
1997
.

C H A P T E R 5
157
As reported in Table 5.22, eighth-grade students around the world reported substantial variation in the frequency of testing in mathematics classes. The majority of the stu-dents reported having quizzes and tests only once in a while or never in Austria, the Czech Republic, Denmark, England, Germany, Hungary, Iceland, Ireland, Japan, Korea, Latvia (LSS), Norway, Scotland, and the Slovak Republic. In contrast, one-third or more of the students reported almost always having quizzes or tests in Colombia, Hong Kong, Kuwait, Romania, Spain, and the United States. The United States was one of the countries where the most students (38%) reported being tested almost always, and another 47% reported being tested pretty often. The results for Missouri and Oregon were consistent with those for the United States. Thirty-six percent of the eighth graders in Missouri reported being tested almost always and 46% pretty often. In Oregon, 32% reported being tested almost always and 49% being tested pretty often.
In a number of countries, the students tested only infrequently (once in a while or never) and those tested pretty often had similar achievement, while students who reported being tested almost always had lower achievement. In the United States, Missouri, and Oregon both the students tested infrequently and those tested almost always had lower achievement than the students tested pretty often. Some teachers may be testing the lower-achieving students less often because these students can least afford time diverted from their ongoing instructional program or maybe it takes these students longer to complete a unit of material. On the other hand, some teachers may be providing shorter lessons and follow-up quizzes for lower-achieving students to more closely monitor their grasp of the subject matter.
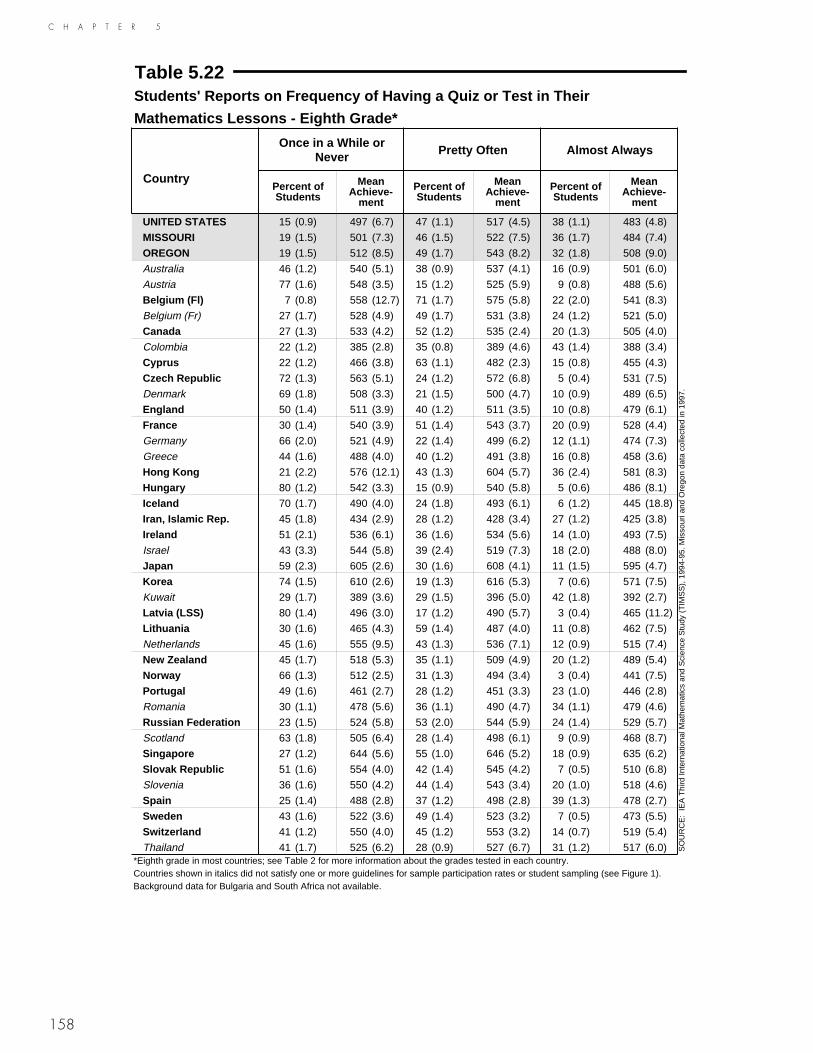
158
C H A P T E R 5
Table 5.22Students' Reports on Frequency of Having a Quiz or Test in Their
Mathematics Lessons - Eighth Grade*
Once in a While or Never Pretty Often Almost Always
CountryPercent of Students
Mean Achieve-
ment
Percent of Students
Mean Achieve-
ment
Percent of Students
Mean Achieve-
ment
UNITED STATES 15 (0.9) 497 (6.7) 47 (1.1) 517 (4.5) 38 (1.1) 483 (4.8)
MISSOURI 19 (1.5) 501 (7.3) 46 (1.5) 522 (7.5) 36 (1.7) 484 (7.4)
OREGON 19 (1.5) 512 (8.5) 49 (1.7) 543 (8.2) 32 (1.8) 508 (9.0)
Australia 46 (1.2) 540 (5.1) 38 (0.9) 537 (4.1) 16 (0.9) 501 (6.0)
Austria 77 (1.6) 548 (3.5) 15 (1.2) 525 (5.9) 9 (0.8) 488 (5.6)
Belgium (Fl) 7 (0.8) 558 (12.7) 71 (1.7) 575 (5.8) 22 (2.0) 541 (8.3)
Belgium (Fr) 27 (1.7) 528 (4.9) 49 (1.7) 531 (3.8) 24 (1.2) 521 (5.0)
Canada 27 (1.3) 533 (4.2) 52 (1.2) 535 (2.4) 20 (1.3) 505 (4.0)
Colombia 22 (1.2) 385 (2.8) 35 (0.8) 389 (4.6) 43 (1.4) 388 (3.4)
Cyprus 22 (1.2) 466 (3.8) 63 (1.1) 482 (2.3) 15 (0.8) 455 (4.3)
Czech Republic 72 (1.3) 563 (5.1) 24 (1.2) 572 (6.8) 5 (0.4) 531 (7.5)
Denmark 69 (1.8) 508 (3.3) 21 (1.5) 500 (4.7) 10 (0.9) 489 (6.5)
England 50 (1.4) 511 (3.9) 40 (1.2) 511 (3.5) 10 (0.8) 479 (6.1)
France 30 (1.4) 540 (3.9) 51 (1.4) 543 (3.7) 20 (0.9) 528 (4.4)
Germany 66 (2.0) 521 (4.9) 22 (1.4) 499 (6.2) 12 (1.1) 474 (7.3)
Greece 44 (1.6) 488 (4.0) 40 (1.2) 491 (3.8) 16 (0.8) 458 (3.6)
Hong Kong 21 (2.2) 576 (12.1) 43 (1.3) 604 (5.7) 36 (2.4) 581 (8.3)
Hungary 80 (1.2) 542 (3.3) 15 (0.9) 540 (5.8) 5 (0.6) 486 (8.1)
Iceland 70 (1.7) 490 (4.0) 24 (1.8) 493 (6.1) 6 (1.2) 445 (18.8)
Iran, Islamic Rep. 45 (1.8) 434 (2.9) 28 (1.2) 428 (3.4) 27 (1.2) 425 (3.8)
Ireland 51 (2.1) 536 (6.1) 36 (1.6) 534 (5.6) 14 (1.0) 493 (7.5)
Israel 43 (3.3) 544 (5.8) 39 (2.4) 519 (7.3) 18 (2.0) 488 (8.0)
Japan 59 (2.3) 605 (2.6) 30 (1.6) 608 (4.1) 11 (1.5) 595 (4.7)
Korea 74 (1.5) 610 (2.6) 19 (1.3) 616 (5.3) 7 (0.6) 571 (7.5)
Kuwait 29 (1.7) 389 (3.6) 29 (1.5) 396 (5.0) 42 (1.8) 392 (2.7)
Latvia (LSS) 80 (1.4) 496 (3.0) 17 (1.2) 490 (5.7) 3 (0.4) 465 (11.2)
Lithuania 30 (1.6) 465 (4.3) 59 (1.4) 487 (4.0) 11 (0.8) 462 (7.5)
Netherlands 45 (1.6) 555 (9.5) 43 (1.3) 536 (7.1) 12 (0.9) 515 (7.4)
New Zealand 45 (1.7) 518 (5.3) 35 (1.1) 509 (4.9) 20 (1.2) 489 (5.4)
Norway 66 (1.3) 512 (2.5) 31 (1.3) 494 (3.4) 3 (0.4) 441 (7.5)
Portugal 49 (1.6) 461 (2.7) 28 (1.2) 451 (3.3) 23 (1.0) 446 (2.8)
Romania 30 (1.1) 478 (5.6) 36 (1.1) 490 (4.7) 34 (1.1) 479 (4.6)
Russian Federation 23 (1.5) 524 (5.8) 53 (2.0) 544 (5.9) 24 (1.4) 529 (5.7)
Scotland 63 (1.8) 505 (6.4) 28 (1.4) 498 (6.1) 9 (0.9) 468 (8.7)
Singapore 27 (1.2) 644 (5.6) 55 (1.0) 646 (5.2) 18 (0.9) 635 (6.2)
Slovak Republic 51 (1.6) 554 (4.0) 42 (1.4) 545 (4.2) 7 (0.5) 510 (6.8)
Slovenia 36 (1.6) 550 (4.2) 44 (1.4) 543 (3.4) 20 (1.0) 518 (4.6)
Spain 25 (1.4) 488 (2.8) 37 (1.2) 498 (2.8) 39 (1.3) 478 (2.7)
Sweden 43 (1.6) 522 (3.6) 49 (1.4) 523 (3.2) 7 (0.5) 473 (5.5)
Switzerland 41 (1.2) 550 (4.0) 45 (1.2) 553 (3.2) 14 (0.7) 519 (5.4)
Thailand 41 (1.7) 525 (6.2) 28 (0.9) 527 (6.7) 31 (1.2) 517 (6.0)*Eighth grade in most countries; see Table 2 for more information about the grades tested in each country.Countries shown in italics did not satisfy one or more guidelines for sample participation rates or student sampling (see Figure 1). Background data for Bulgaria and South Africa not available.
SO
UR
CE
: IE
A T
hird
Inte
rnat
iona
l Mat
hem
atic
s an
d S
cien
ce S
tudy
(T
IMS
S),
199
4-95
. Mis
sour
i and
Ore
gon
data
col
lect
ed in
199
7.
A P P E N D I X A
A-1
Appendix AOVERVIEW OF TIMSS PROCEDURES
HistoryTIMSS represents the continuation of a long series of studies conducted by the Inter-national Association for the Evaluation of Educational Achievement (IEA). Since its inception in 1959, the IEA has conducted more than 15 studies of cross-national achievement in curricular areas such as mathematics, science, language, civics, and reading. IEA conducted its First International Science Study (FISS) in 1970-71, and the Second International Science Study (SISS) in 1983-84. The First and Second International Mathematics Studies (FIMS and SIMS) were conducted in 1964 and 1980-82, respectively. Since the subjects of mathematics and science are related in many respects, the third studies were conducted together as an integrated effort.1 The TIMSS data collection took place towards the end of 1994 for countries in the Southern Hemisphere, and in the first half of 1995 for countries in the Northern Hemisphere.
The number of participating countries and the inclusion of both mathematics and science resulted in TIMSS becoming the largest, most complex IEA study to date and the largest international study of educational achievement ever undertaken. Tradi-tionally, IEA studies have systematically worked toward gaining more in-depth under-standing of how various factors contribute to the overall outcomes of schooling. Par-ticular emphasis has been given to refining our understanding of students’ opportunity to learn as this opportunity becomes successively defined and implemented by cur-ricular and instructional practices. In an effort to extend what had been learned from previous studies and provide contextual and explanatory information, the magnitude of TIMSS expanded beyond the already substantial task of measuring achievement in two subject areas to also include a thorough investigation of curriculum and how it is delivered in classrooms around the world.
The State TIMSS Benchmarking Study provided states the opportunity to administer the TIMSS mathematics and science tests and background questionnaires at the eighth grade to obtain comparisons of achievement with the TIMSS countries. Missouri and Oregon availed of this opportunity to administer the Population 2 TIMSS tests to public-school students in the eighth grade. The TIMSS tests were administered in Missouri and Oregon in April-May 1997, two years after the main TIMSS data collection.
1 Because a substantial amount of time has elapsed since earlier IEA studies in mathematics and science, curric-ulum and testing methods in these two subjects have undergone many changes. Because TIMSS has devoted considerable energy toward reflecting the most current educational and measurement practices, changes in items and methods as well as differences in the populations tested make comparisons of TIMSS results with those of previous studies very difficult. The focus of TIMSS was not on measuring achievement trends, but rather on providing up-to-date information about the current quality of education in mathematics and science. Trend data will be available after the 1999 replication of TIMSS at the eighth grade, TIMSS-R.
A-2
A P P E N D I X A
Components of TIMSSContinuing the approach of previous IEA studies, TIMSS addressed three conceptual levels of curriculum. The intended curriculum is composed of the mathematics and science instructional and learning goals as defined at the system level. The imple-mented curriculum is the mathematics and science curriculum as interpreted by teachers and made available to students. The attained curriculum is the mathematics and science content that students have learned and their attitudes towards these sub-jects. To aid in meaningful interpretation and comparison of results, TIMSS also col-lected extensive information about the social and cultural contexts for learning, many of which are related to variation among different educational systems.
Even though slightly fewer countries completed all the steps necessary to have their data included in this report, nearly 50 countries participated in one or more of the various components of the TIMSS data collection effort, including the curriculum analysis. To gather information about the intended curriculum, mathematics and science specialists within each participating country worked section-by-section through curriculum guides, textbooks, and other curricular materials to categorize aspects of these materials in accordance with detailed specifications derived from the TIMSS mathematics and science curriculum frameworks.2 Initial results from this component of TIMSS can be found in two companion volumes: Many Visions, Many Aims: A Cross-National Investigation of Curricular Intentions in School Mathematics and Many Visions, Many Aims: A Cross-National Investigation of Curricular Inten-tions in School Science.3
To measure the attained curriculum, TIMSS tested more than half a million students in mathematics and science at five grade levels. TIMSS included testing at three separate populations:
Population 1. Students enrolled in the two adjacent grades that contained the largest proportion of 9-year-old students at the time of testing – third- and fourth-grade stu-dents in most countries.
Population 2. Students enrolled in the two adjacent grades that contained the largest proportion of 13-year-old students at the time of testing – seventh- and eighth-grade students in most countries.
Population 3. Students in their final year of secondary education. As an additional option, countries could test two special subgroups of these students:
1) Students having taken advanced mathematics, and2) Students having taken physics.
2 Robitaille, D.F., McKnight, C., Schmidt, W., Britton, E., Raizen, S., and Nicol., C. (1993). TIMSS Monograph No. 1: Curriculum Frameworks for Mathematics and Science. Vancouver, B.C.: Pacific Educational Press.
3 Schmidt, W.H., McKnight, C.C., Valverde, G.A., Houang, R.T., and Wiley, D.E. (1997). Many Visions, Many Aims: A Cross-National Investigation of Curricular Intentions in School Mathematics. Dordrecht, the Nether-lands,: Kluwer Academic Publishers. Schmidt, W.H., Raizen, S.A., Britton, E.D., Bianchi, L.J., and Wolfe, R.G., (1997). Many Visions, Many Aims: A Cross-National Investigation of Curricular Intentions in School Science. Dordrecht, the Netherlands: Kluwer Academic Publishers.

A P P E N D I X A
A-3
Countries participating in the study were required to administer tests to the students in the two grades at Population 2, but could choose whether or not to participate at the other levels. In about half of the countries at Populations 1 and 2, subsets of the upper-grade students who completed the written tests also participated in a performance assessment. In the performance assessment, students engaged in a number of hands-on mathematics and science activities.
TIMSS also administered a broad array of questionnaires to collect data about how the curriculum is implemented in classrooms, including the instructional practices used to deliver it. The questionnaires also were used to collect information about the social and cultural contexts for learning. Questionnaires were administered at the country level about decision-making and organizational features within their educational systems. The students who were tested answered questions pertaining to their atti-tudes towards mathematics and science, classroom activities, home background, and out-of-school activities. The mathematics and science teachers of sampled students responded to questions about teaching emphasis on the topics in the curriculum frame-works, instructional practices, textbook usage, professional training and education, and their views on mathematics and science. The heads of schools responded to ques-tions about school staffing and resources, mathematics and science course offerings, and teacher support. In addition, a volume was compiled that presents descriptions of the educational systems of the participating countries.4
As in the 1995 TIMSS assessment, for the 1997 State TIMSS Benchmarking Study, background questionnaires were administered to the students, teachers, and school principals. Both the teacher and school administrator questionnaires were abbreviated versions of those administered for TIMSS, adapted to minimize the burden on school personnel. The student questionnaire, however, was identical to those administered to students in the United States during the 1995 assessment. Like the 1995 assessment, the State TIMSS Benchmarking Study was directed by the TIMSS International Study Center at Boston College. The assessment was conducted using the same adminis-trative procedures and applying the same technical standards as the international project.
4 Robitaille, D.F. (1997). National Contexts for Mathematics and Science Education: An Encyclopedia of the Education Systems Participating in TIMSS. Vancouver, B.C.: Pacific Educational Press.

A-4
A P P E N D I X A
Developing the TIMSS Mathematics TestThe TIMSS curriculum framework underlying the mathematics tests at all three populations was developed by groups of mathematics educators with input from the TIMSS National Research Coordinators (NRCs). As shown in Figure A.1, the mathe-matics curriculum framework contains three dimensions or aspects. The content aspect represents the subject matter content of school mathematics. The performance expectations aspect describes, in a non-hierarchical way, the many kinds of perfor-mances or behaviors that might be expected of students in school mathematics. The perspectives aspect focuses on the development of students’ attitudes, interest, and motivations in mathematics.5
Working within the mathematics curriculum framework, mathematics test specifica-tions were developed for Population 2 that included items representing a wide range of mathematics topics and eliciting a range of skills from the students. The tests were developed through an international consensus involving input from experts in mathe-matics and measurement specialists. The TIMSS Subject Matter Advisory Committee, including distinguished scholars from 10 countries, ensured that the test reflected current thinking and priorities in mathematics. The items underwent an iterative devel-opment and review process, with one of the pilot testing efforts involving 43 countries. Every effort was made to help ensure that the tests represented the curricula of the par-ticipating countries and that the items did not exhibit any bias towards or against particular countries, including modifying specifications in accordance with data from the cur-riculum analysis component, obtaining ratings of the items by subject-matter spe-cialists within the participating countries, and conducting thorough statistical item analysis of data collected in the pilot testing. The final forms of the test were endorsed by the NRCs of the participating countries.6
Table A.1 presents the six content areas included in the Population 2 mathematics test and the numbers of items and score points in each category. Distributions also are included for the four performance categories derived from the performance expecta-tions aspect of the curriculum framework. Approximately one-fourth of the items were in the free-response format, requiring students to generate and write their own answers. Designed to represent approximately one-third of students’ response time, some free-response questions asked for short answers while others required extended responses where students needed to show their work or provide explanations for their answers. The remaining questions used a multiple-choice format. In scoring the tests, correct answers to most questions were worth one point.
5 The complete TIMSS curriculum frameworks can be found in Robitaille, D.F. et al. (1993). TIMSS Monograph No. 1: Curriculum Frameworks for Mathematics and Science. Vancouver, B.C.: Pacific Educational Press.
6 For a full discussion of the TIMSS test development effort, please see: Garden, R.A. and Orpwood, G. (1996). “TIMSS Test Development” in M.O. Martin and D.L. Kelly (eds.), Third International Mathematics and Science Study Technical Report, Volume I. Chestnut Hill, MA: Boston College; and Garden, R.A. (1996). “Development of the TIMSS Achievement Items” in D.F. Robitaille and R.A. Garden (eds.), TIMSS Monograph No. 2: Research Questions and Study Design. Vancouver, B.C.: Pacific Educational Press.
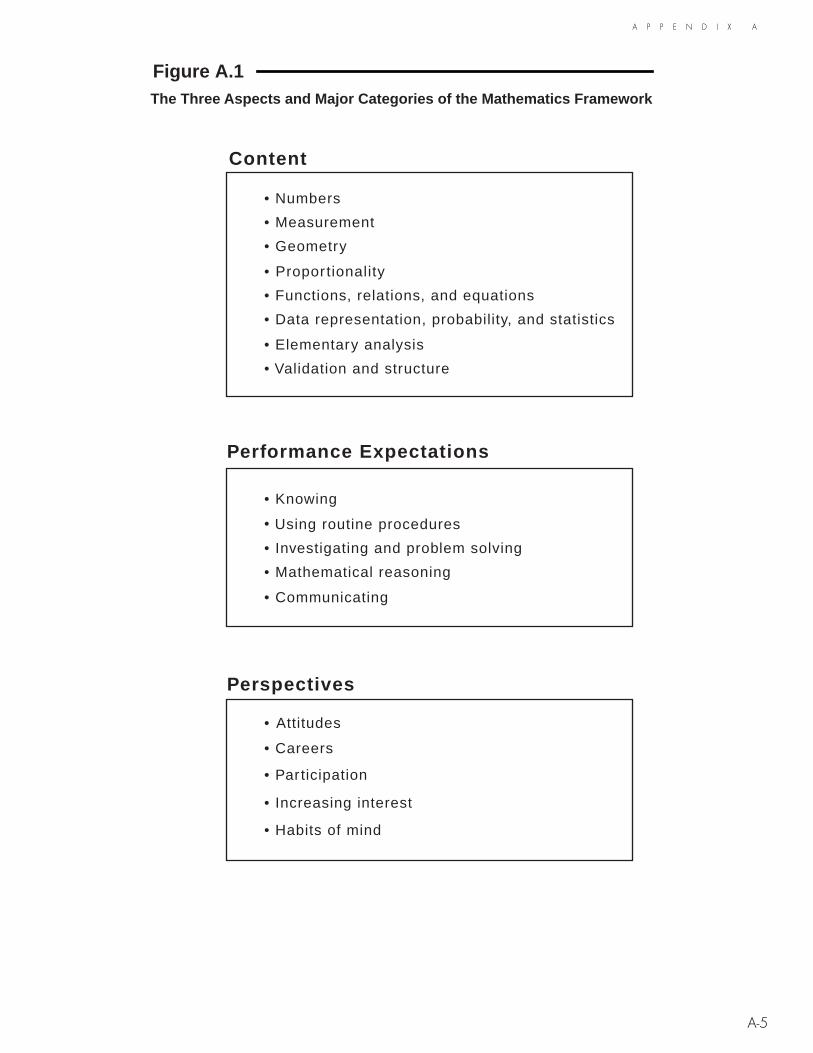
A-5
A P P E N D I X A
Perspectives
Figure A.1The Three Aspects and Major Categories of the Mathematics Framework
• Numbers
• Measurement
• Geometry
• Propor tionality
• Functions, relations, and equations
• Data representation, probability, and statistics
• Elementary analysis
• Validation and structure
• Knowing
• Using routine procedures
• Investigating and problem solving
• Mathematical reasoning
• Communicating
• Attitudes
• Careers
• Participation
• Increasing interest
• Habits of mind
Content
Performance Expectations

A-6
A P P E N D I X A
Table A.1Distribution of Mathematics Items by Content Reporting Category andPerformance Category - Eighth Grade*
Content Category Percentage of Items
Total Number of Items
Number of Multiple-
Choice Items
Number of Short-Answer
Items
Number of Extended-Response
Items
Number of Score Points 1
Fractions and Number Sense 34% 51 41 9 1 52
Geometry 15% 23 22 1 0 23
Algebra 18% 27 22 3 2 30
Data Representation, Analysis and Probability2 14% 21 19 1 1 23
Measurement 12% 18 13 3 2 23
Proportionality 7% 11 8 2 1 12
Total 100% 151 125 19 7 163
Performance Category Percentage of Items
Total Number of Items
Number of Multiple-
Choice Items
Number of Short-Answer
Items
Number of Extended-Response
Items
Number of Score Points 1
Knowing 22% 33 31 2 0 33
Performing Routine Procedures 25% 38 32 6 0 38
Using Complex Procedures 21% 32 28 4 0 32
Solving Problems3 32% 48 34 7 7 60
*Eighth grade in most countries. See Table 2 for information about the grades tested in each country.1In scoring the tests correct answers to most items were worth one point. However, responses to some constructed-response items were evaluated for partial credit with a fully correct answer awarded up to three points. In addition, some items had two parts. Thus, the number of score points exceeds the number of items in the test.2One item in the Data Representation, Analysis, and Probability category was deleted prior to analysis due to poor performing item statistics.3Includes two extended-response items classified as "Justifying and Proving" and two extended-response items classified as "Communicating."
SO
UR
CE
: IE
A T
hird
Inte
rnat
iona
l Mat
hem
atic
s an
d S
cien
ce S
tudy
(T
IMS
S),
199
4-95
. Mis
sour
i and
Ore
gon
data
col
lect
ed in
199
7.

A P P E N D I X A
A-7
Consistent with the approach of allotting students longer response time for the con-structed-response questions than for multiple-choice questions, however, responses to some of these questions (particularly those requiring extended responses) were eval-uated for partial credit with a fully correct answer being awarded two or even three points (see later section on scoring). This, in addition to the fact that several items had two parts, means that the total number of score points available for analysis somewhat exceeds the number of items included in the test.
The TIMSS instruments were prepared in English and translated into 30 additional languages. In addition, it sometimes was necessary to adapt the international versions for cultural purposes, including the 11 countries that tested in English. This process represented an enormous effort for the national centers, with many checks along the way. The translation effort included: (1) developing explicit guidelines for translation and cultural adaptation, (2) translation of the instruments by the national centers in accordance with the guidelines and using two or more independent translations, (3) consultation with subject-matter experts regarding cultural adaptations to ensure that the meaning and difficulty of items did not change, (4) verification of the quality of the translations by professional translators from an independent translation company, (5) corrections by the national centers in accordance with the suggestions made, (6) veri-fication that corrections were implemented, and (7) a series of statistical checks after the testing to detect items that did not perform comparably across countries.7
TIMSS Test DesignThe tests administered in the 1997 State TIMSS Benchmarking Study were identical to those administered to eighth-grade students during the 1995 assessment. In accor-dance with the design, not all of the students responded to all of the mathematics items. To ensure broad subject matter coverage without overburdening individual stu-dents, a rotated design that included both the mathematics and science items was used. Thus, the same students participated in both the mathematics and science testing. The TIMSS Population 2 test consisted of eight booklets, with each booklet requiring 90 minutes of student response time. In accordance with the design, the mathematics and science items were assembled into 26 different clusters (labeled A through Z). Eight of the clusters were designed to take students 12 minutes to complete; 10 of the clusters, 22 minutes; and 8 clusters, 10 minutes. In all, the design provided a total of 396 unique testing minutes, 198 for mathematics and 198 for science. Cluster A was a core cluster assigned to all booklets. The remaining clusters were assigned to the booklets in accordance with the rotated design so that representative samples of students responded to each cluster.8
7 More details about the translation verification procedures can be found in Mullis, I.V.S., Kelly, D.L., and Haley, K. (1996). “Translation Verification Procedures” in M.O. Martin and I.V.S. Mullis (eds.), Third International Mathematics and Science Study: Quality Assurance in Data Collection. Chestnut Hill, MA: Boston College; and Maxwell, B. (1996). “Translation and Cultural Adaptation of the TIMSS Instruments” in M.O. Martin and D.L. Kelly (eds.), Third International Mathematics and Science Study Technical Report, Volume I. Chestnut Hill, MA: Boston College.
8 The design is fully documented in Adams, R. and Gonzalez, E. (1996). “Design of the TIMSS Achievement Instruments” in D.F. Robitaille and R.A. Garden (eds.), TIMSS Monograph No. 2: Research Questions and Study Design. Vancouver, B.C.: Pacific Educational Press; and Adams, R. and Gonzalez, E. (1996). “TIMSS Test Design” in M.O. Martin and D.L. Kelly (eds.), Third International Mathematics and Science Study Techni-cal Report, Volume I. Chestnut Hill, MA: Boston College.

A-8
A P P E N D I X A
Sample Implementation and Participation RatesThe selection of valid and efficient samples is crucial to the quality and success of an international comparative study such as TIMSS. The accuracy of the survey results depends on the quality of sampling information available and on the quality of the sampling activities themselves. For the countries participating in TIMSS, NRCs worked on all phases of sampling with staff from Statistics Canada. NRCs received training in how to select the school and student samples and in the use of the sampling software. In consultation with the TIMSS sampling referee (Keith Rust, Westat, Inc.), staff from Statistics Canada reviewed the national sampling plans, sampling data, sampling frames, and sample execution. This documentation was used by the Interna-tional Study Center in consultation with Statistics Canada, the sampling referee, and the Technical Advisory Committee, to evaluate the quality of the samples. For the State TIMSS Benchmarking Study, the school samples were drawn by Westat, Inc., following the international procedures.
In a few situations where it was not possible to implement TIMSS testing for the entire internationally desired definition of Population 2 (all students in the two adjacent grades with the greatest proportion of 13-year-olds), countries were per-mitted to define a national desired population which did not include part of the inter-nationally desired population. Table A.2 shows any differences in coverage between the international and national desired populations. Most countries achieved 100% cov-erage (36 out of 41). In some instances, countries, as a matter of practicality, needed to define their tested population according to the structure of school systems, but in Germany and Switzerland, parts of the country were simply unwilling to take part in TIMSS. Because coverage fell below 65% for Latvia, the Latvian results have been labeled “Latvia (LSS),” for Latvian Speaking Schools, throughout the report. Unlike the United States which tested students in both public and private schools, Missouri and Oregon restricted the testing to public school students. Public school students account for 86% of the eighth-grade school population in Missouri, and 93% in Oregon. The sampling frames for both Missouri and Oregon included 100% of their public school students.
Within the desired population, countries could define a population that excluded a small percent (less than 10%) of certain kinds of schools or students that would be very difficult or resource intensive to test (e.g., schools for students with special needs or schools that were very small or located in extremely remote areas). Table A.2 also shows that the degree of such exclusions was small, only England exceeded the 10% limit. Missouri and Oregon had minimal exclusions. Both states had no exclusions at the school level and within-school exclusions of below 2% and 1%, respectively.

A-9
A P P E N D I X A
Table A.2Coverage of TIMSS Target PopulationThe International Desired Population is defined as follows: All students enrolled in the two adjacent grades with thelargest proportion of 13-year-old students at the time of testing (seventh and eighth grade in most countries).Missouri and Oregon tested only at the eighth grade.
International Desired Population National Desired Population
CountryCoverage Notes on Coverage School-Level
ExclusionsWithin-Sample
Exclusions
Overall Exclusions
‡ UNITED STATES 100% 0.4% 1.7% 2.1% ‡ MISSOURI 100% Public Schools only (86%) 0.0% 1.4% 1.4% OREGON 100% Public Schools only (93%) 0.0% 0.9% 0.9% Australia 100% 0.2% 0.7% 0.8% Austria 100% 2.9% 0.2% 3.1%
‡ Belgium (Fl) 100% 3.8% 0.0% 3.8% Belgium (Fr) 100% 4.5% 0.0% 4.5% Bulgaria 100% 0.6% 0.0% 0.6% Canada 100% 2.4% 2.1% 4.5% Colombia 100% 3.8% 0.0% 3.8% Cyprus 100% 0.0% 0.0% 0.0% Czech Republic 100% 4.9% 0.0% 4.9% Denmark 100% 0.0% 0.0% 0.0%
‡ England 100% 8.4% 2.9% 11.3% ‡ France 100% 2.0% 0.0% 2.0% ‡ Germany 88% 15 of 16 regions* 8.8% 0.9% 9.7% Greece 100% 1.5% 1.3% 2.8% Hong Kong 100% 2.0% 0.0% 2.0% Hungary 100% 3.8% 0.0% 3.8% Iceland 100% 1.7% 2.9% 4.5% Iran, Islamic Rep. 100% 0.3% 0.0% 0.3% Ireland 100% 0.0% 0.4% 0.4%
‡ Israel 74% Hebrew Public Education System 3.1% 0.0% 3.1% Japan 100% 0.6% 0.0% 0.6% Korea 100% 2.2% 1.6% 3.8% Kuwait 100% 0.0% 0.0% 0.0%
‡ Latvia (LSS) 51% Latvian-speaking schools 2.9% 0.0% 2.9% ‡ Lithuania 84% Lithuanian-speaking schools 6.6% 0.0% 6.6% Netherlands 100% 1.2% 0.0% 1.2% New Zealand 100% 1.3% 0.4% 1.7% Norway 100% 0.3% 1.9% 2.2% Portugal 100% 0.0% 0.3% 0.3% Romania 100% 2.8% 0.0% 2.8% Russian Federation 100% 6.1% 0.2% 6.3% Scotland 100% 0.3% 1.9% 2.2% Singapore 100% 4.6% 0.0% 4.6% Slovak Republic 100% 7.4% 0.1% 7.4% Slovenia 100% 2.4% 0.2% 2.6% South Africa 100% 9.6% 0.0% 9.6% Spain 100% 6.0% 2.7% 8.7% Sweden 100% 0.0% 0.9% 0.9%
‡ Switzerland 86% 22 of 26 cantons 4.4% 0.8% 5.3% Thailand 100% 6.2% 0.0% 6.2%
‡Did not meet sampling guidelines for population coverage or use of replacement schools. See Figure 1.*One region (Baden-Wuerttemberg) did not participate.
SO
UR
CE
: IE
A T
hird
Inte
rnat
iona
l Mat
hem
atic
s an
d S
cien
ce S
tudy
(T
IMS
S),
199
4-95
. Mis
sour
i and
Ore
gon
data
col
lect
ed in
199
7.

A-10
A P P E N D I X A
Within countries, TIMSS used a two-stage sample design at Population 2, where the first stage involved selecting 150 public and private schools within each country. Within each school, the basic approach required countries to use random procedures to select one mathematics class at the eighth grade and one at the seventh grade (or the corresponding upper and lower grades in that country). All of the students in those two classes were to participate in the TIMSS testing. This approach was designed to yield a representative sample of 7,500 students per country, with approximately 3,750 stu-dents at each grade.9 Typically, between 450 and 3,750 students responded to each item at each grade level, depending on the booklets in which the items were located.
In the 1997 State TIMSS Benchmarking Study the sample design specified a proba-bility sample of between 50 and 60 schools, with one eighth-grade classroom ran-domly selected within each school. This design was expected to yield a representative sample of 2000 to 2500 students in each state. Westat staff worked with the Missouri and Oregon state departments of education to obtain lists of the public schools and to draw the school samples. The states were responsible for obtaining the cooperation of the sampled schools.
Countries were required to obtain a participation rate of at least 85% for both schools and students, or a combined rate (the product of school and student participation) of 75%. Tables A.3 and A.4 show the school and student sample sizes, respectively. Table A.5 shows the school, student, and overall participation rates for the TIMSS countries, as well as for Missouri and Oregon.
Figure A.2 shows how the states and countries have been grouped in tables reporting achievement results. An acceptable participation rate was 85% for both the schools and students, or a combined rate (the product of school and student participation) of 75% – with or without replacement schools. Countries that achieved acceptable par-ticipation rates, and that complied with the TIMSS guidelines for grade selection and classroom sampling are shown in the first panel of Figure A.2. Missouri and Oregon both achieved acceptable participation rates, however Missouri met sample partici-pation guidelines only after the replacement schools were included. Both states sat-isfied the TIMSS guidelines for grade selection and classroom sampling.
Countries not reaching at least 50% school participation without the use of replace-ments schools, or that failed to reach the sampling participation standard even with the inclusion of replacement schools, are shown in the second panel of Figure A.2. These countries are presented in a separate section of the achievement tables in Chapters 1, 2, and 3 in alphabetical order, and are shown in tables in Chapters 4 and 5 in italics.
9 The sample design for TIMSS is described in detail in Foy, P., Rust, K., and Schleicher, A. (1996). “TIMSS Sample Design” in M.O. Martin and D.L. Kelly (eds.), Third International Mathematics and Science Study Technical Report, Volume I. Chestnut Hill, MA: Boston College.
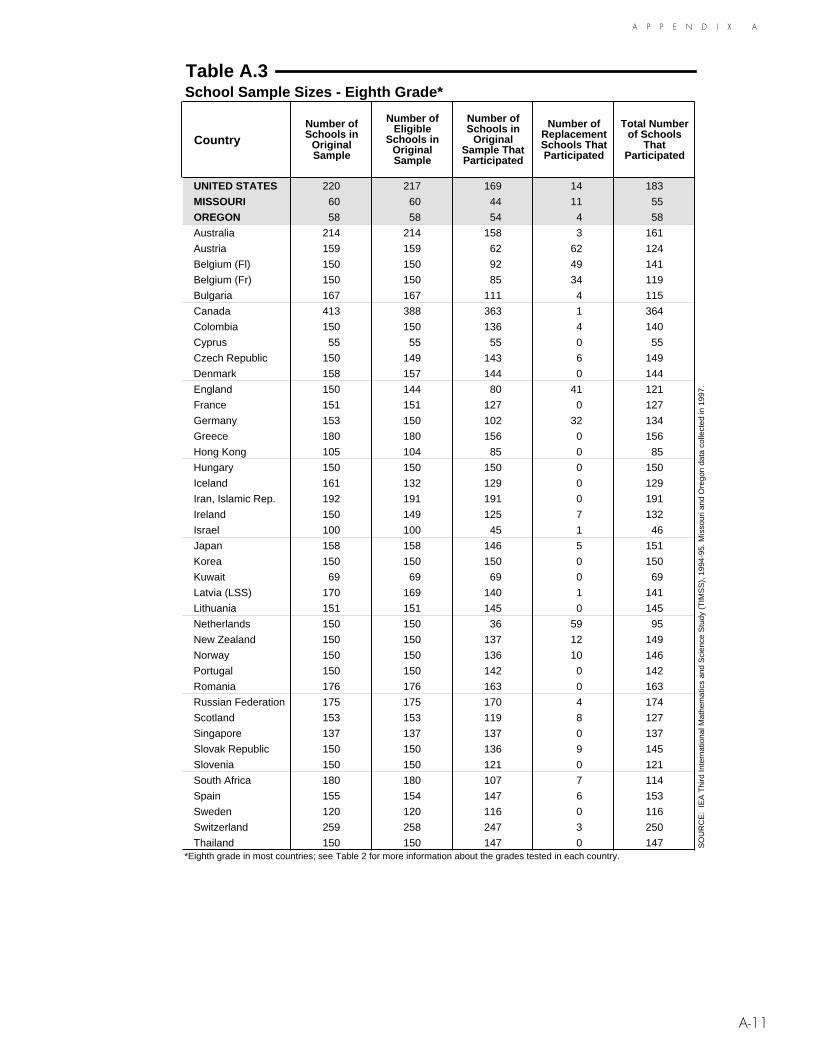
A-11
A P P E N D I X A
Table A.3School Sample Sizes - Eighth Grade*
CountryNumber of Schools in
Original Sample
Number of Eligible
Schools in Original Sample
Number of Schools in
Original Sample That Participated
Number of Replacement Schools That Participated
Total Number of Schools
That Participated
UNITED STATES 220 217 169 14 183
MISSOURI 60 60 44 11 55
OREGON 58 58 54 4 58
Australia 214 214 158 3 161
Austria 159 159 62 62 124
Belgium (Fl) 150 150 92 49 141
Belgium (Fr) 150 150 85 34 119
Bulgaria 167 167 111 4 115
Canada 413 388 363 1 364
Colombia 150 150 136 4 140
Cyprus 55 55 55 0 55
Czech Republic 150 149 143 6 149
Denmark 158 157 144 0 144
England 150 144 80 41 121
France 151 151 127 0 127
Germany 153 150 102 32 134
Greece 180 180 156 0 156
Hong Kong 105 104 85 0 85
Hungary 150 150 150 0 150
Iceland 161 132 129 0 129
Iran, Islamic Rep. 192 191 191 0 191
Ireland 150 149 125 7 132
Israel 100 100 45 1 46
Japan 158 158 146 5 151
Korea 150 150 150 0 150
Kuwait 69 69 69 0 69
Latvia (LSS) 170 169 140 1 141
Lithuania 151 151 145 0 145
Netherlands 150 150 36 59 95
New Zealand 150 150 137 12 149
Norway 150 150 136 10 146
Portugal 150 150 142 0 142
Romania 176 176 163 0 163
Russian Federation 175 175 170 4 174
Scotland 153 153 119 8 127
Singapore 137 137 137 0 137
Slovak Republic 150 150 136 9 145
Slovenia 150 150 121 0 121
South Africa 180 180 107 7 114
Spain 155 154 147 6 153
Sweden 120 120 116 0 116
Switzerland 259 258 247 3 250
Thailand 150 150 147 0 147 *Eighth grade in most countries; see Table 2 for more information about the grades tested in each country.
SO
UR
CE
: IE
A T
hird
Inte
rnat
iona
l Mat
hem
atic
s an
d S
cien
ce S
tudy
(T
IMS
S),
199
4-95
. Mis
sour
i and
Ore
gon
data
col
lect
ed in
199
7.

A-12
A P P E N D I X A
Table A.4Student Sample Sizes - Eighth Grade*
Country
Number of Students
Sampled in Participating
Schools
Number of Students
Withdrawn from Class /
School
Number of Students Excluded
Number of Students Eligible
Number of Students Absent
Total Number of Students Assessed
UNITED STATES 8026 104 108 7814 727 7087
MISSOURI 2324 35 30 2259 144 2115
OREGON 2446 50 18 2378 162 2216
Australia 8027 63 61 7903 650 7253
Austria 2969 14 4 2951 178 2773
Belgium (Fl) 2979 1 0 2978 84 2894
Belgium (Fr) 2824 0 1 2823 232 2591
Bulgaria 2300 0 0 2300 327 1973
Canada 9240 134 206 8900 538 8362
Colombia 2843 6 0 2837 188 2649
Cyprus 3045 15 0 3030 107 2923
Czech Republic 3608 6 0 3602 275 3327
Denmark 2487 0 0 2487 190 2297
England 2015 37 60 1918 142 1776
France 3141 0 0 3141 143 2998
Germany 3318 0 35 3283 413 2870
Greece 4154 27 23 4104 114 3990
Hong Kong 3415 12 0 3403 64 3339
Hungary 3339 0 0 3339 427 2912
Iceland 2025 10 65 1950 177 1773
Iran, Islamic Rep. 3770 20 0 3750 56 3694
Ireland 3411 28 10 3373 297 3076
Israel 1453 6 0 1447 32 1415
Japan 5441 0 0 5441 300 5141
Korea 2998 31 0 2967 47 2920
Kuwait 1980 3 0 1977 322 1655
Latvia (LSS) 2705 19 0 2686 277 2409
Lithuania 2915 2 0 2913 388 2525
Netherlands 2112 14 1 2097 110 1987
New Zealand 4038 121 12 3905 222 3683
Norway 3482 26 49 3407 140 3267
Portugal 3589 70 13 3506 115 3391
Romania 3899 0 0 3899 174 3725
Russian Federation 4311 42 10 4259 237 4022
Scotland 3289 0 46 3243 380 2863
Singapore 4910 18 0 4892 248 4644
Slovak Republic 3718 5 3 3710 209 3501
Slovenia 2869 15 8 2846 138 2708
South Africa 4793 0 0 4793 302 4491
Spain 4198 27 102 4069 214 3855
Sweden 4483 71 28 4384 309 4075
Switzerland 4989 16 24 4949 94 4855
Thailand 5850 0 0 5850 0 5850 *Eighth grade in most countries; see Table 2 for more information about the grades tested in each country.
SO
UR
CE
: IE
A T
hird
Inte
rnat
iona
l Mat
hem
atic
s an
d S
cien
ce S
tudy
(T
IMS
S),
199
4-95
. Mis
sour
i and
Ore
gon
data
col
lect
ed in
199
7.
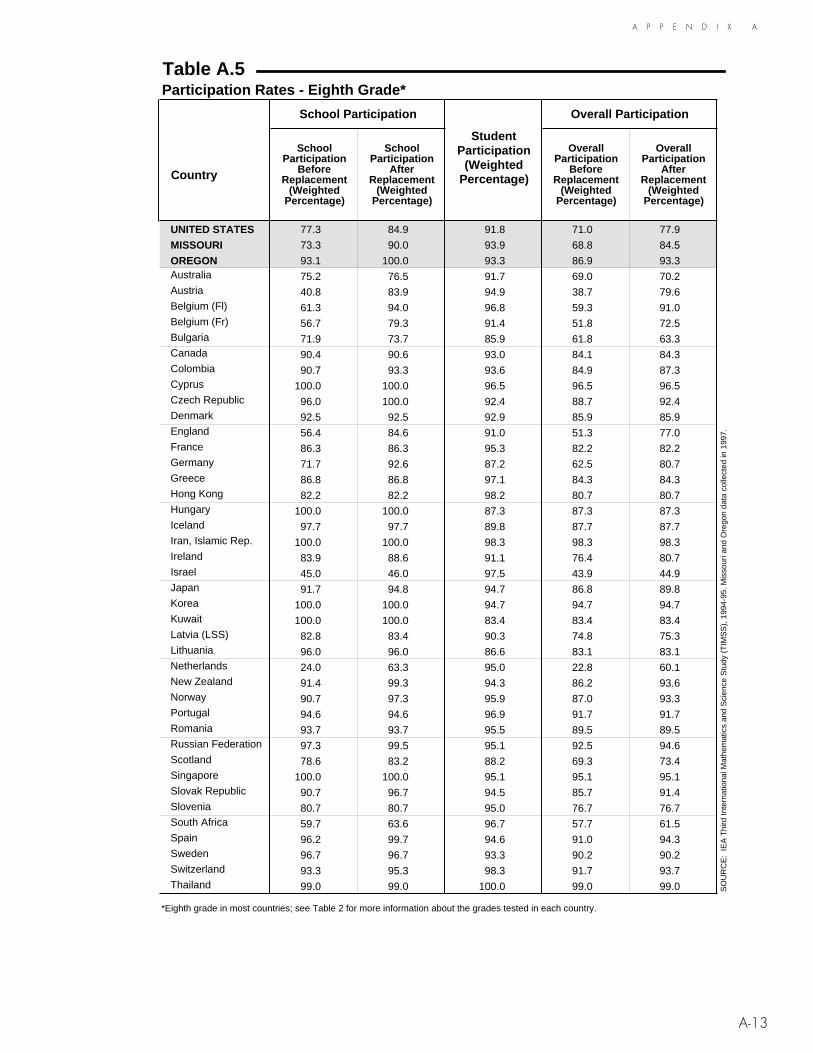
A-13
A P P E N D I X A
Table A.5Participation Rates - Eighth Grade*
School Participation Overall Participation
Country
School Participation
Before Replacement
(Weighted Percentage)
School Participation
After Replacement
(Weighted Percentage)
Student Participation
(Weighted Percentage)
Overall Participation
Before Replacement
(Weighted Percentage)
Overall Participation
After Replacement
(Weighted Percentage)
UNITED STATES 77.3 84.9 91.8 71.0 77.9
MISSOURI 73.3 90.0 93.9 68.8 84.5
OREGON 93.1 100.0 93.3 86.9 93.3Australia 75.2 76.5 91.7 69.0 70.2Austria 40.8 83.9 94.9 38.7 79.6Belgium (Fl) 61.3 94.0 96.8 59.3 91.0Belgium (Fr) 56.7 79.3 91.4 51.8 72.5Bulgaria 71.9 73.7 85.9 61.8 63.3Canada 90.4 90.6 93.0 84.1 84.3Colombia 90.7 93.3 93.6 84.9 87.3Cyprus 100.0 100.0 96.5 96.5 96.5Czech Republic 96.0 100.0 92.4 88.7 92.4Denmark 92.5 92.5 92.9 85.9 85.9England 56.4 84.6 91.0 51.3 77.0France 86.3 86.3 95.3 82.2 82.2Germany 71.7 92.6 87.2 62.5 80.7Greece 86.8 86.8 97.1 84.3 84.3Hong Kong 82.2 82.2 98.2 80.7 80.7Hungary 100.0 100.0 87.3 87.3 87.3Iceland 97.7 97.7 89.8 87.7 87.7Iran, Islamic Rep. 100.0 100.0 98.3 98.3 98.3Ireland 83.9 88.6 91.1 76.4 80.7Israel 45.0 46.0 97.5 43.9 44.9Japan 91.7 94.8 94.7 86.8 89.8Korea 100.0 100.0 94.7 94.7 94.7Kuwait 100.0 100.0 83.4 83.4 83.4Latvia (LSS) 82.8 83.4 90.3 74.8 75.3Lithuania 96.0 96.0 86.6 83.1 83.1Netherlands 24.0 63.3 95.0 22.8 60.1New Zealand 91.4 99.3 94.3 86.2 93.6Norway 90.7 97.3 95.9 87.0 93.3Portugal 94.6 94.6 96.9 91.7 91.7Romania 93.7 93.7 95.5 89.5 89.5Russian Federation 97.3 99.5 95.1 92.5 94.6Scotland 78.6 83.2 88.2 69.3 73.4Singapore 100.0 100.0 95.1 95.1 95.1Slovak Republic 90.7 96.7 94.5 85.7 91.4Slovenia 80.7 80.7 95.0 76.7 76.7South Africa 59.7 63.6 96.7 57.7 61.5Spain 96.2 99.7 94.6 91.0 94.3Sweden 96.7 96.7 93.3 90.2 90.2Switzerland 93.3 95.3 98.3 91.7 93.7Thailand 99.0 99.0 100.0 99.0 99.0
*Eighth grade in most countries; see Table 2 for more information about the grades tested in each country.
SO
UR
CE
: IE
A T
hird
Inte
rnat
iona
l Mat
hem
atic
s an
d S
cien
ce S
tudy
(T
IMS
S),
199
4-95
. Mis
sour
i and
Ore
gon
data
col
lect
ed in
199
7.

A-14
A P P E N D I X A
Figure A.2Countries Grouped for Reporting of Achievement According to Their Compliance with Guidelines for Sample Implementation and Participation Rates
Eighth Grade*
Countries satisfying guidelines for sample participation rates, grade selection, and sampling procedures
† Belgium (Fl) 1 Lithuania Canada † Missouri Cyprus New Zealand Czech Republic Norway
†2 England Oregon France Portugal Hong Kong Russian Federation Hungary Singapore Iceland Slovak Republic Iran, Islamic Rep. Spain Ireland Sweden Japan 1 Switzerland Korea † United States
1 Latvia (LSS)
Countries not satisfying guidelines for sample participation Australia Bulgaria Austria Netherlands Belgium (Fr) Scotland
Countries not meeting age/grade specifications (high percentage of older students)
Colombia Romania†1 Germany Slovenia
Countries with unapproved sampling procedures at the classroom level
Denmark Thailand Greece
Countries with unapproved sampling procedures at classroom level and not meeting other guidelines
1 Israel South Africa Kuwait
* Eighth grade in most countries; see Table 2 for more information about the grades tested in each country.† Met guidelines for sample participation rates only after replacement schools were included.1 National Desired Population does not cover all of Iternational Desired Population (see Table 1).
Because coverage falls below 65%, Latvia is annotated LSS for Latvian Speaking Schools only.2 National Defined Population covers less than 90 percent of National Desired Population (see Table 1).
SO
UR
CE
: IE
A T
hird
Inte
rnat
iona
l Mat
hem
atic
s an
d S
cien
ce S
tudy
(T
IMS
S),
199
4-95
. Mis
sour
i and
Ore
gon
data
col
lect
ed in
199
7.

A P P E N D I X A
A-15
The TIMSS target population was defined as students in the two adjacent grades with the most 13-year-olds at the time of testing, the seventh and eighth grades in most countries. To provide a better curricular match, four countries (i.e., Colombia, Germany, Romania, and Slovenia), elected to test their seventh- and eighth-grade stu-dents even though that meant not testing the two grades with the most 13-year-olds. This led to their students being somewhat older than in the other countries and states. These countries are also presented in a separate section of the achievement tables in Chapters 1, 2, and 3 in alphabetical order, and are shown in tables in Chapters 4 and 5 in italics.
For a variety of reasons, three countries (Denmark, Greece, and Thailand) did not comply with the guidelines for sampling classrooms. Their results are also presented in a separate section of the achievement tables in Chapters 1, 2, and 3 in alphabetical order, and are italicized in the tables in Chapters 4 and 5. Israel, Kuwait, and South Africa also had difficulty complying with the classroom selection guidelines, but in addition had other difficulties (Kuwait tested a single grade with relatively few 13-year-olds; Israel and South Africa had low sampling participation rates), and so these countries are also presented in separate sections in the tables in Chapters 1, 2, and 3, and are italicized in the tables in Chapters 4 and 5.
Data CollectionIn the 1995 TIMSS assessment, each participating country was responsible for car-rying out all aspects of the data collection, using standardized procedures developed for the study. Training manuals were developed for school coordinators and test administrators that explained procedures for receipt and distribution of materials as well as for the activities related to the testing sessions. The test administrator manuals covered procedures for test security, standardized scripts to regulate directions and timing, rules for answering students’ questions, and steps to ensure that identification on the test booklets and questionnaires corresponded to the information on the forms used to track students.
For the 1997 State TIMSS Benchmarking Study, Westat, Inc., was responsible for col-lecting the data in Missouri and Oregon. Westat was also responsible for the TIMSS data collection in the United States during the 1995 assessment. Westat Supervisors and Test Administrators were trained, by Westat staff, in the TIMSS procedures and conducted the testing in the sampled schools in accordance with the procedures pre-scribed in the TIMSS manuals.
Each country participating in the 1995 assessment was responsible for conducting quality control procedures and describing this effort as part of the NRC’s report doc-umenting procedures used in the study. In addition, the International Study Center considered it essential to establish some method to monitor compliance with stan-dardized procedures. NRCs were asked to nominate a person, such as a retired school teacher, to serve as quality control monitor for their countries, and in almost all cases, the International Study Center adopted the NRCs’ first suggestion. The International Study Center developed manuals for the quality control monitors and briefed them in two-day training sessions about TIMSS, the responsibilities of the national centers in conducting the study, and their own roles and responsibilities.

A-16
A P P E N D I X A
The TIMSS quality control monitors interviewed the NRCs about data collection plans and procedures. They also selected a sample of approximately 10 schools to visit, where they observed testing sessions and interviewed school coordinators.10 Quality control monitors observed test administrations and interviewed school coordi-nators in 37 countries, and interviewed school coordinators or test administrators in 3 additional countries.
The results of the interviews conducted during the 1995 assessment indicate that, in general, NRCs had prepared well for data collection and, despite the heavy demands of the schedule and shortages of resources, were in a position to conduct the data col-lection in an efficient and professional manner. Similarly, the TIMSS tests appeared to have been administered in compliance with international procedures, including the activities preliminary to the testing session, the activities during the testing sessions, and the school-level activities related to receiving, distributing, and returning mate-rials from the national centers.
For the 1997 State TIMSS Benchmarking Study, the International Study Center engaged six quality control monitors to visit schools in Oregon and Missouri during the data collection. The quality control monitors attended a training session held at Boston College, modeled on the international training sessions held in 1995. Each quality control monitor visited between three and five schools to observe the testing and interview the school coordinators. Results of the interviews indicate that the TIMSS international procedures were closely followed in the 1997 State TIMSS Benchmarking Study.
Scoring the Free-Response ItemsBecause approximately one-third of the written test time was devoted to free-response items, TIMSS needed to develop procedures for reliably evaluating student responses within and across countries. Scoring utilized two-digit codes with rubrics specific to each item. Development of the rubrics was led by the Norwegian TIMSS national center. The first digit designates the correctness level of the response. The second digit, combined with the first digit, represents a diagnostic code used to identify spe-cific types of approaches, strategies, or common errors and misconceptions. Although not specifically used in this report, analyses of responses based on the second digit should provide insight into ways to help students better understand mathematics con-cepts and problem-solving approaches.
To meet the goal of implementing reliable scoring procedures based on the TIMSS rubrics, the International Study Center prepared guides containing the rubrics and explanations of how to implement them together with example student responses for the various rubric categories. These guides, together with more examples of student responses for practice in applying the rubrics were used as a basis for an ambitious
10 The results of the interviews and observations by the quality control monitors are presented in Martin M.O., Hoyle, C.D., and Gregory, K.D. (1996). “Monitoring the TIMSS Data Collection” and “Observing the TIMSS Test Administration” both in M.O. Martin and I.V.S. Mullis (eds.), Third International Mathematics and Science Study: Quality Assurance in Data Collection. Chestnut Hill, MA: Boston College.
A P P E N D I X A
A-17
series of regional training sessions. The training sessions were designed to assist rep-resentatives of national centers who would then be responsible for training personnel in their respective countries to apply the two-digit codes reliably.11 In 1997, the Inter-national Study Center conducted a two-day training session for the State TIMSS Benchmarking Study, to ensure the same procedures would be followed. National Computer Systems (NCS), under contract with Westat, conducted the scoring for both the 1995 and the 1997 assessments.
To gather and document empirical information about the within-country agreement among scorers, TIMSS developed a procedure whereby systematic subsamples of approximately 10% of the students’ responses were to be coded independently by two different readers. To provide information about the cross-country agreement among scorers, TIMSS conducted a special study at Population 2, where 39 scorers from 21 of the participating countries evaluated common sets of students’ responses to more than half of the free-response items.12
Table A.6 shows the average and range of the within-country exact percent of agreement between scorers on the free-response items in the Population 2 mathe-matics test for 26 countries and Missouri and Oregon. Unfortunately, lack of resources precluded several countries from providing this information. A very high percent of exact agreement was observed, with averages across the items for the correctness score ranging from 97% to 100% and an overall average of 99% across the 26 coun-tries and two states. Correctness score agreement across the items averaged 99% for Missouri and Oregon. As an extra check on the reliability of the scoring process, the NCS staff who worked on the state benchmarking project also scored a sample of the test booklets from the 1995 TIMSS data collection in the United States. Agreement between their scores and the scores originally assigned to the booklets was very high, averaging 98% in mathematics and 92% in science.
11 The procedures used in the training sessions are documented in Mullis, I.V.S., Garden, R.A., and Jones, C.A. (1996). “Training for Scoring the TIMSS Free-Response Items” in M.O. Martin and D.L. Kelly (eds.), Third International Mathematics and Science Study Technical Report, Volume I. Chestnut Hill, MA: Boston College.
12 Details about the reliability studies can be found in Mullis, I.V.S. and Smith, T.A. (1996). “Quality Control Steps for Free-Response Scoring” in M.O. Martin and I.V.S. Mullis (eds.), Third International Mathematics and Science Study: Quality Assurance in Data Collection. Chestnut Hill, MA: Boston College.

A-18
A P P E N D I X A
Table A.6TIMSS Within-Country Free-Response Coding Reliability Data for Eighth Grade*
Mathematics Items †
Correctness Score Agreement Diagnostic Code Agreement
Country Average of Exact Percent Agreement
Across Items
Range of Exact Percent Agreement Average of Exact
Percent Agreement Across Items
Range of Exact Percent Agreement
Min Max Min Max
UNITED STATES 99 95 100 96 85 99
MISSOURI 99 96 100 97 84 100
OREGON 99 93 100 97 89 100
Australia 98 90 100 90 61 98
Belgium (Fl) 100 98 100 99 92 100
Bulgaria 98 93 100 94 59 100
Canada 98 85 100 92 70 99
Colombia 99 97 100 96 91 100
Czech Republic 98 77 100 95 68 100
England 100 96 100 97 89 100
France 100 96 100 98 93 100
Germany 98 89 100 94 75 100
Hong Kong 99 94 100 96 84 100
Iceland 98 84 100 91 73 100
Iran, Islamic Rep. 98 94 100 93 70 100
Ireland 99 95 100 97 83 100
Japan 100 96 100 99 90 100
Netherlands 98 87 100 91 68 100
New Zealand 99 95 100 95 81 100
Norway 99 90 100 95 79 100
Portugal 98 88 100 93 82 99
Russian Federation 99 94 100 96 84 100
Scotland 97 81 100 89 63 99
Singapore 99 95 100 98 87 100
Slovak Republic 97 84 100 91 70 98
Spain 98 88 100 94 75 100
Sweden 99 90 100 94 75 100
Switzerland 100 95 100 98 83 100
AVERAGE 99 91 100 95 78 100
*Eighth grade in most countries; see Table 2 for more information about the grades tested in each country.†Based on 26 mathematics items, including 6 multiple-part items.Note: Percent agreement was computed separately for each part, and each part was treated as a separate item in computing averages and ranges.
SO
UR
CE
: IE
A T
hird
Inte
rnat
iona
l Mat
hem
atic
s an
d S
cien
ce S
tudy
(T
IMS
S),
199
4-95
. Mis
sour
i and
Ore
gon
data
col
lect
ed in
199
7.
A P P E N D I X A
A-19
Test ReliabilityTable A.7 displays the mathematics test reliability coefficient for each country. This coefficient is the median KR-20 reliability across the eight test booklets. In the TIMSS countries, median reliabilities ranged from 0.91 in Australia, and Bulgaria to 0.73 in Kuwait. The international median, shown in the last row of the table, is the median of the reliability coefficients for all countries. The international median was 0.89. The median reliabilities for the United States, Missouri and Oregon were 0.89, 0.90, and 0.90, respectively.
Data ProcessingTo ensure the availability of comparable, high quality data for analysis, TIMSS engaged in a rigorous set of quality control steps to create the international database.13 TIMSS prepared manuals and software for countries to use in entering their data so the information would be in a standardized international format before being for-warded to the IEA Data Processing Center in Hamburg for creation of the interna-tional database. Upon arrival at the IEA Data Processing Center, the data from each country underwent an exhaustive cleaning process. The data cleaning process involved several iterative steps and procedures designed to identify, document, and correct deviations from the international instruments, file structures, and coding schemes. This process also emphasized consistency of information within national data sets and appropriate linking among the many student, teacher, and school data files.
Throughout the process, the data were checked and double-checked by the IEA Data Processing Center, the International Study Center, and the national centers. The national centers were contacted regularly and given multiple opportunities to review the data for their countries. In conjunction with the Australian Council for Educational Research (ACER), the International Study Center conducted a review of item statistics for each of the cognitive items in each of the countries to identify poorly performing items. Twenty-one countries had one or more items deleted (in most cases, one). Usually the poor statistics (negative point-biserials for the key, large item-by-country interactions, and statistics indicating lack of fit with the model) were a result of trans-lation, adaptation, or printing deviations.
For the State TIMSS Benchmarking Study, Westat, Inc., was responsible for having the data entered and preparing the data files, and for submitting the files to the IEA Data Processing Center. As with the 1995 assessment, the data underwent a compre-hensive cleaning process during which the data was checked and double-checked for any inconsistencies and were put into the international format. In accordance with the procedures developed in the TIMSS assessment, both the International Study Center and ACER conducted a review of the item statistics.14
13 These steps are detailed in Jungclaus, H. and Bruneforth, M. (1996). “Data Consistency Checking Across Countries” in M.O. Martin and D.L. Kelly (eds.), Third International Mathematics and Science Study Technical Report, Volume I. Chestnut Hill, MA: Boston College.
14 See Mullis, I.V.S. and Martin, M.O. (1997). “Item Analysis and Review” in M.O. Martin and D.L. Kelly (eds.), Third International Mathematics and Science Study Technical Report, Volume II: Implementation and Analysis - Primary and Middle School Years. Chestnut Hill, MA: Boston College.
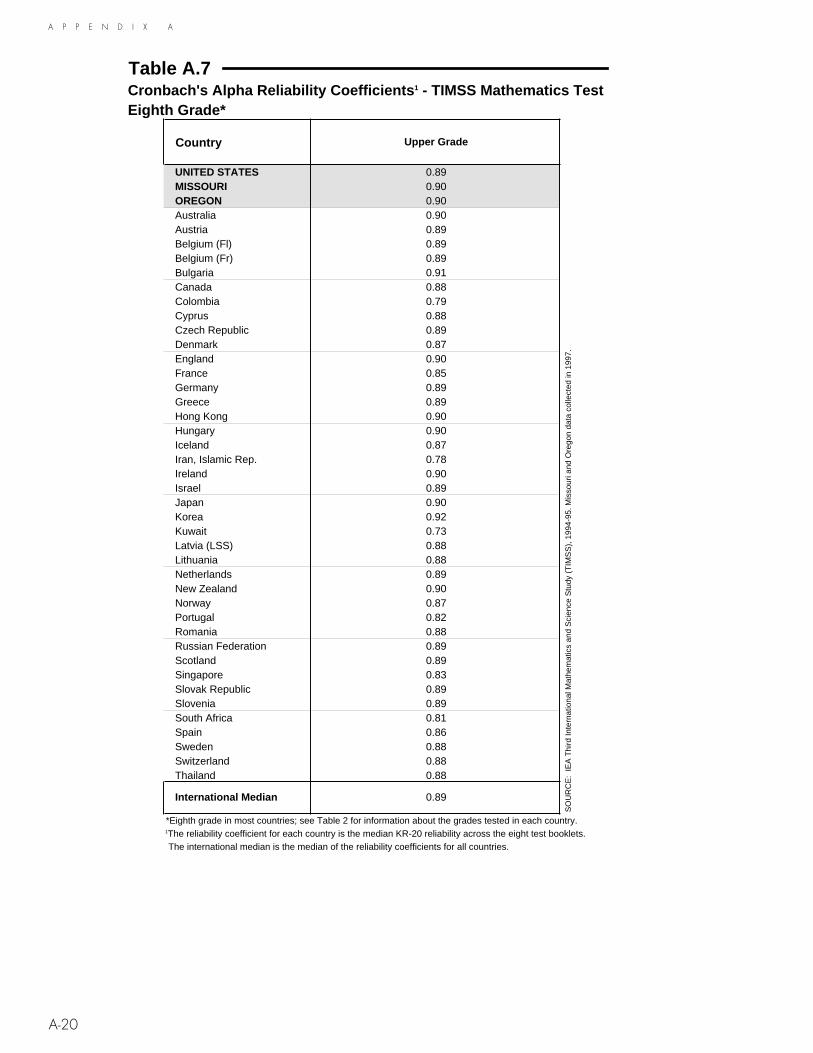
A-20
A P P E N D I X A
Table A.7Cronbach's Alpha Reliability Coefficients 1 - TIMSS Mathematics Test Eighth Grade*
Country Upper Grade
UNITED STATES 0.89 MISSOURI 0.90 OREGON 0.90 Australia 0.90 Austria 0.89 Belgium (Fl) 0.89 Belgium (Fr) 0.89 Bulgaria 0.91 Canada 0.88 Colombia 0.79 Cyprus 0.88 Czech Republic 0.89 Denmark 0.87 England 0.90 France 0.85 Germany 0.89 Greece 0.89 Hong Kong 0.90 Hungary 0.90 Iceland 0.87 Iran, Islamic Rep. 0.78 Ireland 0.90 Israel 0.89 Japan 0.90 Korea 0.92 Kuwait 0.73 Latvia (LSS) 0.88 Lithuania 0.88 Netherlands 0.89 New Zealand 0.90 Norway 0.87 Portugal 0.82 Romania 0.88 Russian Federation 0.89 Scotland 0.89 Singapore 0.83 Slovak Republic 0.89 Slovenia 0.89 South Africa 0.81 Spain 0.86 Sweden 0.88 Switzerland 0.88 Thailand 0.88
International Median 0.89
*Eighth grade in most countries; see Table 2 for information about the grades tested in each country.1The reliability coefficient for each country is the median KR-20 reliability across the eight test booklets. The international median is the median of the reliability coefficients for all countries.
SO
UR
CE
: IE
A T
hird
Inte
rnat
iona
l Mat
hem
atic
s an
d S
cien
ce S
tudy
(T
IMS
S),
199
4-95
. Mis
sour
i and
Ore
gon
data
col
lect
ed in
199
7.

A P P E N D I X A
A-21
IRT Scaling and Data AnalysisTwo general analysis approaches were used for this report – item response theory scaling methods and average percent correct technology. The overall mathematics results were summarized using an item response theory (IRT) scaling method (Rasch model).15 This scaling method produces a mathematics score by averaging the responses of each student to the items which they took in a way that takes into account the diffi-culty of each item. The methodology used in TIMSS includes refinements that enable reliable scores to be produced even though individual students responded to relatively small subsets of the total mathematics item pool. Analyses of the response patterns of students from participating countries indicated that, although the items in the test address a wide range of mathematics content, the performance of the students across the items was sufficiently consistent that it could be usefully summarized in a single mathematics score.
The IRT methodology was preferred for developing comparable estimates of perfor-mance for all students, since students answered different test items depending upon which of the eight test booklets they received. The IRT analysis provides a common scale on which performance can be compared across countries. In addition to pro-viding a basis for estimating mean achievement, scale scores permit estimates of how students within countries vary and provide information on percentiles of performance. The scale was standardized using students from both the grades tested in 1995. The metric of the scale was set so that the overall mean of the student scores corresponded
to a score of 500, and a standard deviation corresponded to 100 scale score points.16 The average and standard deviation of the scale scores are arbitrary and do not affect scale interpretations.
The analytic approach underlying the results in Chapters 2 and 3 of this report involved calculating the percentage of correct answers for each item for each participating country (as well as the percentages of different types of incorrect responses). The per-cents correct were averaged to summarize mathematics performance overall and in each of the content areas for each country as a whole and by gender. For items with more than one part, each part was analyzed separately in calculating the average per-cents correct. Also, for items with more than one point awarded for full credit, the average percents correct reflect an average of the points received by students in each country. This was achieved by including the percent of students receiving one score point as well as the percentage receiving two score points and three score points in the calculations. Thus, the average percents correct are based on the number of score points rather than the number of items, per se.
15 Adams, R., Wu, M., and Macaskill, G. (1997). “Scaling Methodology and Procedures for the Mathematics and Science Scales” in M.O. Martin and D.L. Kelly (eds.), Third International Mathematics and Science Study Technical Report, Volume II: Implementation and Analysis - Primary and Middle School Years. Chestnut Hill, MA: Boston College.
16 Gonzalez, E. (1997). “Reporting Student Achievement in Mathematics and Science” in M.O. Martin and D.L. Kelly (eds.), Third International Mathematics and Science Study Technical Report, Volume II: Implementation and Analysis - Primary and Middle School Years. Chestnut Hill, MA: Boston College.
A-22
A P P E N D I X A
Estimating Sampling ErrorBecause the statistics presented in this report are estimates of national performance based on samples of students, rather than the values that could be calculated if every student in every country would have answered every question, it is important to have measures of the degree of uncertainty of the estimates. The jackknife procedure was used to estimate the standard error associated with each statistic presented in this report.17 The use of confidence intervals, based on the standard errors, provides a way to make inferences about the population means and proportions in a manner that reflects the uncertainty associated with the sample estimates. An estimated sample sta-tistic plus or minus two standard errors represents a 95% confidence interval for the corresponding population result.
17 Gonzalez, E. and Foy, P. (1997). “Estimation of Sampling Variability, Design Effects, and Effective Sample Sizes” in M.O. Martin and D.L. Kelly (eds.), Third International Mathematics and Science Study Technical Report, Volume II: Implementation and Analysis - Primary and Middle School Years. Chestnut Hill, MA: Boston College.

A P P E N D I X B
B-1
Appendix BPERCENTILES AND STANDARD DEVIATIONS OF ACHIEVEMENT

B-2
A P P E N D I X B
Table B.1Percentiles of Achievement in MathematicsEighth Grade*
Country 5th Percentile 25th Percentile 50th Percentile 75th Percentile 95th Percentile
UNITED STATES 356 (3.3) 435 (3.4) 494 (6.4) 563 (8.2) 653 (3.7)MISSOURI 359 (3.5) 434 (3.6) 497 (6.9) 572 (6.5) 670 (6.2)OREGON 369 (6.3) 454 (3.4) 522 (7.5) 593 (4.8) 690 (5.7)Australia 372 (4.1) 460 (1.5) 529 (7.0) 600 (7.2) 690 (5.4)Austria 393 (5.1) 474 (4.1) 537 (5.8) 608 (2.6) 693 (6.4)Belgium (Fl) 416 (7.7) 502 (8.7) 566 (8.7) 631 (5.7) 710 (3.5)Belgium (Fr) 385 (13.8) 467 (1.1) 532 (5.5) 587 (3.7) 658 (6.2)Bulgaria 378 (11.4) 460 (4.2) 530 (10.6) 621 (13.8) 728 (0.4)Canada 389 (3.3) 468 (2.0) 527 (2.7) 587 (2.4) 670 (3.7)Colombia 292 (5.8) 343 (4.4) 379 (3.6) 421 (6.1) 496 (7.5)Cyprus 333 (3.3) 412 (1.2) 469 (1.6) 535 (3.2) 621 (7.3)Czech Republic 423 (3.5) 496 (2.6) 558 (7.5) 633 (8.5) 725 (12.6)Denmark 369 (9.8) 443 (2.9) 500 (4.9) 561 (2.2) 641 (5.9)England 361 (8.8) 443 (4.8) 501 (3.5) 570 (2.7) 665 (4.1)France 415 (5.2) 484 (1.4) 534 (3.0) 591 (2.5) 666 (3.4)Germany 368 (8.2) 448 (9.4) 506 (6.3) 572 (7.5) 661 (10.9)Greece 347 (2.8) 422 (1.9) 478 (3.8) 546 (3.6) 633 (6.6)Hong Kong 415 (14.2) 526 (6.8) 595 (5.9) 659 (4.9) 742 (5.4)Hungary 391 (2.3) 471 (2.1) 534 (2.6) 602 (2.7) 693 (9.2)Iceland 365 (4.3) 435 (3.3) 481 (6.2) 540 (4.8) 615 (21.0)Iran, Islamic Rep. 336 (4.4) 388 (2.2) 424 (2.9) 466 (5.8) 535 (9.8)Ireland 381 (6.5) 462 (4.9) 526 (8.2) 594 (9.6) 681 (3.3)Israel 371 (6.3) 459 (7.5) 523 (9.3) 586 (4.9) 672 (7.2)Japan 435 (2.1) 536 (6.8) 608 (2.5) 676 (1.4) 771 (4.8)Korea 418 (4.0) 540 (5.0) 609 (3.9) 682 (2.7) 786 (7.1)Kuwait 302 (5.6) 355 (3.6) 389 (6.3) 427 (3.5) 493 (6.9)Latvia (LSS) 375 (5.2) 435 (2.6) 487 (3.3) 550 (4.3) 638 (8.1)Lithuania 348 (5.0) 422 (3.1) 473 (5.3) 533 (4.3) 616 (8.5)Netherlands 397 (10.6) 477 (9.1) 543 (9.2) 604 (7.4) 688 (6.9)New Zealand 366 (3.1) 443 (4.0) 503 (5.0) 570 (5.5) 663 (9.1)Norway 372 (5.5) 445 (2.0) 499 (2.8) 560 (3.1) 649 (5.9)Portugal 357 (3.0) 411 (1.0) 449 (2.2) 495 (6.7) 569 (7.1)Romania 343 (3.1) 418 (3.0) 476 (5.5) 544 (5.2) 635 (9.7)Russian Federation 388 (4.5) 471 (5.6) 536 (11.3) 600 (8.2) 687 (2.9)Scotland 364 (3.6) 436 (3.2) 493 (7.5) 559 (8.1) 649 (15.3)Singapore 499 (5.8) 584 (8.9) 642 (7.2) 704 (4.5) 792 (7.5)Slovak Republic 401 (1.6) 483 (0.6) 543 (4.4) 612 (3.9) 700 (2.7)Slovenia 404 (2.5) 477 (3.6) 535 (6.7) 604 (4.0) 690 (4.3)South Africa 259 (3.7) 313 (2.2) 347 (2.0) 386 (4.9) 484 (10.4)Spain 376 (2.0) 436 (2.5) 481 (1.8) 536 (3.5) 616 (3.9)Sweden 384 (2.9) 460 (6.0) 515 (3.7) 579 (3.4) 661 (4.7)Switzerland 401 (6.3) 485 (2.1) 549 (6.1) 607 (2.9) 685 (2.8)Thailand 388 (3.3) 462 (4.4) 518 (5.9) 580 (6.9) 669 (10.7)
*Eighth grade in most countries; see Table 2 for more information about the grades tested in each country.( ) Standard errors appear in parentheses.
SO
UR
CE
: IE
A T
hird
Inte
rnat
iona
l Mat
hem
atic
s an
d S
cien
ce S
tudy
(T
IMS
S),
199
4-95
. Mis
sour
i and
Ore
gon
data
col
lect
ed in
199
7.

B-3
A P P E N D I X B
Table B.2Standard Deviations of Achievement in MathematicsEighth Grade*
Overall Boys Girls
Country Mean Standard Deviation Mean Standard
Deviation Mean Standard Deviation
UNITED STATES 500 (4.6) 91 (1.4) 502 (5.2) 93 (1.5) 497 (4.5) 89 (1.8)
MISSOURI 505 (4.8) 96 (1.7) 504 (5.5) 102 (2.0) 505 (4.3) 90 (2.0)
OREGON 525 (4.8) 98 (1.9) 527 (5.1) 99 (2.3) 523 (5.0) 96 (2.3)
Australia 530 (4.0) 98 (1.5) 527 (5.1) 100 (1.9) 532 (4.6) 96 (1.7)
Austria 539 (3.0) 92 (1.9) 544 (3.2) 94 (2.3) 536 (4.5) 90 (2.0)
Belgium (Fl) 565 (5.7) 92 (2.7) 563 (8.8) 96 (4.4) 567 (7.4) 88 (3.0)
Belgium (Fr) 526 (3.4) 86 (2.4) 530 (4.7) 88 (2.7) 524 (3.7) 83 (3.0)
Bulgaria 540 (6.3) 110 (2.5) – – – – – – – –
Canada 527 (2.4) 86 (1.4) 526 (3.2) 88 (1.7) 530 (2.7) 84 (1.9)
Colombia 385 (3.4) 64 (1.7) 386 (6.9) 66 (3.8) 384 (3.6) 63 (2.8)
Cyprus 474 (1.9) 88 (1.2) 472 (2.8) 89 (1.7) 475 (2.5) 86 (1.8)
Czech Republic 564 (4.9) 94 (2.3) 569 (4.5) 94 (2.6) 558 (6.3) 93 (2.8)
Denmark 502 (2.8) 84 (1.4) 511 (3.2) 86 (1.7) 494 (3.4) 80 (1.9)
England 506 (2.6) 93 (1.5) 508 (5.1) 95 (2.3) 504 (3.5) 91 (2.0)
France 538 (2.9) 76 (1.6) 542 (3.1) 74 (2.0) 536 (3.8) 78 (2.0)
Germany 509 (4.5) 90 (1.8) 512 (5.1) 89 (2.0) 509 (5.0) 88 (2.3)
Greece 484 (3.1) 88 (1.0) 490 (3.7) 91 (1.4) 478 (3.1) 85 (1.6)
Hong Kong 588 (6.5) 101 (3.3) 597 (7.7) 103 (4.3) 577 (7.7) 97 (3.6)
Hungary 537 (3.2) 93 (1.6) 537 (3.6) 92 (1.9) 537 (3.6) 94 (2.2)
Iceland 487 (4.5) 76 (1.5) 488 (5.5) 80 (2.0) 486 (5.6) 72 (2.3)
Iran, Islamic Rep. 428 (2.2) 59 (1.0) 434 (2.9) 59 (1.4) 421 (3.3) 59 (1.3)
Ireland 527 (5.1) 93 (2.0) 535 (7.2) 96 (2.9) 520 (6.0) 89 (2.5)
Israel 522 (6.2) 92 (2.3) 539 (6.6) 89 (3.2) 509 (6.9) 90 (3.1)
Japan 605 (1.9) 102 (0.9) 609 (2.6) 106 (1.3) 600 (2.1) 97 (1.4)
Korea 607 (2.4) 109 (1.4) 615 (3.2) 109 (1.9) 598 (3.4) 108 (1.9)
Kuwait 392 (2.5) 58 (1.4) 389 (4.3) 60 (2.4) 395 (2.6) 55 (1.5)
Latvia (LSS) 493 (3.1) 82 (1.6) 496 (3.8) 82 (2.3) 491 (3.5) 82 (2.2)
Lithuania 477 (3.5) 80 (1.5) 477 (4.0) 79 (1.9) 478 (4.1) 81 (2.2)
Netherlands 541 (6.7) 89 (3.6) 545 (7.8) 90 (4.2) 536 (6.4) 88 (3.5)
New Zealand 508 (4.5) 90 (1.8) 512 (5.9) 92 (2.7) 503 (5.3) 88 (2.0)
Norway 503 (2.2) 84 (1.2) 505 (2.8) 87 (1.7) 501 (2.7) 80 (1.5)
Portugal 454 (2.5) 64 (1.1) 460 (2.8) 64 (1.4) 449 (2.7) 64 (1.4)
Romania 482 (4.0) 89 (1.6) 483 (4.8) 91 (1.9) 480 (4.0) 87 (1.9)
Russian Federation 535 (5.3) 92 (1.6) 535 (6.3) 97 (2.0) 536 (5.0) 87 (2.0)
Scotland 499 (5.5) 87 (2.4) 506 (6.6) 89 (3.1) 490 (5.3) 85 (2.3)
Singapore 643 (4.9) 88 (1.7) 642 (6.3) 88 (2.2) 645 (5.4) 88 (2.0)
Slovak Republic 547 (3.3) 92 (1.2) 549 (3.7) 94 (1.5) 545 (3.6) 90 (1.9)
Slovenia 541 (3.1) 88 (1.1) 545 (3.8) 88 (1.5) 537 (3.3) 87 (1.5)
South Africa 354 (4.4) 65 (4.0) 360 (6.3) 68 (5.0) 349 (4.1) 62 (4.4)
Spain 487 (2.0) 73 (1.1) 492 (2.5) 75 (1.4) 483 (2.6) 72 (1.5)
Sweden 519 (3.0) 85 (1.2) 520 (3.6) 85 (1.6) 518 (3.1) 86 (1.5)
Switzerland 545 (2.8) 88 (1.5) 548 (3.5) 90 (2.2) 543 (3.1) 85 (1.6)
Thailand 522 (5.7) 86 (2.4) 517 (5.6) 83 (2.2) 526 (7.0) 87 (3.0)*Eighth grade in most countries; see Table 2 for information about the grades tested in each country.A dash (–) indicates data are not available.( ) Standard errors appear in parentheses.
SO
UR
CE
: IE
A T
hird
Inte
rnat
iona
l Mat
hem
atic
s an
d S
cien
ce S
tudy
(T
IMS
S),
199
4-95
. Mis
sour
i and
Ore
gon
data
col
lect
ed in
199
7.

Acknowledgments
This report represents a collaborative effort on the part of many individuals who contributed their knowledge, expertise, and creativity to TIMSS and the TIMSS Benchmarking Study. The study was funded by the National Center for Education Statistics of the United States Department of Education.
The TIMSS Benchmarking Study was conducted centrally by the TIMSS International Study Center housed at Boston College with many of the important activities being conducted in centers around the world. Westat, Inc., in Rockville, Maryland oversaw the sampling, test and questionnaire administration, and preparation of the data files. The data were processed at the IEA Data Processing Center in Hamburg, Germany, and the Australian Council for Educa-tional Research in Melbourne conducted the scaling of the achievement data. TIMSS also is extremely grateful to the students, teachers and school principals who contributed their time and effort to the study. This report would not be possible without them.
Production Editor: Cheryl FlahertyArt Director and Cover Design: Thomas HoffmannTable Production: José R. Nieto