Embed Size (px)
Citation preview

Mathematical Models in CancerSystems Biology
Giuseppe Jordão
Department of MathematicsUniversity of Porto
Portugal, 2017

Mathematical Models in CancerSystems Biology
Giuseppe Jordão
Thesis presented for the degree of Master inMathematical Engineering
Supervisor: Prof. Doutor João Nuno Tavares
Department of MathematicsUniversity of Porto
Portugal, 2017


To my mother and sister


Abstract
Nesta tese, são obtidos modelos matemáticos determinísticos a partir de modelos bioquímicosda célula eucariótica, em dois casos distintos, para efeitos de comparação: célula saudável ecélula cancerígena. O primeiro modelo é baseado nos modelos de [3] e [8] e faz uso da cascatade sinalização MAPK, proposta em [7], e da via de transdução de PI3K/AKT descrita em [37], demodo a criar um modelo actualizado mais abrangente da regulação da célula saudável. O segundomodelo, da célula cancerígena, é construído a partir do primeiro modelo da célula saudável poralteração de vias específicas de transdução, e interpretando o resultado à luz da literatura emoncologia molecular. Esta interpretação é feita em duas abordagens: simulação de desregulaçõescomuns e simulação de dois cancros específicos, o cancro do cólon e o cancro da mama.O modelo actualizado proposto é analisado de acordo com a sua adequação aos modelos bio-químicos do ciclo celular, e ainda da sua robustez quando é usado para simular desregulações emcancro. São propostas terapias-alvo, de acordo com os resultados.São, portanto, exploradas a eficácia e a utilidade da modelação matemática em fornecer resultadosin silico, dos quais se possam retirar sugestões úteis para possíveis terapias. O objectivo é validara matemática, novamente, como uma ferramenta poderosa com a qual se pode modelar a naturezados sistemas biológicos e extrair conclusões para problemas da vida real.

Mathematical models in cancer• 2017

Abstract
In this thesis, deterministic mathematical models are derived from biochemical models, withina human cell, in two distinct cases, for comparison: healthy cell and cancerous cell. The formermodel is based in [3] and [8] and makes use of the MAPK cascade pathway [7] and the PI3K/AKTpathway for signalling transduction [37], to create a wider updated model for the regulation ofa healthy cell. The latter model, for the cancer cell, is derived from the healthy cell model, byaltering specific pathways, and interpreting the outcome in the light of literature in cancer. Thislast study is done in two approaches: simulation of common deregulations and specific cancersimulation, colon and breast cancer. After studying both models, we propose targeting therapiesand simulate their consequences. We thus explore mathematical modeling efficacy and usefulnessin providing enough information from which to derive ideas for therapies. The purpose is to validatemathematics, once again, as a powerful tool with which one can model the underlying nature ofbiological systems and extract useful conclusions to real-life problems.


Contents
Introduction 3
1 Preliminaries: Systems Biology 5I Introduction and overview . . . . . . . . . . . . . . . . . . . . . . . . . . . . 5II The cell as a system . . . . . . . . . . . . . . . . . . . . . . . . . . . . . . . 7III Chemical kinetics . . . . . . . . . . . . . . . . . . . . . . . . . . . . . . . . . 7IV Enzymatic Michaelis-Menten kinetics . . . . . . . . . . . . . . . . . . . . . . 10V Cooperation. Hill equation . . . . . . . . . . . . . . . . . . . . . . . . . . . . 11
2 The Cell Cycle: An overview 13I Different phases . . . . . . . . . . . . . . . . . . . . . . . . . . . . . . . . . 13II Cell cycle arrest and Apoptosis . . . . . . . . . . . . . . . . . . . . . . . . . 15III The Restriction Point Regulation . . . . . . . . . . . . . . . . . . . . . . . . 16
3 P53: The Guardian of the Genome 17I P53 pathway . . . . . . . . . . . . . . . . . . . . . . . . . . . . . . . . . . . 17
4 Signalling Transduction Pathways 19I The MAPK cascade signalling pathway . . . . . . . . . . . . . . . . . . . . 19II PI3K-AKT-mTOR pathway . . . . . . . . . . . . . . . . . . . . . . . . . . . . 20
5 Cancer: An overview 23I Introduction . . . . . . . . . . . . . . . . . . . . . . . . . . . . . . . . . . . . 23II The hallmarks of cancer . . . . . . . . . . . . . . . . . . . . . . . . . . . . . 24III Relevant Pathways in Cancer and their deregulations . . . . . . . . . . . . . 26IV Molecular targets in cancer therapies . . . . . . . . . . . . . . . . . . . . . . 26
6 State-of-the-art Models and Simulations 29I Model and Simulation of Restriction Point regulation . . . . . . . . . . . . . 29II Conradie Model and Simulation of Cell Cycle regulation . . . . . . . . . . . 30III Kholodenko Model for the MAPK cascade pathway . . . . . . . . . . . . . . 30
7 Updated Mathematical Model of the Cell Cycle 31I Units of concentrations . . . . . . . . . . . . . . . . . . . . . . . . . . . . . . 32II Simulation of Healthy Cell . . . . . . . . . . . . . . . . . . . . . . . . . . . . 32
i

Mathematical models in cancer• 2017
8 Simulation of Common Deregulations 37I MAPK cascade signalling pathway in cancer . . . . . . . . . . . . . . . . . 37II PI3K/AKT pathway deregulations . . . . . . . . . . . . . . . . . . . . . . . . 40III CDH1 deregulation . . . . . . . . . . . . . . . . . . . . . . . . . . . . . . . . 41IV Retinoblastoma mutation . . . . . . . . . . . . . . . . . . . . . . . . . . . . 41V P53 deregulated pathway . . . . . . . . . . . . . . . . . . . . . . . . . . . . 43
9 Colon Cancer Simulation 45I Simulation of colon cancer . . . . . . . . . . . . . . . . . . . . . . . . . . . . 45
10 Breast Cancer Simulation 47I Simulation of breast cancer . . . . . . . . . . . . . . . . . . . . . . . . . . . 47
11 Therapies 51
Conclusion 55
Further work and investigation 57
System of differential equations for healthy cell model 59
Glossary 67
Bibliography 73
ii

List of Figures
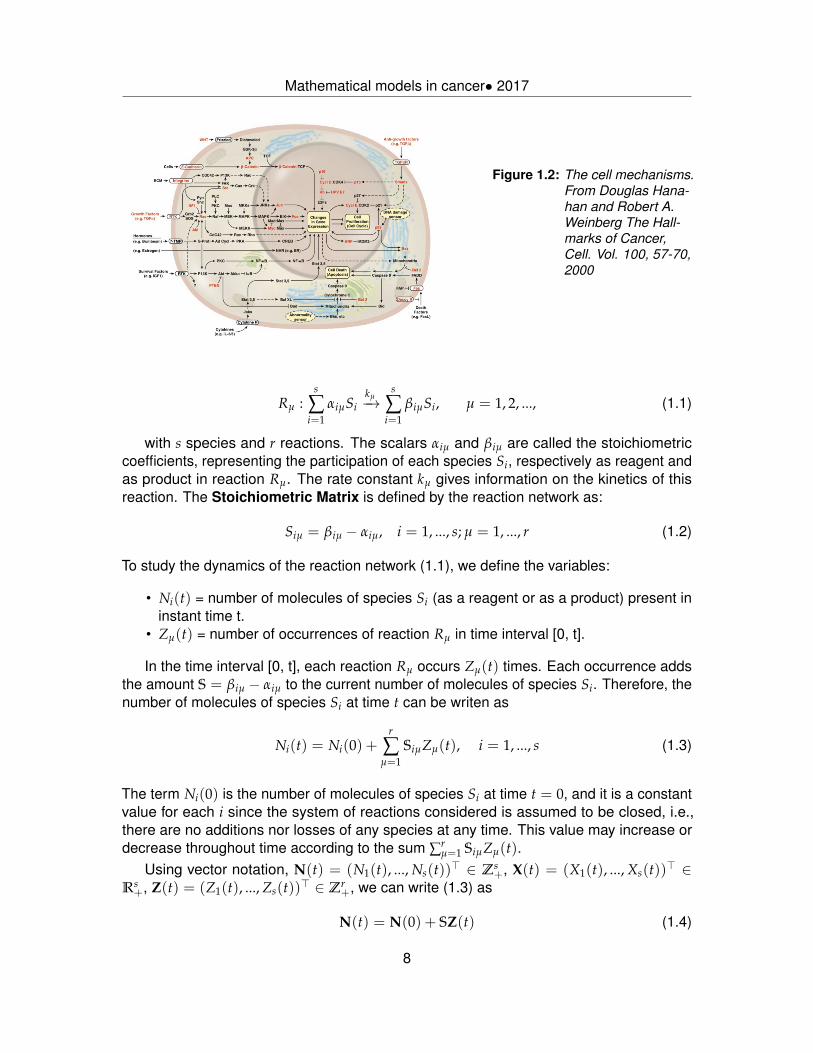
1.1 Reaction network. SBML representation in Cell Designer. . . . . . . . . . . 61.2 The cell mechanisms. From Douglas Hanahan and Robert A. Weinberg
The Hallmarks of Cancer, Cell. Vol. 100, 57-70, 2000 . . . . . . . . . . . . 81.3 Michaelis-Menten model . . . . . . . . . . . . . . . . . . . . . . . . . . . . . 10
2.1 The cell cycle (Weinberg) . . . . . . . . . . . . . . . . . . . . . . . . . . . . 14
4.1 The MAPK cascade signalling pathway . . . . . . . . . . . . . . . . . . . . 204.2 The PI3K/AKT signalling pathway . . . . . . . . . . . . . . . . . . . . . . . . 21
5.1 The hallmarks of cancer . . . . . . . . . . . . . . . . . . . . . . . . . . . . . 25
7.1 Diagram of cell cycle updated model . . . . . . . . . . . . . . . . . . . . . . 337.2 Healthy cell simulations . . . . . . . . . . . . . . . . . . . . . . . . . . . . . 35
8.1 ERG,DRG and ERK-PP with inefficient Ras-GTP hydrolysis, Raf or ERK-Pdephosphorylation . . . . . . . . . . . . . . . . . . . . . . . . . . . . . . . . 39
8.2 Cyclin D with inefficient Ras-GTP hydrolysis . . . . . . . . . . . . . . . . . . 398.3 ERG, DRG and ERK-PP with inefficient dephosphorylation of MEK-P . . . 398.4 MAPK cascade with fast production of GAP . . . . . . . . . . . . . . . . . . 398.5 Cyclins, CDH1 and CDC20 with fast production of GAP . . . . . . . . . . . 398.6 p27 and p27-CycA/D/E complexes with fast production of GAP . . . . . . . 398.7 PI3K overactivated . . . . . . . . . . . . . . . . . . . . . . . . . . . . . . . . 408.8 Rheb and mTORC1 with overactivated PI3K . . . . . . . . . . . . . . . . . . 408.9 TSC1, TSC2 and TSC1:TSC2 with overactivated PI3K . . . . . . . . . . . . 408.10 CDH1 deficiency simulations . . . . . . . . . . . . . . . . . . . . . . . . . . 428.11 E2F with mutated Rb . . . . . . . . . . . . . . . . . . . . . . . . . . . . . . . 438.12 CDH1 and CDC20 with mutated Rb . . . . . . . . . . . . . . . . . . . . . . 438.13 Mass with mutated Rb . . . . . . . . . . . . . . . . . . . . . . . . . . . . . . 438.14 Hdm2, Caspase-9, p14ARF and p21 with specific type of mutation of p53 . . 448.15 Hdm2 and Caspase-9 with specific type of mutation of p53 . . . . . . . . . 448.16 Mass with mutated p53 . . . . . . . . . . . . . . . . . . . . . . . . . . . . . 44
9.1 ERG, DRG and ERK with hyperactive Ras . . . . . . . . . . . . . . . . . . . 469.2 CDH1 and CDC20 with hyperactive-Ras or hyperactive-AKT . . . . . . . . . 46
iii

Mathematical models in cancer• 2017
9.3 PIP3 and inactive PIP3:AKT with hyperactive-AKT . . . . . . . . . . . . . . 46
10.1 MAPK cascade with estrogen-dependency . . . . . . . . . . . . . . . . . . 4810.2 CDH1 and CDC20 with estrogen dependency . . . . . . . . . . . . . . . . . 4810.3 Mass with estrogen dependency . . . . . . . . . . . . . . . . . . . . . . . . 4910.4 CDH1 and CDC20 with overexpressed Cyclin D . . . . . . . . . . . . . . . . 4910.5 p27 forms in overexpressed Cylin D . . . . . . . . . . . . . . . . . . . . . . 4910.6 Cyclins with overexpressed Cyclin D . . . . . . . . . . . . . . . . . . . . . . 4910.7 Mass with overexpressed Cyclin D . . . . . . . . . . . . . . . . . . . . . . . 50
11.1 CDH1 and CDC20 with hyperactive-Ras treated with strong Raf inhibitionor MEK inhibition. . . . . . . . . . . . . . . . . . . . . . . . . . . . . . . . . . 52
11.2 Cyclins concentration with hyperactive-Ras treated with strong Raf inhibi-tion or MEK inhibition. . . . . . . . . . . . . . . . . . . . . . . . . . . . . . . 52
11.3 Cyclins with hyperactive-Ras treated with ERK inhibition. . . . . . . . . . . 5211.4 CDH1 and CDC20 in hyperactive-Ras cell treated with ERK inhibition. . . . 5211.5 ERG, DRG and ERK in hyperactive-Ras cell treated with ERK inhibition. . . 5311.6 Mass of the cell with hyperactive-Ras treated with ERK inhibition. . . . . . . 53
iv


Introduction
CAncer is one of the most deadly diseases among humanity, in great part due to thelarge amount of variables which have to be taken into account in its development anddynamics, making it particularly difficult to approach therapeutically. Each cancer
is unique in the sense that the particle’s path arrangements, in the circumstances thatoriginated it, can vary greatly according to the organism where it develops, the qualityand quantity of its nurturing habits which, in turn, also depend on the resources of theenvironment where that organism lives, among many other degrees of freedom.The understanding of how cancer mechanism works, starts with understanding how ahealthy cell behaves, since the differences between cancer dynamics and healthy tissuedynamics are a reasonable object of analysis in cancer theory.When a single mammalian cell fails to stop cell cycle, when it needs to, proceeding toreplicate and originate offspring with anomalies, it can quickly develop a tumor whosepriority is to grow and divide uncontrollably, selfishly, wearing all resources in its environ-ment, destabilizing its neighbouring healthy cells in the tissue and, consequently, the wholeorganism. The study of individual healthy and cancerous cells dynamics is therefore anunderstandable approach for cancer therapy development and is the one we discuss in thisthesis.The advance in the technology relevant to this field, is itself divided in two main branches:improvement in computing power and in measurement accuracy. As the computing powerincreases, according to Moore’s law, the ability to store huge amounts of data is enhancedand this is a feature of vital importance when it comes to simulate in a computer complexsystems such as the ones embedded in cell metabolism or cancer morphogenesis. Ofcourse all the storage capacity wouldn’t mean much if there weren’t breakthroughs inmeasurement tools. To accurately arm the simulations with reasonable predictions, theinput information should be as close to reality as it can get. This is why the link betweenin vitro/in vivo research is of such importance for in silico approaches. In this way cancer,among other diseases, is being fought in many inter-connected battle fronts. The interactionbetween in silico and in vitro or in vivo technique, permits the upgrade of each one of theseapproaches without unnecessary waste of the resources. For instance, if the simulation ofa specific cancer pathway exhibits a given feature for which it is known a treatment, in vitroor in vivo researchers can then focus on that specific feature, thus narrowing down the setof possible experiments, saving time and money in this process.With this in mind, we will explore in this thesis an updated model for the healthy cell,
3

Mathematical models in cancer• 2017
in order to simulate the cell cycle, and afterwords use it to study important pathways incancer dynamics, whether they are commonly deregulated, relevant for cancer treatment,or because of the existence of cross-talks between them and cancer-related pathways. Toaccomplish these simulations, we will base our ground-knowledge on the general acceptedchemical interactions within the cell, among biologists and biochemists, although thisdoesn’t necessarily mean we completely exclude hypothesis which we find useful for theconstruction of the models.The mathematics behind the creation of the models is reviewed in the first chapter, thus overviewing the contents of biomathematics and systems biology. The following chapters focuson the eukaryote cell cycle and the restriction point, p53 protein and signalling transductionpathways, i.e., in the biological and biochemical background needed to justify the reactionnetwork chosen for modelling. We reserve chapter 5 to explore cancer’s dynamics andmain features and chapter 6 to summarize the state-of-the-art of mathematical models.Chapter 7 is dedicated to the explanation of our model of the cell cycle, which we then useto simulate the healthy cell in chapter 8 and common deregulations in chapter 9. In the lastthree chapters, two specific cancers are studied, colon cancer and breast cancer, as wellas possible target therapies we could derive from the results of the simulations restricted totoday’s advances in personalized medicine.
4

Chapter 1
Preliminaries: Systems Biology
I Introduction and overview
In the 21st century, biology is being transformed from a purely lab-based science to acollaboration between in vivo or in vitro experiments and information science. As such,biologists have had to draw assistance from mathematicians, computer scientists andengineers. The result has been the development of the fields of Bioinformatics andComputational Biology (terms often used interchangeably).The major goal of these fields is to extract new biological insight from the large noisy setof data being generated by high-throughput technologies. Initially, the main problems inbioinformatics were how to create and maintain databases for massive amounts of DNAsequence data. Addressing these challenges also involved the development of efficientinterfaces for researches to access, submit and revise data. Bioinformatics has expandedinto the development of software that also analyzes and interprets these data.Systems Biology involves the collection of the large experimental data sets with whichthe development of mathematical models that predict important elements in this data isdone. The quality assessment of these models by comparing numerical simulations withexperimental data allows the update of these models to better fit observation. The ultimategoal of systems biology is therefore to develop models and analytic methods that providereasonable predictions of experimental results. While it will never replace experimentalmethods, the application of computational approaches to gain understanding of variousbiological processes held the promise of helping experimentalists work more efficiently.These methods also may help gain insight into biological mechanisms when informationcould not be obtained from any known experimental methods. Eventually, it may be possiblethat such models and analytical techniques could have substantial impact on our societysuch as aiding in drug discovery.System biologists analyze several types of molecular systems, including genetic regu-latory networks, metabolic networks and protein networks. During the genomic age,standards for representing sequence data were (and still are) essential. Data collected froma variety of sources could not be easily used by multiple researchers without a standard
5

Mathematical models in cancer• 2017
data format. For systems biology, standard data formats are also being developed. Oneformat that seems to be getting some attraction is the Systems Biology Markup Language(SBML) - a XML based language for representing chemical reaction networks. This kind ofmodelling is implemented in software like COPASI.The basic structure of a SBML model is a network consisting of a list of chemical speciescoupled with a list of chemical reactions. Each chemical reaction includes a list of reac-tants, products and modifiers, and also a mathematical description of the kinetic rate lawgoverning the dynamics of this reaction.For the purposes of this thesis, the reaction network consists of the three key elements:system components or pools of components, arrows that indicate flow of material andarrows that indicate flow of information or signals. By connecting pools with heavy arrows,we indicate which system components can be transformed into others, and following thesearrows within the network, we obtain an impression of the different routes through whichmaterial can be processed by the system. In contrast to heavy arrows, we use dashedarrows to indicate that a system’s component can affect or modulate a process in thesystem. An arrow of this type may represent, for instance, a feedback inhibition or theactivation of a reaction.
Figure 1.1: Reaction network. SBML repre-sentation in Cell Designer.
The overall strategy of analyzing a biochemical system consists of a sequence of six steps:
• List all components or pools of components that affect the system.• List all interactions between these components and all modulations by which compo-
nents affect the system.• Arrange components, pools, interactions and modulations in the form of a network.• Transcribe the network in terms of mathematical symbols and equations.• Analyze these equations.• Interpret the results.
The list of steps signals the fundamental importance of setting up the network in a properform. The network connects reality and mathematical analysis, and if this connection isfaulty, the results are unreliable or even wrong. When all components and interactions of abiochemical system are known, and when we strictly adhere to a few rules, it is usually nottoo difficult to construct a proper network.
6

Mathematical models in cancer• 2017
On the other hand, ill-defined components, using the wrong types of arrows or confusing theflow material with a regulatory influence often leads to incorrect conclusions. In some cases,one may detect those problems early on, however, once the equations are formulated -correctly of incorrectly - it is often very difficult to detect inconsistencies in the map or theequations until it is time to interpret the results.
II The cell as a system
The functioning of a cell requires multiple processes to work in an orchestrated manner.Basic properties of cellular life, such as proliferation, macromolecule synthesis and degra-dation, and cellular metabolism, have to be tightly controlled. Failure in the regulation ofthese cellular functions, for example through mutations of specific genes, can result in an-other cellular phenotype and, eventually at the organism level, in severe diseases such ascancer. Whatever the cell type - eukaryotic or prokaryotic - or its neighboring environment- other cells, for example, like in a multicellular organism, or other neighborhood, like inunicellular organisms - its ability to respond to external stimuli, derive energy and materialsneeded to continually fabricate itself and eventually reproduce, is always controlled by acomplex network of chemical reactions. Each reaction needs to be catalyzed by specificproteins, which are specialized molecules produced by the cell itself. Many proteins areenzymes, which are biological catalysts present in nearly every activity of the cell. Otherproteins are used as structural elements to build cellular parts, as activation or repressionagents to control reactions, as sensors to environmental condition, or take part in oneof the many other tasks necessary for cellular function. There are thousands of differentproteins in each cell. Producing these proteins not only requires the cell to obtain energyand materials, but also requires detailed communication between different parts of a cellor between cells. Much of the cellular machinery is devoted to ensuring the production ofproteins at the right moment, in the right quantity, in the right place.A cell’s most reliable way to pass on the recipe for making proteins is contained in itsgenetic material and is passed on to daughter cells at each division. The machinery forreading this information is one of the core components of all living things and is highlysimilar in all types of cells, being constituted by a complex of enzymes. The informationitself, called genetic material, is formed by molecules of DNA (deoxyrribonucleic acid),which have a sequential structure that enables them to act as information storage devices.
III Chemical kinetics
As mentioned in the last section, the metabolism of a single cell can be broken down toa network of chemical reactions. In this section we will show how to derive a system ofdifferential equations from a set of chemical reactions and then proceed to analyze theresulting model quantitatively following the steps listed in section I.A Reaction Network is a set of reactions Rmu, µ = 1, · · · , r, between reagents andproducts from the set of involved species,
Si
i=1,...,s.
7
Mathematical models in cancer• 2017
Figure 1.2: The cell mechanisms.From Douglas Hana-han and Robert A.Weinberg The Hall-marks of Cancer,Cell. Vol. 100, 57-70,2000
Rµ :s
∑i=1
αiµSikµ−→
s
∑i=1
βiµSi, µ = 1, 2, ..., (1.1)
with s species and r reactions. The scalars αiµ and βiµ are called the stoichiometriccoefficients, representing the participation of each species Si, respectively as reagent andas product in reaction Rµ. The rate constant kµ gives information on the kinetics of thisreaction. The Stoichiometric Matrix is defined by the reaction network as:
Siµ = βiµ − αiµ, i = 1, ..., s; µ = 1, ..., r (1.2)
To study the dynamics of the reaction network (1.1), we define the variables:
• Ni(t) = number of molecules of species Si (as a reagent or as a product) present ininstant time t.
• Zµ(t) = number of occurrences of reaction Rµ in time interval [0, t].
In the time interval [0, t], each reaction Rµ occurs Zµ(t) times. Each occurrence addsthe amount S = βiµ − αiµ to the current number of molecules of species Si. Therefore, thenumber of molecules of species Si at time t can be writen as
Ni(t) = Ni(0) +r
∑µ=1
SiµZµ(t), i = 1, ..., s (1.3)
The term Ni(0) is the number of molecules of species Si at time t = 0, and it is a constantvalue for each i since the system of reactions considered is assumed to be closed, i.e.,there are no additions nor losses of any species at any time. This value may increase ordecrease throughout time according to the sum ∑r
µ=1 SiµZµ(t).Using vector notation, N(t) = (N1(t), ..., Ns(t))> ∈ Zs
+, X(t) = (X1(t), ..., Xs(t))> ∈Rs
+, Z(t) = (Z1(t), ..., Zs(t))> ∈ Zr+, we can write (1.3) as
N(t) = N(0) + SZ(t) (1.4)
8

Mathematical models in cancer• 2017
Dividing (1.4) by the mass volume, Ω, we obtain the equation in terms of concentrations
X(t) = X(0) +SZ(t)
Ω(1.5)
However, reactions are events that occur in a discrete set of time instants. Moreover, thetime of occurrence of a reaction and the reactions that occur in the set of possible reactionsare random variables since they are determined by several microscopic factors. Thereforea deterministic description has to be based on several simplifying assumptions:
• Reactions are so frequent that the number of occurrences Z(t) can be approximatedby a continuum variable z(t). This assumption requires that a large number ofmolecules are in a large volume free to interact with each other. It also requires thatthe physical characteristics of each molecule (energy, orientation, etc.) favor theinteractions which translate into a rate constant k. The presence of a large numberof molecules also means that the occurrence of a reaction translates into a smallchange of Ni, so we can also approach N(t) by a continuous variable n(t). Theconcentration X(t) can also be approximated by a continuous x(t) = X(t)/Ω.
With these assumptions, (1.4) and (1.5) lead respectively to
n(t) = n(0) + Sz(t) (1.6)
x(t) = x(0) +Sz(t)
Ω(1.7)
Taking the derivative over time, we get
n(t) = Sz(t) (1.8)
x(t) =Sz(t)
Ω(1.9)
However, these ordinary differential equations are only useful if we can establish a rela-tionship between the derivative z(t) and the variables n or x. Suppose that it is possible toestablish such a relationship, z(t) = v(n) = Ωv(x). Thus, (1.8) and (1.9) could be writtenas n(t) = Sv(n) and x(t) = Sv(x(t)).In many reactions, the rates v and v are proportional to the products of powers of con-centrations of the reagents, elevated to a certain exponent (mass-action law, Gulberg andWaage 1864-1879):
vµ = kµ
s
∏i=1
nαiµi ; vµ = kµ
s
∏i=1
xαiµi (1.10)
Substituting (1.10) in z(t) = v(n) = Ωv(x), we get
kµ
s
∏i=1
nαiµi = vµ(n) = Ωvµ(x) = Ωkµ
s
∏i=1
xαiµi
As x = n/Ω, then
kµ
s
∏i=1
nαiµi =
Ω
Ωs∑
i=1αiµ
kµ
s
∏i=1
nαiµi ↔ kµ =
kµ
Ωs∑
i=1αiµ−1
(1.11)
9

Mathematical models in cancer• 2017
IV Enzymatic Michaelis-Menten kinetics
Enzyme kinetics studies the chemical reactions catalyzed by enzymes, particularly therate of reaction. The study of the kinetics of an enzyme allows elucidate the details ofits catalyst mechanism, its role in metabolism, how its activity is controlled in the cell, forexample how it can be inhibited by drugs or poisons or potentiated by other molecules.Many chemical and biological systems rely on enzymes that catalyze (i.e., accelerate therate of a reaction without being consumed during the process), one or more of the possiblereactions. A relatively simple model was proposed by Michaelis and Menten [45], wherethe reaction involves an enzyme E manipulating a substrate S which in turn reacts to forma new molecule, the product P [figure 1.3].
Figure 1.3: Michaelis-Menten model
The reaction network is
S + Ekb−−−−−−−−kd︸ ︷︷ ︸
binding/dissociation
SE kcat−−−−−→ P + E︸ ︷︷ ︸catalysis
(1.12)
Using mass-action law and the notation for concentrations xE = E, xSE = SE, xP = P, thekinetics equations are
dSdt = −kbS · E + kdSEdSEdt = kbS · E− (kd + kcat)SE
dEdt = −kbS · E + (kd + kcat)SEdPdt = kcatSE
(1.13)
As initial conditions, assume there is a certain quantity of S and E, but no SE nor P, i.e.,S(0) = S0, E(0) = E0, SE(0) = 0 = P(0). Two useful conservation laws are d
dt (E+ SE) = 0and d
dt (S + SE + P) = 0 which leads to E + SE ≡ Etotal = E0, S + SE + P ≡ S0. The firstequation tells us that enzyme E is not produced or consumed during the reaction, it can befree or part of complex SE, but its total concentration remains constant equal to Etotal.Therefore we can reduce the four kinetic equations above, only to two
dSdt = −kbEtotal · S + (kd + kb)SEdSEdt = kbEtotal · S− (kcat + kd + kbS) · SE
(1.14)
10

Mathematical models in cancer• 2017
However, these equations are intractable. One of the most used simplifying hypothesis(Briggs and Haldane) is to assume that, with the progress of the reaction dynamics,the system reaches a quase-steady state in which the concentration of the complex SEremains constant. Experimental studies have shown that the concentration of the complexSE reaches a steady state much faster than the substrate. At equilibrium, the concentrationSE doesn’t change with time. Therefore, we can assume that dSE
dt = 0. From the secondequation in (1.13), we get
SE =EtotalSKm + S
(1.15)
where Km = kd+kcatkb
is the Michaelis-Menten constant. For the reaction rate we obtain theMichaelis-Menten equation
v =dPdt
= kcatSE =kcatEtotalS
S + kd+kcatkb
=VmaxS
Km + S(1.16)
where Vmax = kcatEtotal.
The reaction network established in the model, explained in chapter 6, follows mass-action law and Michaelis-Menten kinetics, as well as Hill’s equation.
V Cooperation. Hill equation
Many enzymes have more than one site to bind to substrates. If these sites act inde-pendently of one another, the enzyme is said to be non cooperative. If the binding ofa molecule of substrate to a site facilitates the attachment of another molecule at a sec-ond site, the enzyme is said to be positively cooperative. If, however, the binding of asubstrate molecule at a site hinders the binding of another molecule at a second site, theenzyme is said negatively cooperative.
Suppose that an enzyme can bind to two molecules of S substrate and that bothbindings allow for the synthesis of the same product P. The generic name for a bindingmolecule is Ligand (Latin: Ligare). The binding reaction can be represented by:
S + Ek1−−−−−−−−−−k−1
SE k2−−−−→ P + E
SE + Sk3−−−−−−−−−−k−3
SSEk4−−−−→ P + SE
(1.17)
Using the conservation lawE + SE + SSE = Etotal
and the quasi-stationarydSEdt
= 0 =dSSE
dt
we can deduce for the reaction rate S −→ P, υS→P =dPdt
=(k2K2 + k4S) · Etotal · S
K1K2 + K2S + S2 , where
K1 = (k−1 + k2)/k1 and K2 = (k−3 + k4)/k3. Let’s examine two cases:
11

Mathematical models in cancer• 2017
• First let’s consider the case of non-cooperation – the binding sites act independentlyand identically. So k1 = 2k3 = 2k+, 2k−1 = k−3 = 2k− e 2k2 = k4 where k+ e k− are
reaction rates for binding to each of the sites individually. Doing K =k− + k2
k+, we
obtain K1 = K/2, K2 = 2K and so
υ =2k2Etotal(K + S) · S
K2 + 2K + S2 =2k2Etotal · S
K + S
i.e. the reaction rate with two binding sites is exactly twice the speed for only oneplace.
• Next, consider the case of positive cooperation, where the first substrate bindingmolecule is slow and this first connection turns the second faster. Keeping k1k3constant, if k1 → 0, then k3 → ∞, . In this case, reaction speed is
υ =VmaxS2
K2m + 2K + S2
where K1K2 = K2m and Vmax = k4Etotal.
In general, if the enzyme has n binding sites, then
υ =VmaxSn
Knm + 2K + Sn , Hill equation (1.18)
The exponent n is generally determined from experimental data and can be non-integer, therefore not equal to the number of active sites. For a simple proof of thegeneralization for n binding sites, see [55].
12

Chapter 2
The Cell Cycle: An overview
I Different phases
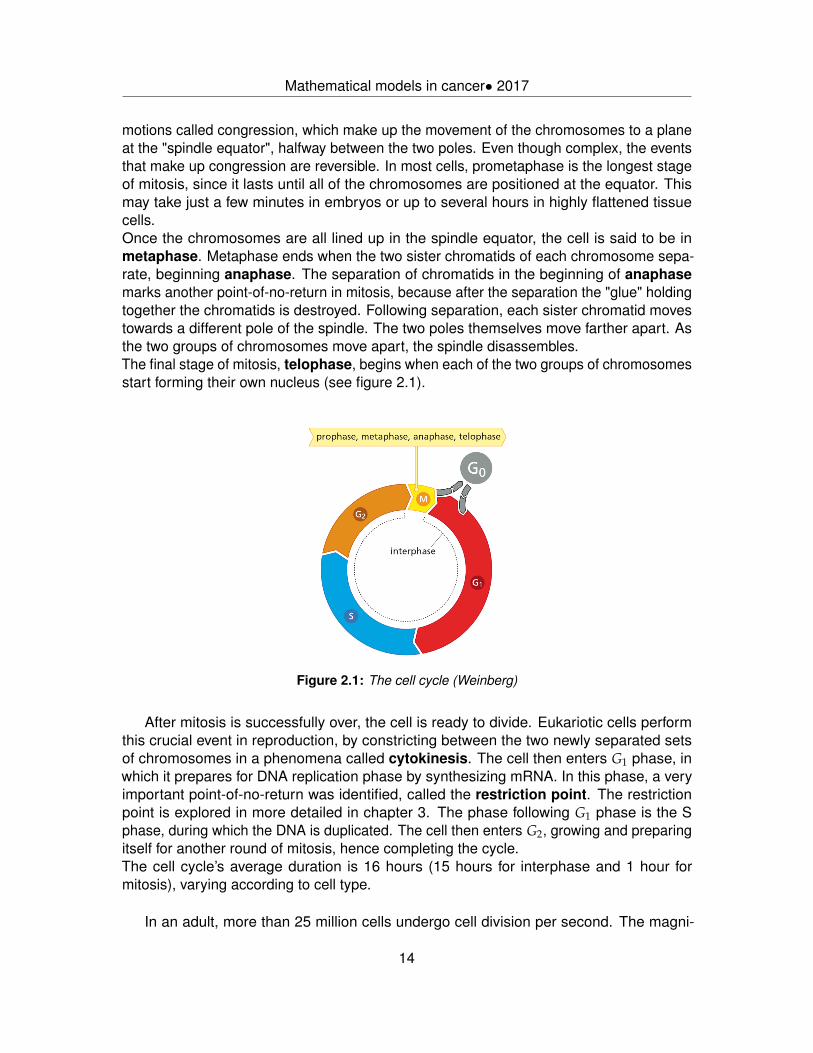
Cell proliferation involves the reproduction of a cell to originate two daughter cells, eachwith the potential to originate their own offspring. This activity in multicellular organisms isfundamental not only to produce cells essential for development and growth, but also toreplace cells as they die, and it functions in a periodical fashion, following a sequence ofstages. This periodic sequence is called the cell cycle.The cell cycle of eukaryotic cells can be divided in two main events: replication of DNA,known as S phase, and mitosis, known as M Phase, followed by cytokinesis. Between Sphase and M phase the cell enters G1 and G2 phase, in which different concentrations ofbiomolecules change. The set of phases which includes G1, S and G2 phases is calledinterphase . When the cell is not in mitosis nor in interphase, it means it is in a quiescencestate, the so called G0 phase, or is preparing itself for apoptosis, i.e. programmed celldeath.After cell division, each one of the daughter cells enter G2 phase, in which they prepare toenter mitosis. Mitosis proceeds through a series of stage conversions characterized bythe location and behaviour of the chromosomes. Some of the conversions during mitosisare irreversible transitions. The first stage during mitosis is called prophase, in whichthe chromosomes within the nucleus rearrange themselves to become condensate. Inwarm-blooded creatures with small chromosomes, this stage can last less than 15 minutes.At some point of prophase, the cell commits to mitosis, i.e., it passes through a series ofbiochemical changes which are irreversible transitions. Before this point in prophase isreached, chromosome condensation can be reversed by physical or chemical alterations tothe cell. Prophase in eukariotic cells is also commonly marked by the appearance of twocentrosomes, which is a molecular arrangement of microtubules whose function is to helpstabilizing the structure of the cell. The decomposition of the nuclear envelope signals thebeginning of the prometaphase. During prometaphase, the chromosomes interact withthe two centrosomes and their associated arrays of microtubules to form the spindle. Asthe chromosomes become attached to the spindle, they go through a series of complex
13
Mathematical models in cancer• 2017
motions called congression, which make up the movement of the chromosomes to a planeat the "spindle equator", halfway between the two poles. Even though complex, the eventsthat make up congression are reversible. In most cells, prometaphase is the longest stageof mitosis, since it lasts until all of the chromosomes are positioned at the equator. Thismay take just a few minutes in embryos or up to several hours in highly flattened tissuecells.Once the chromosomes are all lined up in the spindle equator, the cell is said to be inmetaphase. Metaphase ends when the two sister chromatids of each chromosome sepa-rate, beginning anaphase. The separation of chromatids in the beginning of anaphasemarks another point-of-no-return in mitosis, because after the separation the "glue" holdingtogether the chromatids is destroyed. Following separation, each sister chromatid movestowards a different pole of the spindle. The two poles themselves move farther apart. Asthe two groups of chromosomes move apart, the spindle disassembles.The final stage of mitosis, telophase, begins when each of the two groups of chromosomesstart forming their own nucleus (see figure 2.1).
Figure 2.1: The cell cycle (Weinberg)
After mitosis is successfully over, the cell is ready to divide. Eukariotic cells performthis crucial event in reproduction, by constricting between the two newly separated setsof chromosomes in a phenomena called cytokinesis. The cell then enters G1 phase, inwhich it prepares for DNA replication phase by synthesizing mRNA. In this phase, a veryimportant point-of-no-return was identified, called the restriction point. The restrictionpoint is explored in more detailed in chapter 3. The phase following G1 phase is the Sphase, during which the DNA is duplicated. The cell then enters G2, growing and preparingitself for another round of mitosis, hence completing the cycle.The cell cycle’s average duration is 16 hours (15 hours for interphase and 1 hour formitosis), varying according to cell type.
In an adult, more than 25 million cells undergo cell division per second. The magni-
14

Mathematical models in cancer• 2017
tude of this number justifies the need for a precise mechanism of regulation of the cellcycle. The biomolecules that regulate this cycle are the cyclins (Cyc’s) and the cyclindependent kinases (CDK’s), proteins and enzymes, respectively. The concentration ofcyclin proteins is dependent on the transcription of its gene and by subsequent regulatedprotein degradation. The pairing of cyclins to the CDK’s is highly specific. Cyclins areregulatory subunits of their CDK’s, and upon binding of a cyclin to its CDK partner, thecyclin induces a conformational change in the catalytic subunit of the CDK revealing itsactive site. Different Cyclin/CDK complexes are present at specific phases in the cell cycle,and they are important regulators of irreversible phase transitions.To enter the cycle from G0 phase, some external signal must be transducted through thecell’s cytosol reaching the nucleus and promoting transcription of CycD and CDK4,6, thusconducing the cell to enter G1 phase. This external signal is transducted via signallingpathways, two of which are explored in chapter 5.Cyclin D plays a role in the regulation of expression of the cyclin E gene, and consequently,during the transition between G1 and S phase, CycE/CDK2 complexes increase theirconcentration in the cytosol, allowing for the transcription of CycA and CDK2, which, in theform of complex, promotes the movement to the G2 phase of the cycle, where CycA/CDK1complexes are predominant, leading the passage to mitosis, where, in turn, CycB/CDK1complexes are in abundance. Activation of the anaphase-promoting complex (APC) bybinding of cell-division cycle protein 20 (CDC20) and cadherin 1 (CDH1) is necessaryfor exiting mitosis. This completes the cycle of concentrations of Cyclin/CDK complexes,right before the cytokinesis event.Two families of inhibitors are involved in regulating Cyclin/CDK activity: the p16ink4a (INK)family and the p21 (Cip/Kip) family. The INK proteins bind CDK’s 4/6 and interfere withthe binding of CDK’s 4/6 to Cyclin D. The p21 proteins interact with both cyclins and theirassociated CDK’s, blocking the ATP-binding site, thus disabling this site, blocking kinaseactivity (hence the designation inhibitor ).
II Cell cycle arrest and Apoptosis
The cell cycle can be disrupted by the cell itself if something is not according to theregulation we summarized in the previous sections. As it was mentioned in the last section,the cell cycle is armed with specific checkpoints to prevent anomalies in development bycorrecting or stopping any malformations or errors before committing to following phases inthe cycle. An extensively studied checkpoint is the G1 checkpoint which, for the purpose ofthis thesis, will be explored in more detail in the following section. Another one of thesecheckpoints can be found during G2 phase, after S-phase and before mitosis. When aG2 cell was fused with an S-phase cell, the G2 phase nucleus "waited" for the S-phasenucleus to finish DNA replication before undergoing nuclear envelope breakdown andentering mitosis. This suggested that a mechanism exists to prevent mitosis until DNAreplication is complete. There is also a checkpoint that monitors DNA replication processduring S-phase.Even though these surveillance mechanisms happen during distinct phases of the cycle,they all consist of a sensor that detects a defect in an event, a signalling module that
15

Mathematical models in cancer• 2017
transmits a signal upon detection of an error, and a target that is part of the cell cycleengine controlled to halt cell cycle progression. In some cases, this conduces the cellto a specific fate called programmed cell death. In general, it occurs by the mechanismof cell death denominated apoptosis. Although most programmed cell deaths occur byapoptosis, these are not the same thing. Programmed cell death refers specifically tocell death occurring at a defined point in development, whereas apoptosis is defined bymorphological features of the cell death. Apoptosis is a mechanism of defense developedto protect multicellular organisms from malformations in cell development and/or activity,for it conduces the cell to destroy itself without damaging neighboring cells. It does so byshrinking, condensing, tearing up its outer layers and breaking the DNA into fragments [10].However, apoptosis must be carefully regulated. Inadequate activation of apoptosis canoriginate the unnecessary destruction of cells seen in some neurodegenerative diseases.It is important to note that not all cell death is apoptotic. It can also happen due tonecrosis,i.e., disabling damage or trauma, making it impossible for the cell to survive.Apoptosis, on the other hand, is stimulated when the DNA is damaged, the cell sufferswithdrawal of essential growth factors or nutrients or it is attacked by cytotoxic lymphocyte.When DNA is damaged, the ATM ("ataxia-telangiectasia mutated") kinase is activated,culminating in p53 concentration increase, which in turn gives place to a sequence of eventsthat turn on Caspase-9 and ultimately induces apoptosis. The details on this mechanismare far too extensive for the purpose of our model, which is why we kept the apoptoticdynamics fairly simple, as we explain in chapter 7.
III The Restriction Point Regulation
In the late G1 phase there is some device that allows the cycle to continue regardless ofmitogenic activity at the membrane. This point, called Restriction Point, was set betweenthe 3rd and the 4th hour of G1 phase [11], and its regulation is managed by the expressionof the retinoblastoma protein, Rb.Retinoblastoma is a rare childhood cancer. It is caused by a mutation in the retinoblastomatumor supressor gene, named after the disease, and found in chromosome 13 [46]. Theretinoblastoma protein, Rb, whose transcription is done from the retinoblastoma gene,plays an important role in regulating the restriction point along with E2F transcriptionfactor family, which is crucial for the expression of genes needed for S phase. Active E2F,migrates to the nucleus of the cell where it promotes DNA replication, initiating S phase.Active Rb interferes with the transactivation domain of E2F, deactivating E2F and thusinhibiting the passage to S phase. Rb is activated in its hypophosphorylated form andis deactivated in its phosphorylated form. In response to a growth signal, CycD/CDK4,6complexes inhibit active Rb, phosphorylating it partially, leading to a partial activation ofE2F. PP1 phosphatase dephosphorylates Rb, increasing the concentration of active Rb andthus promoting the inhibition of E2F. Along with CycE/CDK2 complexes, E2F promotes thepassage through the G1-S phases frontier, hence leading to DNA replication, independentof further mitogenic signals. At this point, the cell enters in automatic program.
16

Chapter 3
P53: The Guardian of the Genome
I P53 pathway
The p53 gene, found in 1979 by separate groups of investigators [5-8], and set to be a tu-mor supressor gene in 1989 ([17], [18]), expresses the p53 protein, a central biomoleculein cancer research, specifically in the study of pathways within the cell. This is due to thefact that virtually all cancers exhibit some sort of mutation of p53 gene or modificationsto its pathway. The study of p53 pathway revealed the core of its regulation as well asseveral links that it establishes between other major pathways, such as the one of Rbprotein, E2F and Ras. The concentration of p53 protein within an unstressed cell is low,however it has a fast turnover when the cell is under stress or has suffered DNA damage.Upstream stress activators include radiation-, drug- or carcinogen-induced DNA damage.P53 can elicit downstream cellular effects, which include transient or permanent cell cyclearrest, DNA repair, apoptosis, and inhibition of angiogenesis. The ability it has to inducecell cycle arrest allows for the repair of DNA damage. Cell cycle inhibition and apoptosisare, however, two independent effects of p53.The core regulation of p53 protein is co-protagonized by the protein Hdm2 (Mdm2 inthe mouse) that inhibits p53 protein by binding to it directly. P53 protein promotes thetranscription of Hdm2, defining a negative feedback loop between p53 protein and Hdm2[19], [20]. p14ARF (p19ARF in the mouse) in turn inhibits Hdm2 and its activity is inhibited byp53 protein. The transcription factor E2F also plays a role in p53 regulation, by sustaininga negative feedback loop with p14ARF by inducing it while being inhibited by it [9]. In [21],downstream events were explored in distinct pathways, as well as useful positive andnegative feedback loops for p53 protein.Inhibition of cell cycle involves the transcriptional induction of p21 gene. Its product, thep21 protein, inhibits several Cyclin/CDK complexes and causes a pause in the G1 to S (andG2 to mitosis) transition of the cell cycle.Let us resume the main downstream event triggered by p53 protein activity which cul-minates in cell cycle arrest: the p21 gene product, a Cyclin Dependent Kinase Inhibitor(CKI), that inhibits CycE/CDK2 complex is a relevant molecule in p53-mediated G1-S phase
17

Mathematical models in cancer• 2017
arrest. Its transcription is induced by p53 protein activity. In addition, p21 also binds PCNA(proliferating cell nuclear antigen), a protein that has a role in DNA synthesis and DNArepair. The interation with p21 inhibits PCNA’s role in DNA replication. This facilitates theaction of p53 in stopping cell cycle. The regulation of p21 gene is therefore important inp53 decision-making process.There is also CDC25 inhibited by 14-3-3-sigma, and CDC2 induced by CDC25 and CycB,the latter inhibited by Gadd45. CDC2 promotes Cell Cycle arrest between G2-S phase.This last pathway is not of our interest, as it concerns another checkpoint in the cell cycle,not the restriction point. The cell cycle arrest pathway in which we focused our attentionwas the one concerning the checkpoint during G1-S phase transition, and is obviously ofthe most relevance for studying the regulation of the restriction point.Cysteine aspartate-specific proteases (caspases) regulate many of the cellular and bio-chemical changes in the dying cell undergoing apoptosis. They do not need to be newlysynthesized upon activation of apoptosis, as they are present in inactive forms. Executioner,initiator and inflammatory caspases are the three main types of caspases. Executionercaspases are responsible for cleaving many different proteins, and it has been estimatedthat there are approximately 500 substrates for caspases in mammalian cells. In mostcases of apoptosis, the cleavage of these executioner caspases is mediated by anotherset of caspases, the initiator caspases. The activation of the executioner caspases by theinitiator caspases defines the different pathways of apoptosis.Another important element in the initiation of apoptosis is cytochrome c, which is one of thecomponents of the electron transport chain in the mitochondria. It has the ability to bind tothe apoptotic protease activating factor 1 (Apaf-1) once released from the mitochondria,creating a protein designated apoptosome which will proceed to activate an initiator cas-pase, caspase-9, forming a complex which will trigger cell destruction.The p53 pathway that culminates in apoptosis is triggered by ATM. Active p53 releasescytochrome c from the mitochondria [50], thus promoting binding to apaf-1 and subsequentactivation of caspase-9, while in contrast protein kinase B (Akt) negatively regulates pro-apoptotic proteins, thus inhibiting the activity of cytochrome c/apaf-1/caspase-9 complex.(see model diagram 7.1).
18

Chapter 4
Signalling Transduction Pathways
To carry out biochemical signals throughout the cell, a sophisticated mechanism evolvedwhich includes several pathways collaborating in the complex intracellular environment. Inthis section we explore two major signalling transduction pathways which are important tothe cell cycle paradigm since they influence its regulation direct or indirectly.
Epidermal growth factors (EGF) and its family of receptor tyrosine kinases are impor-tant members of the mechanism that underlies signal transduction, gene expressionregulation and cell proliferation induced by an extracellular growth factor. The members ofthe receptor tyrosine kinase receptor family contain an extracellular ligand-binding domain,a single transmembrane domain, and a cytoplasmic protein tyrosine kinase domain. Thepathway of the signal from the extracellular source to the cell’s nucleus, where the geneexpression is preformed, is done in multiple layers forming the so called MAPK cascadesignalling pathway.
I The MAPK cascade signalling pathway
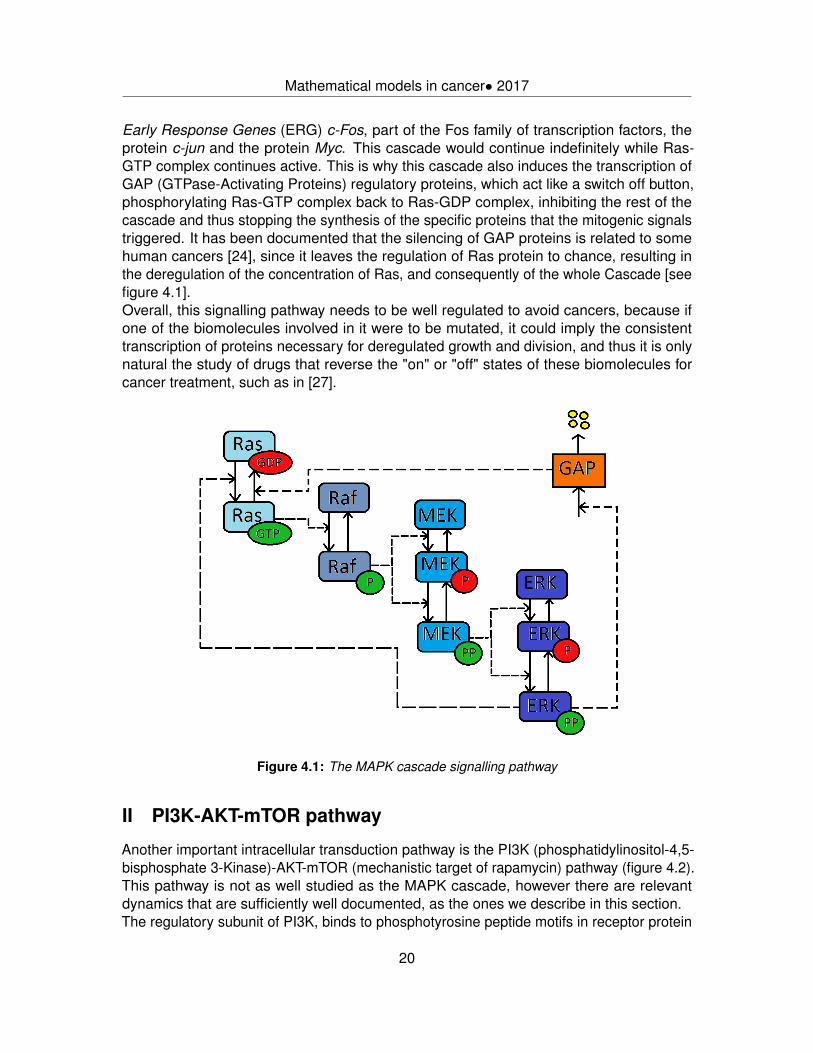
MAPK Cascade signalling pathway (Mitogenic-Activating-Protein Kinase Cascade), is amain mechanism for protein synthesis motivated by extracellular signals. It depends onMAPKKK, MAPKK and MAPK whose phosphorylated form is the activated form.
Extracellular signals, also called Ligands, such as Growth Factors, bind to trans-membrane receptors, whose cytosolic domain may be allosterically altered, enabling itsphosphorylation, inducing the binding of Growth factor receptor-bound protein 2 (GRB2)molecule, activating it. Active GRB2 activates Son of Sevenless (SOS), which in turnphosphorylates Ras-GDP complex to Ras-GTP complex. The latter can then activate Raf(MAPKKK) by binding. Raf will proceed the mechanism by phosphorylating MEK (MAPKK).Activated MEK promotes the phosphorylation of ERK (MAPK). Finally, active ERK promotesthe activation of transcription factors and subsequent migration to the nucleus where it willbind to DNA transcription sites, leading to protein synthesis [7].Phosphorylated ERK promotes cell growth [22]. Important transcription factors are the
19
Mathematical models in cancer• 2017
Early Response Genes (ERG) c-Fos, part of the Fos family of transcription factors, theprotein c-jun and the protein Myc. This cascade would continue indefinitely while Ras-GTP complex continues active. This is why this cascade also induces the transcription ofGAP (GTPase-Activating Proteins) regulatory proteins, which act like a switch off button,phosphorylating Ras-GTP complex back to Ras-GDP complex, inhibiting the rest of thecascade and thus stopping the synthesis of the specific proteins that the mitogenic signalstriggered. It has been documented that the silencing of GAP proteins is related to somehuman cancers [24], since it leaves the regulation of Ras protein to chance, resulting inthe deregulation of the concentration of Ras, and consequently of the whole Cascade [seefigure 4.1].Overall, this signalling pathway needs to be well regulated to avoid cancers, because ifone of the biomolecules involved in it were to be mutated, it could imply the consistenttranscription of proteins necessary for deregulated growth and division, and thus it is onlynatural the study of drugs that reverse the "on" or "off" states of these biomolecules forcancer treatment, such as in [27].
Figure 4.1: The MAPK cascade signalling pathway
II PI3K-AKT-mTOR pathway
Another important intracellular transduction pathway is the PI3K (phosphatidylinositol-4,5-bisphosphate 3-Kinase)-AKT-mTOR (mechanistic target of rapamycin) pathway (figure 4.2).This pathway is not as well studied as the MAPK cascade, however there are relevantdynamics that are sufficiently well documented, as the ones we describe in this section.The regulatory subunit of PI3K, binds to phosphotyrosine peptide motifs in receptor protein
20

Mathematical models in cancer• 2017
tyrosine kinases (RTK’s) or the insulin receptor substrate 1 (IRS-1). This activates PI3K,which converts PIP2 (Phosphatidylinositol 4,5-bisphosphate) to PIP3 (Phosphatidylinositol(3,4,5)-trisphosphate), a reaction that is counter-acted by PTEN. PIP3 binds to AKT (Pro-tein kinase B), forming the PIP3/AKT. PDK1 interveins to phosphorylate this complex, fullyactivating it. Active PIP3/AKT phosphorylates TSC2 (Tuberous sclerosis 2), deactivatingit. TSC1 (Tuberous sclerosis 1) and active TSC2 form TSC1/TSC2 complex, which inhibitRheb (Ras homolog enriched in brain) activity. In turn, Rheb promotes mTORC1 (mam-malian target of rapamycin complex 1) activation. A feedback control in this PI3K/AKTpathway is the inhibition caused by mTORC1 in RTK dynamics, by phosphorylating IRS1,and also inhibiting EGF receptor, ERB2 and IGF1 receptor, therefore not allowing forinteraction with PI3K and subsequent activation and downstream of the pathway [28].
Figure 4.2: The PI3K/AKT signalling pathway
21


Chapter 5
Cancer: An overview
I Introduction
The biological revolution of the twentieth century, triggered by Watson and Crick’s discoveryof the DNA double helix, reshaped all fields of medical study, cancer research being one ofthem. Cancer started being studied as a genetic disease, which allowed researchers tolink the genetic traits of cancer behaviour to intra- and inter-cellular pathways that comeabout. With the development of technology, these cellular pathways, were - and still are- being analyzed in evermore detail, promoting the establishment of new concepts in thefield of biology, biochemistry and, specifically, cancer research.Thanks to this improvement in scientific knowledge, cancer is now seen as a diseasewith a high level of complexity. The development of cancer is linked to many systems incomplicated ways, and as such it comprehends a large number of degrees of freedom,making it particularly difficult to model due to the large number of variables that this implies.To say the same from a biological point of view, the eukariotic cell’s is not an isolatedsystem, and so interacts with its environment and responds to input stimuli in complicatedways. These output responses of a cell are based in many pathways created by themotion and/or action of particles, biomolecules or organelles, inside and outside the cell’smembrane, and are orchestrated by the cell’s genetic information. This is what allows thecell to produce proteins which function in some part of its metabolism. However, the geneticinformation, arranged in the DNA, does not operate in a deterministic way, but rather ina strong stochastic way. This complicates the study of genetic diseases, and hence thiscomplicates the study of cancer. Not only the DNA of a particular cell is initially formedfrom another cell whose DNA may not be exactly the same due to mutations, but it alsokeeps on changing throughout the cell’s life according to its environment. These changesin genetic information can originate a cancer cell. And a cancer cell generates offspringwith potentially the same anomalies it has.Even though the problem of modeling cancer seems too complicated to be done usinguniquely deterministic approach and no type of data science whatsoever, our approachto cancer is done in a more humble way. Instead of tackling the disease from all thepossible directions, studying the space and time dynamics of each component of all thepossible pathways and deriving stochastic parameters to count for the randomness present
23

Mathematical models in cancer• 2017
in nature, i.e., modelling each and every feature of cancer, we decided investigating only asubset of the characteristics, preparing the ground for posterior research to introduce morecomplexity to our model. This takes us to the next section.
II The hallmarks of cancer
In the year 2000, Hanahan and Weinberg defined six hallmarks of most, if not all, cancers.They proposed that acquiring the capability for autonomous growth signals, evasion ofgrowth inhibitory signals, evasion of apoptotic cell death, unlimited replicative potential,angiogenesis (formation of new blood vessels), and invasion and metastasis are essentialfor carcinogenesis. More recently, two enabling characteristics were added, these beinggenome instability and tumor-promoting inflammation, that are crucial for acquiring the sixhallmarks, and two emerging hallmarks, reprogramming energy metabolism (metabolicstress) and avoiding immune destruction, were highlighted [see figure 5.1]. Reprogrammingenergy metabolism and avoiding immune destruction are considered as emerging hallmarksbecause their relationship to the other mentioned hallmarks requires further research, eventhough it is clear they are relevant to carcinogenesis.Healthy cells need external signals, such as growth factors, to divide, and they respond toinhibitory signals to maintain homeostasis (most cells of the body are not actively dividing).They have an autonomous counting device to define a finite number of cell doublingsafter which they become senescent. This cellular counting device is the shortening ofchromosomal ends, called telomeres, that occurs during every cycle of DNA replication.Normal cells also maintain their location in the body, and generally do not migrate if that isnot part of their function (for example, blood cells). These cells depend on blood vessels tosupply oxygen and nutrients, but the vascular architecture remains more or less constantin an adult, meaning that there is no induction of angiogenesis. A healthy cell is eliminatedby apoptosis, often in response to DNA damage.Cancer cells on the other hand are independent of growth signals, and acquired mutationscan shorten the pathway of these signals, leading to unregulated growth. Also, they havethe capacity of ignoring growth inhibitory signals. There is evidence to support the theoryof immune surveillance which states that the immune system can recognize and eliminatecancer cells. Cancer cells may be able to interfere or pass unnoticed by the immuneresponse of the body so as to avoid immune destruction. This is one of the emerginghallmarks mentioned previously. Contrary to normal cells, cancer cells maintain the lengthof their telomeres, by reconstruction via the activity of the protein telomerase, which resultsin unlimited replicative potential. Virtually all tumors contain inflammatory immune cells.Inflammation is an immune response that can help that acquisition of the core hallmarks ofcancer, which is why it is considered an enabling characteristic. This happens, for example,when inflammatory cells provide growth factors and enzymes that promote angiogenesisand invasion. Metastasis, i.e., the movement of cancer cells to other parts of the body, is amajor cause of cancer deaths. Alterations of the genome may affect the activity or levels ofenzymes involved in invasion or molecules involved in intercell or extracellular adhesion.Cancer cells also include angiogenesis, needed for tumor survival and expansion. Alteringthe balance between angiogenic inducers and inhibitors can activate the angiogenic switch,
24

Mathematical models in cancer• 2017
and cancer cells promote this event. Acquiring the core hallmarks of cancer usuallydepends on genomic alterations, which can be caused by external sources and/or faultyDNA repair pathways, contributing to genomic instability. Thus, genome instability andmutation is an enabling characteristic of cancer. Evading apoptotic signals, which arecrucial to induce apoptosis, i.e., programmed cell death, is a feature of every cancer cell.Finally, cancer cells have the capacity of reprogramming their own energy metabolism,considered to be an emerging hallmark. This is a useful characteristic for maintenance ofenergy given the uncontrolled cell division cancer cells go through. The demand in fueland byosynthetic precursors is matched thanks to the intermediation of glycolysis carriedout by cancer cells even in the presence of oxygen.There two are major types of mutated genes that contribute to carcinogenesis, whichare the oncogenes and the tumor suppressor genes. Generally, an oncogene is a genemutated such that its protein product is produced in abundance, or has increased activityand therefore acts in a dominant manner - i.e., the mutation is only required in one allele toexpress an effect - to initiate tumor formation. Tumor supressor genes code for proteins thatplay a role in inhibiting both growth and tumor formation. Loss of growth inhibition occurswhen mutations cause a loss of function of these genes. Tumor supressor genes aremainly recessive genes, which means that usually it suffices that one allele is kept intactto inhibit growth. However, recent evidence suggests there is a mechanism for particulartumor suppressor genes, called haploinsufficiency, whereby only one mutated allele canlead to the cancer phenotype.
Figure 5.1: The hallmarks of cancer
25

Mathematical models in cancer• 2017
III Relevant Pathways in Cancer and their deregulations
Even though cancer is a very complex disease, in the last decades, thanks to the develop-ment of technology, specific pathways and key elements of the cell have been identified andlinked to carcinogenesis. The MAPK cascade signalling pathway and the PI3K-AKT-mTORpathway are two major examples. We will explore how these two pathways, as well as keyelements in the cell cycle, are related to cancer development.The oncogenic activation of Ras is observed in about 30% of human tumors. This alterationof the Ras protein implies a consequent loss of GTPase activity of Ras. In normal circum-stances, GTPase activity is required to return active Ras-GTP to inactive Ras-GDP. Thisleads to a constitutive activation of Ras protein, even in the absence of mitogens. Somespecific mutations in the Ras gene are characteristic for specific cancers. The majority ofmutations in Ras gene occur in codons 12, 13 and 61. A typical mutation within codon 12that results in the substitution of valine (GTC) for glycine (GGC) is characteristic of bladdercarcinoma, while substitution of serine (AGC) is common in lung cancer.Another protein vulnerable to mutations is the B-Raf protein. The oncogenic form of B-Rafis common in melanomas. B-Raf’s oncogenic activation causes kinase over-activity andinsensivity to feedback mechanisms. MEK mutations, on the other hand, are less common:approximately 1% of tumors contain MEK mutations and no mutations have been identifiedas of 2010.The PI3K pathway is commonly altered in colon cancer [51]. PI3K enhancement, AKThyperactivity and PTEN loss are just some of the most common deregulations in thistransduction pathway.We already discussed in chapter 2 the Rb protein functions in the cell cycle. When thismechanism is corrupted, the cell can proceed to DNA replication even with DNA errorsor other types of malfunctions, which can originate cancer. Rb is an indirect regulator oftranscription for specific gene expression that affects cell proliferation and differentiation.Even though the Rb gene is expressed in all adult tissues, only retinoblastoma and a veryfew other types of cancer are initiated by loss of Rb. But still, the Rb pathway is inactivatedin most human tumors.A very important altered pathway in cancer is the p53 pathway, since it is deregulatedin virtually all cancers. This high frequency may be the result of tumor cells that escapetumor suppressor effects of p53 through natural selection. p53 mutant cells are char-acterized by genomic instability. Over 75% of p53 mutations result in single amino acidsubstitutions, and in this sense p53 differs from other tumor suppressor genes, in thatother tumor suppressors are usually characterized by nonsense or frame-shift mutationsthat lead to inactivated truncated proteins. Over-expression of the Hdm2 protein has beendemonstrated to affect the regulation of p53, leading to a "p53-inactivated" phenotype.
IV Molecular targets in cancer therapies
The development in technology not only allows researchers to identify the origins ofdiseases but also to target core effectors in molecular pathways. This knowledge is vitalfor the field known as personalized medicine, which, in contrast to one-fits-all therapies,
26

Mathematical models in cancer• 2017
investigates adequate individual treatments of diseases of each patient. As each canceris intimately linked to genetic information of the host, it is not to wonder the progress thatcancer therapies can have with the development of personalized medicine. These therapiestarget common deregulated pathways in human cancers, such as the ones discussed inthe previous section.Although 20% of all tumors have activating mutations in Ras, targeting downstream effectorshas proved to be valuable as a cancer treatment. Several strategies to target Raf have beendeveloped. The same idea used to target other kinases has been put into practice with Raf.A multi-kinase inhibitor that targets ATP-binding site of Raf, called NEXAVATARTM wasapproved for treatment of advance renal cell carcinoma and hepatocarcinoma in countrieslike the USA, Switzerland and Mexico. Results exhibited a reduction in downstream MAPKphosphorylation in the blood of patients under the well-tolerated oral treatment. InhibitingMEK is a possible approach for Ras or Raf mutated patients. Several allosteric MEKinhibitors (inhibitors that do not compete with ATP) are in clinical trials.The role of p53 as a core tumor suppressor and the high incidence of its mutations incancer suggest promising p53-based therapies could be developed. The different waysp53 can be altered indicate that studying the p53 genotype prior to start a treatment couldbe the key for the success of p53-based therapies. Gene correction is therefore an obviousapproach. Adenoviruses, such as Onyx 015 adenovirus, have been used to selectivelykill cancer cells with p53 mutations. Another way to target p53 pathway is to developinhibitors of the p53-Hdm2 interaction since, as seen on chapter 3, Hdm2 inhibits p53.Diminishing tumor growth by 90% has been demonstrated in animal models following theidea of inhibiting p53-Hdm2 interaction. The success of chemotherapy and radiotherapy isoften limited by side-effects in healthy tissue, and many of these side-effects are, in part,mediated by p53. There is normally high expression of p53 in tissues that are sensitive tothese therapies and the DNA damage caused by them induces p53 to cause apoptosis,which is the mechanism behind the side-effects. Therefore, temporarily and reversiblesuppression of p53 in normal tissue may help alleviate the side-effects, but only in patientswith tumors that have lost p53 function.
27


Chapter 6
State-of-the-art Models andSimulations
I Model and Simulation of Restriction Point regulation
Novak and Tyson constructed a deterministic mathematical model for the regulation ofthe restriction point based on the Cyclin/CDK complexes, the Rb-E2F interaction and thesignal-transduction pathway, Growth Factors - Early response genes - Delayed responsegenes (GF-ERG-DRG) [3]. They assumed rapid message turnover for mRNA, that is,steady-state for mRNA transcription from the point of view of the other reactions, whichoccur in a longer timescale.The GF-ERG-DRG is a brief pathway resuming the MAPK signalling Cascade that trans-ducts extracellular signals through the cell’s membrane and across the cytosol, reachingthe nucleus and promoting the transcription of proteins. In this case, GF-ERG-DRG isgoing to be the triggering system that controls the CycD synthesis. CycD then binds toCDK4,6, also assumed to be fast enough to be in steady-state quickly, forming complexesCycD/CDK4,6 that phosphorylate Rb with the help of Cyclins A and B, inhibiting its actionon E2F inhibition, therefore releasing free E2F. PP1 phosphatase promotes the dephos-phorylation of Rb and is inhibited by CycE/CDK2, CycB/CDK1 and CycA/CDK2 complexes.CycE/CDK2 synthesis is in turn induced by E2F, and it can bind to Kip1, leading to theinhibition of CycE activity. This inhibiton by Kip1 is also applied to CycA. Kip1 degradationis mediated by CycB/CDK1 and CycA/CDK2. The former is mediated by Cdh1, that targetsCycB for degradation. CycB, along with APC, promotes the deactivation of Cdh1, thereforeestablishing a mutual antagonism. Finally PPX mediates the synthesis of an intermediaryenzyme, IE, whose phosphorylated form promotes the activation of CDC20. Active CDC20and APC induce the degradation of CycA.One of the most important features of this model is the growth and division simulation of thecell. The rate of mass is determined by the level of "General machinery", GM, controlled bythe concentration of Rb and the absence of growth factors.Using their model, they have simulated deregulations, such as cell lacking Rb, which
29
Mathematical models in cancer• 2017
caused the loss of cell volume, and the continuing of the cell cycle beyond the restrictionpoint. The model is an adaptation of their own yeast model, [4], to mammalian cells.
II Conradie Model and Simulation of Cell Cycle regulation
In the paper "Restriction Point Control of the Mammalian Cell Cycle via the CycE/CDK2/p27complex", [8], the authors constructed a new framework in the restriction point model ofNovak and Tyson, focusing on the CycE/CDK2/p27 complex. This model includes thedynamics of p27 and excludes the dynamics of Kip1 and Cyclins/Kip1 complexes. In thisway, protein p27 becomes the cyclins’ activity inhibitor – for every time p27 is active, thecyclins must be inactive. It does so by binding directly to the cyclins A,D,E complexes andkeeping them inactive for the appropriate time in the cell cycle.The changes in CycE/CDK2/p27 reactions lead to a shift in the restriction point, whichallowed the authors to conclude that a perturbation in the concentration of this complexmight cause the restriction point to happen earlier than expected.
III Kholodenko Model for the MAPK cascade pathway
The quantitative computational model done in [6] was performed around the MAPK cascadepathway, studying negative feedbacks, ultrasensitivity and emergent oscillations whichsimulate the nature of cellular biochemical pathways.In this model, MKKKK (Ras) phosphorylates MKKK (Raf) to MKKK-P (Raf-P). In turn,MKKK-P phosphorylates MKK (MEK) to MKK-P (MEK-P) and MKK-P to MKK-PP (MEK-PP) which, finally, phosphorylates the bottom layer of the cascade, i.e., MAPK (ERK) toMAPK-P (ERK-P) and MAPK-P to MAPK-PP (ERK-PP). In this model, MKKKK (Ras) isnot used as a variable, as its activity is simulated recurring to the negative feedback loopestablished by the downstream activity of ERK-PP. In this way, ERK-PP directly influencesthe concentration of MKKK (Raf).It makes use of Michaelis-Menten kinetics [45] as main rate functions.
30

Chapter 7
Updated Mathematical Model of theCell Cycle
The previous sections resumed the theory on which we based the construction of a widerupdated mathematical [Figure 7.1], compared to that of Novak and Tyson.In this new model, the MAPK signalling cascade was constructed as in [6], except forthe fact that active ERK acts upon Ras-GDP phosphorylation, promoting it, instead ofpromoting Raf phosphorylation. This way the cascade has in its structure the dynamics ofRas, and maintains the feedback loop, even though Kholodenko used ERK’s inuence onthe activation of Raf [2]. Indirectly, this is still the case, as ERK is activating Ras that inturn activates Raf. The purpose of this was to propagate the oscillations created by theERK feedback loop to Ras as well. Thanks to this, it was possible to add another negativefeedback, through the inclusion of GAP protein, whose transcription is induced by thecascade and whose inhibition on Ras-GTP decreases the flux of the cascade. The activityof the cascade culminates in the regulation of ERG, whose influence on DRG models thetranscription of CycD (see [3]).The PI3K-AKT pathway was build inside another negative feedback loop - the inhibitionof RTK by active mTORC1 against the activation of the latter by active Rheb. The jointconcentration of active and inactive mTORC1 is not considered constant, as there is contin-uous synthesis and degradation of active mTORC1 (see equations (46) and (57)). Activityof AKT includes the formation of PIP3/AKT complex and the synthesis of CycD, whichallows a simple connection to the cell cycle. There are several cross-talks between MAPKand PI3K-AKT pathways, and here we have focused only on two major influences actingupon PI3K-AKT pathway: activation of PI3K by active Ras and inhibition of TSC1/TSC2complex by active ERK.E2F promotes transcription of p14ARF, suggesting another obvious link between models.As for p53, its concentration is maintained low through normal cell cycle by inhibitioncaused by Hdm2. The Hdm2 protein is downregulated by Rb, CycE/Cdk2 complex andp14, following [21]. The apoptosis and cell cycle arrest events were added with the featuresof the software used for the simulations, COPASI [48]. This is explained in more detail in
31

Mathematical models in cancer• 2017
the next section (also, see notes on equations).We based the core of our model, that is, the regulation of the Cyclins, in [8].
I Units of concentrations
The time dimension frequently used in intra-cellular activities is the hour, even though somereactions take longer than others. Taking hour as the time unit, any reaction much fasterthan one hour (suppose a reaction of the order of seconds), can be seen as instantaneous,i.e., always in a steady state. For example, the time of messenger RNA (mRNA) turnover (passage from RNA to protein) is much faster than protein reactions time. Fromthe time perspective of protein reaction, mRNA keeps roughly the same concentrationthroughout time, and therefore d[mRNA]
dt ≈ 0, which does not really help much in the systemof differential equations unless the constant [mRNA] is used in a parameter somewhere inthe equations. However, in this thesis the parameters are calibrated according to previousmodels and not directly from real-life dynamics.To follow the modelling of Conradie (and also to be able to pick up the cell cycle modelfrom Tyson and Novak) we assumed the concentration variables are scaled in order tohave dimensionless Michaelis Menten parameters and rate constants with units hour−1 [5].The concentration units are in µM, where M = mol/L.
II Simulation of Healthy Cell
As in [3], we implement in the model the cell cycle division, regulated by mass, whoseconcentration drops to half periodically (see notes on equations), as shown in the thirdplot of Figure 7.2 (left to right, top to bottom). The mass is the indicator of the currentcell cycle phase. This is ought to depend on external factors, such as growth factors,but the whole simulation is going to be performed as if the healthy cell were in a stableenvironment, receiving periodical stimuli, and the cancer cell in a proper environment forits development. Therefore, we exclude external inputs for the model of both healthy andcancer cell, and can then focus on the internal regulation of cell. This takes us to thesecond link: ERG/DRG dynamics are an isolated system in Novak and Tyson model. As wediscussed in the MAPK Cascade section, ERG activity is induced by transcription factorsat the bottom of the MAPK Cascade, thus opening a hole in ERG/DRG isolation. For thesake of simplicity, we just assumed that the biphosphorylated form of ERK has a positiveimpact in ERG concentration. Inspired by Kholodenko [6], the model includes the MAPKcascade with a feedback created by the influence of active ERK on the phosphorylation ofRas-GDP. This establishes a loop around the MAPK cascade, generating one of the threesources of oscillation within this model - the others being the dynamics of CDC20 andCDH1 (second plot of Figure 7.2), and the negative feedback loop in PI3K-AKT pathway(fifth plot of Figure 7.2), which regulate the mass, which, in turn, regulates the cyclins (firstplot of Figure 7.2). The Rb and E2F dynamics function as expected, following the cell cycle(sixth plot of Figure 7.2).When it comes to the regulation of Hdm2, we assumed a constant flux of synthesis plus the
32
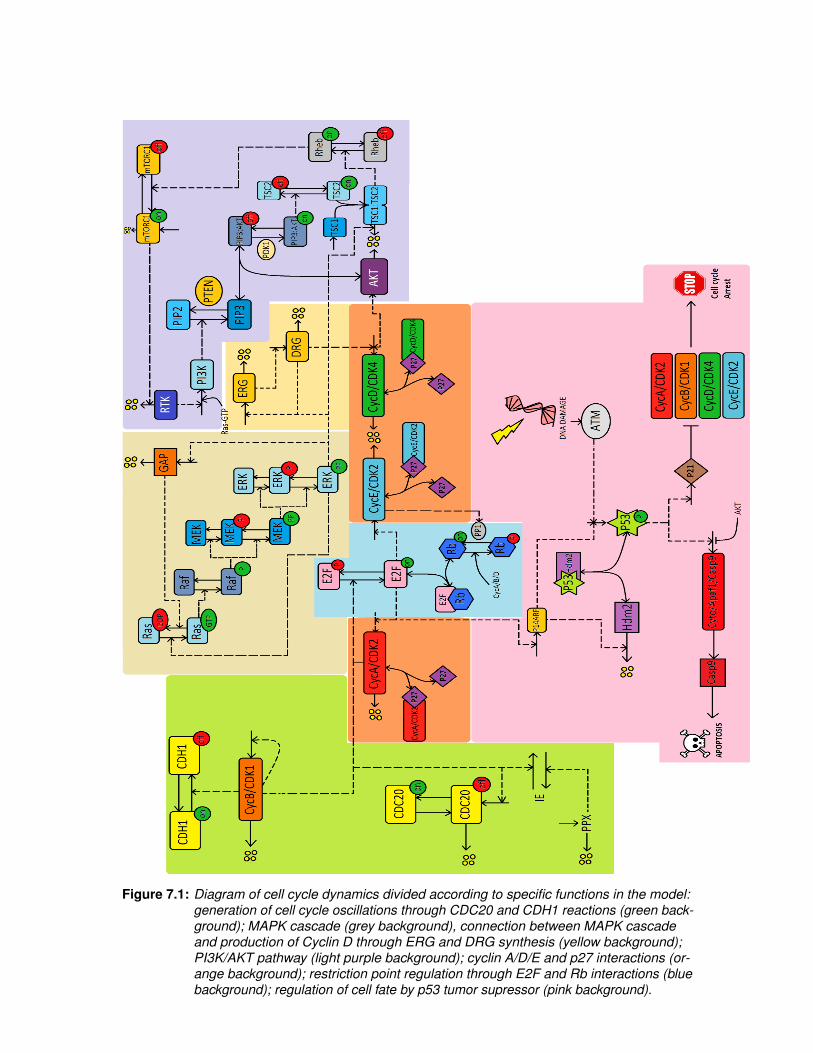
Figure 7.1: Diagram of cell cycle dynamics divided according to specific functions in the model:generation of cell cycle oscillations through CDC20 and CDH1 reactions (green back-ground); MAPK cascade (grey background), connection between MAPK cascadeand production of Cyclin D through ERG and DRG synthesis (yellow background);PI3K/AKT pathway (light purple background); cyclin A/D/E and p27 interactions (or-ange background); restriction point regulation through E2F and Rb interactions (bluebackground); regulation of cell fate by p53 tumor supressor (pink background).
Mathematical models in cancer• 2017
induction by phosphorylated p53. The flux of synthesis is larger than the dependency onphosphorylated p53. Here the tumor suppressor is playing the role of regulating apoptosisand cell cycle arrest. Its concentration is low when Hdm2 is present, binding directly to itand increasing the concentration of Hdm2/p53 complex.Simulating Cell Cycle Arrest implies a steady behaviour of cyclins concentration andcell volume for the time scale we are dealing with. It was therefore added a switch-likeparameter in the rate functions of cyclins, General Machinery, CDH1 and mass, regulatedby the condition of having a minimum amount of p21.The programmed cell death can be triggered in two ways: from within the cell or throughextracellular signals. Intracellular induction of apoptosis is the only one we concernedthis project about, and therefore the intracellular pathway is the mechanism on which thesimulation of apoptosis of the model is based on.For the simulation of intracellular induction of apoptosis, it was added the conditions onminimum amounts of ATM which, if crossed, will trigger the increase in p53 dependency ofCaspase-9. This induces a rapid construction of this protein, which will dismount the cellfrom within by degrading cyclins and leading the mass to zero in a switch-like way. Thiscontrol of apoptosis and cell cycle arrest can be seen as very simple Boolean system.All parameters in common to the mentioned models were maintained or only slightlychanged. New necessary parameters were chosen according to the desired oscillationoutput and links between pathways, i.e., to allow the concentrations to sustain negativeor positive feedback loops and at the same time establish smooth connections betweendistinct pathways of the cell cycle.Notice that ERG, DRG and ERK concentration’s order of magnitude is 100 times largerthan the other ones. This is allowed to happen as long as the reaction parameters areadjusted to the correct value, in order to avoid over-dosing the system’s reactions withthese species. It was simpler to adjust the parameters to the correct flow (synthesis rateand degradation rate) of reactions than to alter initial concentrations, since Kholodenko’smodel was not obeying the same scale as Conradie’s.As a final note on the simulations, the number of hours in the x-axis are based on theassumption that a whole cycle of a healthy cell takes roughly 12 hours.
34

Figure 7.2: Healthy cell simulations (details in text). Concentration unit: µM; Time unit: hour.

Chapter 8
Simulation of CommonDeregulations
After setting the model of a healthy cell, we can now proceed to simulate the cancer cell.Since cancer is a set of diseases rather than just one easily generalized disease, we willapproach this simulation in two different ways: first, making use of the relevant informationon MAPK cascade and PI3K/AKT pathway, on the p53 protein and its pathway, as well asthe Retinoblastoma protein and the E2F transcription factor, to execute alterations on themodel so as to simulate the beginning of a random cancer, which will deregulate some orseveral pathways. Second, starting in a specific type of cancer - colon cancer - we will alterthe relevant pathways to then proceed to logical therapies described in literature.
I MAPK cascade signalling pathway in cancer
As a first approach to simulate cancer, the MAPK cascade dynamics in the model werealtered, as it is a reasonable target for cancer study [7]. Starting by assuming mutated Rasor Raf proteins, such that its phosphorylating activity on Raf or MEK proteins, respectively,continues. For mutated Ras, the binding to GTP is still ongoing but the binding to GAPprotein and inactivation by active ERK ceases to be possible - and thus Ras dephospho-rylation form becomes rare in the cascade. For mutated Raf, the phosphorylation formbecomes dominant and therefore the oscillation effect inherited by the Ras stage of thecascade is lost due to this overactivation of Raf. Both inefficient Ras-GTP hydrolysis andinefficient Raf dephosphorylation result in the same deregulation of the ERG productionand therefore DRG as well [Figure 8.1]. The cyclins’ periodicity overall does not suffer fromthis change, except that of CycD, whose amplitude diminishes, as we see in [Figure 8.2].For severe dephosphorylation inhibition of both phosphorylated forms of ERK or severedephosphorylation inhibition of biphosphorylated MEK, the effect on ERG, DRG and CycDare the same as with deregulation induced by Ras or Raf mutations [Figure 8.1]. In otherwords, as shown in figure 8.1, the same downstream result is obtained in one or more of the
37

Mathematical models in cancer• 2017
above mentioned deregulations. The impact is not as strong for the analogous change onmonophosphorylated MEK forms [Figure 8.3]. Thus, according to this simulation, it seemsthat ERK, compared to MEK, is a more sensitive component in the MAPK cascade, sinceany type of dephosphorylation inhibition on ERK suffices to loose the oscillation, while withMEK only if the biphosphorylated form suffers from severe phosphorylation inhibition.A possible deregulation to explore in the MAPK cascade is the GAP synthesis, which in-hibits directly active Ras. Increasing the GAP-dependency in the inactivation of Ras (whichwas done by increasing the parameter kgap on equation (43)) and turning the productionof GAP faster at the same time yields an increase in the number of waves of the MAPKcascade components’ concentration [Figure 8.4] indicating a faster feedback. Since activeERK’s concentration drops at the bottom of the cascade, there is a subsequent inhibitionof the cell cycle, seen in Figure 8.5 (cyclins’ concentrations are bellow 0.5 µM, which isquite low compared to healthy behaviour [see first graphic of 7.2]). p27 complexes arealso affected by having its concentration frequency follow that of the MAPK cascade com-ponents (bottom graphic of Figure 8.6), in contrast to the healthy case (upper graphic of 8.6).
38
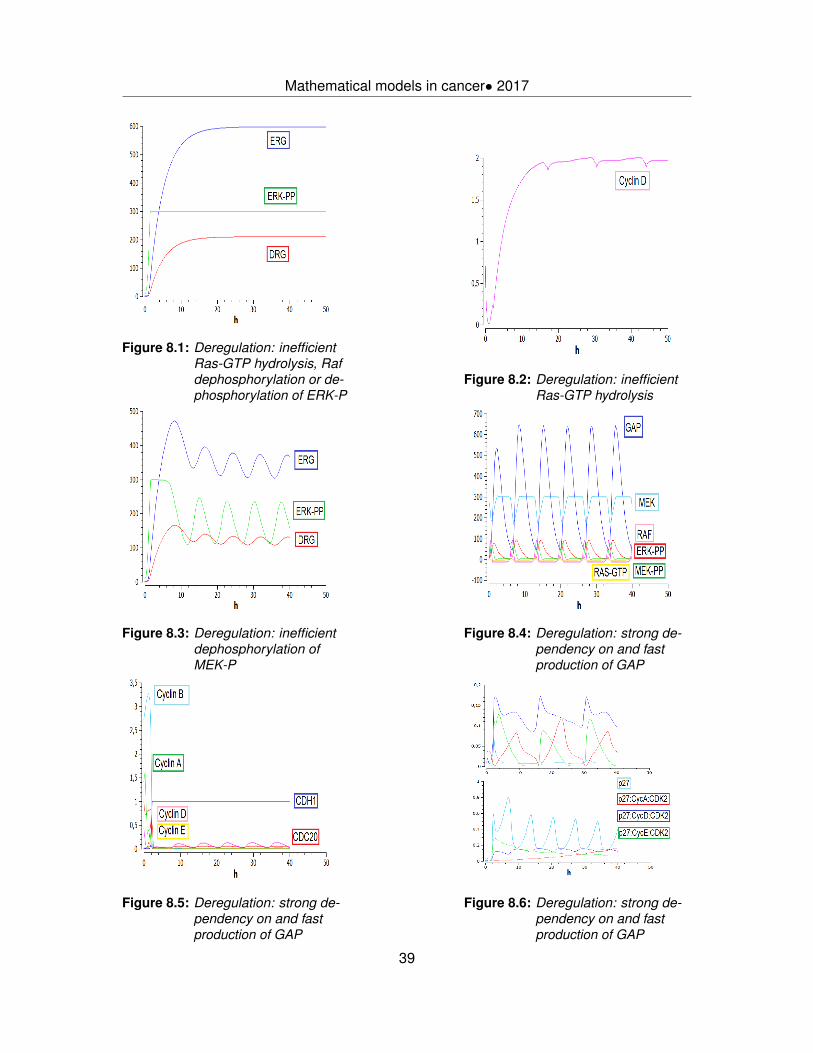
Mathematical models in cancer• 2017
Figure 8.1: Deregulation: inefficientRas-GTP hydrolysis, Rafdephosphorylation or de-phosphorylation of ERK-P
Figure 8.2: Deregulation: inefficientRas-GTP hydrolysis
Figure 8.3: Deregulation: inefficientdephosphorylation ofMEK-P
Figure 8.4: Deregulation: strong de-pendency on and fastproduction of GAP
Figure 8.5: Deregulation: strong de-pendency on and fastproduction of GAP
Figure 8.6: Deregulation: strong de-pendency on and fastproduction of GAP
39

Mathematical models in cancer• 2017
II PI3K/AKT pathway deregulations
The PI3K pathway is commonly altered in colon cancer [40]. PI3K enhancement andPTEN loss are just some of the common deregulations in this transduction pathway. AKThyperactivity is another possible deregulation.For PI3K overexpression, synthesis was enhanced, leading to an ever-increasing con-centration and loss of oscillation pattern in Rheb, mTORC1 and TSC1-2 concentrations[Figures 8.7-8.9]. Deregulations that are caused by the MAPK cascade, through cross-talks,are simulated in the colon cancer section below, due to their importance in this cancer.
Figure 8.7: PI3K overactivated
Figure 8.8: Healthy case (upperplot) and deregulation:overactivated-PI3K (bot-tom plot)
Figure 8.9: Healthy case (upperplot) and deregulation:overactivated-PI3K (bot-tom plot)
40

Mathematical models in cancer• 2017
III CDH1 deregulation
Complete loss of CDH1 is implicated in 84% of lobular breast cancer [26], which may implythat the presence of CDH1 is a strong factor against lobular breast cancer. In the model,in absence of CDH1, i.e., with no synthesis whatsoever of CDH1, the wave length of thecycles in CDC20, the cyclins, p27 complexes, E2F and p14ARF are shortened (first fourplots of Figure 8.10). As the mass only engages in division whenever CDH1 concentrationssurpasses a certain threshold, the overall volume of the cell increases with no type ofregulation (sixth plot of Figure 8.10). Although it may seem a positive feature of a deficient-CDH1 cell not having auto-induced division, like in cancer cells, this only happens dueto the lack of cancer cell mechanism to induce its own division in this model. One canimagine that after CDH1 is removed completely from the cell, cell division is guided byanother pathway, that is, a pathway which does not depend on CDH1 concentration norCDC20 synthesis to induce cell division. Another outcome of this simulation is that p53 isnot turned on (fifth plot of Figure 8.10), which means there is no apoptosis nor cell cyclearrest, and this combined with the already mentioned hidden cancerous mechanism forself-regulation of division becomes the perfect combination for the birth of a cancer cell.
IV Retinoblastoma mutation
If mutated, Rb can lose its ability to connect with E2F, not inhibiting its activity in proper timeduring the cell cycle, and consequently enabling E2F to migrate to the nucleus inducingthe motion to S-phase in the cycle, moving past the restriction point. To simulate this,the chemical reaction of active Rb binding to E2F forming the complex E2F:Rb was shutoff. This originated an increase in concentration of free E2F [Figure 8.11] and also ananticipation of the cell cycle, as the phase of the oscillation gets shifted [Figure 8.12],showing that the cell commits to an extra cell cycle earlier than in the healthy case, i.e., therestriction point was shifted. As a result of that, the general machinery does not have theproper time to build up, leading to an ever-decreasing mass in each cycle [Figure 8.13].It is important to highlight that a similar result to the one observed in figure 8.12 comes aboutfor alterations in the reactions p27 + CycE : cdk2 → p27 : CycE : cdk2 and p27 + CycE :cdk2← p27 : CycE : cdk2, as reported in [8].
41

Figure 8.10: Deregulation: CDH1 deficiency

Mathematical models in cancer• 2017
Figure 8.11: Deregulation: Rb-mutated cell
Figure 8.12: Deregulation: Rb-mutated cell
Figure 8.13: Deregulation: Rb-mutated cell
V P53 deregulated pathway
Any damage to the DNA is ought to induce the production of ATM, promoting p53 synthe-sis, which can trigger events for apoptosis or cell cycle arrest, the latter also involved ineventual repair mechanisms. If synthesis of p53 is deregulated, arising the appearance ofmutated forms of p53, the ability of the cell to induce apoptosis or cell cycle arrest might becompromised. If mutated p53 is not able to promote p21 synthesis or Caspase-9 synthesis,then the cell does not have any defense mechanism, and will eventually continue throughthe cycle, passing errors in DNA to the daughter-cells, leading to irreparable cases oftumorigenesis.To simulate this, the modifying role played by p53 in p21 and Caspase-9 synthesis was unin-tensified and the level of ATM was increased. The purpose is to simulate DNA damage in amutated p53 environment. The result is clear [Figures 8.14-8.16]: the cell could not proceedto cell cycle arrest nor apoptosis and therefore the division continued. The concentrationsof Hdm2 quickly reaches a constant level, since it has not enough supply of p53 to bind with.
43

Mathematical models in cancer• 2017
Figure 8.14: Deregulation: mutatedp53 such that it can nolonger activate p21 syn-thesis
Figure 8.15: Deregulation: mutatedp53 such that it canno longer activate Cas-pase9 synthesis
Figure 8.16: Deregulation: p53-mutated cell
44

Chapter 9
Colon Cancer Simulation
According to the World Cancer Research Fund International, colorectal cancer, or coloncancer, is the third most common type of cancer in the world and nearly 95% of colorectalcancers are adenocarcinomas, i.e., abnormal growth of epithelial tissue with glandularorigin [51]. The molecular pathways our model simulates, are reasonable targets for therapyof this type of cancer. The Ras/Raf/MEK/ERK cascade is deregulated in approximately30% of all cancers, Ras alone being mutated in 36% [42] and B-Raf (a specific type of Raf)found mutated in 10% to 15% of colorectal cancers [41]. The PI3K catalytic subunit alpha(PI3KCA) mutations are implicated in about 32% of colorectal cancers [42]. Hyperactivationof AKT has been linked to tumorigenic development, increasing cell survival, and wasproved to be vital for colon cancer stem cells [43]. The regulatory system of the cellcycle is also afflicted by Ras mutations, which come with raised ERK activity [42]. On theother hand, Raf inhibitors have shown to be promising in certain cancers, with clinicallymanageable effects [44].There is a correlation between colon cancer stages of progression and specific additionalmutations: a normal cell with loss of APC can lead to a small benign polyp, which, withk-Ras activation, can conduce the cell to a Class II adenoma. From this stage, if the cellsuffers loss of chromosome 18q gene, developing a Class III adenoma, and a subsequentloss of p53, it becomes a malignant carcinoma. From this last stage it can metastasize [1][2].
I Simulation of colon cancer
Ras hyperactivity in colon cancer was seen as a straight-forward approach. As in theprevious section on common deregulations, Ras dephosphorylation rate was diminishedsufficiently to affect the rest of the MAPK cascade and PI3K/AKT pathway. There is asubsequent over-activation of PI3K, leading to a fast increase and posterior stagnationof PI3K/AKT pathway active components in a high concentration level. DRG and ERGconcentrations frequency increase notoriously, following active ERK overactivation [Figure9.1]. This contributes to shorter wave-lengths on CDH1 and CDC20 concentrations [Figure
45

Mathematical models in cancer• 2017
9.2]. Hence the restriction point is overcome one more time than in healthy cell conditions.Uncontrolled division, yet, as mentioned previously, is not sufficient to create a cancercell, according to the hallmarks of cancer [39], and thus, Ras hyperactivity, along withP53 mutation, was performed in this simulation, in this way clearly avoiding the Booleanswitch of apoptosis or cell cycle arrest, generated by overproduced Caspase-9 or p21,respectively.AKT hyperactivity affects mainly PI3K/AKT pathway, and doesn’t seem to interfere withcyclins A,B and E, however it is still troublesome for it stimulates the overall production ofCycD. TSC1 and TSC2 inherit the hyperactivity and raise, losing oscillation, while PIP3lowers significantly and PIP3:AKT raises [Figure 9.3], both in active and inactive forms.PI3K, RTK and mTORC1 concentration’s amplitude increases. Cell cycle is advanced, aswith Ras activation [Figure 9.2].
Figure 9.1: Deregulation: hyperactive-Ras
Figure 9.2: Deregulation: hyperactive-Ras or hyperactive-AKT
Figure 9.3: Deregulation: hyperactive-AKT
46

Chapter 10
Breast Cancer Simulation
According to the World Cancer Research Fund International (WCRF), breast cancer is themost common cancer afflicting women worldwide and the second most common canceroverall. In 2012, nearly 1.7 million new cases were diagnosed [52]. These facts, as wellas the social impact of this disease, make this particular branch of cancer study a veryimportant topic. Breast cancer is defined as an uncontrolled growth and division of breasttissue. The normal regulation of the cancer cells that make up that anomalous tissue hasbeen corrupted at the level of their intra-molecular pathways.
I Simulation of breast cancer
Cell cycle main molecules have been linked to breast cancer in mutated forms or inabnormal concentrations, as we already discussed briefly in Cdh1 deregulation section.Cyclin D1 is overexpressed in many primary breast cancers [29] and it can lead, probablywith the help of other oncogenes, to the development of mammary carcinoma [32]. This isbecause Cyclin D engages in other cancerous activities within the cell other than binding toCdk4. This idea has been previously explored in 1994 [35]. Ras protein is often enhancedin breast cancer [29], [30], [31] which reveals a link to the MAPK cascade pathway. CyclinD1 is a target of estrogen signaling [29]. Estrogen in turn is a hormone which binds toreceptors in the cell membrane and promotes its growth and proliferation. About 70% ofbreast cancers, once established, rely on supplies of estrogen to grow, i.e., a tumor whosecells contain estrogen receptors (ER-positive), is fueled by estrogen supplies. This takes usto the study of the estrogen pathway [53]. Estrogen signaling pathway through the cell andinto the nucleus relies on MAPK cascade as well as PI3K/AKT pathway. The deregulationof the PI3K/AKT and MAPK pathways has been hypothesized to sustain a metabolic switch,turning the former on and the latter off in a vast majority of breast cancers [36]. Inhibitionof MAPK pathway shortens early G1, and activation of PI3K/AKT pathway induces the cellto progress to late G1, beyond the restriction point.The simulation was performed based on the synthesized information from this sectionon breast cancer. It was added a estrogen-driven growth mechanism with the power of
47

Mathematical models in cancer• 2017
Figure 10.1: MAPK cascade withestrogen-dependency
Figure 10.2: CDH1 and CDC20 inestrogen-dependent cellmodel
amplifying or reducing the cell volume rate. This was done by altering the synthesis rateof mass and that of Ras. Increasing the dependency on estrogen yields a faster volumeincrease [Figure 10.3] and shorter wave-lenghts in Cdh1, Cdc20 and MAPK cascadeoveral [Figures 10.1 and 10.2]. Assuming a stable cell growth, still estrogen-driven, theconcentration rate of Cyclin D and Ras were deregulated. Corrupting the synthesis of CyclinD by increasing its rate [Figure 10.6] as to create the impact of an unknown underlyingoncogene pathway, the result is also an increase in Cdh1 and Cdc20 wave frequency[Figure 10.4], an unfair but expectable amount of CyclinD:p27 complexes [Figure 10.5], andan ever-decreasing cell volume [Figure 10.7]. No significant differences were seen in thecomplete lack of p27 protein, besides the obvious vanishment of p27 complexes. Cyclinregulation continued, only ever-so-slightly "disamplified". Even in the presence of ATM,conducing to larger amounts of p21, complete lack of protein p27 didn’t seem to changethe cell cycle significantly.
48

Figure 10.3: Mass in estrogen-dependent cell model
Figure 10.4: CDH1 and CDC20 inoverexpressed-Cyclin Dcell
Figure 10.5: p27 complexes inoverexpressed-CyclinD cell
Figure 10.6: Cyclins regulation inoverexpressed-Cyclin Dcell

Figure 10.7: Mass in overexpressed-Cyclin D cell

Chapter 11
Therapies
The simulations performed wouldn’t fulfill their purpose if one couldn’t derive therapeuticalintervention from them. Specifically, from the results it is possible to extract ideas forbiomolecular-based therapies or, at least, to detect pre-cancerous cells.MAPK cascade pathway’s deregulation yields promising terrain for detecting possible cellcycle corruption: constant levels of active Ras, active Raf or active ERK can be measuredindirectly through ERG and DRG concentrations [Figure 8.1] or Cyclin D concentration[figure 8.2]; as the increase in GAP-dependency leads to cyclin inhibition [Figure 8.5],targeting GAP in a previously-identified cancer cell for its overexpression is a possible wayto inhibit cell growth.Complete loss of CDH1 consequently induces the cell to a faster passage through therestriction point, whose regulation is done by E2F/Rb dynamics, meaning that a possibletreatment for CDH1-deficient cells could be the artificial introduction of fair amounts of Rbor Rb-like biomolecules to create a delay that could ultimately compensate the fast pace ofS-phase commitment; the same idea could be applied to Rb-mutated cells, since there areno biomolecules to hold the transcription factor activities of E2F in those cases.Since p53 is mutated or its pathway is altered in virtually every cancer, therapies directlyturned towards its activity in the cell could imply groundbreaking approaches to fight cancer.The pathway described in the model presented in this paper is not complex enough to allowone to easily derive therapies, but still some appear naturally: adding p53-like biomoleculesto a p53-deficient cell, inducing p21 or Caspase-9 synthesis in cancerous cell or eventargeting Hdm2 for destruction to indirectly increase the concentration of p53 are just some,rather simplistic, approaches. However, p53 pathway is not target-like, being extremelydifficult to derive practical therapies from its deregulation.It is also useful to make use of the altered model to find consequences of ideal therapies.With this in perspective, some simulation of therapies were performed, based in the commonderegulation in colon cancer explored in previous sections. For Ras hyperactivation, MEKand Raf inhibition yield similar results, although the inhibitions were performed in differentintensities: strong inhibition of Raf or inhibition of MEK induces cell cycle arrest without useof the p53 defense mechanism, starting with CDH1 and CDC20 stability [Figure 11.1]. The
51

Mathematical models in cancer• 2017
cell signalling transduction ceases to operate, leading to stagnation of CycD production,and adding the arrest of CDH1 and CDC20, the cycle stops [Figure 11.2]. For this samederegulation, ERK inhibition treatment delays cell cycle [Figures 11.3 and 11.4], althoughnot restoring completely MAPK cascade feedback [Figure 11.5] and leading to fasterstationarity in PI3K/AKT dynamics. The delay seems to help increase the mass of thecell [Figure 11.6], since the first cell cycle takes longer to occur and the mass reacheshigher values in the same period. As for PI3K inhibition, it does not seem very promisingfor Ras hyperactivity, because the cell cycle continues unharmed, even though PI3K/AKTcomponents take longer to reach stationarity.Even though these results seem promising, notice that a qualitative analysis would allowus to test the robustness of the model regarding therapy, by stretching the parametersin determined ranges to check how wide is the therapy effect. This because the model’sparameters should be different for different patients, cell types and/or cancer types.
Figure 11.1: Deregulation:hyperactive-Ras; Treat-ment: strong Raf inhibi-tion or MEK inhibition.
Figure 11.2: Deregulation:hyperactive-Ras; Treat-ment: strong Raf inhibi-tion or MEK inhibition.
Figure 11.3: Deregulation:hyperactive-Ras; Treat-ment: ERK inhibition.
Figure 11.4: Deregulation:hyperactive-Ras; Treat-ment: ERK inhibition.
52

Mathematical models in cancer• 2017
Figure 11.5: Deregulation:hyperactive-Ras; Treat-ment: ERK inhibition.
Figure 11.6: Deregulation:hyperactive-Ras; Treat-ment: ERK inhibition.
53


Conclusion
After the analysis of the contents of this thesis and the work in developing it, the conclusionsdrawn can be expressed in the following major topics:
First, the ease with which one can apply mathematics to real-life phenomena is indu-bitably one of the features that has made applied mathematics such a valuable field.Specifically, deriving systems of differential equations to model a network of chemicalreactions occurring within a cell, has revealed to be simple enough under certain assump-tions, in contrast with the difficulty of actually setting the reactions network in the firstplace. The main struggle in the development of this thesis was in fact the assembling ofthe knowledge in the fields of biology, biochemistry and oncology, to create a trustworthymodel. These models’ simulations run very fast in an ordinary PC, which is an advantagefor any enthusiast in modelling. This is partially thanks to the existence of software likeCOPASI that allows to treat numeric and efficiently systems of differential equations. Theother main reason why these simulations don’t require much memory to run, is becausethe system is not very large, even though it can model fairly well important phenomena.For systems of partial differential equations, for which one can account space as anothervariable, the amount of information being processed is larger, resulting in time consumingsimulations, despite the fact that these models are usually more accurate.
Second, creating extensions of already existing models can be a cumbersome experi-ence, however it is a reliable method to create new models instead of building them fromscratch. The model in the core of this thesis is still a simple model of the cell cycle, but italready begins dealing with cancer paradigms, and it was set in an easy-to-understandmanner, which could help future researchers to expand it or enhance it according to morerecent literature.
Third, many of the simulations results, reported in this thesis, mimic the most relevantand the most validated characteristics of statistical data extracted from many importantin vivo or in vitro experiments, and clinical trials. This meaning that we did the effort tokeep focus in the most corroborated results from literature. During the development of thisthesis, it happen more often than not to be confronted with information that, even thoughpromising, lacked support. In a few cases, information gathered from different sources wascontradictory. However, these experiments are being updated everyday and faster thanever, which makes it particularly hard to be up-to-date.
55

Mathematical models in cancer• 2017
The ideas for therapies explored in chapter 11 are only reasonable in a theoreticalpoint of view, as time did not allow for further validation of the proposed treatments. Thesimulation of ideal target treatments for the specific case of Ras-hyperactivation alreadyshow that the model behaves as desired, inducing cell cycle arrest or regulating the cell.
In this thesis, we have began what can be later on the foundations of a system of partialdifferential equations model to simulate more accurately not only the cell but also a tissueof cells, bringing into the equations inter-cell interactions and eventually even simulate thecore mechanism of metastasis. The simple equations of our model can easily be updatedto match new information from in vivo or in vitro experiments.
56

Further work and investigation
The model presented in this thesis, even though it can already fit some of the experimentalobservations in literature, is extremely simplistic. For this reason it is important to mentionapproaches to construct a wider and more robust model of the cell and perhaps of cell-cellinteraction.To extrapolate the paradigm of the cell cycle used in this thesis to a wider model, morebiomolecular species could be added, such as PCNA, CDC25, AP-1, c-fos, c-jun, myc andeven ATP. This not only would require deeper understanding of how these species interactand influence the cell cycle, but also a careful examination of eventual groups of otherbiomolecules that couldn’t be ignored by adding these new ones. It is also a risky move, asthe complexity begins to increase fast with each new specie added.
Another idea is to explore more than one dimension. Instead of analyzing the concen-tration of molecules throughout time, space can also be part of the analysis. Space canbe viewed with one, two or three dimensions, depending on the level accuracy we desireand the amount of work we are willing to do. The complexity of constructing such a modelobviously increases with the number of spatial dimensions added. With one time dimensionand one spatial dimension, we could already study the distance of each molecule to thenucleus of the cell, for example, while the cell cycle progresses. With one time dimensionand two spatial dimensions it is possible to evaluate the proximity of each species to otherorganelles, such as the mitochondria, the Golgi apparatus and the endoplasmatic reticulum.Adding a third spatial dimension might be too much.The units considered for concentration of intra-cellular molecules is usually 1
12 of theCarbon-12 atom in ground state, Dalton (Da), and not µM as it was used in this thesis andas previous authors used. Study appropriate concentration units (or checking if the onesused are the most reasonable) is also something to take into account in further work.Detailed study of the most used target therapies should be a first step to begin deriving newtarget therapies to interact with the cell’s biomolecular pathways. It is not only chemother-apy that could be a good field of research. Also radiotherapy and nanotechnology could betaken into account when modelling. Radiotherapy would be useful for a model that alreadyaccounts for cell-to-cell interactions. Nanotechnology is a field that is constructing veryspecific target therapies, and this is obviously an advantage to use in these mathematicalmodels.By constructing inter-cell models, it is already possible to simulate the activity of the body’simmune system in attempts to stop tumor progression. A tumor can be simulated with avariety of heterogeneous cells (which in these types means each cell is deregulated with a
57

Mathematical models in cancer• 2017
pathology (or several) from a wide spectrum of possibilities) and immunitary system’s cellscan be simulated indirectly by inhibiting some of the cell’s tumors (the ones with the higherproportion of antigens in their membranes for example).Cancer stem cells is another realm of possibilities in modelling that may not have beenproperly explored yet. In a tumor, these cells are less differentiated than their pairs and arethe most dangerous, as they are the ones that are able to colonize and originate a newtumor in case of metastization.
58

System of differential equations forhealthy cell model
d[Cdc20]dt
=k13(−[Cdc20] + [”inactiveCdc20”])[”phosphorylatedIEP”]
J13 − [Cdc20] + [”inactiveCdc20”]− k14[Cdc20]
J14 + [Cdc20]
−k12[Cdc20] (1)
d[Cdh1]dt
=(k’
3 + k3[Cdc20])(1− [Chd1])1 + J3 − [Cdh1]
− V4CycleArrest[Cdh1]J4 + [Cdh1]
(2)
d[CycA]
dt= k25r[p27 : CycA : Cdk2] + V6[p27 : CycA : Cdk2] + εk29CycleArrest[mass][E2F]
−k25[CycA][p27]− k25[CycA][Kip1]− k25r − k30[Cdc20][CycA] (3)
d[CycB]dt
= εCycleArrest
k1’ +k1[CycB]2
J12(1 + [CycB]2
J12)
−V2[CycB] (4)
d[CycD]
dt= V6[p27 : CycD : Cdk2]− k10[CycD] + εCycleArrestk9[DRG] + kakt[AKT]
−k24[CycD][p27] + k24r[p27 : CycD : Cdk2]− k24[CycD][Kip1]
+k24r[CycD : Kip1] + V6[CycD : Kip1] + k10[CycD : Kip1] (5)
d[CycE]dt
= k25r[p27 : CycE : Cdk2]−V8[CycE] + V6[p27 : CycE : Cdk2] + ε(k7’ + k7[E2F])
−k25[CycE][p27]− k25[CycE][Kip1] + k25r[CycE : Kip1] + V6[CycE : Kip1]
+V8[CycE : Kip1] (6)
d[DRG]
dt= ε
k17[DRG]2
J172(1 + [DRG]2
J172 )
+ k17’[ERG]
− k18[DRG] (7)
d[E2F]dt
= k20(λA[CycA] + λB[CycB] + λD([P27 : CycD : Cdk2] + [CycD]) + λE[CycE])[E2F : Rb]
+k26r[E2F : Rb]− (k’23 + k23([CycA] + [CycB]))[E2F]
+k22[”phosphorylatedE2F”]− k26[E2F][Rb] (8)
d[E2F : Rb]dt
= k26[E2F][Rb] + k22[”phosphorylatedE2F : Rb”]
−k20(λA[CycA] + λB[CycB] + λD([p27 : CycD : Cdk2] + [CycD]) (9)
59

Mathematical models in cancer• 2017
+λE[CycE])[E2F : Rb]− k26r[E2F : Rb]− (k’23
+k23([CycA] + [CycB])[E2F : Rb]
d[ERG]
dt=
[ERG]kERK[”ERK− PP”]kk34 + [ERG]
+εk15
1 + [DRG]2
J152
− k16[ERG] (10)
d[GM]
dt= CycleArrestk27[mass]r31switch− k28[GM] (11)
d[Rb_hypo]dt
= k20(λA[CycA] + λB[CycB] + λD([p27 : CycD : Cdk2] + [CycD])
+λE[CycE])([E2F : Rb] + [”phosphorylatedE2F : Rb”] + [Rb])
−(k19PP1A + k19’(PP1T − PP1A))[Rbhypo] (12)
d[”inactiveCdc20”]dt
= ε(k11’ + k11[CycB])− k12[”inactiveCdc20”] (13)
d[mass]dt
= ε · CycleArrest · DeathSwitch ρ[GM] (14)
d[p27]dt
= (k25r + V8)[p27 : CycE : Cdk2] + (k25r + k30[Cdc20])
·[p27 : CycA : Cdk2] + (k10 + k24r)[p27 : CycD : Cdk2]
−(V6 + k25([CycE] + [CycA]) + k24r[CycD])[p27] + εk5 (15)
d[p27 : CycA : Cdk2]dt
= k25[CycA][p27]− (k25r + V6 + k30[Cdc20])[p27 : CycA : Cdk2] (16)
d[p27 : CycD : Cdk2]dt
= k24[CycD][p27]− (V6 + k10 + k24r)[p27 : CycD : Cdk2] (17)
d[p27 : CycE : Cdk2]dt
= k25[CycE][p27]− (k25r + V6 + V8)[p27 : CycE : Cdk2] (18)
d[”phosphorylatedE2F”]dt
= (k20(λA[CycA] + λB[CycB] + λD([p27 : CycD : Cdk2] + [CycD])
+λE[CycE] + k26r))[”phosphorylatedE2F : Rb”] (19)
+k′23 + k23([CycA] + [CycB])[E2F]
−(k22 + k26[Rb])[”phosphorylatedE2F”]
d[”phosphorylatedE2F : Rb”]dt
= −k20(λA[CycA] + λB[CycB] + λD([p27 : CycD : Cdk2] + [CycD])
+λE[CycE]− (k26r + k22))[”phosphorylatedE2F : Rb”] (20)
+k26[”phosphorylatedE2F”][Rb]
+(k′23 + k23([CycA] + [CycB]))[E2F : Rb]
d[”phosphorylatedIEP”]dt
=k31[CycB](1− [”phosphorylatedIEP”])
1 + J31 − [”phosphorylatedIEP”]
− k32[PPX]([”phosphorylatedIEP])J32 + [”phosphorylatedIEP”]
(21)
d[PPX]
dt= εk33 − k34[PPx] (22)
60

Mathematical models in cancer• 2017
d[Rb]dt
= −(k20(λA[CycA] + λB[CycB] + λD([p27 : CycD : Cdk2] + [CycD])
+λE[CycE] + k26r))[Rb] + (k19PP1A + k19’(PP1T − PP1A))[Rb_hypo]
+k26r[E2F : Rb]− k26[E2F][Rb] + k26r[”phosphorylatedE2F : Rb”]
−k26[”phosphorylatedE2F”][Rb] (23)
d[Kip1]dt
= εk5 −V6[Kip1]− k24[CycD][Kip1] + k24r[CycD : Kip1]
+k10[CycD : Kip1] +−k25[Kip1]([CycE] + [CycA])
k25r([CycE : Kip1] + [CycA : Kip1]) + V8[CycE : Kip1]
+k30[Cdc20][CycA : Kip1]− ((k25([CycA] + [CycE]) + k24[CycD])[Kip1]
−k25r([CycA : Kip1] + [CycE : Kip1])− k24r[CycD : Kip1]
−V6([CycA : Kip1] + [CycD : Kip1] + [CycE : Kip1])
−k30[Cdc20][CycA : Kip1]−V8[CycE : Kip1]− k10[CycD : Kip1]) (24)
d[CycA : Kip1]dt
= k25[CycA][Kip1]− k25r[CycA : Kip1]−V6[CycA : Kip1]
−k30[Cdc20][CycA : Kip1] (25)
d[CycE : Kip1]dt
= k25[CycE][Kip1]− k25r[CycE : Kip1]
−V6[CycE : Kip1]−V8[CycE : Kip1] (26)
d[CycD : Kip1]dt
= k24[CycD][Kip1]− k24r[CycD : Kip1]−
V6[CycD : Kip1]− k10[CycD : Kip1] (27)
d[Hdm2]dt
= k37[”p53− P”] + k38 − (kp14[p14ARF] + kRb[Rbhypo]
+kcycE[CycE])−(
k39[Hdm2][”p53− P”]− k40[p53 : Hdm2]kk1 + [p53 : Hdm2]
)(28)
d[p14ARF]dt
= k41([E2F]− [p14ARF]) (29)
d[GAP]dt
= kERK[”ERK− PP”]− k42[GAP] (30)
d[”p53− P”]dt
= K43[ATM]− k39[Hdm2][”p53− P”] +k40[p53 : Hdm2]
kk2 + [p53 : Hdm2](31)
d[p53 : Hdm2]dt
= k39[Hdm2][”p53− P”] +k40[p53 : Hdm2]
kk2 + [p53 : Hdm2](32)
d[p21]dt
=k44[”p53− P”]
k45 + [”p53− P”]+
k46[PIP33 : AKT_On]kk3 + [PIP3 : AKT_On]
− k47[p21] (33)
d[CytoC : Apa f 1 : Caspase9]dt
= ”Caspase9 f lux”[”p53− P”]
61

Mathematical models in cancer• 2017
−k48[AKT][CytoC : Apa f 1 : Caspase9] (34)
d[Ra f ]dt
=k49[”Ra f − P”]
kk4 + [”Ra f − P”]− k50[”Ras− GTP”][Ra f ]
kk4 + [Ra f ](35)
d[”Ra f − P”]dt
=k50[”Ras− GTP”][Ra f ]
kk4 + [Ra f ]− k49[”Ras− GTP”][Ra f ]
kk4 + [Ra f ](36)
d[MEK]dt
=k51[”MEK− P”]
kk5 + [”MEK− P”]− k52[”Ra f − P”][MEK]
kk5 + [MEK](37)
d[”MEK− P”]dt
=k52[”Ra f − P”][MEK]
kk5 + [MEK]− k52[”Ra f − P”][”MEK− P”]
kk5 + [”MEK− P”]
+k51[”MEK− PP”]
kk5 + [”MEK− PP”]− k6[”MEK− P”]
kk15 + [”MEK− P”](38)
d[”MEK− PP”]dt
=k52[”Ra f − P”][”MEK− P”]
kk5 + [”MEK− P”]− k51[”MEK− PP”]
kk5 + [”MEK− PP”](39)
d[ERK]dt
=k53[”ERK− PP”]
kk5 + [”ERK− P”]− k52[”MEK− PP”][ERK]
kk5 + [ERK](40)
d[”ERK− PP”]dt
=k52[”MEK− PP”][”ERK− P”]
kk5 + [”ERK− P”]− k53[”ERK− PP”]
kk5 + [”ERK− PP”](41)
d[”Ras− GDP”]dt
= kgap[GAP] +k54[”Ras− GTP”]
kk6 + [”Ras− GTP”]
−
kmass[mass] +k55[”Ras− GDP”](
1 +([”ERK−PP”]
ki
)n)(k56 + [”Ras− GDP”])
(42)
d[”Ras− GTP”]dt
= kmass[mass] +k55[”Ras− GDP”]
(1 + ( [”ERK−PP”]ki )n)(k56 + [”Ras− GDP”])
−(kgap[GAP] +k54[”Ras− GTP”]
kk6 + [”Ras− GTP”]) (43)
d[RTK]dt
= k57 − k58[RTK]− k59[RTK][mTORC1][RTK] + kk7
(44)
d[PI3K]dt
=kRas[”Ras− GTP”][PI3K]
kk8 + [PI3K]− k60[PI3K]
kk8 + [PI3K](45)
d[mTORC1]dt
=k61[mTORC1_O f f ][Rheb_On]
kk8 + [mTORC1_O f f ]+
V3PI3K(1− [mTORC1])kk8− [mTORC1] + 1
− k62[mTORC1]kk8 + [mTORC1]
− k63[mTORC1]kk9 + [mTORC1]
(46)
d[PIP2]dt
=k63[PI3K][PTEN]
kk9 + [PIP3]− k63[PI3K][PIP2]
kk9 + [PIP2](47)
d[PIP3]dt
=k63[PI3K][PIP2]
kk9 + [PIP2]
+k64[PI3K : AKT_O f f ]− k63[PIP3][PTEN]
kk9 + [PIP3]− k65[PIP3][AKT] (48)
62

Mathematical models in cancer• 2017
d[PIP3 : AKT_O f f ]dt
= k65[PIP3][AKT]− k64[PI3K : AKT_O f f ]−
k63[PDK1][PIP3 : AKT_O f f ]kk9 + [PIP3 : AKT_O f f ]
+k63[PIP3 : AKT_On]
kk9 + [PIP3 : AKT_On](49)
d[PIP3 : AKT_On]dt
=k63[PDK1][PIP3 : AKT_O f f ]
kk9 + [PIP3 : AKT_O f f ]− k63[PIP3 : AKT_On]
kk9 + [PIP3 : AKT_on](50)
d[TSC2_O f f ]dt
=k66[”ERK− PP”][TSC2_On]
kk9 + [”ERK− PP”]− k64[PIP3 : AKT_On][TSC2_On]
kk9 + [TSC2_On]
− k64[TSC2_O f f ]kk9 + [TSC2_O f f ]
(51)
d[TSC2On]dt
=k64[TSC2_O f f ]
kk9 + [TSC2_O f f ]+
k67[”ERK− PP”][TSC1 : 2]kk9 + [”ERK− PP”]
− k66[”ERK− PP”][TSC2_On]kk9 + [”ERK− PP”]
− k64[PIP3 : AKT_On][TSC2_On]kk9 + [TSC2_On]
−k67[TSC1][TSC2_On] (52)
d[TSC1]dt
= k68 +k67[”ERK− PP”][TSC1 : 2]
kk9 + [”ERK− PP”]− k67[TSC1][TSC2_On]
−k68[TSC1] (53)
d[TSC1 : 2]dt
= k67[TSC1][TSC2_On]− k67[”ERK− PP”][TSC1 : 2]kk9 + [”ERK− PP”]
(54)
d[RhebO f f ]dt
=k69[TSC1 : 2][Rheb_On]
kk9 + [Rheb_On]− k70[Rheb_O f f ]
kk9 + [Rheb_O f f ](55)
d[Rheb_On]dt
=k70[Rheb_O f f ]
kk9 + [Rheb_O f f ]− k69[TSC1 : 2][Rheb_On]
kk9 + [Rheb_On](56)
d[mTORC1_O f f ]dt
=k64[mTORC1]
kk9 + [mTORC1]− k64[mTORC1_O f f ]
− k68[mTORC1_O f f ][Rheb_On]kk9 + [mTORC1_O f f ]
(57)
d[AKT]dt
= k71 − k72[PIP3][AKT]− k73[AKT] + k64[PIP3 : AKT_O f f ] (58)
d[PDK1]dt
= k67(1− [PDK1]) (59)
d[PTEN]
dt= K74(1− [PTEN]) (60)
Steady-state equations
PP1A =[PP1T]
1 + K21(φE([CycE] + [CycA]) + φB[CycB])(61)
V2 = k′2(1− [CDH1]) + k2[CDH1] + k′′2 [Cdc20] (62)
V4 = k4(γA[CycA] + γB[CycB]) (63)
63

Mathematical models in cancer• 2017
V6 = k’6 + k6(ηE[CycE] + ηA[CycA] + ηB[CycB]) (64)
V8 = k′8k8(ψE([CycE] + [CycA]) + ψB[CycB])
J8 + [CYCET](65)
CYCET = [CycE : Kip1] + [CycE : Kip1] + [CycE] (66)
CYCDT = [CycD : Kip1] + [p27 : CycD : Cdk2] + [CycD] (67)
CYCAT = [p27 : CycA : Cdk2] + [CycA] + [CycA : Kip1] (68)
P27T = [p27 : CycA : Cdk2] + [p27 : CycD : cdk2] + [p27 : CycE : Cdk2] + [p27] (69)
V1PI3K =[RTK]VM1PI3K[RTK] + kcPI3K
(70)
V3PI3K = [PI3K]VM3PI3K (71)
Notes on Equations:
(1) The mass of the cell drops to half, [mass] → [mass]/2, every time [Cdh1] crosses0.2 from bellow.(2) To simulate cell cycle arrest, whenever [p21] > 20, [CDH1] = [GM] = [CycA] =[CycB] = [CycD] = [CycE] = 0. To do so, CycleArrest binary parameter was put inequations:
CycleArrest =
0, if [p21] > 201, in all other cases
(3) As an event to prepare apoptosis, whenever [ATM] > 20, the synthesis rate of Caspase-9 increases with "Caspase9 flux" parameter:
”Caspase9 f lux” =
5, if [Cyto : Apa f 1 : Caspase9] > 10 and [ATM] > 2010, if [ATM] > 20
(4) To simulate apoptosis, whenever [Cyto : Apa f 1 : Caspase9] > 10 and [ATM] > 20,[mass] = [GM] = 0, using DeathSwitch:
DeathSwitch =
0, if [Cyto : Apa f 1 : Caspase9] > 10 and [ATM] > 201, in all other cases
(5) The same assumptions done in [3] were used in this system. The parameter r31switchworks as a two steps Heaviside function:
r31switch =
1, if [Rb]+[E2F_Rb]+[”phosphorylatedE2F:Rb”]
[Rb_hypo]+[Rb]+[E2F:Rb]+[”phosphorylatedE2F:Rb”] < 0.8
0, in all other cases
Parameters:
64

Mathematical models in cancer• 2017
n = 1, k1 = 0.6, k’1 = 0.1, k3 = 140, k’
3 = 7.5, k5 = 20, k6 = 100, k’6 = 10, k7 = 0.6,
k’7 = 0, k8 = 2, k’
8 = 0.1, k9 = 0.05, k10 = 5, K10 = 3.8, k11 = 1.5, k’11 = 0, k12 = 1.5,
k13 = 5, k14 = 2.5, k15 = 0.25, k16 = 0.25, k17 = 10, k’17 = 3.5, k18 = 10, k19 = 20, k’
19 = 25,k20 = 10, k22 = 1, k23 = 1, k’
23 = 0.005, k24 = 1000, k24r = 10, k25 = 1000, k25r = 10,k26 = 10000, k26r = 200, k27 = 0.2, k29 = 0.05, k30 = 20, k31 = 0.7, k32 = 1.8, k33 = 0.05,k34 = 0.05, k35 = 5000, k36 = 10, k37 = 25, k38 = 2, k39 = 1, k40 = 0.5, k41 = 0.1, k42 = 1,k43 = 5, k44 = 100, k45 = 10, k46 = 10, k47 = 1, k48 = 0.1, k49 = 50, k50 = 100, k51 = 77.75,k52 = 2.855, k53 = 53, k54 = 1000, k55 = 1000, k56 = 10, k57 = 1, k58 = 0.5, k59 = 0.82,k60 = 0.15, k61 = 0.01, k62 = 1, k63 = 10, k64 = 0.5, k65 = 2, k66 = 0.7, k67 = 5, k68 = 0.1,k69 = 12, k70 = 4, k71 = 0.1, k72 = 2, k73 = 0.4, k74 = 1, ki = 9, kAKT = 0.5, kerk = 0.5,kgap = 0.1, kCycE = 0.3, kp14 = 0.3, kRas = 0.6, kRb = 0.3, kk = 1, kk1 = 5, kk2 = 5,kk3 = 10, kk4 = 15, kk5 = 15, kk6 = 8, kk7 = 0.2, kk8 = 0.005, kk9 = 0.05, J1 = 0.1,J3 = 0.01, J4 = 0.005, J8 = 0.1, J13 = 0.005, J14 = 0.005, J15 = 0.1, J17 = 0.3, J31 = 0.01,J32 = 0.01, ε = 1, λA = 3, λB = 5, λD = 3.3, λE = 5, ψE = 10, ψB = 0.5, µE = 0.5,µA = 0.5, µB = 0.1, PP1T = 1.
65


Glossary
14-3-3sigma is a human protein encoded by the SFN (stratifin) gene.AKT is a protein kinase that plays a key role in glucose metabolism, apoptosis, cell
proliferation, transcription and cell migration.Allele is the short form of allelomorph (other form) used in genetics to describe variant
forms of a gene detected with different phenotypes.Allosteric regulation is the regulation of an enzyme by binding an effector molecule at a site other than the
enzyme’s active site. The site to which the effector binds is termed the allosteric site.Allosteric sites allow effectors to bind to the protein, often resulting in a conformationalchange involving protein dynamics.
Angiogenesis is the physiological process through which new blood vessels form from pre-existingvessel.
AP-1 (activator protein 1) is a transcription factor that regulates gene expression in re-sponse to a variety of stimuli, including growth factors, stress, and bacterial and viralinfections.
Apaf-1 (Apoptotic protease activating factor 1) is a gene that encodes a cytoplasmic proteinthat forms one of the central hubs in the apoptosis regulatory network.
APC (Amino Acid-Polyamine-Organocation) is a family of transport proteins.Apoptosis (from Ancient Greek "falling off") is a process of programmed cell death that occurs
in multicellular organisms.ATM (ataxia-telangiectasia mutated) is a serine/threonine protein kinase that is recruited
and activated by DNA double-strand breaks. It phosphorylates several key proteinsthat initiate activation of the DNA damage checkpoint, leading to cell cycle arrest,DNA repair or apoptosis.
ATP (adenosine triphosphate) is a nucleoside and is a small molecule used in cells as acoenzyme. It is often referred to as the "molecular unit of currency" of intracellularenergy transfer.
Carcinogenesis or oncogenesis or tumorigenesis is the formation of a cancer, whereby normal cellsare transformed into cancer cells.
Caspase cysteine-aspartic proteases, cysteine aspartases or cysteine-dependent aspartate-directed proteases) are a family of protease enzymes playing essential roles inprogrammed cell death and inflammation.
Caspase-9 is an initiator caspase encoded by the CASP9 gene.c-fos is a human proto-oncogene.c-jun is a protein that in humans is encoded by the JUN gene. c-Jun in combination with
c-Fos, forms the AP-1 early response transcription factor.
67

Mathematical models in cancer• 2017
CDC2 (cell division cycle protein 2) is a highly conserved protein that has important functionsin cell cycle regulation. It is also known as CDK1.
CDC20 (cell-division cycle protein 20) is an essential regulator of cell division that is encodedby the CDC20 gene in humans.
CDC25 (cell-division cycle protein 25) is a dual-specificity phosphatase.CDH1 (Cadherin-1 or E-cadherin) is a protein that in humans is encoded by the CDH1 gene.
It is a tumor suppressor gene.Chromosome is a DNA molecule with part or all of the genome of an organism.
Cyclin is a biomolecule that controls the progression of cells through the cell cycle byactivating cyclin-dependent kinase enzymes.
Cyclin A is a cyclin that activates CDK2.Cyclin B is a cyclin that activates CDK1.Cyclin D is a cyclin that activates CDK4 and CDK6. Growth factors stimulate the Ras/Raf/ERK
that induce cyclin D production.Cyclin E is a cyclin that activates CDK2.
CDK (cyclin-dependent kinases) are a family of protein kinases involved in regulatingtranscription and mRNA processing.
CDK1 (cyclin-dependent kinase 1)is a highly conserved protein that has important functionsin cell cycle regulation. It is also known as CDC2.
CDK2 (cell division protein kinase 2) is an enzyme that in humans is encoded by the CDK2gene.
CDK4/6 (cell division protein kinase 4 and cell division protein kinase 6, respectively), are twoenzymes that in humans are encoded by the CDK4 and CDK6 gene, respectively.
Checkpoints are control mechanisms in eukaryotic cells which ensure proper division of the cell.CKI (cyclin-dependent kinase inhibitor protein) is a protein which inhibits cyclin-dependent
kinase.Cytochrome c is a small human protein encoded by CYCS gene.
Cytosolic domain is the part of a transmembrane protein in interaction with the cytosol (cytoplasm) ofthe cell.
Cytotoxicity is the quality of being toxic to cells.Coenzyme is a non-protein chemical compound or metallic ion that is required for a protein’s
biological activity to happen (for example, coenzymes such as ATP).Degradation is the breakdown of proteins into smaller polypeptides or amino acids, also called
proteolysis. It is typically catalysed by cellular enzymes.DNA (deoxyribonucleic acid) is a molecule that carries the genetic instructions used in the
growth, development, functioning and reproduction of all known living organisms andmany viruses.
DRG (delayed-response genes) are genes which are activated at a slower rate than ERG.E2F (E2 promoter binding factor) is a group of genes that codifies a family of transcription
factors in higher eukaryotes.Enzyme is a macromolecular biological catalyst.
ERG (early-response genes) are genes which are activated rapidly in response to a widevariety of cellular stimuli.
ERK is a protein kinase widely expressed in intracellular signalling pathways.
68

Mathematical models in cancer• 2017
Eukariotic is any organism whose cells have a nucleus and other organelles enclosed withinmembranes.
Gadd45 (Growth Arrest and DNA Damage) is a protein implicated as stress sensors thatmodulate the response of mammalian cells to several types of stress, and modulatetumor formation.
GAP (GTPase-activating proteins) are a family of regulatory proteins whose members canbind to activated G proteins (proteins with the ability to bind GTP) and down regulatetheir activity
Genome is the genetic material of an organism.Genotype is a DNA sequence which determines a specific characteristic (phenotype) of a
cell/organism/individual.GRB2 (Growth factor receptor-bound protein 2) is an adaptor protein involved in signal
transduction/cell communication. In humans, the GRB2 protein is encoded by theGRB2 gene.
Growth factor is a naturally occurring substance capable of stimulating cellular growth proliferation,healing, and cellular differentiation. Usually it is a protein or a steroid hormone.
Hdm2 is a protein that in humans is encoded by the MDM2 gene. Since MDM2 meansMouse double minute 2 homolog, the human analog is sometimes refered to asHdm2.
Kinase is an enzyme that catalyzes the transfer of phosphate groups from high-energy,phosphate-donating molecules to specific substrates.
Lymphocyte is one of the subtypes of white blood cell in a vertebrate’s immune system.MAPK (mitogen-activated protein kinase) is a type of protein kinase that is specific to the
amino acids serine, threonine, and tyrosine.MEK (mitogen-activated protein kinase kinase (MAPKK)) is a kinase enzyme which phos-
phorylates mitogen-activated protein kinase (MAPK).Mole is the unit of measurement in the International System of Units (SI) for amount of
substance. 1 mole is expressed by the Avogadro constant, which has a value of6.022× 1023.
mTOR1 (mechanistic target of rapamycin 1) is a serine/threonine kinase mTOR which can in-hibit the mechanistic target of rapamycin. It is a downstream effector of the PI3K/AKTpathway.
Myc (from "myelocytomatosis virus")is a regulator gene that codes for a transcriptionfactor.
Oncogene is a gene related to the appearance of tumors. Usually, when not working properly,due to mutation for example, they can transform a healty cell into a cancer cell.
p14ARF (alternate reading frame protein 14) is a protein induced in response to elevatedmitogenic stimulation. It acts as a tumor suppressor by inhibiting initiating p53-dependent cell cycle arrest or apoptosis.
p16INK4a is a tumor suppressor protein, that in humans is encoded by the CDKN2A gene.p53 tumor protein, also known as TP53, is any isoform of a protein encoded by TP53
gene.PCNA (proliferating cell nuclear antigen) is a DNA clamp essential for replication.
Phenotype is the composite of an organism’s observable characteristics or traits.
69

Mathematical models in cancer• 2017
Phosphorylation is the addition of a phosphoryl group (PO3)− to a molecule.PI3K (Phosphatidylinositol-4,5-bisphosphate 3-kinase) are a family of enzymes involved in
cellular functions such as cell growth, proliferation, differentiation, motility, survivaland intracellular trafficking.
PIP2 (Phosphatidylinositol 4,5-bisphosphate) is a minor phospholipid component of cellmembranes.
PIP3 (Phosphatidylinositol (3,4,5)-trisphosphate) is a phospholipid that resides on theplasma membrane.
PP1 (protein phosphatase 1) belongs to a certain class of phosphatases known as proteinserine/ threonine phosphatases.
Prokariotic is a unicellular organism that lacks a membrane-bound nucleus (karyon), mitochon-dria, or any other membrane-bound organelle.
Protein are large biomolecules, or macromolecules, consisting of one or more long chains ofamino acid residues.
Proto-oncogene is a normal gene that could become an oncogene due to mutations or increasedexpression.
Raf (mitogen-activated protein kinase kinase kinase (MAPKKK)) is a kinase enzymewhich phosphorylates mitogen-activated protein kinase kinase (MAPKK).
Ras (mitogen-activated protein kinase kinase kinase kinase (MAPKKKK)) is a kinaseenzyme which phosphorylates mitogen-activated protein kinase kinase kinase (MAP-KKK).
Rb (retinoblastoma protein) is a tumor suppressor protein that is dysfunctional in severalmajor cancers.
Rheb (Ras homolog enriched in brain) is a GTP-binding protein that is ubiquitously ex-pressed in humans and other mammals.
RNA (ribonucleic acid) is a polymeric molecule essential in various biological roles incoding, decoding, regulation, and expression of genes.
RTK (receptor tyrosine kinases) are the high-affinity cell surface receptors for manypolypeptide growth factors, cytokines, and hormones.
SBML (Systems Biology Markup Language) is a representation format, based on XML(Extensible Markup Language), for communicating and storing computational modelsof biological processes.
SOS (son of sevenless) refers to a set of genes encoding guanine nucleotide exchangefactors that act on the Ras family of small GTPases.
Synthesis is the execution of one or more named reactions to obtain a product, or severalproducts.
Transcription factor is a protein that controls the rate of transcription of genetic information from DNA tomessenger RNA, by binding to a specific DNA sequence.
TSC1 (tuberous sclerosis complex 1) is a protein that in humans is encoded by the TSC1gene.
TSC2 (tuberous sclerosis complex 2) is a protein that in humans is encoded by the TSC2gene.
Tumor suppressor gene are genes that code for fundamental proteins in the defense of a cell against tumordevelopment. When this gene mutates causing a loss or reduction in its function, the
70

Mathematical models in cancer• 2017
cell can progress to cancer, usually in combination with other genetic changes.Ubiquitin is a small regulatory protein which can signal proteins for degradation, alter their
cellular location, affect their activity, and promote or prevent protein interactions.Ubiquitination is the addition of ubiquitin regulatory protein to a substrate protein.
71


Bibliography
[1] Robert A. Weinberg. The Biology of Cancer. Garland Science; 2 edition, 2013.
[2] Lauren Pecorino. Molecular Biology of Cancer: Mechanisms, Targets, and Therapeu-tics. OUP Oxford; 4 edition, 2016.
[3] Béla Novák, John J. Tyson, 2004. A model for restriction point control of the mam-malian cell cycle. Journal of Theoretical Biology 230, 563-579.
[4] Chen. K.C., Csikask-Nagy, A., Gyorffy, B., Val, J., Novak, B., Tyson, J.J., 2000. Kineticanalysis of a molecular model of the budding yeast cell cycle. Mol. Biol. Cell 11,369-391.
[5] Chen, Katherine C., et al. 2004. Integrative analysis of cell cycle control in buddingyeast. Molecular biology of the cell 15.8: 3841-3862.
[6] Boris N. Kholodenko, 2000. Negative feedback and ultrasensitivity can bring aboutoscillations in the mitogen-activated protein kinase cascades. Eur. J. Biochem. 267,1583-1588.
[7] AS Dhillon, S Hagan and W Kolch. 2007 MAP kinase signalling pathways in cancer.Oncogene 26, 3279-3290.
[8] Riaan Conradie, Frank J. Bruggeman, Andrea Ciliberto, Attila Csikász-Nagy, BélaNovák, Hans V. Wsterhoff, Jacky L. Snoep, 2009. Restriction point control of themammalian cell cycle via the cyclin E/Cdk2:p27 complex. FEBS Journal 277, 357-367.
[9] Charles J. Sherr, Frank McCormick, 2002. The RB and p53 pathways in cancer.Cancer Cell 2, 103-12
[10] Alberts B, Johnson A, Lewis J, et al. Molecular Biology of the Cell. 4th edition. NewYork: Garland Science; 2002.
[11] Zatterberg, A., Larsson, O., 1995. Cell cycle progression and growth in mammaliancells: kinetic aspects of transition events. In: Hutchison, C., Glover, D.M. (Eds.), CellCycle Control. Oxford University Press, Oxford, pp. 206-227.
[12] Peña, C., García, J.M., Silva, J., García, V., Rodríguez, R., Alonso, I., Millán, I., Salas,C., de Herreros, A.G., Muñoz, A., Bonilla, F. Hum. Mol. Genet. 2005, E-cadherin and
73

Mathematical models in cancer• 2017
vitamin D receptor regulation by SNAIL and ZEB1 in colon cancer: clinicopathologicalcorrelations. Hum Mol Genet, 14(22):3361-70
[13] Kress M, May E, Cassingena R, May P. 1979, Simian virus 40-transformed cellsexpress new species of proteins precipitable by anti-simian virus 40 tumor serum.Virol J 31: 472-483
[14] Lane DP, Crawford LV. 1979, T antigen is bound to a host protein in SV40-transformedcells. Nature 278: 261-263
[15] Linzer DI, Levine AJ. 1979, Characterization of a 54K dalton cellular SV40 tumorantigen present in SV40-transformed cells and uninfected embryonal carcinoma cells.Cell 17: 43-52
[16] DeLeo AB, Jay G, Appella E, Dubois GC, Law LW, Old LJ. 1979 Detection of atransformation-related antigen in chemically induced sarcomas and other transformedcells of the mouse. Proc Natl Acad Sci USA 76: 2420-2424
[17] Baker SJ et al. 1989 Chromosome 17 deletions and p53 gene mutations in colorectalcarcinomas. Science 244: 217-221
[18] Takahashi T, Nau MM, Chiba I, Birrer MJ, Rosenberg RK, Vinocour M, Levitt M, PassH, Gazdar AF, Minna JD (1989) p53: a frequent target for genetic abnormalities inlung cancer. Science 246: 491-494
[19] Momand J., Zambetti GP, Olson DC, George D., Levine AJ. 1992, The mdm-2 onco-gene product forms a complex with the p53 protein and inhibits p53-mediated transac-tivation. Cell 69(7):1237-45
[20] Picksley SM, Lane DP. 1993, The p53-mdm2 autoregulatory feedback loop: aparadigm for the regulation of growth control by p53? Bioessays 15(10):689-90
[21] Sandra L. Harris, Arnold J. Levine, 2005. The p53 pathway: positive and negativefeedback loops. Oncogene 24: 2899-2908
[22] Meloche S., Pouysségur J. 2007, The ERK1/2 mitogen-activated protein kinasepathway as a master regulator of the G1 to S-phase transition. Oncogene 26(22):3227-39
[23] Ameyar, M; Wisniewska, M; Weitzman, JB. 2003, A role for AP-1 in apoptosis: thecase for and against.. Biochimie. 85 (8): 747-52.
[24] Jin, Hongchuan et al. Epigenetic Silencing of a Ca2+-Regulated Ras GTPase-Activating Protein RASAL Defines a New Mechanism of Ras Activation in HumanCancers. Proceedings of the National Academy of Sciences of the United States ofAmerica. 2007, 104: 12353-12358.
[25] Orton RJ, Sturm OE, Vyshemirsky V, Calder M, Gilbert DR, Kolch W (Dec 2005).Computational modelling of the receptor-tyrosine-kinase-activated MAPK pathway.The Biochemical Journal. 392 (Pt 2): 249-61
74

Mathematical models in cancer• 2017
[26] De Leeuw WJ; et al. 1997. Simultaneous loss of E-cadherin and catenins in invasivelobular breast cancer and lobular carcinoma in situ. J Pathol. 183 (4): 404-411.
[27] Orton RJ, Sturm OE, Vyshemirsky V, Calder M, Gilbert DR, Kolch W (Dec 2005).Computational modelling of the receptor-tyrosine-kinase-activated MAPK pathway.The Biochemical Journal. 392 (Pt 2), 249-61
[28] Christoph Wagener, Carol Stocking, Oliver Müller, "Cancer Signaling: From MolecularBiology to Targeted Therapy". Wiley VCH, 2016.
[29] C. Elizabeth Caldon, Roger J. Daly, Robert L. Sutherland, and Elizabeth A. Musgrove,2006, Cell Cycle Control in Breast Cancer Cells, Journal of Cellular Biochemistry97:261-274
[30] Malaney S, Daly RJ. 2001. The ras signaling pathway in mammary tumorigenesis andmetastasis. J Mammary Gland Biol Neoplasia 6:101-113.
[31] Schlessinger J. 2000. Cell signaling by receptor tyrosine kinases. Cell 103:211-225.
[32] Sutherland RL, Musgrove EA. 2004. Cyclins and breast cancer. J Mammary GlandBiol Neoplasia 9:95-104
[33] Musgrove EA, Davison EA, Ormandy CJ. 2004. Role of the CDK inhibitor p27 (Kip1) inmammary development and carcinogenesis: Insights from knockout mice. J MammaryGland Biol Neoplasia 9:55-66.
[34] Bearss DJ, Lee RJ, Troyer DA, Pestell RG, Windle JJ. 2002. Differential effects ofp21(WAF1/CIP1) deficiency on MMTV-ras and MMTV-myc mammary tumor properties.Cancer Res 62:2077-2084.
[35] Musgrove EA, Lee CS, Buckley MF, Sutherland RL. Cyclin D1 induction in breastcancer cells shortens G1 and is sufficient for cells arrested in G1 to complete thecell cycle. Proceedings of the National Academy of Sciences of the United States ofAmerica. 1994;91(17):8022-8026.
[36] Arnaud Guille, Max Chaffanet and Daniel Birnbaum, 2013, Signaling pathway switchin breast cancer, Cancer Cell International, 13:66
[37] Fresno Vara JA1, Casado E, de Castro J, Cejas P, Belda-Iniesta C, González-BarónM., 2004, PI3K/Akt signalling pathway and cancer. Apr;30(2):193-204
[38] Camillo Porta,1, Chiara Paglino, and Alessandra Mosca, 2014, TargetingPI3K/Akt/mTOR Signaling in Cancer, Front Oncol. 2014; 4: 64
[39] Hanahan D1, Weinberg RA., 2000, The hallmarks of cancer. Cell. 2000 Jan7;100(1):57-70.
[40] Cathomas G. PIK3CA in Colorectal Cancer. Frontiers in Oncology. 2014;4:35.doi:10.3389/fonc.2014.00035.
75

Mathematical models in cancer• 2017
[41] Corcoran RB, Ebi H, Turke AB, et al. EGFR-mediated re-activation of MAPK signalingcontributes to insensitivity of BRAF mutant colorectal cancers to RAF inhibition withvemurafenib. Cancer discovery. 2012;2(3):227-235.
[42] Jing Yuan Fang, Bruce C Richardson, 2005. The MAPK signalling pathways andcolorectal cancer . Lancet Oncol2005; 6: 322-27
[43] Y.K.Wang, Y.L.Zhu, F.M.Qiu, T.Zhang, Z.G.Chen, S.Zheng and J.Huang. Activationof Akt and MAPK pathways enhances the tumorigenicity of CD1331 primary coloncancer cells.Carcinogenesis vol.31 no.8 pp.1376-1380, 2010
[44] Libero Santarpia, Scott M Lippman and Adel K El-Naggar, 2012. Targeting the MAPK-RAS-RAF signaling pathway in cancer therapy, Expert Opinion on Therapeutic Targets,16:1, 103-119
[45] L. Michaelis and Miss Maud L. Menten, 1913. The Kinetics of Invertase Action,translated by Roger S. Goody and Kenneth A. Johnson. Biochemistry, 2011, 50 (39),pp 8264-8269
[46] Rb: https://www.ncbi.nlm.nih.gov/gene/5925
[47] Conradie BioModels: https://www.ebi.ac.uk/biomodels-main/BIOMD0000000265
[48] Software used in simulations: http://copasi.org/About/Team/
[49] p53: http://www.bioinformatics.org/p53/introduction.html
[50] Schuler, Martin, et al. "p53 induces apoptosis by caspase activation through mi-tochondrial cytochrome c release." Journal of Biological Chemistry 275.10 (2000):7337-7342.
[51] Colon cancer: http://www.wcrf.org/int/cancer-facts-figures/data-specific-cancers/colorectal-cancer-statistics
[52] Breast cancer: http://www.wcrf.org/int/cancer-facts-figures/data-specific-cancers/breast-cancer-statistics
[53] Estrogen pathway: http://www.sabiosciences.com/pathway.php?sn=Estrogen_Pathway
[54] Apoptosome, Cytochrome c and apaf-1: https://en.wikipedia.org/wiki/Apoptosome
[55] Hill equation generalization proof: https://en.wikipedia.org/wiki/Hill_equation_(biochemistry)#cite_note-:0-6
76


![Mathematical Modelling Cancer Cell Invasion of Tissue: [0.5ex] …people.bu.edu/andasari/files/PosterDurham.pdf · 2014-08-07 · Mathematical Modelling Cancer Cell Invasion of Tissue:](https://img.dokumen.tips/doc/110x75/5f0492497e708231d40ea130/mathematical-modelling-cancer-cell-invasion-of-tissue-05ex-2014-08-07-mathematical.jpg)