Embed Size (px)
Citation preview
MATHEMATICA
ECONOMIC ANALYSIS OF THE
SPACE SHUTTLE SYSTEM
Prepared for
National Aeronautics and Space Administration
Washington, D.C. 20546
g. go 77•(NASA-CR-129570) ECONOMIC ANALYSIS OFTHE SPACE SHUTTLE SYSTEM: EXECUTIVESUMMARY (Mathematica, Inc.) 31 Jan. 197263 p CSCL 05C Unclas
G3/34 48629wNe21
EXECUTIVE SUMMARY
Reproduced by
NATIONAL TECHNICALINFORMATION SERVICE
U S Department of Commerce_ Springfield VA 22151
/t' zz
https://ntrs.nasa.gov/search.jsp?R=19730005253 2018-07-30T09:01:32+00:00Z
ECONOMIC ANALYSIS OF THE
SPACE SHUTTLE SYSTEM
EXECUTIVE SUMMARY
Study directed by
Klaus P. Heissand
Oskar Morgenstern
for the
National Aeronautics and Space Administration
under Contract NASW - 2081
January 31, 1972
4-.
ACKNOWLEDGEMENTS
The Report on Economic Analysis of the Space Shuttle System
has been prepared for the National Aeronautics and Space Administration
under Contract NASW-2081 dated June 4, 1970 by the Advanced Technology
Economics Group at MATHEMATICA, Inc. during the past seven months.
Dr. Klaus P. Heiss, Director of Advanced Technology Eco.nomics
and Dr. Oskar Morgenstern, Chairman of the Board of MATHEMATICA, Inc.
have been fully responsible for the overall conception, approach and imple-
mentation of the economic analysis of the Space Shuttle System.
The Space Shuttle Study Group included also the following members:
Dr. Kan Young, who contributed Chapter 7.0 on macro and micro-
economic considerations affecting the Space Shuttle System decision.
Edward Greenblat, who contributed Chapter 8.0 and was responsible
for the running of the benefit-cost evaluation programs developed by the Space
Shuttle Study Group.
J. Preston Layton and his technical work group who contributed
Chapters 4. 0 and 5. 0, the technical description of satellite payloads as well as
space transportation vehicles.
Martin Wagner, who contributed Chapter 6.0 of this report on
launch vehicle and payload costs.
The economic advisory group included also Dr. David Bradford,
Dr. William Baumol and Dr. Roland Shephard.
The report also benefitted from the advice and guidance of
Dr. Courtland D. Perkins, a member of our Technical Advisory Group.

OUTLINE
EXECUTIVE SUMMARY
Page
CONCLUSIONS
THE ECONOMIC WORTH OF A SPACE SHUTTLE SYSTEM
0.2. 1 Results of the May 31, 1971 Analysis
0. 2, 2 Updated Economic Results on the EconomicWorth of A Space Shuttle System
THE MOST ECONOMIC SPACE SHUTTLE CONFIGURATION
0. 3. 1 The Objectives of a Reusable Space Transporta-tion System (STS)
0. 3. 2 Space Transportation Systems Considered
0. 3. 3 Results of the Economic Analysis on AlternativeSpace Shuttle Systems
FUNDING CONSTRAINTS: THE DEVELOPMENT OF THESPACE SHUTTLE SYSTEM AND THE PROJECTED BUDGETFOR NASA
0-1
0-2
0-2
0 - 6
0-16
0-17
0-18
0-24
0-34
0-i
0. 1
0. 2
0. 3
0. 4

LIST OF FIGURES
Figure Page
0. 1 Results of May 31, 1971 Economic Study 0-3
0.2 Space Shuttle and Tug/Estimated Total Non-RecurringCost (Billions of 1970 Dollars) RDT&E and Investment(5 Vehicles Each) 0-10
0. 3 The Economic Benefits of a Space Shuttle System 0-12
0.4 Expected Benefits and Costs of a TAOS Space ShuttleSystem 0- 15
0.5 Recurring Costs (Per Flight) vs. Non-Recurring Costsof Alternate Configurations, September 1971 Data 0-21
0. 6 Recurring Costs (Per Flight) vs. Non-Recurring Costsof Alternate Configurations, November 3, 1971 Data 0-22
0. 7 Recurring Costs (Per Flight) vs. Non-Recurring Costsof Alternate Configurations, December 15, 1971 Data 0-23
0.8 Cost-Effective Space Shuttle Systems Defined by ExpectedNon-Recurring & Recurring Cost Estimates 0-25
0. 9 Economic Trade-off Function for Space Shuttle Systemwith 514 Shuttle Flight Space Program (1979-1990) and624 Shuttle Flight Space Program 0-28
0. 10 Economic Trade-off Function for Space Shuttle Systemwhen Social Rate of Discount is Varied from 10% to 5%and 15% (514 Shuttle Flight Space Program) 0-29
0. 11 Economic Trade-off Function for Space Shuttle Systemwhen Payload Reuse and Refurbishment Costs are Variedfrom 30% to 50% (expected: 39%) 0-31
0. 12 Space Program Costs for 1979-1990 Operations with andwithout Space Shuttle Development (TAOS-Configuration,Reduced Mission Model-514) 0-41
0. 3 Net Space Program Cost Differences for 1979-1990Operations Space Shuttle System vs. New ExpendableSystem (TAOS Configuration, Reduced Mission Model-514) 0-42
0. 14 Macro-Econometric Budget Projections, 1972-1980 Level 0-49
0-ii
0. 15 Impact of TAOS Shuttle Development when Net CostDifference is Added to Projected NASA Budget for 1972-1980Period 0-51
0. 16 Impact of TAOS Shuttle Development when Net CostDifference is Added to Projected NASA Budget for 1972-1980Period 0-52
0. 17 Impact of TAOS Shuttle Development when Net CostDifference is Financed within Projected NASA Budget for1972-1980 Period 0-53
0.18 Impact of TAOS Shuttle Development when Net CostDifference is Financed within Projected NASA Budget for1972-1980 Period 0-54
0 - iii

LIST OF TABLES
Table Page
0. 1 Space Transportation Systems Cost Summary 0-8
0.2 Life Cycle Cost Summary, Data, Scenario 32 - TypicalTAOS and TUG, 1979 IOC Current Expendable System(Millions of Undiscounted 1970 Dollars) 0-35
0.3 Life Cycle Cost Summary Data, Scenario 32 - TypicalTAOS and TUG , 1979 IOC, New Expendable System(Millions of Undiscounted 1970 Dollars) 0-36
0.4 Life Cycle Cost Summary Data, Scenario 32 - TypicalTAOS and TUG, 1979 IOC, Space Shuttle System,(Millions of Undiscounted 1970 Dollars) 0-37
0.5 Total Funding Requirements Under Alternative STS,and Differences for 1979-1990 U.S. Space Program (NASAand DoD), (Millions of Undiscounted 1970 Dollars) 0-40
0. 6 Impact of Space Shuttle Development on NASA Budgetor Activities, 1972-1980 (In Billions of Undiscounted1970 Dollars) 0-48
O-iv

0. 1 CONCLUSIONS
The major conclusions of the Economic Analysis of the Space Shuttle
System are:
o THE DEVELOPMENT OF A SPACE SHUTTLE SYSTEM IS
ECONOMICALLY FEASIBLE ASSUMING A LEVEL OF
SPACE ACTIVITY EQUAL TO THE AVERAGE OF THE
UNITED STATES UNMANNED PROGRAM OF THE LAST
EIGHT YEARS.
o A THRUST ASSISTED ORBITER SHUTTLE (TAOS) WITH
EXTERNAL HYDROGEN/OXYGEN TANKS IS THE ECONOMI-
CALLY PREFERRED CHOICE AMONG THE MANY SPACE
SHUTTLE CONFIGURATIONS SO FAR INVESTIGATED.
EARLY EXAMPLES OF SUCH CONCEPTS ARE RATO OF
MCDONNELL DOUGLAS, TAHO OF GRUMMAN-BOEING, AND
SIMILAR CONCEPTS STUDIED BY NORTH AMERICAN ROCK-
WELL AND LMSC - LOCKHEED; THESE CONCEPTS ARE NOW
COMMONLY KNOWN AS ROCKET ASSISTED ORBITERS (RAO).
o THE CHOICE OF THRUST ASSIST FOR THE ORBITER SHUTTLE
IS STILL OPEN. THE MAIN ECONOMIC ALTERNATIVES ARE
PRESSURE FED BOOSTERS AND SOLID ROCKET MOTORS,
EITHER USING PARALLEL BURN. A THIRD ECONOMIC
ALTERNATIVE TO THESE VERSIONS IS TO USE SERIES
BURN BOOSTERS.
These conclusions are based on the following results of the economic
analysis:
. 0-1
0.2 THE ECONOMIC WORTH OF A SPACE SHUTTLE SYSTEM
0. 2. 1 Results of the May 31, 1971 Analysis
The major findings of the economic analysis of new Space Trans-
portation Systems reported on May 31, 1971, which were prepared for the
National Aeronautics and Space Administration, are concerned with the analy-
sis of the economic value of a reusable Space Transportation System without
any particular concern as to which, among the many alternative Space Shuttle
Systems would, in the end, be identified as the most economic system.
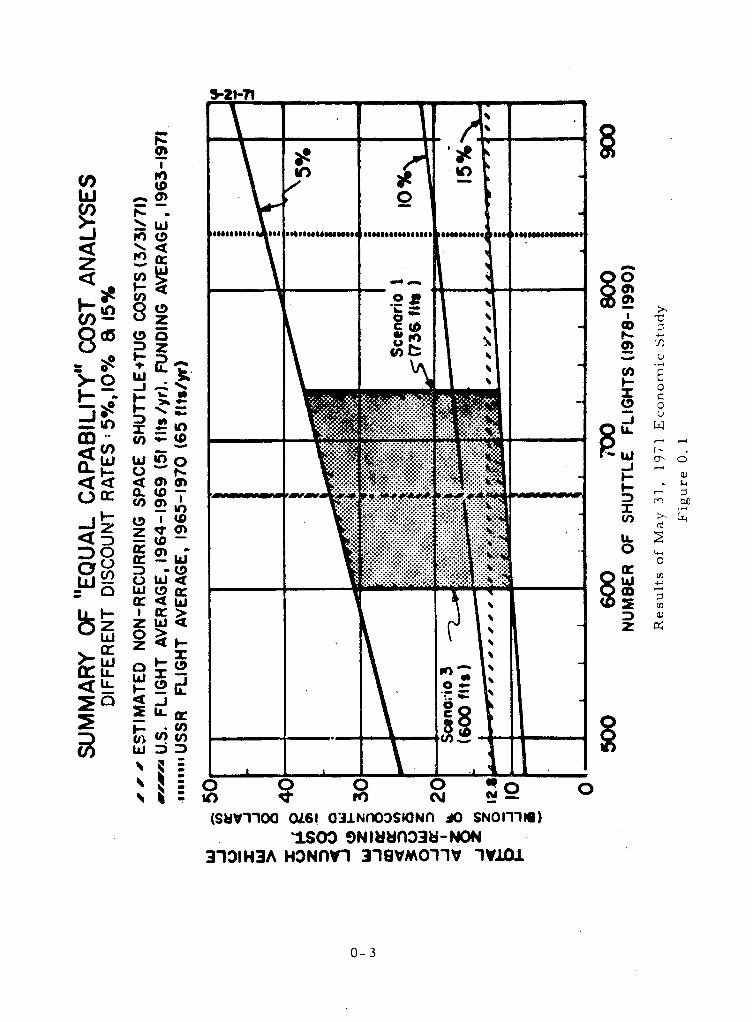
Figure 0. 1 shows the summary of the major results of the May 31,
1971 analysis. In this analysis we report only the results of the "Equal
Capability" Analyses, the most conservative approach to evaluate new tech-
nologies. "Equal Budget" analyses were also performed and those calculations
give even more favorable economic results (see also May 31, 1971 analysis).
On the horizontal axis the numbers of Space Shuttle flights between 1978 and
1990 are shown as ranging between 450 and 900 flights for that period. On
the vertical axis the allowable non-recurring cost for the development of the
launch vehicle -- that is, the Space Shuttle as well as the Space Tug and the
required launch sites -- are shown in billions of undiscounted 1970 dollars.
The benefit lines shown in this figure show how the allowable non-recurring
costs -- that is, the benefits to be associated with a fully reusable Space
Transportation System -- increase as the flight level expected for the 1980's
increases between 450 and 900 flights. Overall, this is very much a function
of the particular rate of discount (or social rate of interest) chosen and appliecd
to the analysis. Three summaries are shown in Figure 0. 1: the results
of 5%, 10% and 15% social rates of discount respectively. We may wish to
use them interchangeably. Since all the costs as well as the calculated cost
savings were expressed in constant dollars, the interest rates applied are
real interest rates which do not include elements of inflation. As shown at a
10% rate of interest, the allowable non-recurring cost would vary from about
$12.8 billion (about 500 Space Shuttle flights in the 1980's), up to $20 billion
at a flight level of about 850 flights for the same period. The shaded vertical
0-2 -
_ IC ) 1
,W L -
-~~~~ IlSl I MI K t&11101 CL! ll F El
w 2
___: - Z- -_
F-in33H3 30~n t5tO5 l
U) ~~~~~~~~~0
I~~~~~~~~~~~~~~~~~~~. On~
o- ~
0)8 U
'a . '-U
0~~~~~~~~~~~~~~~~~~~~~~
a)~~~~~~~~~~~~~~~~~~~~~~~~~~~~~~~~~~~~~~~~~~~~~~L.
4 -1
T O6! 0ON ..K 0N
1 0N Il- N
3'101H3A OznV"I 3EV~RO'Iq "IV .zL0~~~~~I~~~~~~~~~ft~~~~~~Lg0 0l _
CY 0IAP~ w w~(W1OOO6 ~~OS~N OS~I
0 3w 3 HNV 38MO1 1IJ
0-3
lines in Figure 0. 1 show, first, the average U. S. flight level in terms of
Shuttle flights between 1964 and 1969 (61 flights per year) and reflect also
the funding average between the years 1963 and 1971. Also shown are the
average USSR flights for the period 1965 to 1970 (65 flights per year).
Furthermore, the baseline mission model of 736 flights, at that time, is
shown on the right side of the darkly shaded area where the left boundary of
that area is defined by a reduced mission model of around 600 flights for
Space Program 3 in that analysis. Since then, we have used in our present
analysis a reduced baseline mission model of 514 flights with a potential
overall level of 624 space flights. Thus, in the last six months, the analysis
of the Space Shuttle System has been extended downwards to cover substan-
tially the region between 450 and 600 flights. Also shown in Figure 0. 1 are
the then estimated non-recurring costs of $12.8 billion for a two-stage fully
reusable Space Shuttle System as well as the Space Tug and the required
installations. We show the estimated economic potential of a reusable Space
Transportation System in terms of allowable non-recurring costs as a
function of several economic variables, among them the expected space
activity level, the social rate of discount, and the type of cost-effectiveness
analysis. The major findings of that effort are:
The major economic potential identified for Space Transportation
Systems in the 1980's is the lowering of space program costs due to the
reuse, refurbishment, and updating of satellite payloads. The fully reusable,
two-stage Shuttle is the major system considered in the May 31, 1971 report,
but not the only system to achieve reuse, refurbishment and updating of pay-
loads. Payloads were assumed to be refurbished on the ground, with refur-
bishment costs varying between 30% and 40%. The launch costs of the Space
Shuttle and Space Tug needed to recover and place the refurbished payloads
are also allowed for. We strongly recommended in May that other systems
be studied to determine the extent and the cost at which they can achieve reuse,
refurbishment, and updating of payloads.
The selected Space Shuttle System is no longer a two-stage fully reusablesystem and has substantially reduced non-recurring costs [see section 0.2]
0-4

The cost reductions identified originate in three distinct areas:
(a) The research, development, test and evaluation (RDT&E)
phase of new payloads (satellites);
(b) The construction and operating costs of payloads (satellites)
for different space missions;
(c) The cost of launching payloads into orbit.
The projected non-recurring cost associated with developing the
Space Shuttle and Tug as configured in May, 1971, (a two-stage system) is
shown by the economic analysis to be covered by the identified benefits pro-
vided the United States intends to operate a space program with the number
of flights equal to the unmanned space program activities of the United
States in the 1960's. The direct costs (payload and transportation) of space
activity carried out by a Space Shuttle System are expected to be about one-
half of the direct costs of the current expendable transportation system.
Manned space flight options -- for example, a manned lunar option --
are also analyzed. They show that a Space Shuttle System offers economic
advantages also in terms of transportation costs for some large lunar and
planetary (or defense) space flight options for the 1980's. These advantages
were not considered when formulating the basic conclusions of the economic
study, due to the great uncertainty of these options being adopted by the United
States.
The choice of the social discount rate has a major influence on the
economics of a new Space Transportation System. Differences in the rate
applied to the analysis outweigh many other important issues usually raised
-- and analyzed -- in the context of large scale RDT&E projects, including
uncertainties in the cost data. As shown in this report, the social rate of
discount influences not only the overall worth of a new Space Transportation
System, but also the choice of specific technical configurations in deciding
among alternative technical approaches to bring about a reusable Space
Transportation System.
The May 31, 1971 report concludes that the economic justification
of a reusable Space Transportation System is not tied to the question of
0-5

manned versus unmanned space flight. Space programs used and analyzed
are in line with the activity and funding levels of the unmanned United States
space program of the 1960's (NASA, DoD, and commercial users included).
If a substantial number of manned space flights were to be undertaken in the
1980's, a Space Shuttle System would also contribute significantly to lowering
the costs of such missions and activities.
The May 31, 1971 report analyzes the economically allowable non-
recurring cost of a reusable Space Transportation System. It is the
task of the present report to identify the economically best reusable Space
Transportation System among all the possible required alternatives.
A major point of the May 31st report is: any investment can only
be justified by its goals. This applies to business as well as to government,
hence also to NASA. A new, reusable Space Transportation System should
only be introduced if it can be shown, conclusively, what it is to be used for
and that the intended uses are meaningful to those who have to appropriate
the funds, and to those from whom the funds are raised, as well as to the
various government agencies that undertake space activities. The space
goals can be political (rivalry with the space programs of other countries),
military (to meet military space efforts of other countries who use the
potential of space to meet needs of national security), scientific (for example,
astronomy), or commercial (for example, earth resources applications). All
these goals will, of course, be mixed into one national space program, repre-
senting to various degrees a joint demand for space transportation with a
varying mix of payloads.
0. 2.2 Updated Economic Results On The Economic Worth of A Space
Shuttle System
Since May 31, 1971 our efforts concentrated on two major questions:
first, to what extent is the overall economic worth of a Space Shuttle System
modified by new inputs given to our study; and, second, which of the many
alternative Space Shuttle configurations is the most economical.
The new inputs reflect a substantially modified NASA and DoD Base-
line Mission Model for the 1980's, and make a new assessment of payload
0- 6
effects for different missions; very importantly, new alternative Space
Shuttle Systems that still promised the achievement of most of the objectives
of the Space Shuttle program but at considerably reduced non-recurring costs
in the 1970's, were considered.
Table 0. 1 shows the estimated complete direct life-cycle costs for
a NASA and DoD U. S. space program from 1979 to 1990 (twelve years) of
514 Space Shuttle flights, or an average of 43 Space Shuttle flights per year,
in this period. This space program is based on the NASA Baseline Mission
Model, including scientific and application missions as well as some manned
space flight activity, and a modified DoD mission model.
As can be seen from Table 0. 1, the same facts hold for the basis
of the economic analysis of the Space Shuttle System as in the May 31, 1971
Report:
(1) The Space Shuttle System has substantially higher research,
development and investment costs (non-recurring costs)
associated with it than any of the current expendable or new
expendable systems. This remains true, although the non-
recurring costs of the Thrust Assisted Orbiter Shuttle (TAOS)
System are substantially lower than the corresponding fully
reusable two-stage Shuttle System costs of May, 1971.
(2) The TAOS Space Shuttle System promises reductions in the
recurring launch costs of Space Transportation.
(3) The Space Shuttle System promises a reduction in the costs
of satellite payloads through reuse, refurbishment, in-orbit
checkout of payloads, and possible updating and maintenance
of payloads in orbit or on the ground.
It is the combined reduction in launch costs and payload costs that
underly the economic justifications of the TAOS Space Shuttle System.
These life-cycle costs are the starting point and the basis of our economic
analysis. A wide variety of alternative Space Shuttle Systems was investi-
gated by us with a wide variety of technical changes when compared with
the May, 1971 Space Shuttle configuration.
0-7
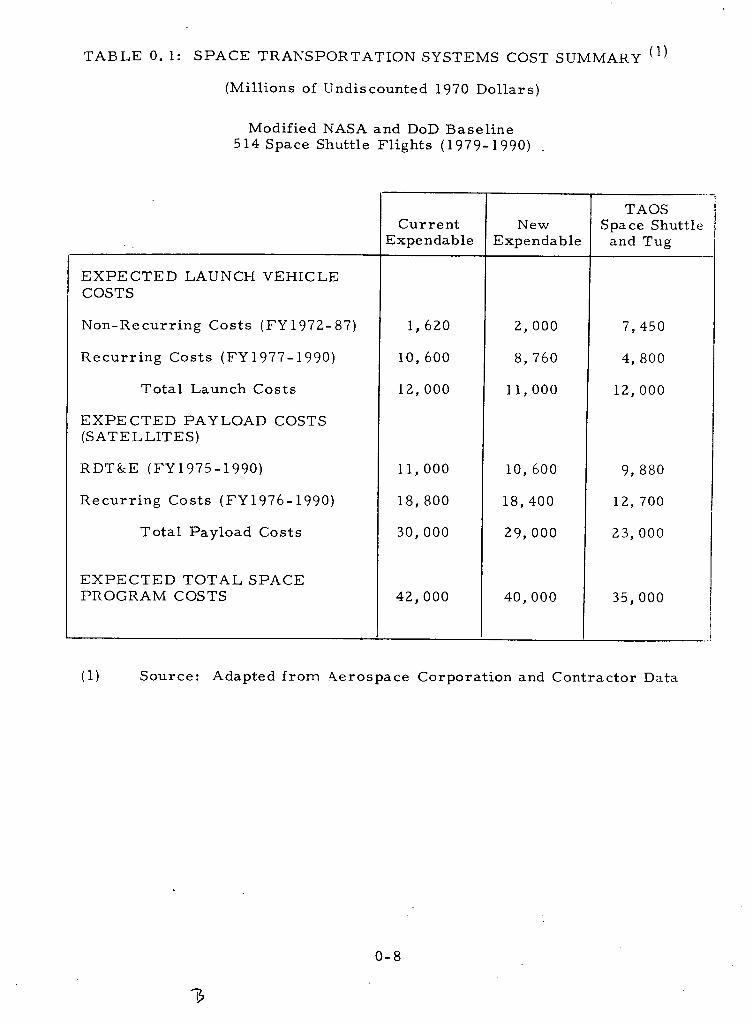
TABLE 0. 1: SPACE TRANSPORTATION SYSTEMS COST SUMMARY ( ] )
(Millions of Undiscounted 1970 Dollars)
Modified NASA and DoD Baseline514 Space Shuttle Flights (1979-1990) -
EXPECTEDCOSTS
LAUNCH VEHICLE
Non-Recurring Costs (FY1972-87)
Recurring Costs (FY1977-1990)
Total Launch Costs
EXPECTED PAYLOAD COSTS(SATELLITES)
RDT&E (FY1975-1990)
Recurring Costs (FY1976-1990)
Total Payload Costs
EXPECTED TOTAL SPACEPROGRAM COSTS
CurrentExpendable
1,620
10, 600
12, 000
11,000
18, 800
30, 000
42,000
NewExpendable
2, 000
8, 760
11,000
10,600
18, 400
29, 000
40,000
TAOSSpace Shuttle
and Tug
7, 450
4, 800
12,000
9, 880
12, 700
23, 000
35, 000
(1) Source: Adapted from Aerospace Corporation and Contractor Data
0-8
q)
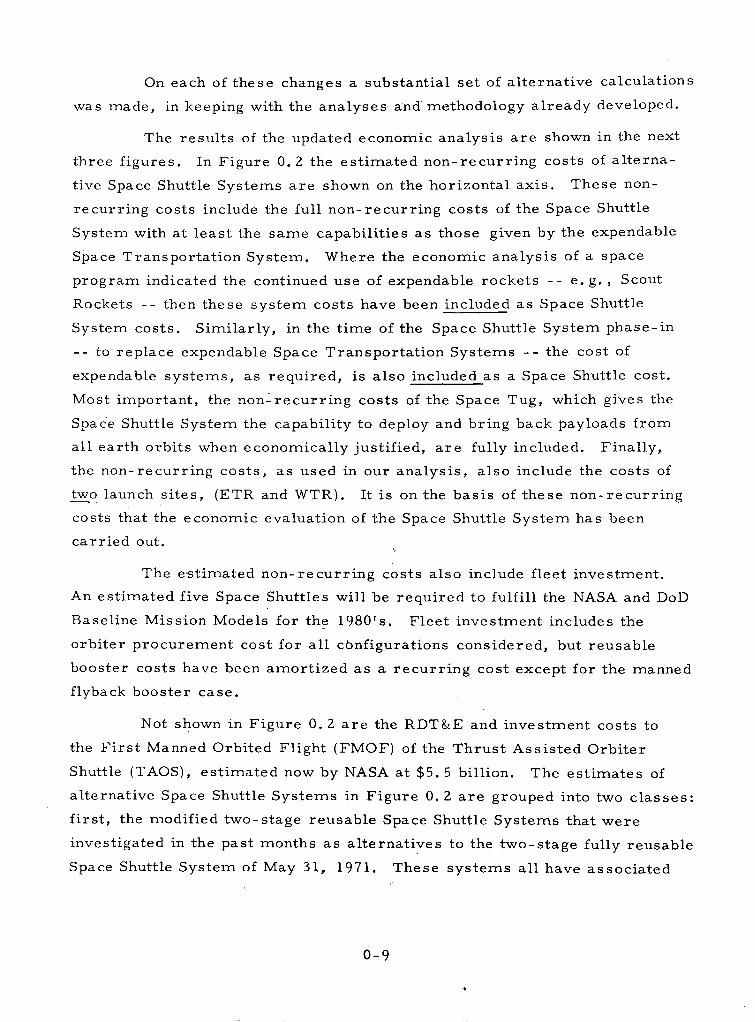
On each of these changes a substantial set of alternative calculations
was made, in keeping with the analyses and methodology already developed.
The results of the updated economic analysis are shown in the next
three figures. In Figure 0.2 the estimated non-recurring costs of alterna-
tive Space Shuttle Systems are shown on the horizontal axis. These non-
recurring costs include the full non-recurring costs of the Space Shuttle
System with at least the same capabilities as those given by the expendable
Space Transportation System. Where the economic analysis of a space
program indicated the continued use of expendable rockets -- e.g., Scout
Rockets -- then these system costs have been included as Space Shuttle
System costs. Similarly, in the time of the Space Shuttle System phase-in
-- to replace expendable Space Transportation Systems -- the cost of
expendable systems, as required, is also included as a Space Shuttle cost.
Most important, the non-recurring costs of the Space Tug, which gives the
Space Shuttle System the capability to deploy and bring back payloads from
all earth orbits when economically justified, are fully included. Finally,
the non-recurring costs, as used in our analysis, also include the costs of
two launch sites, (ETR and WTR). It is on the basis of these non-recurring
costs that the economic evaluation of the Space Shuttle System has been
carried out.
The estimated non-recurring costs also include fleet investment.
An estimated five Space Shuttles will be required to fulfill the NASA and DoD
Baseline Mission Models for the 1980's. Fleet investment includes the
orbiter procurement cost for all configurations considered, but reusable
booster costs have been amortized as a recurring cost except for the manned
flyback booster case.
Not shown in Figure 0.2 are the RDT&E and investment costs to
the First Manned Orbited Flight (FMOF) of the Thrust Assisted Orbiter
Shuttle (TAOS), estimated now by NASA at $5.5 billion. The estimates of
alternative Space Shuttle Systems in Figure 0. 2 are grouped into two classes:
first, the modified two-stage reusable Space Shuttle Systems that were
investigated in the past months as alternatives to the two-stage fully reusable
Space Shuttle System of May 31, 1971. These systems all have associated
0-9
SPACE SHUTTLE AND TUGESTIMATED TOTAL NON-RECURRING COST (BILLIONS OF 1970 DOLLARS)
RDT &E AND INVESTMENT (5 VEHICLES EACH)
0 TWO-STAGE CONFIGURATIONa TAOS CONFIGURATION
k
THRUST ASSISTED ORBITER SHUTTLESNNED ORBITER ONLY (WITH SPACE TUG)
--TWO- STAMANNED CWXITH SPA(
AGE SPACE SHUTTLES)RBITER AND BOOSTERCE TUG)
6,0 10.0 15.0ESTIMATED NON-RECURRING COST, RDT&E AND INVESTMENT
SPACE SHUTTLE AND TUG(BILLIONS OF 1970 DOLLARS, 10 PERCENT)
Figure 0. 2
0-10
zwa
:i
4
0AS
with them lower non-recurring costs than the estimate for the original fully
reusable Space Shuttle System. Considerable variation existed with regard
to the non-recurring costs of these modified two-stage (manned booster)
systems. In addition, therefore, we show the mean of these estimates as
well as the standard deviation (a-) of the non-recurring cost estimates of
these systems. As shown in Figure 0.2, the mean of the non-recurring costs
of such modified two-stage Space Shuttle Systems is $11.5 billion, the stand-
dard deviation is $1.44 billion.
Similarly, also shown in Figure 0. 2 are estimated total non-recurring
costs of Thrust Assisted Orbiter Space Shuttle Systems (TAOS) that include
a wide variety of technical choices, all having in common that only the orbiter
is manned, with external hydrogen/oxygen tanks and all are assisted at take-
off by either solid rocket motors or pressure fed rocket systems. The mean
of the non-recurring cost estimates of such systems is $7. 5 billion. These
include about $1. 6 billion for the non-recurring costs of the Space Tug and the
additional required launch site. They also include a fleet of 5 Space Shuttles,
each estimated at about $300 million. When Space Tug and WTR costs are
excluded ($1.6 billion), as well as 3 Space Shuttle vehicles (about $900
million), then the estimated non-recurring costs in the 1970's (comparable,
roughly, to FMOF costs) are estimated to be $5.0 billion (1970 dollars). The
standard deviation of this estimate if $900 million, again in 1970 dollars.
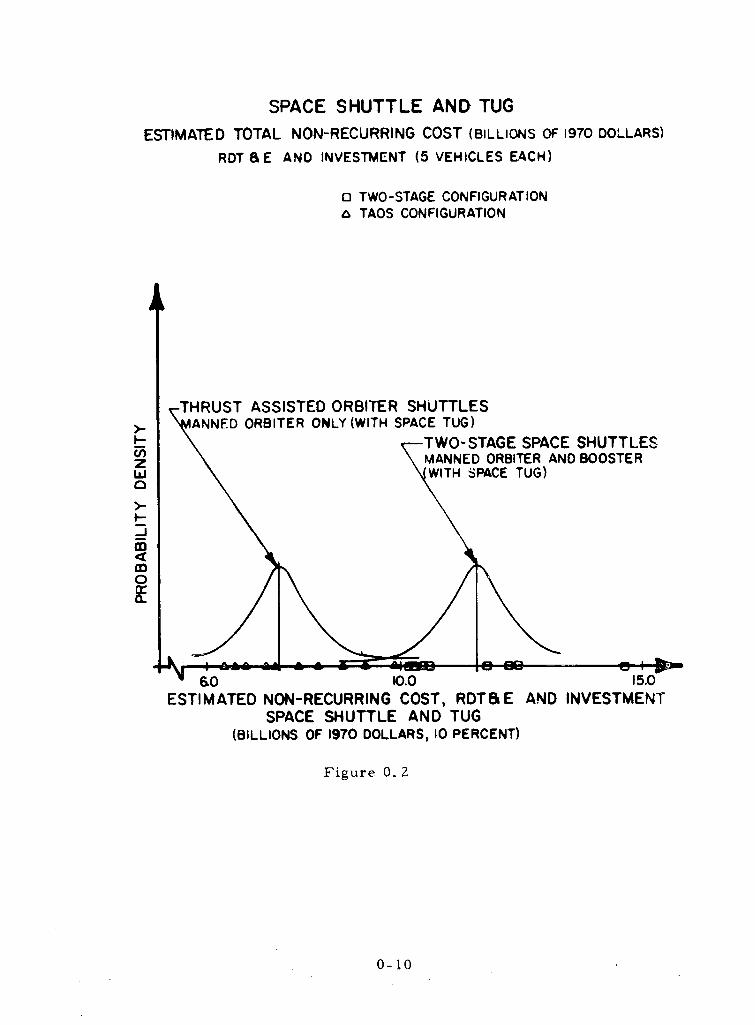
Using these alternative Space Shuttle Systems, a comprehensive set
of economic analyses was performed along the lines of the May 31, 1971 report
to determine the economic benefits 'of a Space Shuttle System. In Figure 0. 3
the results of the equal capability cost-effectiveness analysis are shown, at
a 10 percent social rate of discount, directly comparable to the .results of
May 31, 1971 as shown in Figure 0. 1. The benefits are expressed in Allowable
Non-Recurring Costs, thus making the benefits shown directly comparable
to the estimated non-recurring costs of Figure 0. 2.
Major variations were introduced in the space program activities
of the 1980's, concentrating on the lower role of expected space activities
of the 1980's and beyond. While in the May 31st analysis the area of interest --
based on historical, unmanned activities of the United States (and the Soviet
0-11

I
o o
0
O~~~~~~~~~~~
J~~~~u
-~~~~~~~~~~~~~~~~~~~~I.~
snl act 3oln~s Bardw a ~
C,
co 0o0~~~~ :
z _ I o
-Jr 0
0~~~~~~~ ®)
X~~- zz~~ - 0)
(IN30U0d 01 'SI:IV"I"000 ON
0~~~~~I.
w (n
0 I~~~~~~~~occ
0 z~~~~~~
o 00
(1N3083dO 's~viioa o.L' zio SNOI'1119)DrlJ ONV 31.I'lHS 33VdS aNV
1SOD 9NI:Iln3N,-NON 31'VMO1'V3 a31.VVbLLS3 NIS11:3N38
0-12
s.008
ID
Union) -- was confined to between 500 and 900 Space Shuttle flights in the
1978 to 1990 period, the present analysis was confined to look at the range
of Space Shuttle flights between 400 and 650 Space Shuttle flights, with major
variations in the analysis at 514 and 624 flights.
Two separate benefit lines were arrived at and are shown in
Figure 0. 3: first, the analysis concentrating around 514 Space Shuttle flights
shows the economic results with the exclusion of some DoD missions that are
particularly suited for Space Shuttleoperations; second, the analysis concen-
trating at around 624 Space Shuttle flights takes the same NASA mission model,
now, however, including on the DoD side the missions omitted in the first
analysis.
With regard to the lower benefit line, we conclude thatat 514
flights in the 1979-1990 period, the estimated benefits of a Space Shuttle
System are $10.2 billion in 1970 dollars with a variance of $940 million --
expressed in allowable non-recurring costs. The economic "break even"
point is reached at an annual space activity level of about 30 Space Shuttle
flights, carrying satellite payloads. This annual level of NASA and DoD space
activity in the 1980's and beyond will justify the development of the TAOS
Space Shuttle at a social rate of discount of 10 percent.
When, on the other side, Space Shuttle related DoD missions are
included, the economic analysis shows, at 624 Space Shuttle flights in the
1979 to 1990 period, an estimated benefit of $13.9 billion of allowable non-
recurring costs, with a standard deviation of + $1. 45 billion. As activity
levels are increased or decreased around these space programs, the expected
benefits of a Space Shuttle System increase or decrease as shown by the two
benefit lines in Figure 0. 3. The TAOS Space Shuttle System will "break even"
at an annual activity level of about 25 Space Shuttle flights, carrying satellite
payloads, when the "624" mission model is taken as representative of U. S.
space activities in DoD and NASA for the 1980's.
Again, we want to emphasize that these results reflect the benefits
of a Space Shuttle System when applying a 10 percent real social rate of dis-
count to the complete economic analysis.
0-13
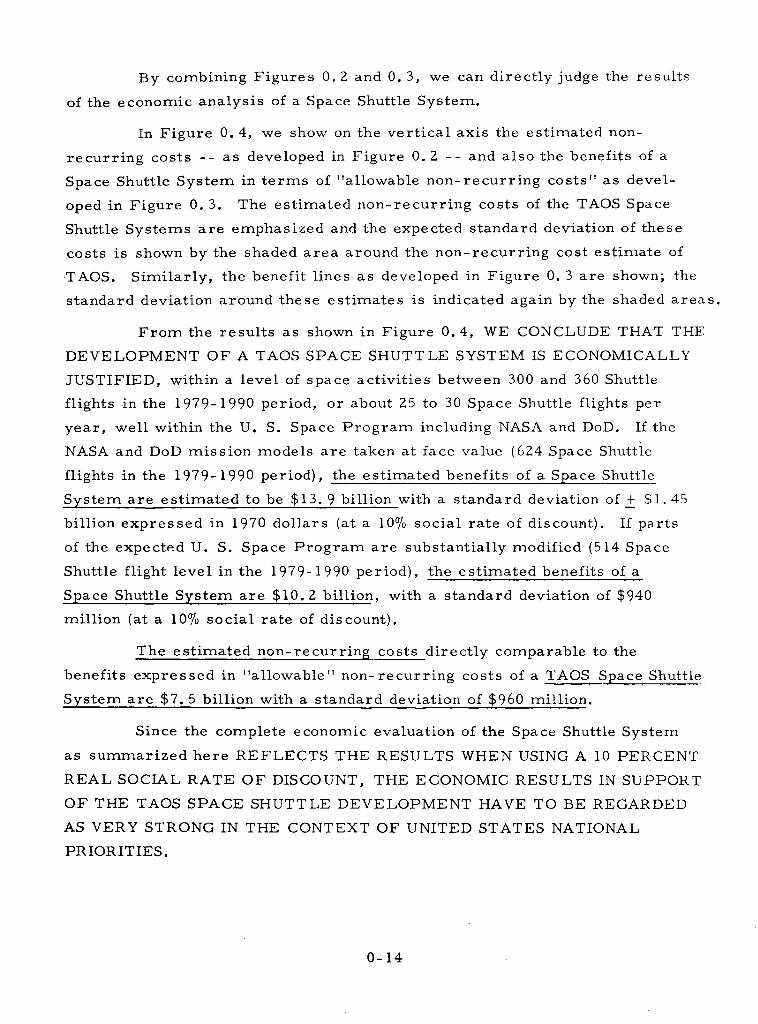
By combining Figures 0.2 and 0. 3, we can directly judge the results
of the economic analysis of a Space Shuttle System.
In Figure 0. 4, we show on the vertical axis the estimated non-
recurring costs -- as developed in Figure 0.2 -- and also the benefits of a
Space Shuttle System in terms of "allowable non-recurring costs" as devel-
oped in Figure 0. 3. The estimated non-recurring costs of the TAOS Space
Shuttle Systems are emphasized and the expected standard deviation of these
costs is shown by the shaded area around the non-recurring cost estimate of
TAOS. Similarly, the benefit lines as developed in Figure 0. 3 are shown; the
standard deviation around these estimates is indicated again by the shaded areas.
From the results as shown in Figure 0.4, WE CONCLUDE THAT THE
DEVELOPMENT OF A TAOS SPACE SHUTTLE SYSTEM IS ECONOMICALLY
JUSTIFIED, within a level of space activities between 300 and 360 Shuttle
flights in the 1979-1990 period, or about 25 to 30 Space Shuttle flights per
year, well within the U. S. Space Program including NASA and DoD. If the
NASA and DoD mission models are taken at face value (624 Space Shuttle
flights in the 1979-1990 period), the estimated benefits of a Space Shuttle
System are estimated to be $13. 9 billion with a standard deviation of + $1.45
billion expressed in 1970 dollars (at a 10% social rate of discount). If parts
of the expected U. S. Space Program are substantially modified (514 Space
Shuttle flight level in the 1979- 1990 period), the estimated benefits of a
Space Shuttle System are $10.2 billion, with a standard deviation of $940
million (at a 10% social rate of discount).
The estimated non-recurring costs directly comparable to the
benefits expressed in "allowable" non-recurring costs of a TAOS Space Shuttle
System are $7. 5 billion with a standard deviation of $960 million.
Since the complete economic evaluation of the Space Shuttle System
as summarized here REFLECTS THE RESULTS WHEN USING A 10 PERCENT
REAL SOCIAL RATE OF DISCOUNT, THE ECONOMIC RESULTS IN SUPPORT
OF THE TAOS SPACE SHUTTLE DEVELOPMENT HAVE TO BE REGARDED
AS VERY STRONG IN THE CONTEXT OF UNITED STATES NATIONAL
PRIORITIES.
0-14
CY~
b0
W~~~~~~~~~~~~~~. .... w..
Ct) U)Ct
9f'l.L 0NV 31.L.Ln~s 3~s S U.LA. .$0 9NIB: : N3- N3BYTI9 .LM.$
0 -JU)-1
Li......Uzz
04~~~w4
~~~~I~~~~~J~L
w~~~~~~~~.
I- -~(N3U~ 01I 4-'0 LI40SO-110
o WcnC.) IV3IinH 3"'Vs NW ~ IOO.. ~ n3-NN3-IVMIV 8aLV1ZS
0. I a.~~~~~~-1
0.3 THE MOST ECONOMIC SPACE SHUTTLE CONFIGURATION: TAOS
As shown in Figure 0. 2, there exists a great variety of alternative
Space Shuttle configurations that have been studied in the past months and
years to achieve the ultimate goal of a reusable Space Transportation Systet:.
If all of the Space Shuttle Systems had the same recurring costs (roughly th,
cost per flight) and differed only in the expected non-recurring costs, as
shown in Figure 0. 2, then the economic problem of choice among the proposed
systems would be straightforward: find the system with the lowest non-
recurring costs (RDT&E and investment).
However, the economic task is not that simple: most of the reductions
in non-recurring costs are achieved by increasing, in one way or another, the
operating costs of the Space Shuttle System in the 1980's and beyond. It is
the economic tradeoff between non-recurring cost savings in the 1970's versus
expected increases in operating costs in the 1980's and beyond that becomes
the subject of economic analysis when determining the most economic Space
Shuttle configuration. It is only through such an analysis that a single systerm
or family of systems can be identified with confidence among the wide variety
of alternative choices. This was done extensively by our group.
The economic methodology of determining the most economic Space
Shuttle System has been put forth in detail in this report. This effort will
have to take into account a variety of economic factors. Foremost among
these are (1) the objectives to be achieved by an investment like the Space
Shuttle System, (2) the identification of cost-effective Space Shuttle configura-
tions, (3) the identification, among the cost-effective configurations, of a
single most economic Space Shuttle System which again will depend on (a) the
activity level to be expected in the 1980's and beyond, (b) the social rate of
interest to be applied to the investment decision and, (c) the anticipated
payload effects of the Space Shuttle System in the area of reducing payload
costs, and making possible the reuse, refurbishment and updating of payloads.
The estimates of the economic benefits are also dependent on the type of
cost-effectiveness analysis used within the range of equal capability and equal
0-16
budget analyses. Most important are the objectives within which the
analysis is carried out. We, therefore, state these here explicitly.
0. 3. 1 The Objectives of a Reusable Space Transportation Systemn (STS)
In the economic analysis of this report the principal objectives
of a Space Shuttle System are considered to be:
(a) A new capability of meeting all now foreseeable space missions
in NASA, DoD and elsewhere, including manned space flight capabilities.
Thus, whenever a proposed system cannot meet all requirements, the costs
of the required expendable systems are fully included as part of that Space
Shuttle System.
(b) Reduction of space program costs (manned, unmanned, NASA,
DoD, commercial users) over the present expendable Space Transportation
costs through reuse, refurbishment, maintenance, and updating of payloads.
The Space Tug is therefore included as an integral part of a reusable Space
Transportation System.
(c) Reduction of Space Transportation costs for all nmissions (low
energy, high energy, manned).
(d) Option of later transition to a fully reusable system.
The above four objectives were considered to be the principal
motivations for the investment in a reusable Space Transportation Systenm.
Additional objectives supporting the major objectives were considered to be:
(e) A low non-recurring cost to meet funding constraints.
(f) Assurance of a low cost per launch. Launch costs of up to
about $10 million are justifiable when payload costs and effects are considered.
It is with these objectives in mind that the results of this report
told. Had the objectives been different, for example, to maintain a manned
space flight capability only, or to undertake a limited technology program in
support of future Space Transportation only, then a different econonmic
analysis would have to be made, since the benefits of the Space Shuttle
development -- the promnised capabilities -- are analyzed here within the
context of overall Space Transportation capability.
0-17

0. 3.2 Space Transportation Systems Considered
Over the last two years, but particularly in the effort of the past
six months, many alternative Space Shuttle concepts have been considered.
It is difficult to follow and appreciate all the different ideas proposed to
achieve the objectives listed in the previous section. Several basically
different approaches were investigated, among them two-stage fully reusablbi
systems, two-stage systems with some external (expendable) tankage, manmed
orbiters with a variety of unmanned boosters, single orbiters with parallel
burn and rocket assists, single stage to orbit concepts, stage and one-half
concepts, and others. When variations of technical options within each
of these approaches are considered, then literally hundreds of different
Space Shuttle Systems have been studied by NASA, the Phase B Study con-
tractors and other interested parties. It can be affirmed that seldom if ever
before has a single investment program of the scope and size as the Space
Shuttle System been studied in such detail -- both technical and economic --
as to alternative approaches to achieve the objectives listed. The configura-
tions listed and discussed in the subsequent pages are already the result of
an extensive technical and economic elimination process. Somne of these
systems are described in detail in this report. Nevertheless, large econonlic
differences still exist between these configurations.
This study examines in detail the economics of the following alter-
native Space Transportation Systems for use in the decade of the 1980's:
A. The Current Expendable System
The system envisages continuing use of the types of expendable
launch vehicles presently in the United States inventory.
B. The New Expendable System
As its name implies, this envisages use of a new family of expend-
able vehicles designed to have better (economic) performances than the
Current Expendable vehicles. Where economically justified, payloads were
redesigned to take advantage of the New Expendable System performances.
0-18

C. Space Shuttle System
Systems considered within this category differ in concept from the
previous systems in implying reusable rather than expendable launch vehicles.
Two major elements are employed in each of these: a Space Shuttle which
operates between the earth's surface and earth orbits of at least 185 kilo-
meters; and a Space Tug which can be transported within the Space Shuttle
and which can operate from the relatively low orbit of the Space Shuttle to
high earth orbits such as the synchronous equatorial orbit (35, 500 kilometers).
Only the combined Space Shuttle and Tug systems provide a reusable launch
system able to place payloads into all widely used earth orbits, and also able
to recover payloads from these orbits. The capabilities, performances and
operations of the Space Tug were assumed as given and fixed for purposes
of this study, which concentrates on identifying the most economic Space
Shuttle among the alternative configurations. The following systems were
analyzed extensively across a wide variation of expected mission models and
levels of demand for Space Transportation in the 1980's:
a. The two-stage fully reusable Space Shuttle. The baseline used
also in the evaluation of the May 31, 1971 report aimed at determining the
economic potential of a reusable Space Transportation System.
b. Tw.-o-stage Space Shuttle Systems with external hydrogen tanks
on the orbiter.
c. Two-stage (F-1) Flyback Space Shuttle System also known as the
Reusable SIC. The orbiter used in this version is the present baseline orbiter
(with external hydrogen and oxygen tanks, a 60 x 15 payload bay); the ultimate
capability of this system was considered to be 40K pounds to polar orbit of
185 by 185 kilometers.
d. Series Burn Pressure Fed Booster (SPFB) Shuttle System, with
the present baseline orbiter.
e. Series Burn Solid Rocket Motor Boosters (SSRM) Shuttle System,
with the present baseline orbiter.
f. (Twin) Pressure Fed Booster (TPFB) Shuttle Systems, with the
present baseline orbiter and parallel burn at takeoff (TAOS).
g.. (Twin) Solid Rocket Motor Boosters (TSRM) with the present
0-19
baseline orbiter with parallel burn at takeoff (TAOS).
h. Identical Vehical Space Shuttle System, with two identical
orbiters and three drop tanks sandwiched between them.
Each of these systems has associated with it a considerable amount
of non-recurring costs, (research and development costs as well as initial
fleet investment costs), and substantially different cost per flight of the
systems varying from $4. 5 million per launch to over $15 million per launch.
The total non-recurring costs, including the cost of the Space Tug and two
launch sites varies from a low of $6. 9 billion to a high of $14 billion (see
also Figure 0. 2).
D. A Space Glider Combined with a New Expendable Space Trans-
portation System
The Space Gliders considered had payload bays of 60 x 15 feet and
40 x 12 feet; they would be launched on expendable vehicles. Costs per flight
of these systems are in excess of $30 million per launch.
In addition to the above configurations, other variations in the Space
Shuttle were also considered as alternatives. One such alternative is a 40 x 12
payload bay with 30K pounds of equatorial launch capability for the Space
Shuttle System.
The cost estimates and breakdowns for the alternative Space Shuttle
configurations are given, in detail, in Chapters 6 and 8 of the report.
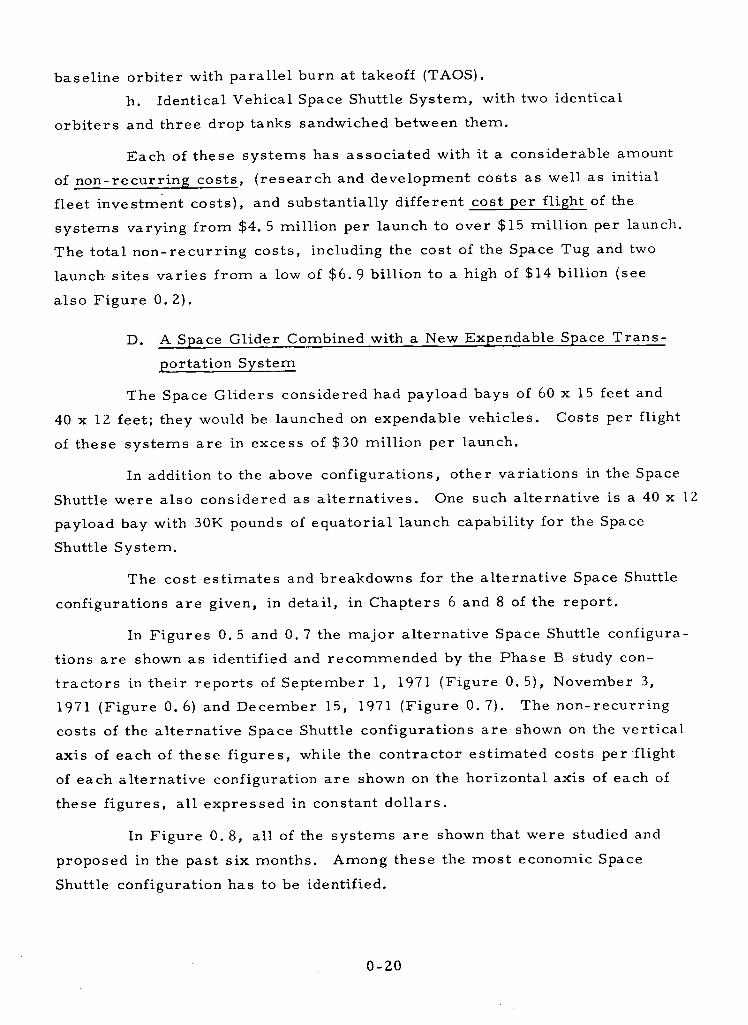
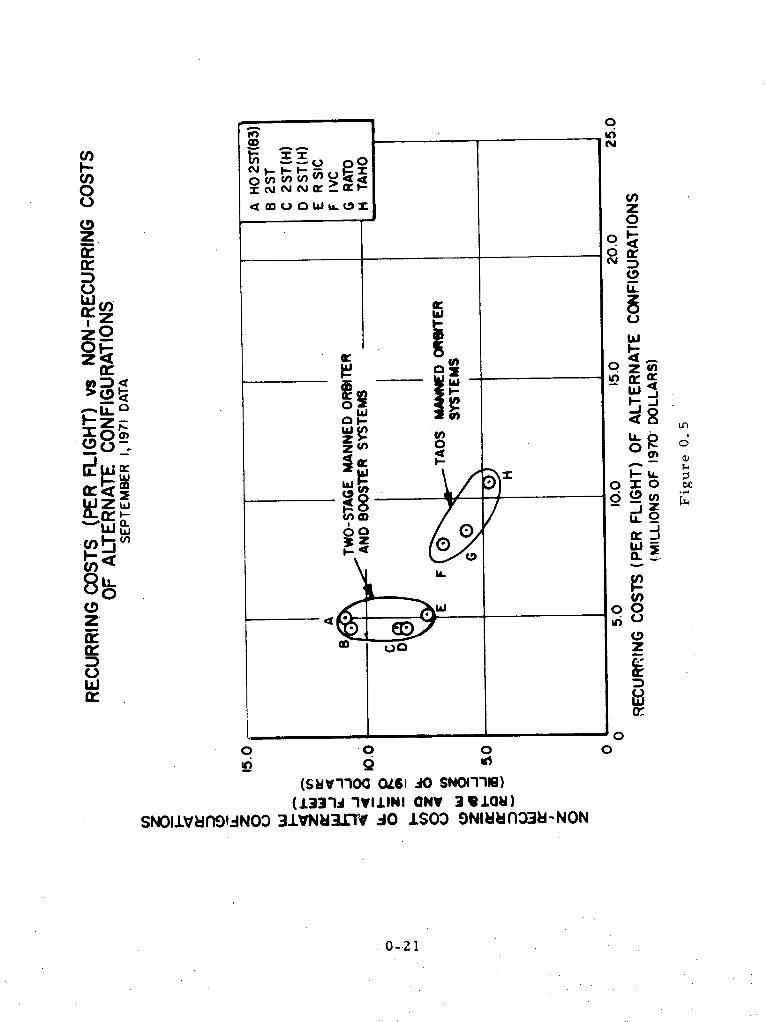
In Figures 0.5 and 0. 7 the major alternative Space Shuttle configura-
tions are shown as identified and recommended by the Phase B study con-
tractors in their reports of September 1, 1971 (Figure 0. 5), November 3,
1971 (Figure 0. 6) and December 15, 1971 (Figure 0. 7). The non-recurring
costs of the alternative Space Shuttle configurations are shown on the vertical
axis of each of these figures, while the contractor estimated costs per flight
of each alternative configuration are shown on the horizontal axis of each of
these figures, all expressed in constant dollars.
In Figure 0. 8, all of the systems are shown that were studied and
proposed in the past six months. Among these the most economic Space
Shuttle configuration has to be identified.
0-20
n)
8, )0
0z
Z D--
Wiz
Iz
0
zIt
80
w
·- U -i a
Z
r-
LiJ W
0
SNOIIVln9.IANO3
0 0Q
(SvT10o QOI6 dO SNO"1 l)(.133A 1tVIlNl aNV 3 .Ubi)
31.VNrtt :O 1S03 9NNIlIn338-NON
0-21
o0toI N
C;
In0m
z0o~
oJDdC,
o
1 4
Qz 8
oO
LL2
-U
C,,o0 x0
_j U
C:,
U. 2
z
Ciwx
o 0
00
tO
CDzO:
8~
go
Jn~
w
,Er <E
cn5 z
-a:
0
SNOIIEn91:INO
0 o02 u
(SW6I OO 0S61 jO SNOf11l)(1331d 1VIIINI QNV 39A£Q)
31JVNN3LV JO J SO3 9NII1n38-NON
0-22
U)z
o4
z
0
-J
zr aIL O
4d
U. 0
0 O-
oB
ir)cez
9:
C
.- 4
~Z4

QU)~~~~~~~~~~~~~~~~~~~~~~~~~~~~~~~~~~~~~~~f
H
>,-1 w < 0CDZz ir cr0o01-
c'J
~~~~~~~~o L
0zr- , zC') z
I~~~~~~~I
wZ~~~~~~~~~~~~~~~~~~~~Zc
CD ~~~~~~~~~~~~~~~~OJzU.
LAJ~~~~~~L
(ID In ~o0 0
o a-S 010 ofSOflNO"'J3VOS0 NLl3N
0
z - °.
C.)
0 0 0 0
(ShIV'I'IQ0001,61 dO SNOI'l'I1g)(.L33q.-I'VlJ. INI aNV 3 I .Lat;)
SNOI.nLV~II1-INO0 3J.VN8d3J-V dO .ISO:) O9iNnObq381:-NON
0-23 3

0. 3. 3 Results of the Economic Analysis on Alternative Space Shuttle Systems
The methodology for the determination of cost-effective systems,
the meaning and significance of the economic tradeoff line, as well as the
theoretic identification of the most economic systems among cost-effective
systems is described in the report. Here the results are represented in
convenient diagrammatic form in the next figures.
In Figure 0.8 we show two important results: first, among the
different concepts investigated and reported on by NASA and Industry there
emerge the following families of systems as cost-effective: the original
two-stage fully reusable Space Shuttle System at an estimated non-recurring
cost of $12. 8 billion and the lowest expected cost per flight of $4. 6 million,
a family of cost estimates associated with F-1 Booster technology, also
known as the Reusable SIC, and shown by the shaded area in Figure 0.8
reflecting December 15 variations in industry estimates; a family of cost
estimates associated with series burn and parallel burn pressure fed Space
Shuttle Systems, all having in common the new baseline (manned) orbiter
and unmanned recoverable pressure fed booster systems; a family of cost
estimates associated with Solid Rocket Motor boosters and the new baseline
orbiter, using parallel burn operations (i. e., orbiter engines are ignited at
takeoff); and a family of cost estimates for series burn solid rocket motor
boosters, again using the new baseline orbiter. Also shown are all the other
cost estimates since September 1, 1971 of alternate Space Shuttle configurations.
And not quite accurately shown, due to the high cost per launch, is the Space
Glider concept discussed by different agencies and NASA with a cost per flight
of $30 million or more and a non-recurring cost of between $2. 8 and $4. 1
billion. Within the economic analysis and the objectives of the Space Shuttle
program stated in the previous section, the Space Glider is a cost-effective
system, but clearly not the most economic system among the alternative
devices as the further economic analysis will show.
The black-shaded areas in Figure 0.8 show, with emphasis, the
likely cost estimates for the two most interesting alternative Space Shuttle
Systems, the "twin pressure fed parallel burn booster" Space Shuttle and
the "twin SRM, parallel burn" Space Shuttle concepts, emphasizing the
0-24

COST-EFFECTIVE SPACE SHUTTLE SYSTEMS DEFINEDBY EXPECTED NON-RECURRING 8 RECURRING COST ESTIMATES
r77/' DECEMBER 15.1971 DATAx OTHER SYSTEMS
,..................
.-.-.-.-.-.-.-.-.-.-.-.-.-.-.-.-.-...........
........................................ ....
. . . . . . . . . . . . . . . . . . . . . . . . . . . . . . . . . . . . . . . .............................. -.... *o. *.. .- o. o .................. o .eo,.oo...........
~ **.-:-.-:-:-----::------- -:--------------- ---------------------~**** -~--*~* ·
":-.."": SE.S·... ..............
. . . . . . . . . . . . . . . ... . . . . . . . . . . . . . . . . . . . . . . . . . . . .........--------------------------
~~~~~~~~~~~~~~~~:::::::::::::::::::::::::::::::::::::::::::::::::::::::::::::-:::::: ,sTWO-STA FULLY.:.::.:.:.:.::::::::::.:::::::s 8.,-,.
.-.-.-. -. -. -. -. -.-. -.-.-. -.-. -. -. -. . . .. . . . ... . .. .-. -. -.-.-. -. -.-. -. -.-. -.-.-.-..............
. · ,:::.. ........:.:.:.:.:.:,:·:, ............. .~~~~.... .. ,::...........,o·.·*·*·*.·.,;,
.-.-.-.-.-.-.-.-. :..-.-'.-.-.-.-.-.-.--.-.-.-.-.-.-...... ............ ................ ....... .......................
COSTAEFFEULLYENESS SPACE GLIDER WiTH
FRONTIER BOOSTERM I N EN ........ ........
.. .. ./. .. .. .. .. .. .. .. .... .. . .. .. ... . .. .. . . .* A * --.. ... ..... -... ..........
.... . .. . .....................................................
... ... . . ,.. ... s.. -.... .-.-. ..........
C S FLYBCKI'N S .......... .........F'RONTIER DETERMINED NE ... 30M/FLIGHT
BY TECHN3LOGY
Lt\. 05 ! 5
RECURRINS COSTS (PER FLIGHT) OF ALTERNATE CONFIGURAT,CNS(MILLIONS OF 1970 DOLLARS)
I"igiure 0. 8
0-25
20 4
U)z0I--<:cr(:30
z
Z L
FwzIcr
Z -
irj--
U0
0
~ _jI--
0 a
Z)
0
10 +I
0
I
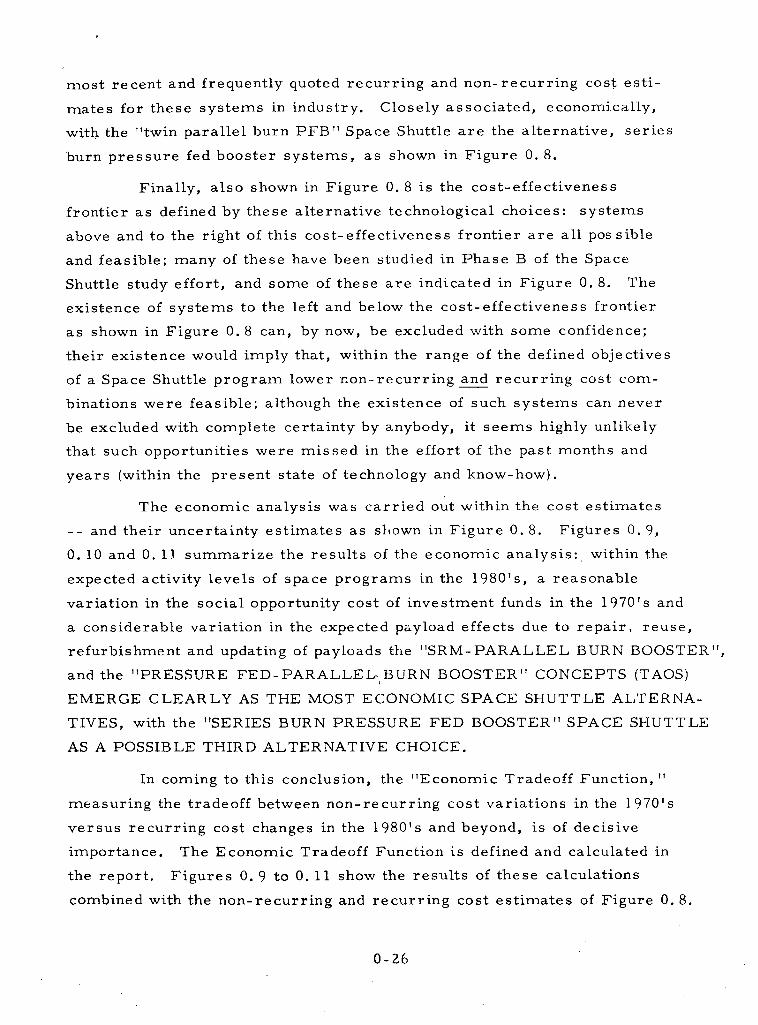
most recent and frequently quoted recurring and non-recurring cost esti-
mates for these systems in industry. Closely associated, economically,
with the "twin parallel burn PFB" Space Shuttle are the alternative, series
burn pressure fed booster systems, as shown in Figure 0. 8.
Finally, also shown in Figure 0.8 is the cost-effectiveness
frontier as defined by these alternative technological choices: systems
above and to the right of this cost-effectiveness frontier are all possible
and feasible; many of these have been studied in Phase B of the Space
Shuttle study effort, and some of these are indicated in Figure 0. 8. The
existence of systems to the left and below the cost-effectiveness frontier
as shown in Figure 0.8 can, by now, be excluded with some confidence;
their existence would imply that, within the range of the defined objectives
of a Space Shuttle program lower non-recurring and recurring cost com-
binations were feasible; although the existence of such systems can never
be excluded with complete certainty by anybody, it seems highly unlikely
that such opportunities were missed in the effort of the past months and
years (within the present state of technology and know-how).
The economic analysis was carried out within the cost estimates
-- and their uncertainty estimates as shlown in Figure 0. 8. Figures 0.9,
0. 10 and 0. 11 summarize the results of the economic analysis: within the
expected activity levels of space programs in the 1980's, a reasonable
variation in the social opportunity cost of investment funds in the 1970's and
a considerable variation in the expected payload effects due to repair, reuse,
refurbishment and updating of payloads the "SRM-PARALLEL BURN BOOSTER",
and the "PRESSURE FED-PARALLEL- BURN BOOSTER" CONCEPTS (TAOS)
EMERGE CLEARLY AS THE MOST ECONOMIC SPACE SHUTTLE ALTERNA-
TIVES, with the "SERIES BURN PRESSURE FED BOOSTER" SPACE SHUTTLE
AS A POSSIBLE THIRD ALTERNATIVE CHOICE.
In coming to this conclusion, the "Economic Tradeoff Function,"
measuring the tradeoff between non-recurring cost variations in the 1970's
versus recurring cost changes in the 1980's and beyond, is of decisive
importance. The Economic Tradeoff Function is defined and calculated in
the report. Figures 0.9 to 0. 11 show the results of these calculations
combined with the non-recurring and recurring cost estimates of Figure 0. 8.
0-26

In Figure 0. 9, the position and slopes of the Economic Tradeoff
Function is shown as it varies with different activity levels in the 1979-1990
period at a 10 percent social rate of discount. Systems above the Economic
Tradeoff Function are not economic when compared to an Expendable Space
Transportation System in the 1980's; systems below and to the left of the
Economic Tradeoff Function are, economically, better than an Expendable
Space Transportation System in the 1980's at a 10 percent social rate of
discount. The three activity levels shown for the 1979 to 1990 period cor-
respond to three basic space program alternatives that were used by us in
the economic analysis, with considerable further variations (see Chapters
6 and 8 of the report): the NASA and DoD Baseline Mission Model for 1979-
1990 (624 Space Shuttle flights), the modified NASA and DoD Mission Model
(514 Space Shuttle flights, modified in the DoD part under exclusion of some
missions particularly suited for Space Shuttle operations) and the former
(May 31, 1971 report) NASA and DoD Baseline Mission Model (about 736
Space Shuttle flights). With each of these activity levels the slope of the
Economic Tradeoff Function does not change significantly over the range of
interest. THE MOST ECONOMIC SPACE SHUTTLE SYSTEM IS THEN THE
SYSTEM ALONG THE COST-EFFECTIVENESS FRONTIER WHERE THE
ECONOMIC TRADEOFF FUNCTION IS TANGENT TO THE COST-EFFECTIVE-
NESS FRONTIER; it is the Space Shuttle System most distant from the
Economic Tradeoff Function, when measured orthogonally to that function.
In this case, both TAOS systems (TPFB and TSRM) are equally preferred
over any of the other systems proposed; with higher activity levels the
advantage of the TPFB-TAOS system increases, as the slope of the Economic
Tradeoff Function increases slightly, and at activity levels below 624 Space
Shuttle flights the advantage of the TSRM-TAOS system increases. In each
case the series burn PFB system is a third best alternative.
In Figure 0. 10, three alternative Economic Tradeoff Functions
are shown (for a 514 flight space program from 1979 to 1990) for three
different social rates of discount: a 5 percent rate, a 10 percent rate and
a 15 percent rate. At a 5 percent social rate of interest and accepting the
non-recurring and recurring cost estimates as given by industry, the TPFB-
TAOS is the most economic choice among all the technical alternatives. It
0-27

COST-EFFECTIVE SPACE SHUTTLE CONFIGURATIONS
S9 = TWO-STAGE FULLYREUSABLE SYSTEM
S7 = TWO-STAGE-FLYBACK
S5 - T PFB or SPFB (TAOS)
S2 = TSRM (TAOS)
S4 - SPACE GLIDER WITHNEW EXPENDABLESYSTEM
ALL DoD MISSIONSINCLUDED (624 FLIGHTS)
-SOME DoD MISSIONS-EXCLUDED (514 FLIGHTS)
S7
S5
S2
S4THE'MOST ECONOMICSR:CE SHUTTLECONFIGURATIONS
5 15
RECURRING COSTS (PER FLIGHT) OF ALTERNATE CONFI(MILLIONS OF 1970 DOLLARS)
GURATiCNS
Economic Trade-off Function for Space Shuttle System with 514Shuttle Flight Space Program (1979-1990) and 624 Shuttle FlightSpace Program
Figure 0.9
0-28
20
S9
8.-,-
z0
z
(/' tJ Zg
0
WW-
W (n
_ it
z _j
tip0< _ R
OC,
-JI-
Z0
zr
tr
0
Z
10-
5
0 I

COST-EFFECTIVE SPACE SHUTTLE CONFIGURATIONS
S9 = TWO-STAGE FULLYREUSABLE SYSTEM
S7 = TWO-STAGE-FLYBACK
S5
= T PFB or SPFB (TAOS)
S2 = TSRM (TAOS)
S4 = SPACE GLIDER WITHNEW EXPENDABLESYSTEM
r= .05O0+
5 -/ S2
THE'MOST ECONOCSPACE SHUTTLECONFIGURATIONS
0 I5
RECURRING15
COSTS (PER FLIGHT) OF ALTERNATE(MILLIONS OF 1970 DOLLARS)
CONFIGURATIONS
Economic Trade-off Function for Space Shuttle System whenSocial Rate of Discount is Varied from 10% to 5% and 15%(514 Shuttle Flight Space Program)
Figure 0. 10
0-29
201
15 + S9
U,z0O '
(DI-.
4
z00-
W W nIW C
Z J
) 0
- OUO. O Z U-I40
U) U)0 o, 0
0 aJz Cl-T
E -
crUt2Z.wzI0
means that at the relatively low social opportunity costs for investment
funds (as expressed by the 5 percent rate) it may be indicated to spend the
additional funds on more advanced booster programs in the form of pressure
fed reusable systems with the promise of a lowering in the cost per flight
in the operating phase of the Space Shuttle System. (Again, the point of
tangency determines the most economic Space Shuttle System along the
cost-effectivene s s frontier.
At a 10 percent rate of social interest, recommended by the Office
of Management and Budget, the TSRM-TAOS and TPFB-TAOS are about
equally preferred to all other systems with a slight economic advantage of
the TSRM-TAOS; both lie close enough to the slope of the Economic Tradeoff
Function that one cannot be preferred to the other based solely on economic
criteria. The TPFB-TAOS involves higher risks but promises lower operation
costs. The TSRM-TAOS involves lower risks and non-recurring costs but
possibly higher costs per flight. At a 15 percent social rate of discount,
that is with high social opportunity costs for investment funds in the 1970's,
clearly the TSRM-TAOS system emerges as the preferred Space Shuttle
configuration and possibly the only system, the development of which is
justified on economic grounds.
Finally, in Figure 0. 11, alternative Economic Tradeoff Functions
are shown, as the payload refurbishment and updating costs are varied from
30 percent of satellite unit costs to 50 percent of satellite unit costs, the
band of variation within which alternate payload refurbishment costs were
estimated by LMSC (Lockheed) and Aerospace Corporation as part of this
economic study. The Economic Tradeoff Functions all reflect a 10 percent
social rate of discount and an activity level of 514 Space Shuttle flights in
the 1979 to 1990 period. As shown in Figure 0. 11, again, the TSRM-TAOS
and the TPFB-TAOS emerge as the preferred economic systems over any
other Space Shuttle configuration.
Thus, the results of the economic analysis indicate, that the
"Parallel Burn Solid Rocket Motor Booster" Space Shuttle System (TSRM-TAOS)
and the "Parallel Burn Pressure Fed Booster" Space Shuttle systems are
economically the best Space Shuttle choices. Insofar as the "series burn
0-30

COST-EFFECTIVE SPACE SHUTTLE CONFIGURATIONS
Sg = TWO-STAGE FULLYREUSABLE SYSTEM
S7 = TWO-STAGE-FLYBACK
S5 = T PFa or SPFB (TAOS)
S2 = T SRM (TAOS)
S4
SPACE GLIDER WITHNEW EXPENDABLESYSTEM
PAYLOAD REFURBISHMENTVAIED FROM .30 to .50
/ S2
-THE MT SM CSPCE SHrTLE 'ca00O
S4
^ I .~~~~~~~~~~~'* ' r. I
5 15RECURRING COSTS (PER FLIGHT) OF ALTERNATE CONFIGURATiCNS
(MILLIONS OF 1970 DOLLARS)
Economic Trade-off Function for Space Shuttle System whenPayload Reuse and Refurbishtnent Costs are Varied from 30%to 50% (expected: 39%)
Figure 0. 11
0-31
20
15-
C')z0
-.4
0
LA.
zw
0
z _j
0I'
U.,-(n-
c.)
'J
ZI a: _
Q:
z0
D
tO+
5
S.?
- _ _ _-_
a - - ~~~~~-
0

pressure fed booster" Space Shuttle offers nearly the same advantages as
the TPFB-TAOS, it has to be considered as a third viable economic choice
among the many alternative system configurations. At very high social
opportunity costs for investment funds, the TSRM-TAOS is the clearly
preferred choice, at lower social opportunity costs for investment funds,
the TPFB-TAOS is preferred.
Insofar as a Space Shuttle development program can be defined,
the economic choice facing NASA seems to be between the development of
the Parallel Burn Solid Rocket Motor TAOS or a TPSB-TAOS with the TSRM-
TAOS as a technical fall back position, at some additional cost. A mixCed
development strategy by NASA may be the best development choice, and
particularly if a fixed funding limit were imposed on the Space Shuttle
development in the 1970's. Yet insufficient detailed information was
available to us to make any such recommendation between these two choices.
The TAOS concepts forego the development of manned booster stages
in the Shuttle System. With the use of thrust assist of either solid rocket
motors or pressure fed systems -- which can be made in part reusable for
low staging velocities -- the TAOS concept promises a reduction in the non-
recurring costs (RDT&E and initial fleet investment, Space Tug included)
from about $10 billion or more (two stage systems, including reusable
SlC's) to about $7 billion or less, with an acceptable recurring cost increase
in the operating phase of the TAOS systems. The decision between the
twin pressure fed and the series burn pressure fed TAOS Space Shuttle System
is basically a tradeoff function between the higher non-recurring costs as
well as higher risks in the development of the series burn pressure fed
booster as against the lower non-recurring cost, lower risk, but possibly
higher recurring cost per launch of twin pressure fed systems.
The detailed economic justifications of the TAOS concepts -- when
compared to any two-stage reusable system are:
1. The non-recurring costs of TAOS are estimated by industry
to be $7 billion or less over the period to 1979 or to 1984-1985 depending
on the objectives and choices of NASA.
0-32
2. The risks of the TAOS development are in balance lower but
still substantial. Intact abort with external hydrogen/oxygen tanks is
feasible; lagging performance in the engine area can be made up by added
external tank capability. A large reusable manned booster is not needed.
3. The TAOS's that were analyzed promised the same capability
as the original two-stage Shuttle, including a 40,000 pound lift capability
into polar orbit and a 60 x 15 feet payload bay.
4. The TAOS can carry the Space Tug and capture high energy
missions from 1979 on.
5. The most economic TAOS would use the advanced orbiter engines
immediately. Our calculations indicate that among the alternative TAOS
configurations an early full operational capability and high performance
engines on the orbiter are economically most advantageous and feasible
within budget constraints of $1 billion peak funding or less. (Also see next
section).
6. The TAOS avoids the immediate need to decide on a large
reusable booster and allows postponement of that decision without blocking
later transition to a fully reusable system, if and when desired. Thereby,
a TAOS eliminates or lowers the risk and potential cost overruns in booster
development.
7. The TAOS would use "parallel burn" concepts which, if feasible,
may change the reusable booster decision. Of course, a TAOS orbiter with
a series burn pressure fed booster,is also possible.
8. Technological progress may make the expendable parts of the
TAOS system (involving mainly tank costs, and thrust assisted rocket costs)
less expensive thus further aiding TAOS concepts when compared to two-stage
concepts or fully expendable concepts.
9. The TAOS funding schedule makes an early Space Tug develop-
ment possible. The Space Tug is an integral part of the Space Shuttle System
and may be developed by Europe.
10. The TAOS assures NASA the major objectives stated previously
of a reusable Space Transportation Syste-m.
0-33
0.4 FUNDING CONSTRAINTS: THE DEVELOPMENT OF THE SPACE
SHUTTLE SYSTEM AND THE PROJECTED BUDGET FOR NASA
The space programs analyzed in both the May 31, 1971 report as
well as in this report are well within the budgetary limitations of the U.S.
space program of NASA and the Department of Defense in the 1960's for the
unmanned space program as well as some reasonable, conservative exten-
sions of these activities for the 1980's. The particular mission model
provided by NASA, which includes a set of missions for the Office of Space
Science, the Office of Manned Space Flight, and the Office of Applications
of NASA, as well as for the Department of Defense, are described later in
this report as well as in the work of Aerospace Corporation in support of the
present study. As in the earlier May 31st report, wide variations were
applied to the mission model and programs supplied to us by NASA and the
Aerospace Corporation. In all, close to 200 different mission models were
examined over the past six months.
Underlying the conclusions of this analysis are first, funding require-
ments for a thrust assisted shuttle with an Initial Operating Capability (IOC)
date of 1979 as identified in the selection of the most economic Space Shuttle
System, and second, the mission model of 514 Space Shuttle flights in the
1980's including NASA, the DoD, as well as commercial applications. For
each of the major alternative systems, that is, the competing expendable
systems versus the most economic Space Shuttle System, i. e., the thrust
assisted orbiter shuttle, a detailed analysis of the life cycle costs of each of
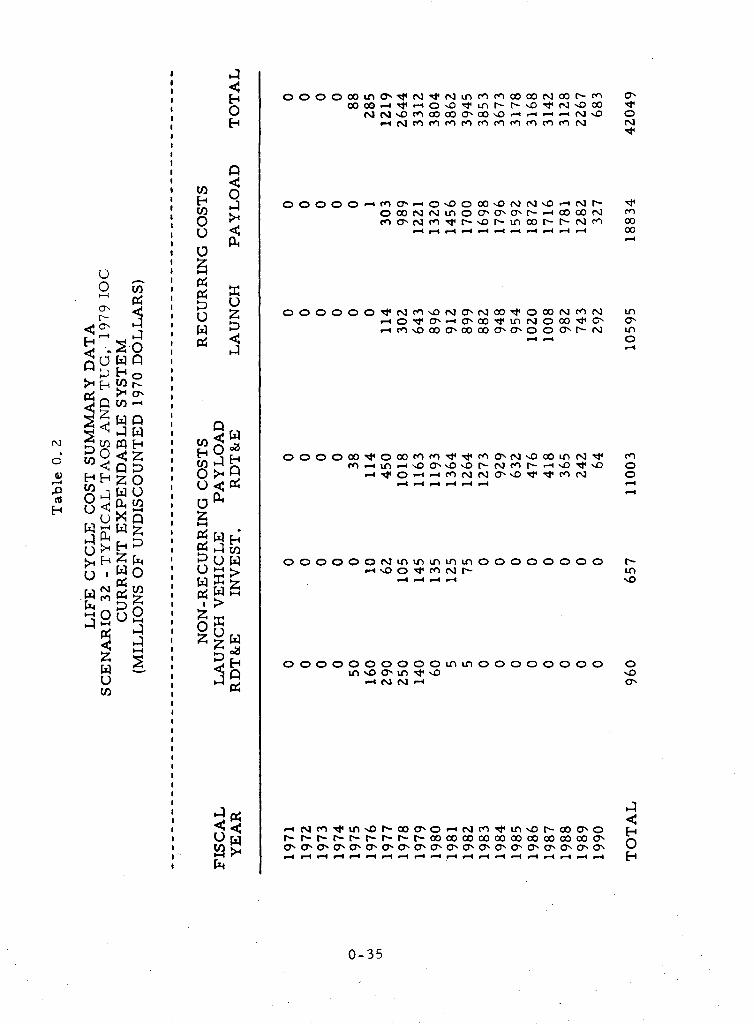
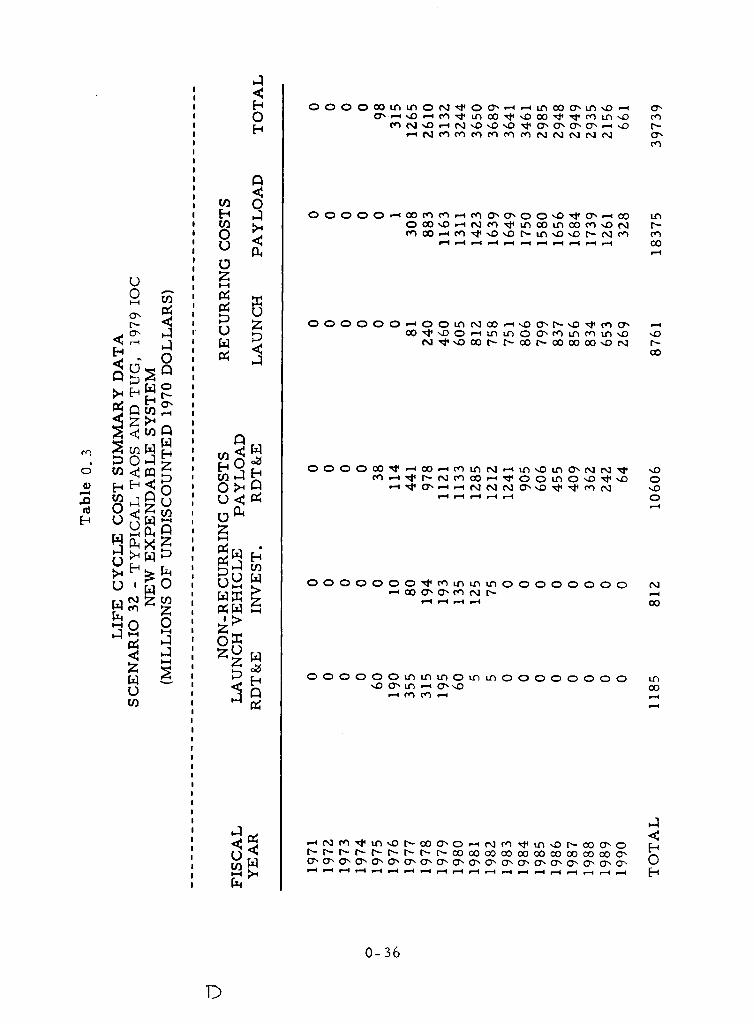
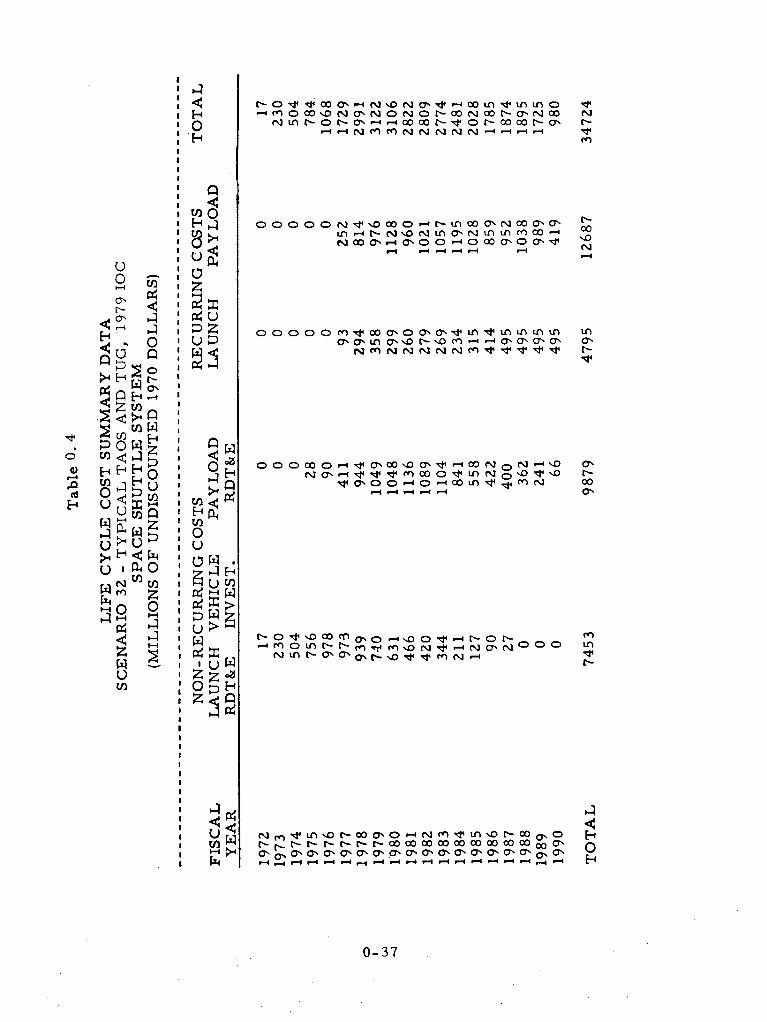
the systems was undertaken. Tables 0.2, 0.3, and 0.4 describe the detailed
life cycle cost summary data for the period of 1972 to 1990 (fiscal years) for
the current expendable, the new expendable and the thrust assisted orbiter
shuttle transportation systems. The thrust assisted orbiter shuttle system
considered was a typical system among the TAOS systems identified earlier.
In each of these tables, annual total costs of a given typical Space
Transportation System are divided into non-recurring costs and recurring
costs. Both of these costs are then sub-divided into launch vehicle and pay-
0-34
,-1
0H
03
U)0V
0zI-4
Uro[.,.
V0
>. H tn
, z.
N m
H0 Z EQ ° UH
0*
H~~
_Ua
U ,
0
Uz
0Q,o ¢ C
O,--IU P4
z
1- >
rO Z o;
¢ X.
oN MM mo Mm M Mm M M N
a0 X- 4 -o ~N m
0000 N N N0 o C 0 0 _ _ _
o00000 00 N t 00 I' 00 - N
0NN NL 0-c~
- -4 -4 - -4 -4 4 - - -
o cD o oi4 N rn sp ao N oo qt o oo N c4 N0 C a, _ o I t Ln N O00o, 4 a,er mO wO aOCOO' 0 o' r- N
O OO00 CoO 0e 0L A N(9sDXS m n ur _o oD 0o sD r- m m r- _- s I'sD
0 O - r- M N 1 a, sD '1 t tM tr- 14 1-4 -4 1-4 r-
0 0 000 O N A LA L L L 0 0 0 0 0 0 0 O
_ - D 4 -O -q
10 %o a, *fn 4 so_ N N-4
-L N M a0L r- o a, o _ -t D - 1 O a, 0rB Co r> F >oco o oOoo ocoo Xoo'aos a, a, a, a, C os C% a, a, a, a, os a, a, a, a, a- cx of
_-_ -__- -- _-_- 4 4 - -------
0-35
0
N
(,)o00-4
Lr
Ln0
fn
0
o,
0-4-4
r-L).0
a'%O
H0H-
IIIIIIIIIIIIIIIIIIIIIIIIIIIIIIIIIIIIiIIII
IIIIIIIIIIIIIII
IIIIIIIIIIIIIIIIIIIIIIIIIIIIIIIII
H,-3[-40H
ouI--I
oNa,-
H 0'E-4
z
5:3 0 Z~
H ¢V> a
Ut¢
-- 4
VI o
<: 0
U)Li~
II
I
I
II
II
III
II
I
II
I
I
U3HU[0U0z
oO
u-4U
Q
0p4
O
z
O~a
Uzh;U) -- X-4
a; zz
~Z:
I--I
W
,:>
¢ ¢
0000cc00mo mqt q a, -4-L wa, o -4o~~a o,- oo o x 4 u) o ,d4 o w- _ u i, oo os o 0M _ % -_ 0e - o 00 N a0, C a, n *n-4 co
occ N M(Ym f)"IM ~c~cq N ) N- 00 en (n -4 m D d4 ~ 0 0o 't 0>1,- 0D
o o o-4 o o- _ % r ID ro aJ N o1-4 -4-4-4 -4 -4-I--4 - -4
O 0 c0 - N O U r0 CY, r ID mN00 't c D O N -4 U On e n n in O0
N 14 %0 O 0 Ir 00 I- 00 00 00 sD N
O000c -O c O -40 _ -4L N _1 ' O UN rs tr mJ- 1 t Nq m 00 L A O NO t 'o
4 C -_-4 - -N N 4-4 v v (n N_I _- _I _4 -
a,
oN
r-
Ln
o,~
r-o0-4
.oo
-4
o
00
NO0-4
0000000 LALALAOte )OO O O0 O O O O N- 00OONaa J N -_
-4 _44 00
00o 0 0 0 on A 0Lo Ln A o o o o o o oDO a, Ln -_ O No
- en Ce --
OOOOOOO~ cONLAOOO OON0
N N en *n D r o N O N cC It c o [CO 0N 0t- r- r r- - r- r- t r- 0o oo oo oo 00 oo co oo 0 0 GIC' ONs oNO ON 0' o0'Dcf z Nooi ONOO OO ON ON ONNoN ONO-4-4-4-4-4-4 -4 -4 -4 -4 -4 -4 -- 4 -4 -4 -4 -4
L*cO-4-4
H0H
0-36
TD
L U)
0r ,-40'.
N t U)
o
oo
" U 0
EE-
UzZr,) .I~
,~o -
o
'02;
I 4:
aUQ
,0
¢
uz
a-.
a 4:
la
I 4-4'* z
H
F~
En
H
4:
o Oi 4 m ,-- o0 ms>s o, 0 +4 m un d tn In o-MeO M D 10 0 C% MO MO c- 00 N rl a mm0__N N N NN N a,-4JNN-4-4~~~~~-4 -I-4 -
O~ ~~ OD O QO1 0XO -4 t- t) 00 a, m °O 0 a0LA -4 E-- N\0 N LnaNL Ln 0 -4
- -- 4 1-4 -4 -4
00000 O0O 0 ' a OO o o oo cnqt oo c, 0 co 07,I Ln u, tn Ln uL un oon Oa, 0 a -',o e- - - a'oo\a c'
N M N MN N N M ~ 1 It t
00o o oo _ o a, CD N N a-4 'd, " M M ° -- o - - -,t a, o a -o aW unjlt
Nr-
I'.
N
'0Na-
Ur)
0 ~
00oo
(b On % D w Mn a, 0 -D O t _4 l-O r- -4 o t m r- ,- M -e M o "' t -4 N CY% Ns o o o In
" m) r- c7% 0"a, o t 44 m m - ' ,, '4u-aNON
N M 'I um 1- r- w D as o-N M,1 Ln t- o a, cx> rl t- r- F (- t- t r oo M oo x oo M w co 00 a,CY c) c, , a , c, a, o a, a, a, s cy- a, a- a, a, r cy, Ca
4 -4 -I-4-4 -4 -4 -4--4-4--4-4 -4 _ -4
-1
H0H
0-37
Ii

load costs. Furthermore, for non-recurring launch vehicle costs of expend-
able systems, the RDT&E costs and the investment costs are identified
separately. For the current expendable and new expendable systems reported
in Tables 0.2 and 0. 3, the RDT&E costs, the investment costs for the launch
vehicles were identified separately year by year for a 1979-1990 space
program. The research and development costs basically concerned the
development of a space program to maintain the option of manned space
flight in the 1980's. The investment costs are the costs associated with
producing the necessary vehicles for launch operations in the 1980's. The
actual launch costs are shown under the recurring costs. In obtaining these
cost estimates the payload costs for NASA (the Office of Space Science, the
Office of Applications, the Office of Manned Space Flight) as well as the DoD
and commercial applications were separately identified and costed. Notice
that the estimated costs provided in the tables are based on a particular space
program known as the reduced baseline mission model with 514 flights,
covering the period 1979-1990. The costs of all space missions for the period
before 1978 have not been included. Since the new Space Shuttle System is
not expected to be available before 1979, these earlier missions would have
to be accomplished by an expendable system regardless of whether a new
Space Shuttle System is to be developed or not.
The current expendable system exemplified a typical space program
along the lines of present knowledge and reflects the potential of space
applications in the 1980's. The cost data of such a system are presented in
Table 0.2. In our cost effectiveness analysis, the other systems were re-
quired to compete against this known technology. The major systems con-
sidered are a new expendable launch system, that includes major modifica-
tions and adaptations of payloads to better provide for the needs of space
transportation in the 1980's, and the Space Shuttle System, in this case
particularly, the TAOS. Table 0. 3 shows the comparable life cycle costs,
non-recurring costs as well as recurring cost data for the new expendable
transportation system which basically represent an extended Titan III
system adopted for both lower payloads as well as very large payload launch
requirements. Finally, in Table 0.4, the cost data of a thrust assisted
orbiter shuttle system (TAOS) are provided. It must be pointed out that many
0-38

alternative space programs were also analyzed on a mission by mission and
a launch by launch basis, each implying different budget levels and activity
levels for the 1980's. We believe that these tables represent a likely, and
possibly, somewhat conservative, outlook for the space activities in the 1980's.
In Figure 0.12 the annual launch and payload costs of the new
expendable system and the Space Shuttle System are shown for the period from
1972 to 1990 for a typical space program of the period 1979 to 1990. As one
can see from Figure 0.12, a considerable part of the space program costs for
the space program after 1979 has to occur with either system before the IOC
date of 1979. This is due to the fact that payloads to be flown from 1979 on
have to be developed and built in part before that time with a usual lead time
of between 3 and 5 years for individual payload programs. Similarly, the
necessary launch site as well as new expendable or shuttle payload fleets
have to be developed. It is therefore only the shaded area representing the
budgetdifference between the new expendable system and the Space Shuttle
System in the period before 1979 that shows the potential net budget impact
of the Space Shuttle decision on the NASA budget requirements in 1970 dollars.
On the other side, the shaded area of the 1980's shows the net cost difference
that a Space Shuttle System would imply for a national space program in the
United States along the activity lines outlined in a 514 flight program. It is
the expected cost savings in the 1980's and beyond that have to justify the net
investment cost outlay implied by a Space Shuttle System, in this case the
TAOS system of the 1970's. The overall economic margin within which
such a decision will have to be madewas fully reported in the May 31, 1971
report.
However, by inspection of Figure 0.12, it is also apparent that
all the costs shown are only related to a space program after 1979. Between
1972 and 1979 a continuing space program of NASA is of course planned and
will take its course within very limited and very restricted budget considera-
tions. The overall question was, as formulated in the May 31, 1971 report,
whether the additional expenditures, or "hump" problem of the Space Shuttle
decision could be important with regard to the NASA budget. As a result
of this effort, we have undertaken an analysis of the net impact of a Space
0-39

rN o . 'D M -r -" O o N ' D 00
' . L. . . 1
000 oO LA L' 0O' -, 0-
-_ N
N O 4'0 M O -N . 0 a O M - .4'
N LA' IDr LA M
0 0 CO L^ a, 'CO OD -_
N N ID- N
N 0. V 4r cM a,en~ 0 co '0 NT a'N LA N 0 N. oa
- - N
*0 Cw C O _ O t_ "I L^ N1- a '
- (4 N CO 'o C_ Ln 0 r- V en -- co c_ C0 O a'r a' 0 a' V c
I I I I I I I I I I I +
.^ 0 a' - - L a , a L^ 0 -1 .4 1A C .. 'o C_ 4 r 4L ID
- N'0'0C V a, a, a, a, -"en men M M M N N N N N
(I
C.,0'
. II I I -1H 1-
in
W
N.4.
U)
w.
0 C. °0 CY N 0 ( Co (. N Na'a,'I r- a' LA C'o M V4 a'
- .1 O-0-- m N N L (N
I I I I I a I I I I I +
0 iN V N .e~ ooCD N 00 r. C
E-4 o ,t Ln ur r- ' vo N ID o v ¢ O 00 a 00 'O --- 0-- I O
N
C tf. ___
N ID N 0'.4 _ C^ UL .4 Ln LA 0N 0 N o rCO N CO N 0' N cM
-- -C O C O N . 0 N O C O N +} -W wr- v ol lB r c - w wr (IN
r-
en
0-40
!U)II
4)
14
4)$4
4.Q)bo
.la03
wU
to)II
I.4)4)l.i4
4I4)bO10
m
4.IDCO
.4)m
4$
c.0
a0
mw
S1
,0
(4r.44)0.
w4)4)
$40
8o0
.4)
U)
uaO0a
z
H
to!
HU)z
94 4
EU)
EnO
X ' 4
ow
CZ¢
b Po
$4 44.
@ S
00(4(4a 'v 04 C L1O
a'.O 4) 4
a.~
- $4 a U
o mc
.. r >
4. w '.
4. )
$44.
4.n
0( (4
U d g:°
00 14
0aa
0 .c
e o 10
0co
.4)
-4) ba4.
4if.
.0
xU 9 O
003
$ 0
0U '."0
t o*
(4 $4) 0 .
4.4)
Urn
4 . > o
. O cO cd°
0, 0
4) -4.
0 oIL0 * $4
(0~41) '4'.0
H 0 O *
.~~~~~~~~~~~~~~~~~~~~~~~~~~~~~~~~-
" tNor- W 0N0 N &I COCCOOCLn cCOO
- -- - - - . - --- - ------- 0______ _________h__ __ _____________ H
IIIIIIPiI

z~Fw~~~~
a w
w IP z~~~~
8 . W
.la
0~~~~~~ Z
z ~~~~~~Irk- -w
(SWT100 WAL AI~lOWf iO ornus)oeX 0"4LLG M~d SM "*-:.
0-41
aLiz
0 acoa c )
LL,~~~~~~~~~~~~~~~~~~~ i
n~ow 3~S O6I-6- I
~
.dnI JSO0 Tic.A be As
'~ :° °IT3I~~~~o6 CY.. ~SO)w~~~~~~~mlOi :~d di-d~~iO:z~~~~~.-VM JO ~1J a~ ~ ~md ,I
0-42

Shuttle decision. In Table 0.5 the cost differences between a Space Shuttle
System and a new expendable transportation system are shown from the
years from 1972 to 1990, in terms of millions of 1970 dollars. In Figure
0. 13 the net cost differences between the Shuttle System and the new ex-
pendable system are shown again for the years 1972 to 1990. We take into
account that considerable expenditures, mainly associated with the develop-
ment of new payloads, are also associated with the new expendable or
a current expendable system for a space program starting in 1979 and
lasting until 1990. A fully operational space program (launch vehicles, pay-
loads and operations) from 1979 to 1990 implies substantial expenditures
before 1979 and a gradual tapering off of expenditures for the period 1988
to 1990, as shown in Figure 0.12. This tapering off of costs and benefits
around 1990 makes the data for these years somewhat misleading. The true
expenditures in these later years would be at about the same level as the
mid 1980's, but most of them would be associated with flight programs in
the 1990's and can therefore not be included in 1979 to 1980 Space Program
costs aid benefits. The overall net cost impact between a Space Shuttle System
and an expendable system is considerably less than the overall development
cost and investment cost of the Space Shuttle alone would indicate. It is this
net cost impact that is really associated with the option of developing or not
developing a Space Shuttle System and not the absolute costs of the Space
Shuttle System as shown in the life-cycle cost of Table 0.4. Notice that
cost streams as shown in Tables 0.2 to 0.5 as well as Figures 0.12 and 0.13
do not include any allowance for space expenditures in the 1970's that are
related to the space program of the 1970's.
In order to assess the impact that a Space Shuttle investment might
have in addition to the potential NASA expenditures for the 1970's, we attempt
a completely new approach in order to determine or project what the likely
NASA budget might be in the 1970's. As reported already in the May 31, 1971
report, there are many factors that affect the budget of an agency like
NASA and that determine the amount of space activities that a nation like
the United States can carry on. The past NASA budget and the development
of the trends of the appropriations for its individual offices are only some of
the many variables that influence such a decision and outlook. There are
0-43
several other very important economic variables that also determine the
overall level of NASA budget projections and of the national space activities
in the United States. Among these, general economic conditions and,
in particular, the overall level of federal purchases of goods and services
as well as monetary conditions (e. g., the rate of inflation) have important,
though indirect, effects on the ultimate budget that NASA may expect. In
addition, there are political decisions (as for example the decision to land
a man on the moon in the 1960's) and institutional considerations. Neverthe-
less, in the report we tried to develop a macro-economic explanation
of the expected NASA budget if only economic conditions were to determine
the NASA budget in the 1970's, taking into account the past history of the
NASA budget in the 19 6 0's.
To a large extent, the formulation of a long-range program, like
that of NASA's space program, must necessarily rely on our knowledge
of the two-way relationship between the national economy in general and space
activity in particular. Furthermore, whether a particular long-range space
program can be successful depends largely on our ability to gain such know-
ledge and to apply it to obtain reliable forecasts of economic conditions and
space activity. If plentiful resources are available, space activities can be
expected to increase. If on the other side, the demand for national resources
is high when compared to their availability due to the existence of many other
national priorities, the general level of space activity can be expected to be
less than under the first hypothesis. It must be realized however, that an
economic analysis would naturally have certain limitations since it does
necessarily involve numerous simplifications.
Despite these limitations, we hope to have demonstrated that
macro-econometric approaches to projecting national space expendi-
tures can provide useful information for a rational long-range planning of
space exploration. In order to project expected space expenditures, as a
function of economic conditions in the 1970's, a macro-econometric model
has been formulated. Emphasis has been placed on the possible influence of,
economic conditions of the level of the space budget. Furthermore, we have
also attempted to show how the future economic conditions may be affected
0-44
by different fiscal and monetary policies. By investigating the possible
relationship between the level of the space budget and economic conditions,
which to some extent may be affected by governmental fiscal and monetary
policies, we hope to have demonstrated that a suitably formulated micro-
econometric model can be useful for investment decisions in long-range
planning for various agencies of the federal government such as NASA.
The macro-econometric model implemented in the present report
is a dynamic system of 28 equations which includes 8 equations for the govern-
ment sector dealing with both receipts and expenditures. In addition, this
system of equations includes not only the relationships of production, con-
sumption, and investment activities, but also the relationship of wage and
interest determination and personal income as well as corporate profit. The
econometric model with the parameters estimated from annual observations
from 1929 to 1941 and 1947 to 1964 was evaluated by comparing several alter-
native simulations with the observed values from the period 1965 to 1970 and
found to be reasonably satisfactory. In particular, the simulation results
of the government sector were found to be significantly superior to those of
trend extrapolation of a more conventional single equation model. Following
the evaluation of the model, several alternative simulations were made for
the period 1971 to 1980. Both short term and long term projections as well
as the implications of alternative fiscal and monetary policies appear to be
quite reasonable.
Finally, the alternative simulations for the period 1971 to 1980,
representing expansionary, neutral, and restrictive policies, respectively,
were then used to project the future space expenditure. In order to achieve
this purpose, we demonstrated that the level of current space expenditure
may be explained not only by the level of past space expenditure but also by
the level of government spending in general and other economic conditions such
as the rate of inflation. Based on such an additional empirical relationship
obtained from the annual observations of 1958 to 1969 together with alterna-
tive simulations of the econometric model, several alternative projections of
the level of space expenditure were provided for the period 1971-1980. It is
found that under the expansionary policy with relatively high rates of inflation
0-45
the projected level of space expenditure is generally lower than that of the
alternative restrictive policy. According to the neutral policy, the level of
space expenditure is expected to rise gradually from $3. 3 billion in 1971 to
$4.1 billion in 1980 (in terms of 1970 constant dollars). According to the
expansionary and restrictive policies, the level of space expenditure is
projected to rise from $3.2 billion in 1971 to $3.7 billion and $4. 6 billion
respectively in 1980 (again, in terms of 1970 constant dollars). Among the
alternative projections, the results of the most conservative projection (in
1970 dollars) from 1972 to 1980 are shown in column 1 of Table 0. 6. As
seenfrom these projections, the budget of NASA would not vary substantially
around an average of $3 billion in the 1970 period with initial projections of
slightly below $3 billion using 1970 dollars ($2.91 for 1973 and $2.88 for 1974).
We once again stress that this restricts itself to economic factors. However,
the inclusion of several possible economic futures will hopefully account for
political considerations implicitly.
In analyzing the impact that a Space Shuttle System would have on
such a projected NASA budget level, two alternate extreme approaches are
possible within which the decision would have to lie: first, the total net cost
impact of a Space Shuttle development may be added to the projected NASA
budget, considering the previous projections as the levels that one could
anticipate without such a major decision like the Space Shuttle System develop-
ment. Column 2 of Table 0.6 shows the cost difference of the Shuttle over
the new expendable development in the 1970 period for the space program be-
tween 1979 and 1990 as shown in the' previous tables. This column, when
added to column 1, gives the maximum expected NASA expenditures in column
3 of Table 0.6. This would be the maximum expected budget even with a
Space Shuttle development of the type of a Thrust Assisted Orbiter Shuttle (TAOS)
analyzed and identified in the previous sections. As shown, any of the pro-
jected budgets for the 1970 period would not exceed $3.77 billion. Of course,
the closer one gets to the year 1979 the more of the total NASA budget will
be taken up by activities that go to the planning, preparation and initiation of
programs beyond 1979 as shown in the previous tables. On the other side
one could also take the other extreme view regarding the projected space
0-46

expenditures shown in column 1 of Table 0.6 as the absolute maximum that
NASA can expect with or without a Space Shuttle System. In this case, the
net cost impact of the Space Shuttle would have to be subtracted from the
projected space budget as shown in column 1 in order to arrive at the
remaining resources that NASA will have after an affirmative decision on the
Space Shuttle is made. The remaining budget for other operations, there-
fore, is shown in column 4 of Table 0.6. It also implies the margin that
NASA is giving up for the period before 1979 with a development of a
Thrust Assisted Orbiter Shuttle. Again, a substantial part of this budget
will be taken up in the later years of the 1970' s for activities and missions
that have to do with space programs in the period of 1979 and beyond. The
net impact of the Space Shuttle decision, however, is again only the net cost
difference between the Space Shuttle and the new expendable system since
both of these try to meet equal capabilities as projected for the 1980's.
The economic projections of the NASA budget as well as the
mission model used to analyze the Space Shuttle decision lend themselves
to surprisingly strong conclusions. Since the mission model analyzed
for the 1980's was done with activities of the 1960's of the unmanned space
program as a baseline, one would have expected some agreement among the
projected space budget activities of NASA and the activities in the 1980's.
Yet the close agreement and relative stability of the NASA budget for the 1970's
which were arrived at on an econometric statistical basis and the 1980's
budget under the new expendable system which were arrived at by a mission
by mission and launch by launch planning basis lend very strong support to
the economic conclusions drawn here. Figure 0. 14 shows on one side for the
1972 to 1980 period the projected budget level under the new expendable
system of space transportation and the activity and mission models as given
to us from the space program of the United States for use in this analysis.
Of course, many external factors will influence the overall level
of the NASA budget in the 1970's as well as the level of U.S. space activities
of the United States in the 1960's. If a decision is made to go ahead with a
substantial manned program for the exploration of the moon or the planets
in the 1980's, then these manned space flight activities would have to be
0-47

z A
o
0 m
,-1
0
o i o-
>.A
¢ 0
o¢ o0-H V I-4
PO4
* 0
u _
.4.'
V 4
;.4 44 Cd
4 9 P
w -_-4
0)e
+4 U)
rt 0Q 0 .X C
N
Cl)
-4
-4
-u Nr -
·)
a) _i-
to-o
-4.
.) 0-bu
'4l)
.'- 0) 0o C4
'. 4 0au Pa da.s) 9
°,- 0)0_ t
NN
SD I0 un 0 ,D m4 - C0t4 m un v u) m Ln q
11 .4 .l .4 *l .l .4
cc cc cc N9 N F N cc 0D0 c N N 00 0' N
e~ N N N N N N 0
N r- oo oD FooornoN r co i un c0 or so
N Ln 'OD r On 0-4
O - 00 -4 N O O O OM N N N a, - ( V t-
N4 C~ 4 cLA SC) N4 cc; a' 0N N N N N N N N cc
m 0' a r r' w 0o- -4 a, --a, 4- a% o- o4
-4 -4 V-4 -4 §-4 -4
0-48
*I
0
2~~~ji 0
o*
4 Q
(SWl.IM OL °f. IjmOIIQ i Nr )066t-U6 ,SO* wob -M
.0-49
-J
o0 0
co cl
21 0
LJ
1 ILI
!M 0a Ui
F) T
0
o _cw W
8 IL
o.
added to the projected alternative space budgets (Shuttle versus New Expen-
dable) for the 1980's as shown in Figure 0.14. Similarly, other factors
could influence the projected U.S. space activities in the 1980's either
through new technological developments, international developments, or a
decision to forego any manned space flight. Within these projected alterna-
tives, we regard the space budget shown in Figure 0. 14 to be conservative.
If alternative one in the previous discussion of the impact of the
Space Shuttle were taken as the baseline, i. e., the net impact is added to
the original projections of NASA budget, then Figure 0. 15 clearly shows
such a consequence. The figure shows first, the projected space budget for
the period from 1972 to 1990; second, the net impact by adding the differences
of the Space Shuttle System over the new expendable cost system for the
period of 1972; and third, the part of the NASA budget taken up, in the 1970's,
by the Space Shuttle System and payload development required for the space
program for the period 1979 to 1990. As shown in Figure 0. 15 through 0. 18,
a decision to build the thrust assisted orbiter shuttle in the 1970's would not
impact dramatically on the overall level of space expenditures, as was pre-
viously the case with the two-stage Space Shuttle System analyzed in the
May 31, 1971 report. In Figure 0.16, the total of the funds taken up in the
1972 to 1980 period by the Space Shuttle development as well as the payloads
for the 1979 to 1990 period are shown separately. In no case do the antici-
pated program costs in both the launch vehicle developments as well as pay-
load cost developments exceed the econometrically projected space budget
for NASA in this period.
If the other view were taken, that is, the economic projections of
the NASA budget are the maximum funds that NASA can expect within the
present environment of the United States economy, a hypothesis not at all
unreasonable, then the net cost impact of the Space Shuttle decision on the
NASA budget is shown by Figures 0.17 and 0.18. The total net cost difference
is subtracted from the projected space budgets of NASA for the period of 1972
to 1980. Again, the dotted line in Figure 0.18 shows the total funding that
the Space Shuttle as well as the development of the payloads for the 1979 to
1990 period would take up out of this total. Again, a compatibility is found
0-50
C(

So0°~~ - eWJf .>if \\ <
z4~~~~~~ unzujVwz~ I
i D O., I \ I I i (,it ,.C'x',i
~~~~~~~~~x L_~_l j I _ B a, I D! ' ' I -
oU- J |:I : : : t
S >. 0.
C 0 0 0
Z U ~ ~ ~ ~ AU
VJZ~~~~~~~~~~~~~~~L
>~~~ 5: 0
(SEV11O02.61 CN3,.N -10 SNOi-IlI~)066-Z61 'SS 90d 33dS NN
a f~~~~~~~~~~~~~ f24
F- ODI-LI'1SZ I~9Oi 3dSTfN'
8 i 4 cn0 ht-<0 I i , *
U)CC 81 ODi!
or F
uj~~~_m
w ,
WE ZW F I
° o wM 1 - i --
0oe WM~aA
ca.~'-0
OW ~~~~~--
I~t
CD
~~CflZ0)~~
ow LU I
zw
~ 0 0 0 0
C Wins.Lf31_)o O 0 C)o
vi SP oi
(SIV"100O OZ6; 3 INnOXT3SiCiNn JO SNOi Ille)0661-S6l 'SiSOO3 AYiEOcd 3-)vdS 1vnNNV
O -

LO< x 0 1
o_ 0
w ~ ~~~~~~~~ 8 IC..)-
wo z S [.~ ,.-.
Z(a- OD,
0~~~ 0 0
0~~~~
--
.t~~g ,, ~ oI --- ..._
z z CO z7a:::R
o 0 0 o
(S.0U ODo61 ',lNOO SI'0W k SNOilIS)0661-ZL61 'S±S03 VE90 d 33VdS Vft4P4V
0-53
003
WX)'
ZWI
g_ ,o
FE: a ny SiM, ;<t XI I0
WC<~~~~~~~~~~~p<
Zw ~~~~0
-i Z \ii
'!t o > C
MI--Z o
z 0 w ~~~~~h-09
WZ
(nor - o ', ram
o~~~~~~r
~W~(Sl' O61 IlOS]N SNOI1)
0661-Z61 'SJS 90 33VS NN
D Q~~~~~~~~~~~~~~~~~~~~ X~cn -- !r.-.~
0 1 00 C- 0 < w~~~~~~i ~
(SV1Q t1Q.L~O)IQf OSNIISO66I-~~L6I 'SJ.SO2 ~SQ~~-4 33~dS C/) NNV
O- 5,4

between the econometric projections of the possible NASA budget in the 1970's
as well as the detailed cost estimates for the Space Shuttle System and the
required payload development for the 1979-1990 period. All the other
activities of NASA, of course, would have to be financed out of the remainder
between the total projected NASA budget and the total Space Shuttle develop-
ment funds as shown in Figure 0.18. In each case, that is either Figures
0.15, 0.16, 0.17 or 0.18, the projected budget for the 1980's is shown for
the New Expendable System and the Space Shuttle System assuming an
equal capability approach. The difference, i. eo, the direct cost savings
expected from a Space Shuttle development is shown by the shaded area. It
is the cost savings that justify the added outlays and expenditures in the 1970
period for the Space Shuttle development.
While in the May 31, 1971 report, the total non-recurring cost of
a Space Shuttle System development of $12.8 billion or more was a consider-
able problem with regard to the NASA budget required in the 1970's, it now
seems that a development of a TAOS Space Shuttle System, including a Space
Tug and the required launch sites, may well be within reasonably projected
budgets for space activities in the 1970's and 1980's.
Thus, the crucial questions that remain are:
First, what are the expected levels of space activities in the 1980's
beyond or possibly below those projected in the present mission models for
NASA (The Office of Space Science, the Office of Applications, the Office of
Manned Space Flight), the Department of Defense, commercial applications
and potential foreign demand for United States space transportation services.
It is ultimately these objectives as exemplified by past as well as future ex-
pected space activities that go to justify the development of a new, reusable
Space Transportation System. If the activity level in the 1980's or beyond
were to increase substantially, the development of a fully reusable Space
Transportation System (i.e., using a reusable Flyback booster) in the 1980's
or 1990's may be justified, again on a cost-effectiveness or benefit-cost basis.
Second, the choice of the most economic booster assist remains
open. Among the alternate configurations identified to lie within the region
0-55

of the most economic Space Shuttle configurations, there remain uncertainties
as to the most economic booster that should go with the development of the
orbiter. The choice seems now to lie between three alternate, substantially
different systems, all of which should not influence the basic orbiter decision:
(1) a (Twin) Parallel Burn Solid Rocket Motor Booster System, (2) a (Twin)
Parallel Burn Pressure Fed Booster System, (3) a Series Burn Pressure Fed
Booster. Overall, it seems that a minimum non-recurring cost program and
minimum technological risk program for the 1970's will favor a Solid Rocket
Motor thrust assisted orbiter shuttle system. On the other side, pressure fed
systems of either the twin pressure fed type or the series burn pressure fed
boosters may be justified if the technological risks as well as the higher non-
recurring costs are justified by confidence in the estimated lower costs per
flight and higher activity levels in the 1980's. Thus, the ultimate decision
among these boosters is an economic tradeoff decision among non-recurring
costs, development risk, activity level, and the level of the social rate of
discount (the opportunity cost of economic funds) in the 1970's and 1980's.
0-56GPO 930.321