Embed Size (px)
Citation preview

8/12/2019 Math Mod Ph Data
http://slidepdf.com/reader/full/math-mod-ph-data 1/36
MATHEMATICAL MODELING OFPHARMACOKINETIC DATA
DR. SHIVPRAKASHMANAGING DIRECTOR
SYNCHRON RESEARCH SERVICES PVT. LTD.,AHMEDABADINDIA

8/12/2019 Math Mod Ph Data
http://slidepdf.com/reader/full/math-mod-ph-data 2/36
PHARMACOKINETICS- DEFINITION ANDSCOPE
Pharmacon =drug and Kinetics =movement
Mathematical description of biological process affectingdrugs and affected by drugs
Important:
• Design and development of new drugs• Reassessment of old drugs• Clinical applications (Clin. Pkinetics)• Evaluating bioavailability and bioequivalence

8/12/2019 Math Mod Ph Data
http://slidepdf.com/reader/full/math-mod-ph-data 3/36
SHEMATIC REPRESENTATION OF ADME AND PD OF A MOLECULE

8/12/2019 Math Mod Ph Data
http://slidepdf.com/reader/full/math-mod-ph-data 4/36
REASONS FOR MEASURING BLOODLEVELS AND URINARY EXCRETION
1. Is the drug absorbed and to what extent?2. Do other things interfere with absorption of the drug?3. What is the nature of the dose response curve?4. How do levels obtained with different routes of administration
compare?5. How is the drug eliminated and how fast?6. What factors affect rate of elimination?7. Is the pharmacological action due to the parent drug or a metabolite?
8. Is there a correlation between pharmacologic response and pharmacokinetic data?

8/12/2019 Math Mod Ph Data
http://slidepdf.com/reader/full/math-mod-ph-data 5/36
WHY DO WE TRY TO FIT DATA WITH EQUATIONSAND DERIVE KINETIC MODELS?
1. To summarize observed data- data exploration2. To increase understanding of the process or processes
involved3. To be able to make predictions4. To compare several drugs with similar pharmacological
actions5. To quantitatively relate biological activity with
pharmacokinetic data

8/12/2019 Math Mod Ph Data
http://slidepdf.com/reader/full/math-mod-ph-data 6/36
COMPARTMENT MODELS
A model in pharmacokinetics is a hypotheticalstructure which can be used to characterize with
reproducibility, the behavior and fate of a drug in biological system when given by a certain route ofadministration and in a particular dosage form.

8/12/2019 Math Mod Ph Data
http://slidepdf.com/reader/full/math-mod-ph-data 7/36
PHARMACOKINETIC MODELS
Model parametersfit to priori
4-20Physiological
Model parametersfit to data
1-3Compartmental
Curve fitting to
data
0 Non-
compartmental
MathematicalCharacteristics
No. ofCompartments
Type

8/12/2019 Math Mod Ph Data
http://slidepdf.com/reader/full/math-mod-ph-data 8/36
PHARMACOKINETIC MODELS NON-COMPARTMENTAL MODELS• Offers little insight into the rate or processes involved in drug
distribution• Imposes a model structure and more restrictive than multi-
compartmental modelCOMPARTMENT MODELS
• Catenary and mamillary modelsPHYSIOLOGICAL MODELS• Organ blood flow, volume, partition coefficient, and binding affinity
for a particular drug• Assumes that a fraction of the drug in the body will be extracted form
the blood on each pass• Blood flow is a determental of drug clearance
E QCL .=

8/12/2019 Math Mod Ph Data
http://slidepdf.com/reader/full/math-mod-ph-data 9/36
PHYSIOLOGICAL MODELS

8/12/2019 Math Mod Ph Data
http://slidepdf.com/reader/full/math-mod-ph-data 10/36
ESTIMATION OF PARAMETERS
1. The statistical problem2. Numerical methods3. Computer implementation
8/12/2019 Math Mod Ph Data
http://slidepdf.com/reader/full/math-mod-ph-data 11/36
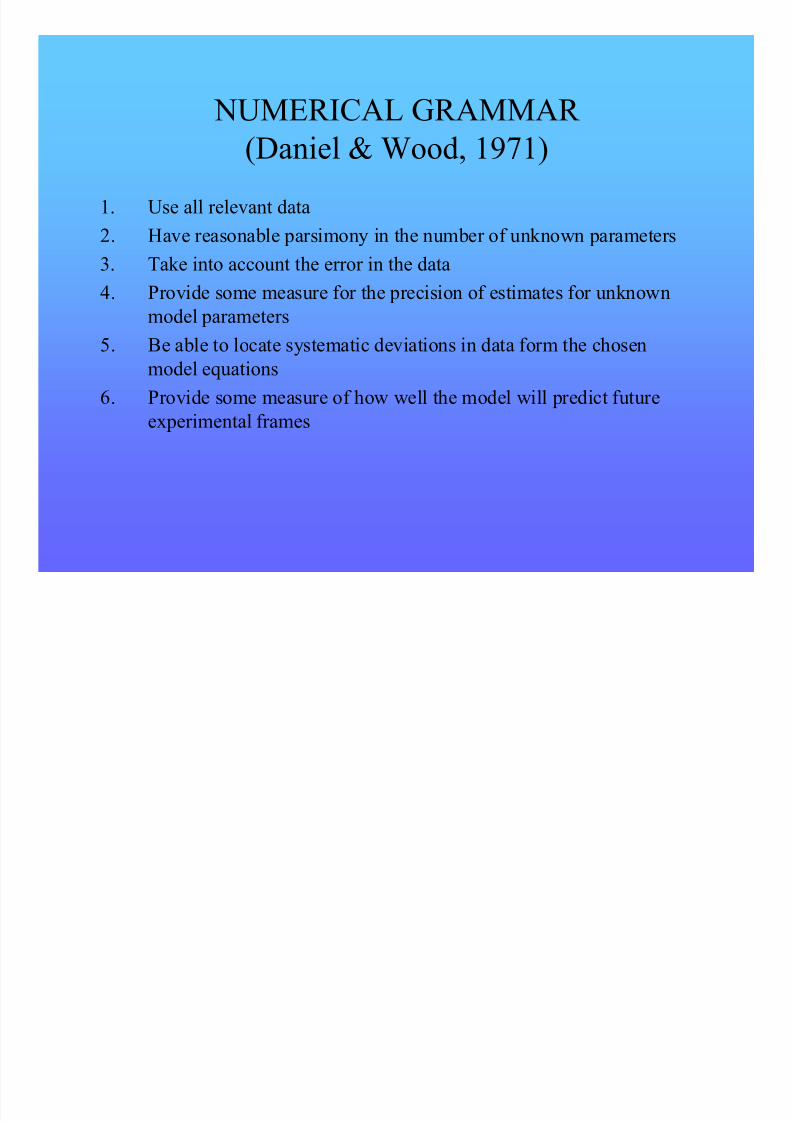
NUMERICAL GRAMMAR (Daniel & Wood, 1971)
1. Use all relevant data2. Have reasonable parsimony in the number of unknown parameters3. Take into account the error in the data4. Provide some measure for the precision of estimates for unknown
model parameters5. Be able to locate systematic deviations in data form the chosen
model equations6. Provide some measure of how well the model will predict future
experimental frames

8/12/2019 Math Mod Ph Data
http://slidepdf.com/reader/full/math-mod-ph-data 12/36
WAGNERs SIX POINT CHECK LIST FOR DERIVINGMODELS
1. State the assumption involved2. Excert caution particularly in making physiological and biochemical inferences
3. Ask yourself whether models could equally as well
explain the data4. Check whether your model agrees with known
physiology, pharmacology etc.,5. Check not only for closeness of fit, but also trends in
areas of poor fit6. Check whether your model provides accurate predictions
particularly if the system is perturbed

8/12/2019 Math Mod Ph Data
http://slidepdf.com/reader/full/math-mod-ph-data 13/36
GENERAL MODELING STRATEGIES
1. Initial model selection• Start with a plot• How many linear segments are involved?2. Obtaining initial estimates• Curve stripping method• Computer programs – PCNONLIN, KINETICA etc.,3. Selection of minimization algorithm
• Gauss-Newton• Marquardt• Nelder-Mead Simplex Optimization

8/12/2019 Math Mod Ph Data
http://slidepdf.com/reader/full/math-mod-ph-data 14/36
GENERAL MODELINGSTRATEGIES…continued
4. Assessing the goodness of fit• AIC• Correlation between observed and predicted values
• Analysis of residuals

8/12/2019 Math Mod Ph Data
http://slidepdf.com/reader/full/math-mod-ph-data 15/36
START WITH A PLOT
1. Plot on Log scale2. See for the number ofsegments
3. Straight line in theelimination segment- 1compartment (mono exp)
4. One segment – 2compartment (bi-exp)
5. Two segments – 3compartments (Tri-exp)…..

8/12/2019 Math Mod Ph Data
http://slidepdf.com/reader/full/math-mod-ph-data 16/36
RATE PROCESSESFIRST ORDER PROCESS
ZERO ORDER PROCESS
CAPACITY LIMITED PROCESS
t k C C
t k C C
C k dt
dc
.ln
).exp(.
.
0
0
−=
−=
−=
t k C C
k dt
dC
.00
0
−=
−=
)1()(maxmax)1()(
)()1(
max
..1
lnln
.
+
+
−+=
−
−
+=−
nnm
nn
nn
m
C C V V
K
C C
t t
C K C V
dt dC

8/12/2019 Math Mod Ph Data
http://slidepdf.com/reader/full/math-mod-ph-data 17/36
CAPACITY LIMITED PROCESS
1. Plot Con Vs Time on logscale at increasing doses
2. Low dose may look like firstorder plot (indicated non-saturation)
3. At higher doses the plot looklike dome shaped (due tosaturation)

8/12/2019 Math Mod Ph Data
http://slidepdf.com/reader/full/math-mod-ph-data 18/36
HOW COMPLICATED MODEL CAN BE FIT TO DATA?
NP=2.EX+PE+2.TS+NL NP=No. of parametersEX=No. of exponentialsPE=No. of elimination or excretory pathwaysTS=No. of tissue spaces or binding proteins
NL=No. of visible non-linear features
Ref.: Jusko, Applied Pharmacokinetics: Principles of TDM, 2 nd Edn.1986

8/12/2019 Math Mod Ph Data
http://slidepdf.com/reader/full/math-mod-ph-data 19/36
OBTAINING INITIAL ESTIMATES
1. RANDOM SEARCH METHODS2. STRIPPING OR PEELING METHODS3. LINEARIZATION METHODS

8/12/2019 Math Mod Ph Data
http://slidepdf.com/reader/full/math-mod-ph-data 20/36
CURVE STRIPPING METHOD
t T Be AeC .. β α −− +=

8/12/2019 Math Mod Ph Data
http://slidepdf.com/reader/full/math-mod-ph-data 21/36
∑
∑
∑2i
i
i x
x
x
n=
1
0
β
β
∑
∑ii
i
y x
y
LINEARIZATION METHODS
NORMAL EQUATIONS TO SOLVE LEAST SQUARES
C B A =− .1
A C B

8/12/2019 Math Mod Ph Data
http://slidepdf.com/reader/full/math-mod-ph-data 22/36
COMPUTER PROGRAMS
A large number of computer programs are available to perform thefunctions of mathematical modeling. Some are:
1. ADAPT II – Fortran based by D’Argenio and Schumitzky2. BOOMER – Fortran Based by WA Bourne3. MK MODEL - by Holford4. MULTI – Basic based by Yamaoka et al.5. WINNONLIN – Industry standard popular program, Windows
based.6. KINETICA – Industry based popular program, Windows based
7. NONMEM – Fortran based by Beal and Sheiner 8. QUICKCALC – Basic based by Shivprakash- 14 models9. MATHEMATICA – Most advanced programming capabilities, can
be used for alpha-numerical programming

8/12/2019 Math Mod Ph Data
http://slidepdf.com/reader/full/math-mod-ph-data 23/36
CONFUSION BETWEEN MATHS ANDBIOLOGY PROCESS
DO NOT GET CONFUSED BETWEEN NON-LINEARPHARMACOKINETICS AND NON-LINEAR MODELS
Non=Linear Pharmacokinetics is saturation kinetics in which PK parametersare not linear with increasing dose (do not exhibit dose linearity)

8/12/2019 Math Mod Ph Data
http://slidepdf.com/reader/full/math-mod-ph-data 24/36
NON-LINEAR PHARMACOKINETICS

8/12/2019 Math Mod Ph Data
http://slidepdf.com/reader/full/math-mod-ph-data 25/36
LINEAR AND NON-LINEAR MODELS
3.....................................ln
2................................)exp(
1............
221
221
22110
ε θ θ
ε θ θ
ε β β β β
++=
++=
+++++=
t Y
t Y
Z Z Z Y nn
Read: Draper and Smith: Applied Regression analysis

8/12/2019 Math Mod Ph Data
http://slidepdf.com/reader/full/math-mod-ph-data 26/36
OPTIMIZATION- CRITERIA FOR BEST FIT
These criteria are achieved by minimizing the following quantities:
))((log)(
)(
)(
)(
2
1
2
1
2
1
ie
i
iin
i
ii
n
ii
n
iii
C Var C Var
C C ELS
C C W WLS
C C OLS
∧
∧
∧
=
∧
=
=
∧
+−
=
−=
−=
∑
∑
∑
Read on Weighting Schemes in PK: Peck CC et al. Drug Met. Rev., 1984

8/12/2019 Math Mod Ph Data
http://slidepdf.com/reader/full/math-mod-ph-data 27/36
OPTIMIZATION TECHNIQUESSTEEPEST DESCENT METHOD
Seems to be most efficient. Problems arise when translatedinto computer method.Large steps- method gets lostSmall steps- too long
Quite slow at minimum
GUASS-NEWTON METHOD
Linear least squares method. Linearisation by first orderTaylors expansion. It may lost with poor initial estimates.

8/12/2019 Math Mod Ph Data
http://slidepdf.com/reader/full/math-mod-ph-data 28/36
OPTIMIZATION TECHNIQUEScontinued…
MARQUARDT METHOD
Minimization of is used as a criterion of best fit.
SIMPLEX METHOD
∑=
−=
n
i i
ii xY Y
1
2
2 )(σ
χ
2 χ

8/12/2019 Math Mod Ph Data
http://slidepdf.com/reader/full/math-mod-ph-data 29/36
SIMPLEX OPTIMIZATION
Contour plot of residual sum ofsquare surface
Ref. :Nelder and Mead,Computing Journal, 1965

8/12/2019 Math Mod Ph Data
http://slidepdf.com/reader/full/math-mod-ph-data 30/36
MODEL SEECTION CRITERIA1. THE AKAIKE INFORMATION CRITERIA (AIC)
Minimum AIC value is the best representation of model.
Warning: Improper weight could select wrong equation.
2. F-TEST
df=(No. of experimental data points)-(No. of parameters)
∑=
∧
−=
+=
n
iiiie
e
C C w R p R N AIC
1
2)(2.ln.
21
2
2
21 .df df
df WSS
WSS WSS F
−
−= )( 21 df df

8/12/2019 Math Mod Ph Data
http://slidepdf.com/reader/full/math-mod-ph-data 31/36
MODEL SELECTION CRITERIONcontinue…3. STANDARD DEVIATION OF ESTIMATED
PARAMETER
N=No. of data points
P= No. of parameters estimated N-P= degrees of freedomC ii=i th diagonal element of the variance-covariancematrix of the elements
∑ ∑
∑∧
−=
−=
=
22
22
2
)(
.
Y Y dev P N
dev s
C s DS ii

8/12/2019 Math Mod Ph Data
http://slidepdf.com/reader/full/math-mod-ph-data 32/36
MODEL SELECTION continue…4. COEFFICIENT OF DETERMINATION
5. MODEL SELECTION CRITERION (MSC)
For equal weight
∑ ∑
∑
=
=
∧
−=
−−=
n
i y
n
i y
i
N
Y Y
Y Y wr
S
S
1
222
12
22
)(
)(1
N
P
Y Y w
Y Y w MSC n
iii
n
iii
.2)(
)(ln
1
2
1
2 _
−
−
−
=
∑
∑
=
∧
=
N
P
dev MSC S y
.2ln 2
2
−=
∑

8/12/2019 Math Mod Ph Data
http://slidepdf.com/reader/full/math-mod-ph-data 33/36
MODEL SELECTION continue…
6. ANALYSIS OFRESIDUALS

8/12/2019 Math Mod Ph Data
http://slidepdf.com/reader/full/math-mod-ph-data 34/36
MODEL SELECTION continue..
6. ANALYSIS OFRESIDUALS

8/12/2019 Math Mod Ph Data
http://slidepdf.com/reader/full/math-mod-ph-data 35/36

8/12/2019 Math Mod Ph Data
http://slidepdf.com/reader/full/math-mod-ph-data 36/36
THANK YOU


![arXiv:1510.02074v4 [math-ph] 18 May 2017arXiv:1510.02074v4 [math-ph] 18 May 2017 Localdensityfortwo-dimensionalone-componentplasma RolandBauerschmidt∗ PaulBourgade† MiikaNikula‡](https://img.dokumen.tips/doc/110x75/5fd00dbbc04983084e443cdc/arxiv151002074v4-math-ph-18-may-2017-arxiv151002074v4-math-ph-18-may-2017.jpg)


![arXiv:1106.1783v2 [math-ph] 5 Aug 2012](https://img.dokumen.tips/doc/110x75/61ea04c7d7afee382a3df07c/arxiv11061783v2-math-ph-5-aug-2012.jpg)
![arXiv:0809.5125v2 [math-ph] 7 Oct 2008](https://img.dokumen.tips/doc/110x75/6263bde4e0b1445e6e067e60/arxiv08095125v2-math-ph-7-oct-2008.jpg)
![arXiv:2110.15301v1 [math-ph] 28 Oct 2021](https://img.dokumen.tips/doc/110x75/626164d996f05b29cc78140e/arxiv211015301v1-math-ph-28-oct-2021.jpg)
![Keywords: arXiv:1505.02042v1 [math-ph] 8 May 2015](https://img.dokumen.tips/doc/110x75/623f34e2f0100810af061bb4/keywords-arxiv150502042v1-math-ph-8-may-2015.jpg)
![arXiv:2110.07974v1 [math-ph] 15 Oct 2021](https://img.dokumen.tips/doc/110x75/61bd3f0061276e740b10d4d4/arxiv211007974v1-math-ph-15-oct-2021.jpg)
![arXiv:1005.1057v1 [math-ph] 6 May 2010](https://img.dokumen.tips/doc/110x75/61804e5bb718ee4f665d58bc/arxiv10051057v1-math-ph-6-may-2010.jpg)
![arXiv:1708.02134v2 [math-ph] 5 Dec 2017](https://img.dokumen.tips/doc/110x75/61d9aadd73a46b6ba4753a06/arxiv170802134v2-math-ph-5-dec-2017.jpg)
![arXiv:2002.06839v1 [math-ph] 17 Feb 2020](https://img.dokumen.tips/doc/110x75/61c9880f308b3d19bf3cced9/arxiv200206839v1-math-ph-17-feb-2020.jpg)

![arXiv:1008.1341v1 [math-ph] 7 Aug 2010](https://img.dokumen.tips/doc/110x75/62668a959cf12560374b67ab/arxiv10081341v1-math-ph-7-aug-2010.jpg)
![MATHEMATICAL PHYSICS arXiv:1110.4864v2 [math-ph] 25 Oct …](https://img.dokumen.tips/doc/110x75/61b11514c9965d3ea410ec09/mathematical-physics-arxiv11104864v2-math-ph-25-oct-.jpg)
![∗† arXiv:1501.04238v3 [math-ph] 3 Dec 2015](https://img.dokumen.tips/doc/110x75/62e38f87fc99f71462189ca4/-arxiv150104238v3-math-ph-3-dec-2015.jpg)

![arXiv:1804.11206v1 [math-ph] 27 Apr 2018](https://img.dokumen.tips/doc/110x75/61a665dd83f8e13202546513/arxiv180411206v1-math-ph-27-apr-2018.jpg)
![arXiv:0811.0222v1 [math-ph] 3 Nov 2008](https://img.dokumen.tips/doc/110x75/6284ece8412bc03fcf0342de/arxiv08110222v1-math-ph-3-nov-2008.jpg)
![arXiv:2012.15551v1 [math-ph] 31 Dec 2020](https://img.dokumen.tips/doc/110x75/61bd294e61276e740b0ffdd7/arxiv201215551v1-math-ph-31-dec-2020.jpg)

![arXiv:1601.01965v2 [math-ph] 2 Feb 2016](https://img.dokumen.tips/doc/110x75/61bd11a061276e740b0f082e/arxiv160101965v2-math-ph-2-feb-2016.jpg)
![arXiv:1209.5665v2 [math-ph] 4 Feb 2014](https://img.dokumen.tips/doc/110x75/61c93be1e83e844fc94de4c2/arxiv12095665v2-math-ph-4-feb-2014.jpg)
![arXiv:1503.00995v1 [math-ph] 3 Mar 2015](https://img.dokumen.tips/doc/110x75/616a667f11a7b741a352158d/arxiv150300995v1-math-ph-3-mar-2015.jpg)
![arXiv:0806.0055v1 [math-ph] 31 May 2008](https://img.dokumen.tips/doc/110x75/625d117a68204b49fa62cb2a/arxiv08060055v1-math-ph-31-may-2008.jpg)