Embed Size (px)
Citation preview

Under ConstructionBenchmark Assessments and Common Core Math Implementation in Grades K–8
John Flaherty, Jr.
Alexandria Sobolew-Shubin
Alberto Heredia
Min Chen-Gaddini
Becca Klarin
Neal D. Finkelstein
September 26, 2014
FORMATIVE EVALUATION CYCLE REPORT FOR THE MATH IN COMMON INITIATIVE • VOLUME 1

2014 © WestEd. All rights reserved.
Suggested citation: Flaherty, J., Sobolew-Shubin, A., Heredia, A., Chen-Gaddini, M., Klarin, B., & Finkelstein, N. D. (2014). Under Construction: Benchmark Assessments and Common Core Math Implementation in Grades K-8. San Francisco, CA: WestEd.
Requests for permission to reproduce any parts of this report should be directed to WestEd Publications Center, 730 Harrison Street, San Francisco, CA 94107-1242, 888-293-7833, fax 415-512-2024, [email protected], or http://www.WestEd.org/permissions.

Table of Contents
WestEd’s Evaluation of the Math in Common Initiative .................................................................................................................................. i
Executive Summary ......................................................................................................................................................................................................iii
Introduction .....................................................................................................................................................................................................................1
Methodology ...................................................................................................................................................................................................2
Literature Review: Student Performance Assessments and Benchmarks ................................................................................................3
Types of Student Assessments ................................................................................................................................................................3
Considerations for Implementing Benchmark Assessment Systems ........................................................................................5
Student Assessments in the Context of CCSS ..................................................................................................................................7
Benchmark Assessment Systems across the Math in Common Districts ................................................................................................8
Goals of Benchmark Assessment Systems ..........................................................................................................................................9
Developing and Updating Benchmark Assessment Systems .....................................................................................................11
Plans for Integrating Smarter Balanced Interim Assessments ................................................................................................ 14
Strategies for Successfully Implementing New Benchmark Assessment Systems ............................................................................................................................................................................... 16
Considerations for the Future ................................................................................................................................................................................. 21
References ...................................................................................................................................................................................................................... 22
LIST OF FIGURES
Figure 1. Tiers of Assessment .....................................................................................................................................................................................3
Figure 2. Benchmark Assessment Practices that Have Contributed to Higher Student Performance .........................................4
Figure 3. Word Cloud: Math in Common Districts’ Updated Benchmark Assessment Systems .................................................. 10
Figure 4. Smarter Balanced Assessment Consortia Timeline ..................................................................................................................... 14


I
WestEd’s Evaluation of the Math in Common Initiative
Math in Common™ is a five-year initiative funded by the S.D. Bechtel, Jr. Foundation that supports a formal network of 10 California school districts as they are implementing the Common Core State Standards in mathematics (CCSS-M) across grades K–8. Math in Common grants have been awarded to the school districts of Dinuba, Elk Grove, Garden Grove, Long Beach, Oakland, Oceanside, Sacramento City, San Francisco, Sanger, and Santa Ana. In support of the network, California Education Partners provides technical assistance in support of the Math in Common Community of Practice. WestEd is providing develop-mental evaluation services over the course of the initiative. The evaluation plan is designed principally to provide relevant and timely information to help each of the Math in Common districts meet their implementation objectives.
The overall evaluation centers around four central themes, which attempt to capture the major areas of work and focus in the districts as well as the primary indicators of change and growth. These themes are:
» Shifts in teachers’ instructional approaches, and the corresponding teaching quality related to CCSS-M in grades K–8.
» Changes in students’ proficiency in mathematics, measured against the CCSS-M.
» Change management processes at the school district level, including district leadership, organizational design, and management systems that specifically support and/or main-tain investments in CCSS-M implementation.
» The development and sustainability of the Math in Common Community of Practice.
Districts participating in the Math in Common initiative are diverse, ranging from small rural to large urban districts. Each district’s unique context and history play a role in the path dis-trict educators will take in responding to the new instructional demands of the CCSS-M and determining district-specific priorities regarding teacher professional development, aligned instructional materials, and assessment of student learning of the standards. However, participation of these diverse districts in this Math in Common Community of Practice also enables them to learn from each other through sharing their progress and successes, as well as their challenges and lessons learned. WestEd’s evaluation activities will draw on the varia-tion of the district contexts to highlight how the districts, funder, and broader community can learn from the efforts of these 10 districts to implement the CCSS-M.

II

III
Executive Summary
School districts nationwide are now, during the 2014/15 school year, expected to begin full implementation of the Common Core State Standards (CCSS) in mathematics. The shift toward the
CCSS is a major directional change in U.S. education, and the transition to full-scale CCSS implementation will require time and patience and involve shifts in how educators think about aligning instruction with the CCSS and measuring and supporting student performance against the standards.
In California, school districts are implementing the new standards and developing systems to meet instructional, professional development, and accountability goals. As the Math in Common (MiC) initiative moves into its second grantee year, one of the central activities that each of the districts is undergoing to support CCSS implementation involves putting in place new or revised student assessment processes or systems to better align with the new standards. This report examines the MiC districts’ strategies and initial implementation efforts related to benchmark assessments, which are used at periodic points throughout the school year to assess student mastery of the CCSS-M and to signal districts’ progress. It also highlights the range of approaches to developing and implementing benchmark assessments used across the MiC district community, in order to illuminate the challenges and headway that many districts in California, and perhaps beyond, are facing as they work to implement CCSS-M, specifically across grades K–8.
The primary findings are:
» MiC districts have multiple goals for their benchmark assessment systems: informing teacher instructional practice; measuring student performance and gauging progress; and informing professional development offerings. Accountability systems that might be informed by benchmark assessment systems are still under development, and generally not in place in the MiC districts at this time.
» While some districts have a culture and track record for developing benchmark assessment systems internally, others have opted to purchase benchmark assessment systems.
» More than half of the MiC districts plan to review, and possibly adopt, the Smarter Balanced interim
assessments once they are released. The other districts see the Smarter Balanced interim assessments as one tool among many that they may integrate into their benchmark assessments systems.
» Some components of previous assessment systems are serving MiC districts as the backdrop upon which they are building their new CCSS-M aligned systems. On the margin, the focus has now shifted to the classroom (via formative and benchmark assessment); district- and school-level reporting is still very much under develop-ment (via benchmark and summative assessment) as the districts continue to develop their assessment programs.
» As the MiC districts build new benchmark assessment systems, they are using the strategies that are sup-ported by existing research. Districts have developed detailed plans for implementing the benchmark assess-ments; worked to secure teacher support; adapted or adopted systems for analyzing and reporting student assessment data with support from expert personnel; provided professional development to help educators implement the new assessment systems; and supported teachers on scoring and analyzing assessment data.
» MiC districts acknowledge the importance of moving beyond multiple-choice items toward using perfor-mance tasks in order to align with the depth and rigor of the CCSS-M and to help teachers more accurately gauge students’ mathematics learning progress. At this time, the use of performance tasks for systematic, widespread data collection across K-8 is not in place in the MiC districts.
» While the 2014 Smarter Balanced field tests generally went well, the MiC districts vary in their capacity to administer computer-based assessments at scale.

Iv
As CCSS-M implementation continues and benchmark assessment systems continue to develop to support instruc-tional shifts, two additional considerations are highlighted to support the transition:
» Purposefully, assessment and instruction are closely intertwined. When planning for implementation of the CCSS-M and aligned benchmark assessments, districts should continue to think about how their vision for student assessment and mathematics instruction can complement each other most effectively and most cost effectively. Several examples have been highlighted
that emphasize Professional Learning Communities as a promising venue for these discussions.
» As districts gain greater understanding of the CCSS-M through ongoing implementation, they must be able to transfer learning into future adaptations of their stu-dent benchmark assessment systems. Ongoing discus-sions within and across the MiC districts about whether their assessment system is delivering the data needed to meet instructional, professional development, and accountability goals will be critical and districts must be prepared and supported to engage in continuous improvement cycles.

1
Introduction
School districts nationwide are now, during the 2014/15 school year, expected to begin full implementation of the Common Core State Standards (CCSS) in mathematics. The shift toward the
CCSS is a major directional change in U.S. education, and the transition to full-scale CCSS implementation will require time and patience and involve shifts in how educators think about aligning instruction with the CCSS and measuring and supporting student performance against the standards.
In California, school districts are implementing the new standards in a time of many transitions. For example, many districts are introducing new or revised “CCSS-aligned” curri-cula but this promise of “alignment” is as yet met with skep-ticism and questions about actual alignment (Glenn, 2014; Herold, 2014; EWRC, 2014; Cristol & Ramsey, 2014; Gewertz, 2013). Teacher professional development is in flux as district educators struggle to determine what the standards actually mean for student and teacher actions and what they look like in the classroom (Lewis, 2010). Additionally, beginning with last year’s field testing, all California districts are imple-menting the new Smarter Balanced summative assessments, yet data from the 2013/14 school year was not released to help districts determine how well their students performed (CDE, 2014; Freeberg, 2014). While expectations about the usefulness of the Smarter Balanced assessment package may be high among districts, there is general uncertainty about what to expect, including what sort of time and resources will be required and how to transition toward using the assessments for measuring student performance and deter-mining local accountability (Gewertz, 2014). With district and state leaders referring to the Smarter Balanced field test implementation as going “remarkably well” and technical and resource needs being addressed ahead of the operational roll-out (Freeberg, 2014), district leaders can now focus on putting in place monitoring systems that will provide infor-mation to: (1) assess how well students are mastering the new CCSS-M standards; (2) predict how students will do on the Smarter Balanced summative assessments; and (3) gauge progress for accountability purposes during this early period of CCSS-M implementation.
As the Math in Common (MiC) initiative moves into its second grantee year, one of the central activities that each of
the districts is undergoing to support CCSS implementation involves putting in place new or revised student assessment processes or systems to better align with the new stan-dards. As such, in this evaluation cycle report, the WestEd developmental evaluation team explores ways in which the MiC districts are developing and implementing strategies to measure and support student performance in mathematics. Specifically, the report examines districts’ strategies and initial implementation efforts related to benchmark assess-ments, which are used at periodic points throughout the school year to assess student mastery of the CCSS-M and to measure district progress. The report highlights the range of approaches to developing and implementing benchmark assessments used across the MiC district community, in order to illuminate the challenges and headway that many districts in California, and perhaps beyond, are facing as they work to implement CCSS-M, specifically across grades K–8.
The report begins with a literature review that provides some background on student assessment, with a particular focus on critical considerations for implementing benchmark assessments. Next, the report summarizes primary findings across the 10 MiC districts and describes unique and com-mon features of the districts’ various plans and activities related to benchmark assessments: the goals of their bench-mark assessment systems; how they are developing and updating those systems; what their plans are for integrating Smarter Balanced interim assessments; key strategies for successfully implementing new assessment systems; and different types of assessment items included in these sys-tems. Finally, the report concludes with a summary of con-siderations for the future: what lessons do we learn from these 10 districts about the use of benchmark assessments in the era of CCSS.

2
METHODOLOGY
For the past year, the WestEd evaluation team has been working closely on local and cross-district reflection and evaluation planning with the MiC districts. Interaction has included site visits, convenings, and ongoing conversations. Ahead of the 2014/15 school year, the evaluation team conducted structured interviews with lead administrative, assessment, and math team personnel—as recommended by each MiC district lead—at each district.
These interviews provided an overview of the 10 MiC dis-tricts’ current benchmark assessment plans in the context of the significant changes that are being made statewide across California and within each district. The interview protocol
included questions about the district’s historical perspective on student benchmark assessments; district-specific plans for the use of—and conversation around—benchmark or interim assessments during the coming year; local stakehold-ers’ involvement in the benchmark assessment process; and the possibility of incorporating Smarter Balanced assessment items into the district’s benchmarking processes. These interviews and subsequent analyses provide context for and information about the differences and similarities among the assessment strategies in each district.
In synthesizing the data for this report, the evaluation team also referred to additional data collected earlier, including documents and discussions with district personnel.
3
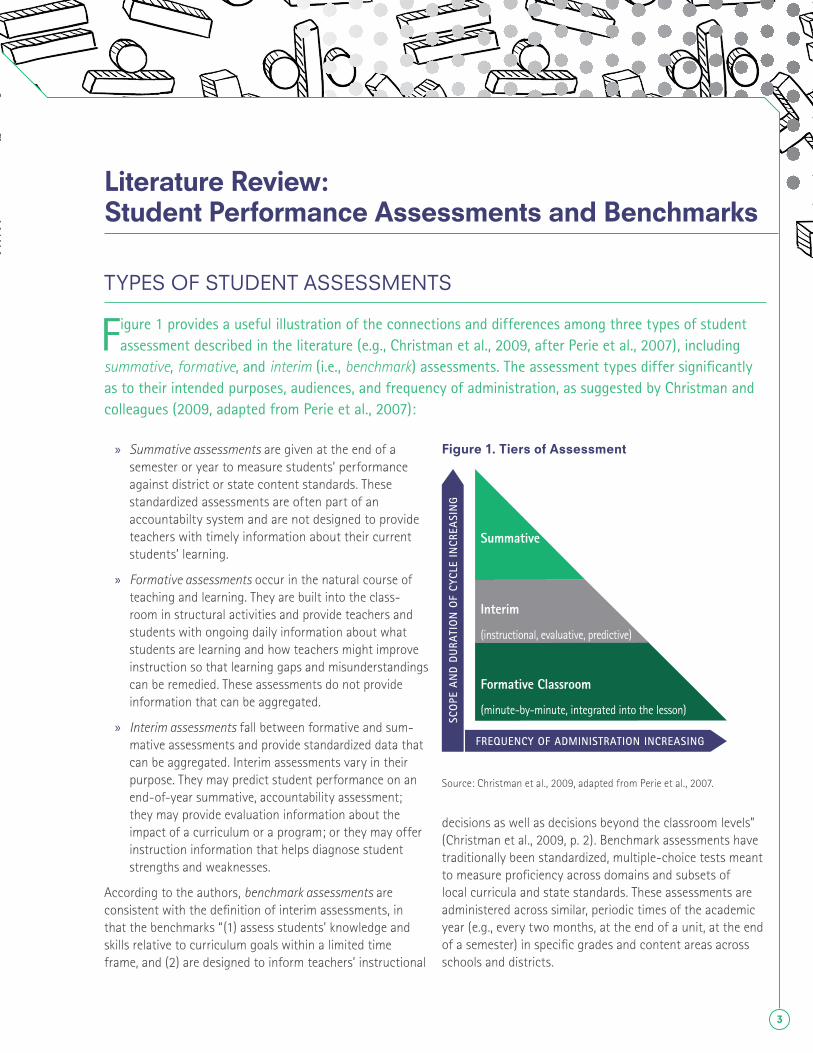
Literature Review: Student Performance Assessments and Benchmarks
TYPES OF STUDENT ASSESSMENTS
Figure 1 provides a useful illustration of the connections and differences among three types of student assessment described in the literature (e.g., Christman et al., 2009, after Perie et al., 2007), including
summative, formative, and interim (i.e., benchmark) assessments. The assessment types differ significantly as to their intended purposes, audiences, and frequency of administration, as suggested by Christman and colleagues (2009, adapted from Perie et al., 2007):
» Summative assessments are given at the end of a semester or year to measure students’ performance against district or state content standards. These standardized assessments are often part of an accountabilty system and are not designed to provide teachers with timely information about their current students’ learning.
» Formative assessments occur in the natural course of teaching and learning. They are built into the class-room in structural activities and provide teachers and students with ongoing daily information about what students are learning and how teachers might improve instruction so that learning gaps and misunderstandings can be remedied. These assessments do not provide information that can be aggregated.
» Interim assessments fall between formative and sum-mative assessments and provide standardized data that can be aggregated. Interim assessments vary in their purpose. They may predict student performance on an end-of-year summative, accountability assessment; they may provide evaluation information about the impact of a curriculum or a program; or they may offer instruction information that helps diagnose student strengths and weaknesses.
According to the authors, benchmark assessments are consistent with the definition of interim assessments, in that the benchmarks “(1) assess students’ knowledge and skills relative to curriculum goals within a limited time frame, and (2) are designed to inform teachers’ instructional
decisions as well as decisions beyond the classroom levels” (Christman et al., 2009, p. 2). Benchmark assessments have traditionally been standardized, multiple-choice tests meant to measure proficiency across domains and subsets of local curricula and state standards. These assessments are administered across similar, periodic times of the academic year (e.g., every two months, at the end of a unit, at the end of a semester) in specific grades and content areas across schools and districts.
Figure 1. Tiers of Assessment
Summative
Interim
(instructional, evaluative, predictive)
Formative Classroom
(minute-by-minute, integrated into the lesson)
SCO
PE A
ND
DURA
TIO
N O
F CY
CLE
INCR
EASI
NG
FREQUENCY OF ADMINISTRATION INCREASING
Source: Christman et al., 2009, adapted from Perie et al., 2007.

4
By supplementing summative and formative assessments with benchmark assessments, teachers, principals, and district staff are able to gather data to inform classroom practice and districtwide decision-making (Olson, 2005; CDE, n.d.; CDE, 2001). Douglas B. Reeves, the founder of the now-defunct Center for Performance Assessment, a private organization that collaborated with districts in creating fair and rigorous assessments and classroom activities, commented on the utility of benchmark assessments, saying, “Good… benchmark assessments, provide feedback throughout the year, and that is far more fair to principals and teachers, provided they are used wisely” (Olson, 2005). Within accountability frameworks, benchmark assessment data can often be disaggregated to support districts’ better understanding of student performance for various student groups or across time periods. For example, Olson (2005) has written that “[e]xtensive [benchmark] report-ing systems break down test results by the same student categories required under the federal No Child Left Behind Act, such as by race, income, disability, and English proficiency, in addition to providing individual progress reports at the district, school, classroom, and student levels.”
Reeves indicates that effective benchmark assessments “focus on the most important state or district content stan-dards” and provide accessible and fairly immediate results. Lorie Shepard, from the University of Colorado, adds that good benchmark assessments “should include rich repre-sentations of the content students are expected to master,
be connected to specific teaching units, provide clear and specific feedback to teachers so that they know how to help students improve, and discourage narrow test-preparation strategies” (Olson’s paraphrasing of Shepard, Olson, 2005). In other words, good benchmark assessments should provide flexible and fine-grained data that can be disaggregated and used to provide feedback to teachers to improve academic performance for particular students or classes of students, or aggregated to look at student performance for schools and a district as a whole to inform school and district policy. Figure 2 provides an example of “how higher performing districts, schools, and classrooms implement [benchmark] practices….that have demonstrably contributed to higher student perfor-mance” (Dolejs, 2006, p. 13).
Research refers to these multiple uses of benchmark data as internal or external benchmarking. Internal benchmark-ing is more concentrated and localized, typically focusing at the individual school or district level. In internal bench-marking, “Longitudinal data can be used to identify the areas of greatest success within one’s own school or school system in search of better practices” (Dougherty, Mellor, & Smith, 2007, p. 2). For example, lesson study, where teach-ers research and practice successful teaching strategies, aims to help teachers identify ways in which lessons were or were not effective for helping students learn. Teachers frequently draw on prior student data to help them plan their lesson for maximum effectiveness.
Figure 2. Benchmark Assessment Practices that Have Contributed to Higher Student Performance
DISTRICT- LE v E L ACTIO N
Districts supplement the state-mandated reporting system with district benchmark assessments to better assess their students’ progress. In one case, the English Language Development plan written at the district level offers a comprehensive program with benchmark assessments that are totally aligned to the state’s English Language Arts assessments.
SCH OO L - LE v E L ACTIO N
Assessments which include benchmarking are used to track teacher as well as student performance, and are aligned with curriculum and written collaboratively in departments. At one school, the Instructional Leadership Team meets biweekly to look at test scores and student work, plan interventions for specific students, and make recommendations for intervention materials.
CL ASSROO M - LE v E L ACTIO N
Teachers use benchmarks to review individual student performance with each student as part of an effective assessment strategy. Student transcripts and test results are given to students for structured and unstructured reflection. Teachers meet with students at least once a semester to discuss their performance against established benchmarks and analyze their progress toward accomplishing schoolwide learning expectations at some schools.
Source: Dolejs, 2006.

5
Other examples of internal benchmarking questions that can be answered with longitudinal data include:
» Which teachers in our school have been most success-ful with students who have had trouble with math-ematics in prior years?
» Which schools in our district have experienced the greatest success in improving students’ reading skills between second and fourth grade? (Dougherty, Mellor & Smith, 2007)
Meanwhile, external benchmarking is wider in scope. In external benchmarking, “The search for better practices should extend outside of one’s own school or district to embrace the study of success wherever it can be found. Once longitudinal data is used to identify success stories, further investigation can be conducted to identify success-ful strategies and practices” (Dougherty, Mellor, & Smith, 2007, p. 2).
Examples of external benchmarking questions that can be answered using longitudinal data include :
» Which schools across the state have been most effec-tive in teaching Algebra 1 to students who were at the basic level or below in seventh grade mathematics?
» Which high schools have been most successful in improving the success of students who entered the school with poor reading skills? (Dougherty, Mellor, & Smith, 2007)
Based on this research, districts in California currently oper-ating in the absence of a defined end-of-year summative assessment, and implementing instructional practices and materials inherently changing as a result of CCSS demands, may be well-advised to use benchmark assessment programs to understand how to make course corrections to better support students’ mathematics learning and gauge overall district response to CCSS.
CONSIDERATIONS FOR IMPLEMENTING BENCHMARK ASSESSMENT SYSTEMS
The literature identifies several considerations for districts to take into account when implementing benchmark systems. For instance, as educational leaders consider the addition of benchmark assessments to an already assessment-heavy calendar, it is important to establish clear understand-ings and expectations of the nature and purpose of these assessments (Herman et al., 2010). Specifically, Herman and colleagues suggest that policymakers should answer the following questions prior to adopting or revising benchmark assessments for their school or district:
» What purposes do you expect the student assessments to serve?
» What criteria should be used to select or create these benchmark assessments?
» What organizational capacity is needed to successfully support a student assessment program?
With respect to the criteria for selecting or creating the benchmark assessments, those responsible for implementing a benchmark system should think through the types of data gathered for subsequent usability by the range of district stakeholders. In recent years, there has been increased attention to having schools and districts use data to inform their actions, but often these data are high-level statistical data showing sub-group performance in specific content areas. Means et al. (2010, p. xvi) refer to this type of data as “category 1” data, which may be examined by staff “for [the] whole grade or school to ascertain areas for school improve-ment; examine data for individual students for purposes of class placement or assignment to services, including identifying ‘bubble kids’ whose growth is likely to affect the school’s AYP status.” Additionally, as reported by Means et al., (2010, p. xiv), “Even in districts that are actively promot-ing the use of data, however, school staff provided relatively few examples of teachers using data to diagnose areas in which they could improve the way they teach.” Yet, May and Robinson (2007) reported that when teachers have access to student, sub-group, and group benchmark data in an acces-sible format, teachers can then tailor supports, tutoring,

6
and additional resources to students’ immediate needs and weaknesses. Traditional benchmark assessments that utilize mostly standardized items may thus be improved with the inclusion of open-ended performance tasks that reveal the specifics of student thinking that teachers can use to under-stand instructional implications and support student mastery of the CCSS (see e.g., Peek & Foster, 2012; Tucker, 2014).
Regarding organizational capacity, Herman and colleagues (2010) suggested that, “[i]n the process of selecting or developing benchmark assessments, districts and schools need to carefully consider the infrastructure and systems needed for the student assessment process to run smoothly and efficiently” (Herman et al., 2010, p. 17). In particular, the authors noted that “[d]ecisions about how, when, and by whom the assessments will be administered, scored, analyzed, and used will influence the kinds of resources and support school personnel need” (ibid.). The authors highlighted four conditions that are necessary to sustain the effective use of student assessments: (1) begin with a written plan; (2) identify systems for analyzing and reporting data; (3) provide professional development; and (4) allocate time.
Positioning of the benchmark assessment system among district stakeholders is also critical for its success: depend-ing on other features of the district environment, users of the benchmark system may be likely to perceive it as just “one more thing” added to their busy plates and push back against assessment overload, or alternatively, perceive it as useful. For example, in 2009, the Los Angeles teachers union threatened to boycott the district-mandated “peri-odic assessments,” claiming that the tests were costly and counterproductive, interrupting instruction and narrowing the depth and breadth of what is taught (Blume, 2009). By contrast, Christman et al. (2009) showed that Philadelphia’s elementary school teachers embraced benchmark assess-ment structures, finding them useful guides to accompany their classroom instruction and, along with the core curricu-lum, providing clear expectations for what teachers should teach and at what pace.
Means et al. (2009) elaborate on some of the data and organizational capacity issues related to benchmark assess-ments, offering the following suggestions for schools and districts embarking on the implementation of data-informed decision-making:
1. Providing school-level data coaches is an impor-tant support for school-level use of data to inform instruction;
2. A common curriculum and curriculum-aligned interim assessments increase the likelihood that school staff members will make extensive use of a district’s data system;
3. If teacher use of data is the goal, then it is desirable to have curriculum and instruction staff members involved in the initiative;
4. Teacher buy-in for the data system and its use should be sought early and maintained continuously;
5. Professional development should include training on how to interpret data and how to translate data into changes in instructional practice;
6. District policies should be examined to identify and remove policies and procedures that undermine teach-ers’ use of data to inform instruction; and
7. School leaders need to build teachers’ mutual trust to a point where teachers are comfortable working with col-leagues to examine data that reflect on their teaching performance.
A final consideration, perhaps resulting from states’ histori-cally varying academic standards and local determination of interim and formative assessments, is that there is not yet solid evidence of the predictive impact on student achieve-ment of using benchmark assessments. For example, the Regional Educational Laboratory Northeast and Islands investigated the impact of benchmark assessments on middle-school student math achievement in Massachusetts
1 The Measures of Academic Progress (MAP) is a computer-based adaptive assessment available for English language arts and mathematics. More than 5,000 districts nationally use MAP to generate information on individual students’ academic progress. MAP’s publisher, Northwest Evaluation Association, recently released a version of the assessment that it describes as aligned to the Common Core, although that claim has not yet been independently validated.

7
(Henderson et al., 2008; Henderson et al., 2007) and found no statistically significant difference in test scores between schools participating in a benchmark assessment pilot pro-gram and the comparison schools. Nevertheless, benchmark assessments may support a less direct path to improvement: other research reported above does suggest that benchmark assessments can help to clarify curricular ideas for teachers and that such concept clarification may in turn contribute to achievement of student learning goals.
STUDENT ASSESSMENTS IN THE CONTEXT OF CCSS
In the uncertain policy context of the CCSS, assessments that serve to clarify the standards and contribute to the achievement of student learning goals will be much needed. As the CCSS adds depth to both content and practice, it is likely that the way we define and use formative and bench-mark assessments will also shift. Accordingly, as most states transition to the CCSS, educators may need to think differ-ently about benchmark assessments and how they align with instructional practice.
Much of the national discourse around CCSS assessments has been focused on the major Common Core testing con-sortia, PARCC and Smarter Balanced. To date, there is little evidence in the literature of how districts are thinking about assessment and aligned practices, the one exception being Cristol and Ramsey’s 2014 report highlighting CCSS imple-mentation efforts in four case study districts. When asked about their states’ plans for implementing the consortia assessments, staff across their case study districts did not express confidence that the PARCC and Smarter Balanced tests would be ready on time or would ultimately be adopted and deployed by their states (Cristol & Ramsey, 2014). In light of uncertain statewide adoption of new consortia-created summative year-end assessments, the four districts are using PARCC and Smarter Balanced tools to benchmark and revise their existing assessments and instructional mate-rials as a support for transitioning to CCSS. For example,
to improve district efforts around understanding student performance throughout the academic year, assessment administrators in Washoe County (Nevada) are utilizing released Smarter Balanced sample items to evaluate the alignment of their existing benchmark assessments (Cristol & Ramsey, 2014).
The authors report that three of the four case study districts are using the Measures of Academic Progress (MAP)1 as a benchmark indicator of student performance, and consistent use of this instrument has helped them build “…a culture of goal setting and data monitoring” (Cristol & Ramsey, 2014, p. 24). They report that “[s]tudents know the targets and receive feedback frequently on their performance, parents respect the results of the test as good measures of their kids’ advancement, and districts, schools, and teachers are on the same page relative to their expectations for success” (p. 17). While these three [districts] have conducted their own analysis of the MAP against the CCSS and the CCSS assessment consortia sample items, there is still some concern about the lack of an external assessment of its alignment to CCSS. The authors note that “[a]ny mis-alignment between the MAP and the next-generation CCSS-aligned assessments (like PARCC and Smarter Balanced assessments) could cause a schism in the data-driven culture of these districts and may undermine educator, student, and parent buy-in for consortia-developed assessments” (p. 17).
As states and districts move toward full CCSS implementa-tion, they will need to think carefully about the multiple factors involved in the process, including the purpose and content of their assessment systems, the process for creating a system that will provide them with timely and easy-to-use data, the resources needed to align benchmark assessments with the new standards, and the professional development teachers and staff will need to use the data. With very little information available about how districts are currently approaching benchmarking and measuring student progress, district educators will need to draw on best practices and learn from each other about planning an assessment system that aligns with both CCSS and their district-specific needs.
5x2=60

8
Benchmark Assessment Systems across the Math in Common Districts
This section of the report moves beyond the current literature to describe the strategic approaches and practical steps that the MiC districts are taking to implement benchmark assessment systems.
Based on interviews with MiC district leaders and their colleagues, the following areas of focus are described: evolving priorities that the new assessment systems are designed to address; the types of information collected by the assessment systems; how current accountability frameworks influenced the development of the assessment systems; and how the pending release of the interim Smarter Balanced assessments influenced the development of assessment systems for the 2014/15 school year and beyond.
district reporting, how easily the Smarter Balanced assessments integrate with the district’s technology and data systems, and how well the Smarter Balanced assessments align with the district’s curriculum.
» Some components of previous assessment systems are serving MiC districts as the backdrop upon which they are building their new CCSS-M aligned systems. Elements of prior systems that still support the CCSS-M implementation include periodic assessments, assessment aligned with standards, teacher input on assessment development, and a focus on using feed-back loops to support instructional decision-making. On the margin, the focus has now shifted to the classroom (via formative and benchmark assessment); district- and school-level reporting is still very much under develop-ment (via benchmark and summative assessment) as the districts continue to develop their assessment programs.
» As the MiC districts build new benchmark assess-ment systems, they are using the strategies that are supported by existing research. For instance, districts have developed detailed plans for implementing the benchmark assessments (e.g., assessment calendars); worked to secure teacher support (e.g., involving them directly in the development process); adapted or adopted systems for analyzing and reporting student assessment data with support from expert personnel; provided professional development to help educators implement the new assessment systems; and supported teachers on scoring and analyzing assessment data.
The primary findings are:
» MiC districts have multiple goals for their benchmark assessment systems: informing teacher instructional practice; measuring student performance and gaug-ing progress; and informing professional develop-ment offerings. Accountability systems that might be informed by benchmark assessment systems are still under development, and generally not in place in the MiC districts at this time.
» While some districts have a culture and track record for developing benchmark assessment systems internally, others have opted to purchase benchmark assessment systems. For example, some districts have found assessment item banks to lack the neces-sary rigor or CCSS alignment and are therefore either developing their own items or using outside vendors to develop items. Several districts have used item develop-ment as a professional development strategy. Most MiC districts are introducing new assessments using timelines similar to those of past years.
» More than half of the MiC districts plan to review, and possibly adopt, the Smarter Balanced interim assessments once they are released. The other dis-tricts see the Smarter Balanced interim assessments as one tool among many that they may integrate into their benchmark assessment systems. The deci-sions will be based on a variety of factors: how well the Smarter Balanced reports synchronize with current

9
» MiC districts acknowledge the importance of mov-ing beyond multiple-choice items toward using performance tasks in order to align with the depth and rigor of the CCSS-M and to help teachers more accurately gauge students’ mathematics learning progress. At this time, the use of performance tasks for systematic, widespread data collection across K-8 is not in place in the MiC districts. Districts are at varying stages of developing and integrating performance tasks into their assessments. They share a similar end goal of ensuring these tasks provide teach-ers the necessary information to inform and modify their instruction.
» While the 2014 Smarter Balanced field tests generally went well, the MiC districts vary in their capacity to administer computer-based assessments at scale. Districts still face a variety of challenges to implementing the new online assessments, including the interface between software and hardware, student capacity to complete online assessments, school-site capacity for technology use, and a sufficient number of iPads and laptops.
Pulling from specific district experiences and perspectives, these primary findings are supported below by a more detailed narrative.
GOALS OF BENCHMARK ASSESSMENT SYSTEMS
The shift to CCSS implementation has spurred districts to re-examine the function of their assessment systems at many levels. Schools and teachers need assessment data—both interim and summative—to understand how students are faring as they seek to master the new mathematics stan-dards. Meanwhile, districts need interim student achievement data to measure progress toward successful implementation of the CCSS and, more importantly, to identify potential instructional gaps that can be supported through teacher professional development. MiC districts expressed the desire for their new assessment systems to accomplish all of these goals, to varying degrees.
Goal 1: Informing instructional practice. At this early stage of CCSS implementation, virtually all MiC districts are thinking well beyond measures of accountability (while still acknowl-edging their importance) and focusing more on measures of student understanding. The changes that MiC districts have been making to their assessment systems have been influ-enced by the desire to improve instruction and student learn-ing at the school level—to generate student performance data that teachers can use to inform their instructional practice. Districts understand that teachers are being asked to teach math in ways that are much different than before, and there-fore need to closely monitor student performance to know where—and why—students are succeeding or falling behind, in order to modify their instruction accordingly.
“We want to be as formative as possible while also, from a leadership role, understand how we are progressing.”
While benchmark assessments are not necessarily the primary source of formative data on student learning—most districts still have formative assessments built into the cur-riculum that classroom teachers use on an ongoing basis—districts see their benchmark assessments as an additional data source for improving instruction. Santa Ana articulated it this way: “We want every assessment to inform teachers.”
The “word cloud,” shown on page 10, captures the goal statements that we received from the districts when we asked about the objectives of their benchmark assessment systems. The centrality of focus on teachers, students, instruction, and data is clearly illustrated in the diagram.
Goal 2: Informing professional development. In addition to providing benchmarks for measuring district progress, new benchmark assessment systems are also providing evidence of where students are struggling in relation to the standards. When analyzed districtwide, this sort of data can

10
help districts identify current professional development and training for helping teachers better support their students.
In Dinuba, for instance, principals use the benchmark assessment system strategically to identify potential gaps in teacher knowledge and/or practice, and create appropri-ate long-term plans for teacher professional development. Principals in Garden Grove use the data in a similar man-ner, reviewing assessment reports with individual classroom teachers and Teachers on Special Assignment and recom-mending appropriate professional development. In Garden Grove, the district also plans to use benchmark assessment data to monitor the effectiveness of its programs (like the textbook adoption pilot math program) and to help evalu-ate the effectiveness of various professional development initiatives (like the professional development from the University of California at Irvine Mathematics Project). In this case, the analysis of benchmark assessment data will be just one way to determine whether certain programs result in increased student performance over time.
Goal 3: Measuring school and district performance. While districts are using the benchmark assessments
formatively to inform instructional practice, many MiC districts also acknowledged that there is a need for these assessments to be able to track school and district perfor-mance. This dual-use of benchmark assessment data has influenced the development of the systems and the plans for implementation.
For example, in Sanger, the District Progress Assessments (DPAs) began many years ago as summative assessments in response to a request for information on the general progress of the district from the then Superintendent. But as information needs expanded beyond just progress-reporting, and as the district has become more experienced with benchmarking, more effort has been directed at using the DPAs formatively, especially for 2014/15. As Sanger officials noted, “We want to be as formative as possible while also, from a leadership role, understand how we are progressing.” Because benchmark assessments in Sanger are typically the same for each grade across schools, administrators see these measures as providing a “common language” and comparable data with which to examine school- and district-level performance, monitor implementation, and judge the effectiveness of new teaching strategies.
Figure 3. Word Cloud: Math in Common Districts’ Updated Benchmark Assessment Systems
Source: Authors’ interviews with leaders from each of the 10 Math in Common districts.

11
“We are thinking of all the different ways we can support teachers with data use.”
Collection of assessment data, as well as its analysis and use, have been variable across school sites in San Francisco, but they have steadily increased over the last few years. The impetus for increased data collection, analysis, and use was implementing common benchmark assessments. Previously, data use was limited to looking at annual summative distric-twide data. Now, the district can use the common assess-ments to assess performance within the school year across classrooms and schools, and teachers can analyze changes in student progress. District staff and centrally based Instructional Reform Facilitators work at school sites to help teachers learn to use data to inform instruction; principals also receive direct data-use support, including tools for reflecting on the aggregated assessment data.
DEVELOPING AND UPDATING BENCHMARK ASSESSMENT SYSTEMS
With different systems and contexts, the MiC districts are taking a variety of approaches to developing, modifying, and implementing benchmark assessment systems in the 2014/15 school year, Several MiC districts have a culture and long track-record for building assessment systems. The work to develop and/or modify these systems often involves a systemwide culture that supports a process for high-quality development and piloting of assessments. In some cases, the districts have developed a new system for this school year, while other districts have maintained or slightly modified their existing systems, which many districts have invested years of effort to create. We highlight examples from several of the MiC districts below to illustrate the range of approaches to development and implementation.
Over the past several years, Long Beach had an assess-ment system that district and school staff found useful
and functional. However, the system’s trimester, quarter, semester, and end-of-course exams included only multiple-choice items, each addressing only one standard. These exams were suspended in 2013/14 as the district began the transition to the Smarter Balanced assessments. Long Beach Unified spent the 2013/14 school year creating new unit assessments for math courses across all grades (i.e., kinder-garten mathematics through high school geometry). The new assessments were created by district coaches and were modeled after the computer-adaptive portion of the Smarter Balanced pilot test. In all, a total of 98 unit assessments (i.e., benchmark assessments) have been created; each math-ematics course typically comprises from 5 to 8 units over the course of the year. All schools and grades will administer the unit assessments uniformly across the district, using the same schedule (an assessment calendar has been created for 2014/15), and subsequently scored using a common rubric. The assessments will be administered initially using paper and pencil, and results will be included as part of an achievement report for students in grades K–5 and part of the report card for students in grades 6 and higher.
Elk Grove is working to establish the groundwork for a vastly more extensive benchmark assessment system than it has in place right now. The district plans on developing a system that extends beyond mandatory assessments for grades K–1 and voluntary assessments for grades 2–6. As stakeholder buy-in is critical to moving the process forward, the district has established an assessment action team. The district appointed a broad cross-section of people to the team to help develop stakeholder buy-in for implementation

12
of a new assessment system, rather than pushing implemen-tation by district mandate.
The Elk Grove assessment action team has identified the “need to collaboratively find an optimal balance among [formative, benchmark, and summative] assessments,” because “each approach only provides a portion of the information students, teachers, and stakeholders need.”
The Elk Grove assessment action team is scheduled for an initial meeting in October 2014 and plans to meet monthly and hold interim work group meetings. It is developing plans for assessment development and usage guidelines, profes-sional development for teachers and principals, implementa-tion monitoring, and a communication strategy. The team has identified the “need to collaboratively find an optimal balance among [formative, benchmark, and summative] assessments,” because “each approach only provides a por-tion of the information students, teachers, and stakeholders need.” While Elk Grove does have processes and practices in place to support its current assessment system (such as an in-house Student Information System and assessment devel-opment procedures), the district also has the opportunity to build an integrated assessment system from the ground up.
Garden Grove has maintained many facets of its assess-ment system, while also recognizing the need to modify the types of test items. In modifying the system the district worked with Key Data Systems (a vendor) to create new trimester assessments for grades K–6. Key Data Systems selected items from an item bank—to be reviewed by district
staff—to assess the standards being taught each trimester. Items being used in 2014/15 are new, as they are aligned to the new district instructional pacing calendar, which sets the pace for teaching the CCSS. Teachers on Special Assignment (TOSAs) and classroom teachers reviewed the assessment items and compared them to items from the district’s current mathematics unit assessments. TOSAs and teachers then made recommendations for changes to (1) clarify items; (2) align items more closely to content standards being assessed; (3) eliminate items that are duplicated in other assessments; and (4) eliminate items that lacked rigor.
Sanger’s assessment system is grounded in its District Progress Assessments. The district currently administers three interim assessments, relying on a centralized item bank purchased from Illuminate Education. Grade-level com-mittees of teachers reviewed samples of assessments and decided on the number of items to be used to assess each content standard.
“We keep an eye on student learning. We don’t want to get away from [it]. Benchmarking is just one way of looking at student learning. We triangulate as much as we can when thinking about [it].”
Originally, Sanger’s District Progress Assessments, which originated from an impetus to understand precisely whether and how the district was progressing in meeting its account-ability benchmarks, functioned as a summative assessment. In prior years, the district administered only identical bench-mark assessments to students three times a year (in August, November, and March). The number of items used to mea-sure each standard was small, typically only two questions, so the tests were not adequately assessing student progress.

13
Benchmark assessments: existing instruments or built from scratch?
Why one district chose to build assessments in-house, while another selected items that were available through external providers.
In Sanger, district leadership chose to engage teachers to develop the district’s benchmark assessments, noting that there is great power in engaging teachers in the assessment development process. One district adminis-trator noted, “I am hesitant about buying a test. I like to engage our teachers because there is great learning that takes place. When you take teachers out of the process, you lose something.”
In Oakland, the district opted to include MARS tasks in their benchmark assessments because of their alignment to the Smarter Balanced assessments and their proven reliability and validity. While aware of the professional learning opportunity created by engaging teachers in assessment development and scoring, the interviewee noted, “We didn’t experience it that way. We didn’t want to tinker with the task. We didn’t want to lose that ability to say, if we scored it accurately we could really have reliable results.”
However, the district now wants to ensure its system gener-ates formative assessment data that can have an impact at the classroom level by identifying programmatic, teacher support, and student intervention needs.
Dinuba’s existing benchmark assessment system has been in place for approximately 10 years, along with the district’s standards-based report card. To align the system with the CCSS, district staff and academic coaches worked with a consultant from the Tulare County Office of Education to develop benchmark assessments using a new item bank linked to the district’s new Education Assessment Data Management System; the team used items from additional sources when the item bank was not sufficient. While the district requires that only items from its own assessments be used in benchmark assessments, the district plans on solicit-ing feedback from teachers regarding the assessment items, keeping the possibility of further revisions open.
San Francisco has used Common Learning Assessments as benchmarks two to three times annually for several years to gather data on students’ mastery of math content. Now it is modifying testing windows, grades tested, and platforms to ensure that the broadest group of teachers possible find the assessment data useful for their instruction, while also preserving the district-level reporting. The assessments had previously been administered to students in grades 2–10 in paper and pencil format, with testing windows between two to four weeks in duration. Now, starting in 2014/15, students in grades K–1 will also participate, engaging in performance task-based assessments like students in grades 2–10 have already been doing. Testing windows have also been expanded to between four and six weeks, allowing for students to take the assessments at times that connect best with instructional opportunities.
Oakland has created a master assessment calendar that displays the schedule for administering a variety of assess-ments—end-of-unit, interim Smarter Balanced, and site-based—and shows how assessments at each level can be used for both summative and formative purposes. School sites are encouraged to use curriculum-embedded assess-ments in mathematics to meet their ongoing information needs. However, for K-5 at three select points during the year, the data from these assessments are reported to the
district so district leaders can look across schools to gauge student progress. (A similar structure is in place at the sec-ondary level, but with mid-year and end-of-course exams instead.) Schools are not formally required to conduct all of the assessments throughout the year, but the district calendar, along with the district’s Continuous Improvement Guide (which identifies an area of focus for schools across the district to reflect upon each month), reinforces the expectation that ongoing, curriculum-embedded assess-ments will be used to drive improvement efforts. Instead of mandating the use of assessments, the district is trying to provide opportunities through the existing framework for data analysis and reflection that will ultimately build school capacity to gather and use data to identify and address students’ learning needs.

14
interim assessments unless the district review deems the assessments of poor quality or if they cannot be integrated into the district’s assessment system. In addition, the district must still determine whether they will implement the Smarter Balanced interim assessments right away or conduct an initial pilot test, which may delay the integration of Smarter Balanced interim assessments into the current system. Garden Grove also anticipates adopting the Smarter Balanced interim assessments if the assessment data can be integrated into the district’s data management system.
Sacramento City is working with three vendors to develop benchmark assessment items, and is planning to incorporate items from the Smarter Balanced interim assessments within its own system predicated on the assumption that the items will be well aligned to CCSS. Currently, the district is not completely satisfied with the rigor of the items provided by its vendors, or with the items’ alignment to the Standards for Mathematical Practice (SMPs) and CCSS-M. Accordingly, the district’s back-up plan is to use greater numbers of Smarter Balanced interim assessment items if they remain dissatisfied with the items provided by its vendors. The district acknowledges that while it is uncertain how the final Smarter Balanced items will differ from those provided by its external vendors, the Smarter Balanced items will likely be appropriately rigorous and aligned with the CCSS-M, given the resources devoted to the consortium throughout the development process.
Other districts noted that they will likely review the Smarter Balanced assessments when they are made available, but noted that they were not ready to commit to using them, even if the items are found to be adequate. Santa Ana
PLANS FOR INTEGRATING SMARTER BALANCED INTERIM ASSESSMENTS
The timing of the release of Smarter Balanced interim assessments has not prevented MiC districts from mov-ing forward in a number of ways: aligning accountability frameworks to CCSS; developing or modifying benchmark assessment systems; providing structures and supports to facilitate implementation of the updated assessment systems; and working to prepare for the administration of Smarter Balanced interim and summative assessments. More than half of the MiC districts plan to review and, pos-sibly, adopt the Smarter Balanced Interim Comprehensive Assessment and/or the Interim Assessment Blocks once they are released. In the meantime, districts are develop-ing, modifying, and/or implementing their own benchmark assessment systems to varying degrees, though they are uncertain how accurately their benchmark assessments will predict students’ performance on the Smarter Balanced summative assessments. Each MiC district fully realizes the benefit of their investment in data systems that will allow for predictive validity studies to be conducted as soon as the 2015/16 school year for near-term outcomes. Figure 4 below points out expected key milestones in the SBAC roll-out in the coming year.
Assessing whether to use Smarter Balanced interim assessments. Elk Grove is currently awaiting the release of the Smarter Balanced interim assessment item bank before making a determination of its use. The district has indicated that it will likely borrow from the Smarter Balanced
Figure 4. Smarter Balanced Assessment Consortia Timeline
SPRIN G 2 014
Field test of summative and interim assessment items and performance tasks.
O CTO B E R 2 014
Digital Library available for use by member states.
D E CE M B E R 2 014
Interim Assessments available for use by member states.
SPRIN G 2 015
Summative assessment available for use by member states.
SU M M E R 2 015
Final achievement standards for the summative assessment verified and adopted.
Source: Fensterwald (2014) and Smarter Balanced Assessment Consortium.(n.d.)

15
acknowledges that it does not know if its current bench-marks will be well aligned to Smarter Balanced summative assessments. The district will screen the Smarter Balanced interim assessments, but does not yet know whether it will supplement the district’s current system or fully adopt the Smarter Balanced interim assessment system. Meanwhile, Long Beach has an assessment committee that will ulti-mately decide if the district will subscribe to the Smarter Balanced interim assessments.
Both Dinuba and Oceanside plan to review the Smarter Balanced Interim Comprehensive Assessments and Interim Block Assessments for possible use, but will delay possible implementation of such items until next year. One of the districts, Oceanside, does not find it feasible to introduce a new assessment system mid-year, while the other, Dinuba, expressed concerns about reporting functions and capabilities of the Smarter Balanced interim assessments, commenting, “We want to see what kind of reports we can get back, whether we can use them with our own data analysis platform.”
The Smarter Balanced assessments have been incorporated into the assessment calendar in the Oakland Unified School District. These interim assessments will be used in grades 3–5 in February 2015, (the second assessment window during the 2014/15 school year), in part to serve as an implementa-tion check and also to provide student baseline data. District officials noted that while they were not completely sold on the sample Smarter Balanced interim assessment items made available to districts prior to the school year, they do antici-pate that future versions will serve as adequate assessments.
Alignment of Smarter Balanced interim assessments. Another factor in districts’ decisions to incorporate or wholly adopt Smarter Balanced interim assessment items into their systems is how well the assessments align with the local curriculum, and the assessments’ ability to predict students’ performance on the Smarter Balanced summative assess-ments. For instance, Garden Grove anticipates adopting the Smarter Balanced interim assessments, in part because of the expected alignment between benchmark and summa-tive assessments. The district would fully vet the Smarter Balanced interim assessments prior to any adoption, but the district anticipates that “the match is going to be closer than anything else that’s available.”
Educators in Long Beach created their own unit assess-ments, which they have worked on diligently to increase the likelihood that the assessments will accurately predict students’ performance on the Smarter Balanced summative assessments. The new unit assessments were created by district coaches and were modeled after the computer-adaptive portion of the Smarter Balanced pilot test.
The other MiC districts are taking a “wait and see” approach to the release of the Smarter Balanced interim assessments. For instance, Sanger is approaching changes in its bench-mark assessment system cautiously, given its deliberate development over a ten-year period. Currently, the district recognizes that it is unlikely that their benchmark assess-ments, relying on the Illuminate item bank and other sources, will be predictive of Smarter Balanced summative assessment scores. Over the next few years, the district will be striving to ensure that their benchmark assessments are highly corre-lated with the Smarter Balanced. “But right now, we are being careful about the mindset and the pressure we are putting on teachers. We are trying to establish a growth mindset. We don’t want to overemphasize any single measurement.”
Similar to Sanger, San Francisco has no immediate plans to use the Smarter Balanced interim assessments. As one official explained, “[District administrators] don’t think the Smarter Balanced will be as useful as what we have already designed and mapped out.” San Francisco is confident that its district-designed benchmark assessment system is better aligned to its math curriculum. The district also has concerns about all the changes as a result of CCSS-M implementation

16
and assessment. “The more we approach a growth mindset rather than an accountability paradigm, we will gain better credibility with our teachers in that we are doing this to sup-port them rather than to measure them.”
+2=8 5x
With an ongoing need for student assessment data for both formative purposes (e.g., to inform and improve instructional practice) and summative purposes (e.g., districts’ account-ability progress reporting), districts have had to grapple with several issues related to updating their benchmark assessment systems: whether they will integrate the Smarter Balanced interim assessments into their benchmark assessment sys-tems; whether their benchmark assessments can accurately predict student performance on the Smarter Balanced summative assessments; and whether to wholly adopt the Smarter Balanced interim assessments or incorporate Smarter Balanced items into a district-developed benchmark system. At least two MiC districts underscored the poor timing for the release of the Smarter Balanced interim assessments—as their release has been postponed to the middle of the 2014/15 school year. Nonetheless, given the need for benchmark assessment data and the constraints within which the MiC districts must function, they are making significant progress addressing the interim assessment of student progress and district accountability related to that progress.
STRATEGIES FOR SUCCESSFULLY IMPLEMENTING NEW BENCHMARK ASSESSMENT SYSTEMS
As districts are building, updating, and implementing new benchmark assessment systems, they are engaging in a number of activities to support the successful implementa-tion of these systems and to ensure they produce reliable data to inform classroom instruction. Promisingly, many of these activities are aligned with research on the effective use of student assessments, such as creating a formal plan to guide assessment use; involving stakeholders at multiple levels; and providing adequate time for professional develop-ment on data use and for review of assessment data, as well as integrating data analysis and reporting systems.
Strategy 1: Start with a written plan. One important, if obvious, strategy for implementing a new assessment system is to begin with a written implementation plan. In Oakland, the district uses their Continuous Improvement Guide to focus schools’ attention on using assessment data to improve instruction. The Guide identifies an area of focus for schools to reflect upon each month and includes related questions designed to get principals and schools to identify and analyze data on student achievement and school improvement. The guide even offers examples of data that are available (e.g., math end-of-course Performance Task district reports, diagnostic math school-level data, class-room assessments, etc.) to address each question.
In addition, as stated earlier, Oakland recently created a master assessment calendar in mathematics that displays the schedule for administering a variety of assessments—end-of-unit, interim Smarter Balanced, and site-based—and shows how each of these assessments can be used for both summative and formative purposes. A common reference guide, like Oakland’s master calendar, helps ensure staff across the district are on the same page in terms of sched-ule and expectations for implementing new assessments.
Strategy 2: Secure teacher buy-in. In some cases, districts have included teachers and school staff in the development of the assessment plans, written or otherwise, in order to

17
Using Professional Learning Communities to Facilitate Data Use
While PLCs have been in place for quite some time in Oceanside, there is a renewed emphasis on strengthen-ing their effectiveness districtwide (at all schools and all grade levels) by integrating systematic data use, with strong support and encouragement from the new Deputy Superintendent. The renewed focus on PLCs is the district’s foremost strategy to improve CCSS-M implementation, build solid teaching practices (par-ticularly regarding the instructional shifts associated with implementing the Standards for Mathematical Practice), and ultimately enhance student mastery of the CCSS-M standards.
It is expected that staff at all levels will participate in PLCs as envisioned by the district. District administra-tors will be visiting PLCs and principals will be evaluat-ing how PLCs are functioning, with the purpose of ensuring that these teacher communities provide an effective structure for teacher collaboration and, more specifically, use of student achievement data from a variety of sources, including benchmark assessments and student work. The PLCs are built around four primary questions: (1) What do we expect our students to learn? (2) How will students demonstrate they have learned it? (3) How will we respond when students don’t learn what we expect them to learn (e.g., students needing intervention)? And (4) How will we respond when they already know what we expect them to learn (e.g., students in gifted or advanced programs)?
create buy-in at the site level, another factor associated with effective student assessment systems.
In Elk Grove, the future assessment action team will be charged with developing an assessment plan for 2015/16. The team comprises elementary, middle, high, and alterna-tive school site administrators; general, special education, and English learner teachers; district administrators for educational services departments (Special Education, Learning Support Services/English Learner, Curriculum and Professional Learning, and Research and Evaluation); rep-resentatives from district Technology Services, Elementary Education, Secondary Education, and Communications; and representatives from the Elk Grove Education Association. The broad representation on the team is a result of the district’s desire to develop stakeholder buy-in for implemen-tation of the new benchmark assessment system, rather than push implementation by district mandate.
In San Francisco, district staff has increased teacher buy-in and support by making changes to the benchmark assess-ments to make them more relevant and useful for teachers. Previously, some teachers found the benchmark assessments used by the district to be of limited use because the assess-ment items did not match what they were teaching in their classrooms. However, the district is revising the benchmark assessments so they will be embedded throughout the cur-riculum in 2014/15—so the district anticipates that teachers will see them as more relevant to their instructional practice than in the past. Further, the district believes this updated approach to benchmarking will help communicate to teach-ers that the assessments are designed to support teacher planning and instruction, not to evaluate teacher perfor-mance.In Garden Grove, the district is fostering teacher buy-in by taking a gradual approach in order to make the transition smoother for teachers. The district explained that performance tasks will not be included in the first iteration of their new assessment system in 2014/15—in consideration of the vast demands already placed on teachers. District officials also believed they could garner teacher support for the new system by introducing new assessment items gradually, as the year progressed, rather than with the initial benchmark assessment administration in the first trimester.
Strategy 3: Provide professional development. Used in relation to many district improvement efforts, professional
development is a common and valuable tool for support-ing teachers in new initiatives. For instance, last year in Long Beach the district dedicated significant time and resources to providing direct training to all math teach-ers on CCSS-M implementation. This training familiarized teachers with the new math units and reviewed how to administer and use the corresponding unit assessments that had been created by Long Beach teachers; each teacher participated in three half-day training sessions. In 2014/15, the district will expand the training to three

18
full-day sessions and will include a discussion of strategies on how to use formative data from unit assessments to improve classroom instruction.
In their training, Long Beach does not refer to the unit assessments as formative assessments because they want teachers to think of formative assessment as an ongoing activity that happens in the classroom on a regular basis. Although the district still considers the unit assessments as a tool to help identify students’ strengths and weaknesses and to provide information that teachers can use to modify instruction, they differentiate them from formative assess-ments by noting that the unit assessments are designed to collect “bigger chunks of data, less frequently.” The district wants teachers to associate their formative assessments with the word FAST, in that they provide Feedback that is Accurate, Specific and Timely.
Sacramento City provides similar support to teachers through the use of training specialists and instructional coaches. These staff meet with teachers to review all assessment data and identify common patterns or areas of concern, as well as helping teachers use the assessment data to identify the content and skills they should address in sub-sequent lessons. Schools have also used faculty meetings to hold data discussions and have allocated some of the teach-ers’ annual 18 hours of professional learning time to create opportunities for a “deep-dive” into assessment data.
Strategy 4: Provide opportunities to score assessments and analyze and review data. Creating time for teachers to score assessments or analyze assessment data is a chal-lenge for nearly all districts. Some are restricted by union regulations on teachers’ work hours that limit opportuni-ties for collaborative scoring or data review, but all of the MiC districts have tried, to some degree, to find time for this important embedded professional learning.
For example, in the Dinuba Unified School District, teachers are provided release time for calibration and scoring at each grade level. Time is built into the district’s assessment calen-dar for scoring and analysis before any benchmark assess-ment data are even entered into the central data system. In Santa Ana, teachers are required to meet within two weeks of the benchmark assessment administration date, and must
have two or more people work together to score the tests. In order to meet this deadline, the district provides flexible scheduling options. Teachers can request a substitute to free up time during the school day for scoring, or meet after school or on Saturdays and receive compensation for work outside the traditional school schedule.
Some districts are creating, or have created, Professional Learning Communities (PLCs) specifically devoted to analy-sis and/or scoring of student assessment data. For instance, in Oceanside, the district is implementing grade-level PLCs in 2014/15 to provide the structure and opportunity for benchmark assessment scoring and discussion. Similarly, Sanger has embedded data analysis protocols in all their PLCs as part of a deliberate shift toward enhancing the formative use of student assessment data.
Strategy 5: Identify systems for analyzing and report-ing data. The new assessments will generate a sizable amount of data and will require a system to store, analyze, and report data to interested stakeholders. Beginning in 2014/15, the Dinuba school district is using the Education Assessment Data Management System to manage and process all of its assessment data. All benchmark assess-ment data are uploaded into this platform and reports are generated for users at multiple levels. Teachers can print a variety of their own reports for analysis, and the district can produce school-, grade-, and classroom-level reports to compare across sites and grades. These reports are used during scheduled data-use sessions with the principals and district administrative cabinet.
In addition to using technology to facilitate data use, like in Dinuba, districts mentioned the importance of their data specialists as resources for analyzing and interpreting data. For example, in Sanger, data specialists have generally facilitated the use of benchmark assessment data at both the district and site level. The data specialists are charged with continually pushing the district to “look at data differ-ently and push everyone” to improve their data use skills. Most importantly, the data specialists are trying to make sure that the district has a solid focus on using data to better support its students and that staff learn to use data more frequently to inform conversations with site leaders and teachers accordingly.

19
ASSESSMENT ITEM TYPES: FROM MULTIPLE CHOICE TO PERFORMANCE TASKSOne of the challenges facing all MiC districts as they develop and implement their benchmark assessment systems is the need to move beyond a reliance on multiple-choice or selected-response items. To align with the depth and rigor of the CCSS-M, districts will need to identify and/or develop constructed-response items and performance tasks to include in their assessments. These items will help districts more adequately gauge students’ mastery of the Standards for Mathematical Practice (SMPs) and the deeper content knowledge required by the CCSS-M.
Accordingly, a wide range of approaches to performance tasks are being deployed in MiC districts in 2014/15. Some districts have adopted Mathematics Assessment Resource Services (MARS) tasks and scoring rubrics, having previ-ously piloted MARS performance tasks in a subset of grade levels, while other districts have delayed the inclusion of performance tasks in their benchmark assessments until the 2015/16 school year. (MARS tasks are formative perfor-mance assessments designed to support CCSS implementa-tion. MARS works with states and districts on the design of performance assessments and professional development for teachers.)
Overall, there is a range of progress being made by MiC districts in introducing performance tasks and constructed-response items as part of their benchmark assessments. More progress is expected during the coming year as the districts invest in their teachers’ capacity to score and report these data, as well as use them for formative purposes. There is also a range of views on whether to include these types of test items this school year, or delay their introduction until 2015/16. During the 2014/15 school year, slightly more than half of MiC districts will be administering some performance tasks and/or constructed-response items as part of their benchmark assessments. The systematic collection of these data at the school-site and district level will be a critical follow-on step to the administration.
Incorporating performance tasks in 2014/15. At the elementary school level, Oceanside is making a significant
shift away from multiple-choice test items and toward per-formance tasks in its benchmark assessments. In contrast to last year, this year the majority of test items will be perfor-mance-based at the elementary level, with a few multiple-choice items possibly included. Although this is quite a shift from the benchmarking system employed last year at the elementary level, thus far it has been well received by teach-ers and should help them focus on student work more pro-ductively during grade-level PLCs. As in the previous school year, in 2014/15 benchmark assessments will consist of three MARS-based performance tasks at the middle-school level (i.e., grades 6–8) and will measure the same three concept areas (i.e., ratios and proportions, number sense, and expressions and equations) to better assess student growth/mastery by providing continuity across grades.
During the 2014/15 school year, Dinuba’s benchmark assessments will include multiple-choice items, constructed-response items, and performance tasks. One interviewee indicated, “We will move a little slowly with performance tasks in that the first trimester benchmark will probably not include one. The second trimester benchmark most likely will include a performance task.” At this point, all K–8 benchmark assessments are paper and pencil, but the district is planning to go computer-based, and possibly computer-adaptive, in the future.
Oakland is in a major period of transition, with the new dis-trict leadership committed to two primary assessment goals related to student data: (1) using appropriate assessments to collect student learning data and (2) creating structures that provide principals and site administrators with the support and flexibility to focus on collecting and analyzing assess-ment data. Oakland selected and built their assessments based on key content and skills in the CCSS-M that students are expected to master at each grade level. The district drew from the MARS performance tasks, in large part, because of their established psychometric properties (i.e., reliability and validity). Curriculum development and textbook adoption were informed by the district’s assessment system. As the district described it, “We built the assessment structure, then we bought the text to fit it.”
Rather than purchasing assessment items, Long Beach chose to write their own unit assessments for math courses across all grades (from kindergarten math to high school

20
geometry) and there are a “good number” of constructed-response items, which will require teachers to examine student writing and mathematical reasoning. The assess-ments, created by district math coaches, were modeled after the computer-adaptive portion of the Smarter Balanced pilot test. The district estimates that approximately 60 percent of the items across all the assessments will cover the Depth of Knowledge (DOK) Levels 1 and 2; 40 percent of items will cover DOK Level 3 (DOK levels allow for a comparison of the cognitive demand of the CCSS and the Smarter Balanced assessments); and about 75 percent of the items will address the major math clusters, with the remaining 25 percent addressing the supporting clusters. (Clusters are groups of related content standards; the distinction between “major” and “supporting” is used to describe the intensity of focus of clusters in each grade level or course.)
Planning for future use of performance tasks. In Elk Grove, all benchmark assessment items are currently multiple-choice. The district’s first step in redesigning its benchmark system was establishing an assessment action team. The team is “waiting for the interim Smarter Balanced assessments” to see whether they will serve as a viable
benchmark assessment, in lieu of having the district develop its own benchmark assessments. Currently, assessments are paper and pencil and data are scanned directly into and aggregated within the student information system. Reports can be generated at the student, class, grade, or school level. The district technology department is aware of the need to modify the current system to accommodate the anticipated changes in assessment item formats.
Garden Grove will not include performance tasks within its benchmark assessments during the 2014/15 school year, relying instead on selected-response items during the first trimester, and constructed-response items in the second and third trimester assessments. The district is taking this multi-step approach to ensure a high degree of teacher buy-in by gradually introducing different types of assessment items as the school year progresses. A district administrator indicated, “This first trimester benchmark is going to look more similar to what our teachers are used to than where we will be by the end of the year.” The district is also working to enhance technology at its school sites to support the use of the new item types.

21
Considerations for the Future
As CCSS-M implementation continues and benchmark assessment systems continue to develop to support instructional shifts, a few considerations for the future rise to the surface:
» Because of varying district context, what works well in some may not work well in others. Accordingly, dis-tricts will need to be flexible in updating their student benchmark assessment systems—to ensure the systems meet their districts’ expectations and demands. Real-time consultation within and between the MiC districts can provide an opportunity for thinking and rethinking some of the strategies that are being piloted in the 2014/15 school year.
» As always, assessment and instruction are closely intertwined. When planning for implementation of the CCSS-M and aligned benchmark assessments, districts should continue to think about how their vision for student assessment and mathematics instruction can complement each other most effectively. Several exam-ples have been highlighted that emphasize Professional Learning Communities as a promising venue for these discussions.
» As districts gain greater understanding of the CCSS-M through ongoing implementation, they must be able to transfer learning into future adaptations of their stu-dent benchmark assessment systems. Ongoing discus-sions within and across the MiC districts about whether their assessment system is delivering the data needed
to meet instructional, professional development, and accountability goals will be critical and districts must be prepared and supported to engage in continuous improvement cycles.
» Benchmarking systems are costly to implement — in both time and money. As described throughout this report, revising district assessment structures will inevitably require substantial resources and an ongoing investment in staff development. Accordingly, districts that put more time and effort into the benchmarking process may have to seek additional resources or divert resources from other areas.
» Moving towards a more comprehensive benchmarking structure aligned to CCSS-M will likely require extensive investments in technology and training. The goal of improving student learning of mathematics should con-tinue to be the driver of technology changes.
» Extenuating circumstances, such as shifts in leader-ship or vision, may affect districts’ trajectory toward developing and implementing CCSS-M-aligned student benchmark assessment systems.

22
ReferencesEducation Week Research Center. (2014). From adoption to practice: Teacher perspectives on the Common Core. Education Week Research Center. Retrieved from http://www.edweek.org/media/ewrc_teacherscommoncore_2014.pdf
Fensterwald, J. (2014). State awards Common Core test contract. EdSource. Retrieved from http://edsource.org/2014/state-awards-common-core-test-contract/67158#.VCRIkvldU1IFens
Freeberg, L. (2014). Officials optimistic about spring assess-ments. EdSource. Retrieved from http://edsource.org/2014/officials-field-tests-bode-well-for-spring-assessments
Gewertz, C. (2013). Deluged by Common-Core “aligned” materials. Education Week: Curriculum Matters (Blog). Retrieved from http://blogs.edweek.org/edweek/curricu-lum/2013/07/deluged_by_common_core_aligned_materials.html
Gewertz, C. (2014). Big year looms for Common-Core test-ing. Education Week, 34 (3). Retrieved from http://www.edweek.org/ew/articles/2014/09/03/03assessment.h34.html
Glenn, G. (2014). Textbooks out of synch with Common Core. WYPR Baltimore (Radio). Retrieved from http://news.wypr.org/post/textbooks-out-synch-common-core
Henderson, S., Petrosino, A., Guckenburg, S., & Hamilton, S. (2007). Measuring how benchmark assessments affect student achievement. Washington, DC: U.S. Department of Education, Institute of Education Sciences. Retrieved from http://ies.ed.gov/ncee/edlabs/regions/northeast/pdf/REL_2007039.pdf
Henderson, S., Petrosino, A., Guckenburg, S., & Hamilton, S. (2008). A second follow-up year for measuring how bench-mark assessments affect student achievement. Washington, DC: U.S. Department of Education, Institute of Education Sciences. Retrieved from http://ies.ed.gov/ncee/edlabs/regions/northeast/pdf/techbrief/tr_00208.pdf
Blume, H. (2009). L.A. teachers’ union calls for boycott of testing. Los Angeles Times. Retrieved from http://articles.latimes.com/2009/jan/28/local/me-lausd28
California Department of Education. (n.d.). Taking center stage—act II (TCSII): Ensuring success and closing the achieve-ment gap for all of California’s middle grades students: Common benchmark assessments. Retrieved from http://pubs.cde.ca.gov/TCSII/ch2/comnbnchmrkassess.aspx
California Department of Education. (2001). Taking center stage: A commitment to standards-based education for California’s middle grades students. Retrieved from http://pubs.cde.ca.gov/tcsii/documents/tcsii.pdf
California Department of Education. (2014). Smarter Balanced field test questions and answers. Retrieved from http://www.cde.ca.gov/ta/tg/sa/smarterftqa.asp
Christman, J. B., Neild, R. C., Bulkley, K., Blanc, S., Liu, R., Mitchell, C., & Travers, E. (2009). Making the most of interim assessment data. Lessons from Philadelphia. Philadelphia: Research for Action. Retrieved from http://www.research-foraction.org/publication-listing/?id=42
Cristol, K. & Ramsey, B. (2014). Common Core in the districts: An early look at early implementers. Thomas B. Fordham Institute. Retrieved from http://edexcellence.net/publications/common-core-in-the-districts
Dolejs, C. (2006). Report on key practices and policies of consistently higher performing high schools. National High School Center. Retrieved from http://betterhighschools.org/docs/ReportofKeyPracticesandPolicies_10-31-06.pdf
Dougherty, C., Mellor, L., & Smith, N. (2007). Six key uses of longitudinal data. Washington, DC: U.S. Department of Education, National Center for Educational Accountability, Data Quality Campaign. Retrieved from http://relsouthwest.sedl.org/bridge_events/2014-02-25_slds/six_key_uses_of_longitudinal_data_021307.pdf

23
Herman, J. L., Osmundson, E., & Dietel, R. (2010). Benchmark assessment for improved learning (AACC report). Assessment and Accountability Comprehensive Center. Retrieved from https://www.cse.ucla.edu/products/policy/R2_benchmark_report_Herman.pdf
Herold, B. (2014). Boasts about textbooks aligned to com-mon core a “sham,” says researchers. Education Week: Digital Education (Blog). Retrieved from http://blogs.edweek.org/edweek/DigitalEducation/2014/02/claims_of_com-mon_core-aligned_.html
Lewis, C. (2010). A Public Proving Ground for Standards-Based Practice. Education Week, 30 (3). Retrieved from http://www.edweek.org/ew/articles/2010/09/15/03lewis.h30.html
May, H. & Robinson, M. (2007). A randomized evalua-tion of Ohio’s personalized assessment reporting system. Philadelphia: University of Pennsylvania. Consortium for Policy Research in Education. http://www.cpre.org/sites/default/files/researchreport/825_cpre-ohio-pars-report.pdf
Means, B., Padilla, C., DeBarger, A., & Bakia, M. (2009). Imple-menting data-informed decision making in schools: Teacher access, supports and use. Washington, DC: U.S. Department of Education.
Means, B., Padilla, C., & Gallagher, L. (2010). Use of education data at the local level: From accountability to
instructional improvement. Washington, DC: U.S. Department of Education, Office of Planning, Evaluation, and Policy Development. Retrieved from https://www2.ed.gov/rschstat/eval/tech/use-of-education-data/use-of-education-data.pdf
Olson, L. (2005). Benchmark assessments offer regular checkups on student achievement. Education Week, 25 (13). Retrieved from http://www.edweek.org/ew/articles/2005/11/30/13benchmark.h25.html
Peek, P.L. & Foster, D. (2012). Improved mathematical teaching practices and student learning using complex performance assessment tasks. Paper presented at the annual meeting of the National Council on Measurement in Education, Vancouver, BC.
Perie, M., Marion, S., Gong, B., & Wurtzel, J. (2007). The role of interim assessments in a comprehensive assessment system. The Aspen Institute. Retrieved from http://www.achieve.org/files/TheRoleofInterimAssessments.pdf
Smarter Balanced Assessment Consortium.(n.d.) School years. Retrieved from http://www.smarterbalanced.org/timeline/
Tucker, M. (2014). For the Common Core, a different sort of benchmark. Education Week: Top Performers (Blog). Retrieved from http://blogs.edweek.org/edweek/top_per-formers/2014/09/for_the_common_core_a_different_sort_of_benchmark.html