Embed Size (px)
DESCRIPTION
Materials Stock Analysis. By Joshua Carter & Kyle Shaner. Presentation Overview. Sector Recap Sell Recommendation Buy Recommendation Recommendation Summary New SIM Portfolio. Sector Recap. Current SIM Weight = 1.79% Current S&P Weight = 3.04% Continue to Underweight by 1.25%. - PowerPoint PPT Presentation
Citation preview

Fisher College of Business – Student Investment Management
Materials Stock Analysis
By Joshua Carter & Kyle Shaner

Fisher College of Business – Student Investment Management
Presentation Overview
Sector Recap
Sell Recommendation
Buy Recommendation
Recommendation Summary
New SIM Portfolio

Fisher College of Business – Student Investment Management
Sector RecapCurrent SIM Weight = 1.79%Current S&P Weight = 3.04%Continue to Underweight by 1.25%

Fisher College of Business – Student Investment Management
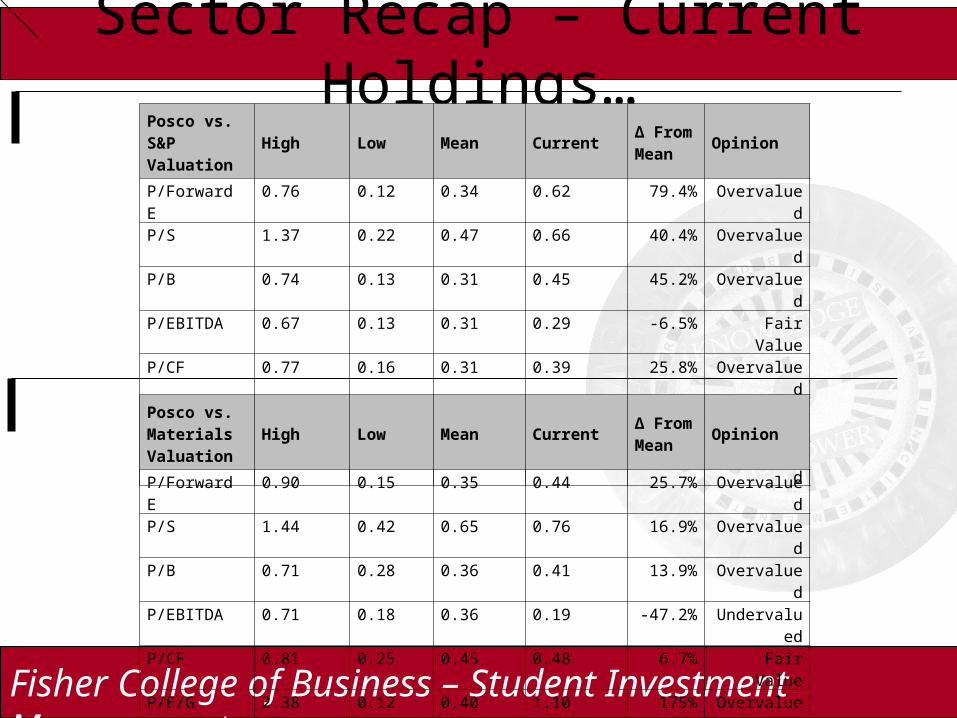
Sector Recap – Current Holdings
Unit Cost
Total Cost
Market Price
Market Value
Unrealized Gain/(Loss)
Loss
$117.06 $468,225.60 $52.11 $208,440 ($259,785.60) (55.5)%
Posco ADR (PKX)South Korean steel manufacturer
Hot-rolled steel
Cold-rolled steel
Stainless steel

Fisher College of Business – Student Investment Management
Sector Recap – Current Holdings…
POSCO Notable News Events
Geographic Segments Revenue Segments
Feb 2009 – 6% annual production cut
Feb 2009 – Iron Ore miners increase price 5%
Jan 2009 – CEO steps down after poor performance
Feb 2009 – Cuts stainless steel prices 10%
Dec 2008 – Announces 1st ever production cut at 10%
Korea64%Japan
6%
China14%
Asia/Pacific6%
North America2%
Others8%
Steel72%
Engineering and Construction
9%
Trading10%
Other9%
Fisher College of Business – Student Investment Management
Sector Recap – Current Holdings…Posco vs. S&P Valuation
High Low Mean Current∆ From Mean
Opinion
P/Forward E 0.76 0.12 0.34 0.62 79.4% Overvalued
P/S 1.37 0.22 0.47 0.66 40.4% Overvalued
P/B 0.74 0.13 0.31 0.45 45.2% Overvalued
P/EBITDA 0.67 0.13 0.31 0.29 -6.5% Fair Value
P/CF 0.77 0.16 0.31 0.39 25.8% Overvalued
P/E/G 2.60 0.09 0.47 1.46 211% Overvalued
ROE 1.80 0.42 0.92 1.08 17.4% Overvalued
Posco vs. Materials Valuation
High Low Mean Current∆ From Mean
Opinion
P/Forward E 0.90 0.15 0.35 0.44 25.7% Overvalued
P/S 1.44 0.42 0.65 0.76 16.9% Overvalued
P/B 0.71 0.28 0.36 0.41 13.9% Overvalued
P/EBITDA 0.71 0.18 0.36 0.19 -47.2% Undervalued
P/CF 0.81 0.25 0.45 0.48 6.7% Fair Value
P/E/G 2.38 0.12 0.40 1.10 175% Overvalued
ROE 1.76 0.63 0.99 0.95 -4.0% Fair Value
Fisher College of Business – Student Investment Management
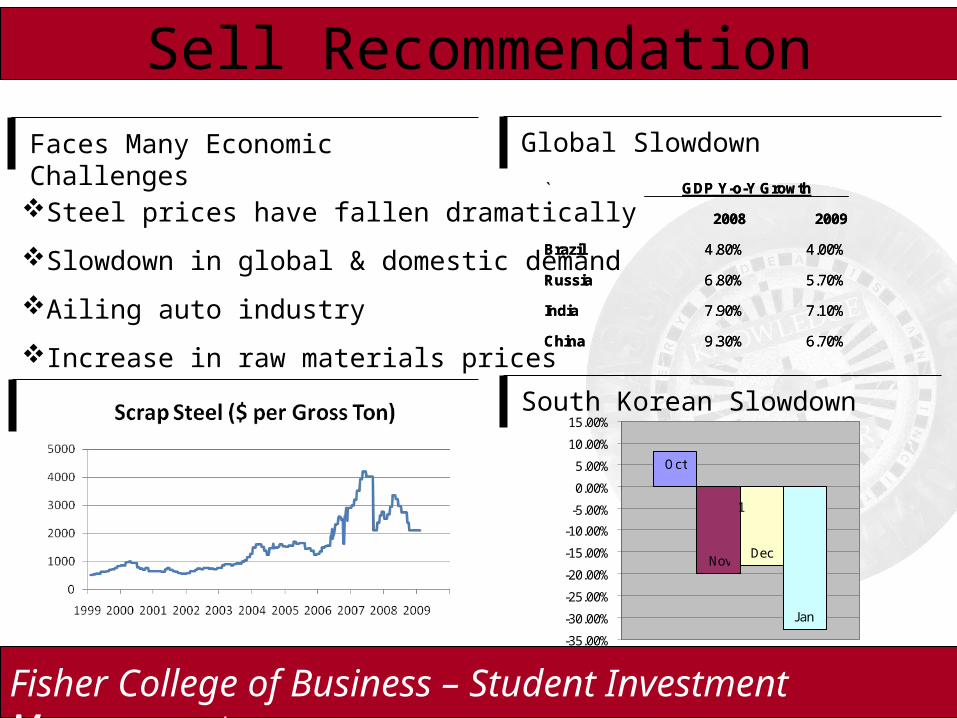
Sell Recommendation
Faces Many Economic Challenges Global Slowdown
Steel prices have fallen dramatically
Slowdown in global & domestic demand
Ailing auto industry
Increase in raw materials prices
South Korean Slowdown
` G DP Y -o-Y G rowth
2008 2009
B raz il 4.80% 4.00%
R us s ia 6.80% 5.70%
India 7.90% 7.10%
C hina 9.30% 6.70%
` G DP Y -o-Y G rowth
2008 2009
B raz il 4.80% 4.00%
R us s ia 6.80% 5.70%
India 7.90% 7.10%
C hina 9.30% 6.70%
Oct
NovDec
Jan
-35.00%
-30.00%
-25.00%
-20.00%
-15.00%
-10.00%
-5.00%
0.00%
5.00%
10.00%
15.00%
1

Fisher College of Business – Student Investment Management
Sell Recommendation…
Comparables Analysis
Entity NameEnterprise
ValueTotal Debt
Equity Value
EBITDA SalesEV /
EBITDAEV /
SalesP / E
Debt / EBITDA
EBITDA Margin
POSCO $16,830 $4,850 $14,480 $5,390 $22,810 3.12x 0.74x 5.46x 0.90x 23.63%US Steel $4,720 $3,160 $2,010 $3,410 $23,750 1.38x 0.20x 0.96x 0.93x 14.36%Nucor Corporation $11,490 $3,280 $9,650 $3,850 $23,660 2.98x 0.49x 5.13x 0.85x 16.27%Arcelor Mittal $52,900 $34,080 $25,250 $18,140 $124,940 2.92x 0.42x 2.62x 1.88x 14.52%AK Steel $756 $633 $607 $941 $7,640 0.80x 0.10x N/M 0.67x 12.32%Timken $2,320 $624 $1,120 $753 $5,660 3.08x 0.41x 4.21x 0.83x 13.31%Gedau AmeriSteel $4,110 $3,070 $1,630 $1,470 $8,530 2.80x 0.48x N/M 2.09x 17.23%
As of March 2, 2009. Data provided by Yahoo Finance

Fisher College of Business – Student Investment Management
Sell Recommendation…
DCF Analysis
DCF Sensitivity Analysis
Terminal Value 22,531 NPV of free cash flows 5,349 NPV of terminal value 9,555 Projected Equity Value 14,904
Shares Outstanding 301.6
Current Price 52.11$
Implied equity value/share 49.42$
Upside/(Downside) to DCF -5.16%
DCF Value Per ShareTerminal Discount
FCF Growth 8% 9% 10% 11% 12%1% $56.61 $48.32 $41.90 $36.79 $32.632% $63.14 $52.87 $45.19 $39.24 $34.503% $72.28 $58.94 $49.42 $42.30 $36.774% $86.00 $67.43 $55.06 $46.23 $39.625% $108.86 $80.17 $62.95 $51.48 $43.28

Fisher College of Business – Student Investment Management
Sell Recommendation…Absolute Valuation
Absolute Valuation
High Low Mean CurrentYour
Target Multiple
Your Target E,
S, B
Your Target Price
P/Forward E 18.50x 2.10x 7.30x 6.60x 6.60x $6.75 $44.55P/S 2.18x 0.36x 0.74x 0.41x 0.74x $62.34 $46.13P/B 2.30x 0.60x 1.00x 0.70x 1.00x $69.89 $69.89P/EBITDA 5.40x 1.10x 2.70x 1.30x 1.00x $37.63 $37.63
Average $49.55
Comparables Analysis Blended Multiples Price Target – Abs. & CompEntity Name P / E
2009E P/ E
POSCO 5.46x 6.60xUS Steel 0.96x 3.76xNucor Corporation 5.13x 7.40xArcelor Mittal 2.62x 4.58xAK Steel - 3.88xTimken 4.21x 8.21xGedau AmeriSteel - 3.85x
Averages 2.63x 5.47x

Fisher College of Business – Student Investment Management
Sell Recommendation…EPS vs. Volume & Steel Price – Sensitivity Analysis
Steel Price per TonPKX Steel Output (In millions of tons)
2007 32.11 Y-oY ∆
2008 32.48 1.2%2009 29.00 -10.7%
Implied Price per Ton2009E Sales $18,801Volume $29
Sales / Volume $648.32
*2009 Volume Projection per CEO
Income Statement2009E
Volume 29Steel 648.3
Sales $18,801Operating Expenses $15,919
EBIT $2,883Non-Op Expenses -$209
EBT $2,674
Taxes $692Net Income $1,982
Shares 302EPS $6.57
EPS Sensitivity AnalysisSteel Price per Ton
% ∆ from Dec 08 -20% -8% 4% 16% 28%Volume $500 $575 $648 $725 $800
25 $4.20 $4.90 $5.59 $6.32 $7.0227 $4.57 $5.34 $6.08 $6.86 $7.6329 $4.95 $5.77 $6.57 $7.41 $8.2331 $5.33 $6.20 $7.06 $7.96 $8.8333 $5.70 $6.64 $7.55 $8.50 $9.43
*Volume in millions of tons*December 2008 price of $625 per ton
Target EPS
2009E EPS Multiple PriceEPS Sensitivity Analysis Price Target $6.08 6.9x $41.95
Price Target

Fisher College of Business – Student Investment Management
Conclusion
SELL
US$ 45.00: Blended price target based on
DCF
EPS Sensitivity Analysis
Comparable & Absolute Multiple Valuation

Fisher College of Business – Student Investment Management
Buy Recommendation
DOW Chemical
Engages in manufacture and sale of chemicals, plastic materials, agricultural, and other specialized products
2008 Revenues of $57,514 billion: 7.4% increase
Strong growth expected in agriculture segments
Equity Trading Statistics
MarketPrice
% 52 Wk Hi P / E Market Cap 09 EPS est. Beta
$7.11 (84.0%) 11.52x $6.57 B $1.75/sh 1.48

Fisher College of Business – Student Investment Management
Buy Recommendation…
Geographic Segments Revenue Segments
Performance Plastics, 27%
Performance Chemicals, 16%
Agricultural Sciences, 8%
Basic Plastics, 23%
Basic Chemicals, 10%
Hydrocarbons & Energy, 16%
Other, 1%
US32%
Europe38%
Rest of World30%
Feb 2009 – Announces top executives won’t get cash bonuses
March 2009 – S&P cuts two short-term ratings
Jan 2009 – Rohm & Haas sues Dow
Feb 2009 – Cuts dividend 64% to 15 cents a share
Dec 2008 – Announces it will cut 11% of workforce
Fisher College of Business – Student Investment Management
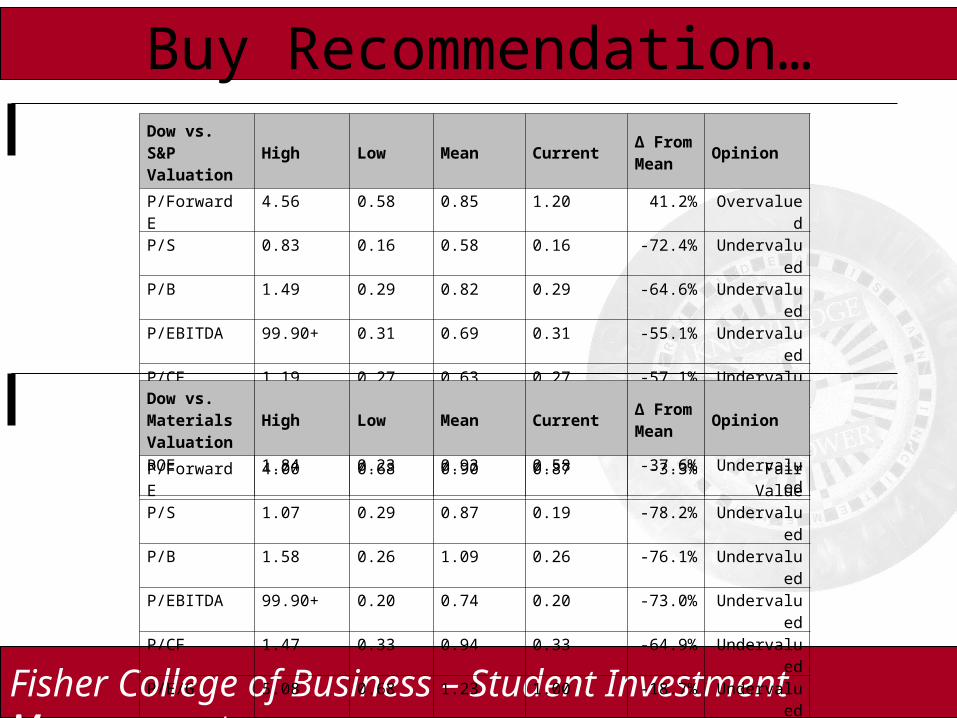
Buy Recommendation…Dow vs. S&P Valuation
High Low Mean Current∆ From Mean
Opinion
P/Forward E 4.56 0.58 0.85 1.20 41.2% Overvalued
P/S 0.83 0.16 0.58 0.16 -72.4% Undervalued
P/B 1.49 0.29 0.82 0.29 -64.6% Undervalued
P/EBITDA 99.90+ 0.31 0.69 0.31 -55.1% Undervalued
P/CF 1.19 0.27 0.63 0.27 -57.1% Undervalued
P/E/G 6.88 0.59 1.42 1.34 -5.6% Fair Value
ROE 1.84 0.23 0.93 0.58 -37.6% Undervalued
Dow vs. Materials Valuation
High Low Mean Current∆ From Mean
Opinion
P/Forward E 4.00 0.68 0.90 0.87 -3.3% Fair Value
P/S 1.07 0.29 0.87 0.19 -78.2% Undervalued
P/B 1.58 0.26 1.09 0.26 -76.1% Undervalued
P/EBITDA 99.90+ 0.20 0.74 0.20 -73.0% Undervalued
P/CF 1.47 0.33 0.94 0.33 -64.9% Undervalued
P/E/G 5.08 0.68 1.23 1.00 -18.7% Undervalued
ROE 1.72 0.34 1.09 0.54 -50.5% Undervalued

Fisher College of Business – Student Investment Management
Infrastructure spending plays to strengths
Consumer spending is key
Product and geographic diversification
Decline in oil prices
Buy Recommendation…An Industry Bright Spot US - 2009 Economic Outlook
Economic Stimulus
-4.80%
1.80%
-1.30%
2.60%
-6.00%
-5.00%
-4.00%
-3.00%
-2.00%
-1.00%
0.00%
1.00%
2.00%
3.00%
Q1 Q2 Q3 Q4
$787
$586
$167
$0$100$200$300$400$500$600$700$800$900
US China Eurozone

Fisher College of Business – Student Investment Management
Buy Recommendation…
DOW Acquisition of Rohm & Haas ~$15 billion
Deeper Reach in DevelopingMarkets – Asia / Pacific
2007 – 2012E CAGR
Financing Mix
$3 billion preferred equity investmentfrom ROH Investors
Draw $10 billion from bank loan
Receive $4 billion from Berkshireand KIA
Divest $4 billion in ROH assets
Strategic Rationale
Grow performance and specialtychemicals
Strengthens competitiveness of basic chemicals
$1.3 billion in synergies
30% of synergies come frompurchasing of raw materials
$2.6 billion in additional value creation
$1.7 billion combined in R&D
Delivers more stable earnings withhigher growth
Dilution / Accretion-10% -5% 0% 5% 5%
EPS $ 0.52 $ 0.58 $ 0.61 $ 0.64 $ 0.67
Stock Price $ 8.61 $ 9.56 $ 10.07 $ 10.57 $ 11.10 16.5x
EPS Dilution / Accretion

Fisher College of Business – Student Investment Management
Buy Recommendation…Absolute Valuation (50% mean reversion)
Entity Name P / E2009E P/ E
DOW 11.52x 14.80xDuPont 7.66x 7.24xRohn & Haas 26.01x 21.48xSherwin Williams 10.76x 10.38xAir Products & Chem. 14.07x 9.83x
` 14.00x 12.75x
Dow ChemicalAbsolute Valuation
High Low Mean Current #Your Target Multiple
*Your Target E, S, B, etc/Share
Your Target Price (F x G)
A. B. C. D. E. F. G. H.P/Forward E 99.9+ 8.8 17.7 14.8 8.85 0.61 $5.40
P/S 1.62 0.12 0.99 0.12 0.495 54.6 $27.03P/B 4.8 0.5 2.9 0.5 1.45 14.12 $20.47
P/EBITDA 99.9+ 1.6 5.2 1.6 2.6 4.41 $11.47P/CF 15.4 1.8 9.3 1.8 4.65 3.92 $18.23
P/E/G 8.6 0.7 1.9 1.6 0.95 4.4 $4.18ROE 31.1 3.2 16.7 8.0 8.35 0.88 $7.35
Average $13.45
Average
Comparables Analysis Multiples Price Target – Blended Abs. & Comp
2009E EPS Multiple Price$0.61 16.5x $10.07

Fisher College of Business – Student Investment Management
Buy Recommendation…Discounted Cash Flow Analysis
DCF Value Per ShareTerminal Discount
FCF Growth 8% 9% 10% 11% 12%1% $14.56 $12.80 $11.44 $10.34 $9.452% $15.85 $13.69 $12.07 $10.81 $9.803% $17.65 $14.87 $12.89 $11.40 $10.234% $20.34 $16.53 $13.98 $12.15 $10.775% $24.84 $19.01 $15.50 $13.15 $11.47
DCF Sensitivity Analysis
Terminal Value 14,767 NPV of free cash flows 6,299 NPV of terminal value 5,693 Projected Equity Value 11,992 Free Cash Flow Yield -14.76%
Shares Outstanding 930.4
Current Price 7.11$
Implied equity value/share 12.89$
Upside/(Downside) to DCF 81.28%

Fisher College of Business – Student Investment Management
Buy Recommendation…
Price Target Summary
US$ 12.00: Blended price target based on
DCF
Comparable & Absolute Multiple Valuation

Fisher College of Business – Student Investment Management
New SIM Holdings
SELL POSCO AND BUY DOW
Conclusion:
Continue to hold underweight
Why not increase underweight? – Don’t want to miss an early economic rebound
Why not reduce underweight? – Basic materials as a whole still out of favor
SELL all of Posco holdings
BUY 125 bps of DOW Chemical
Fisher College of Business – Student Investment Management
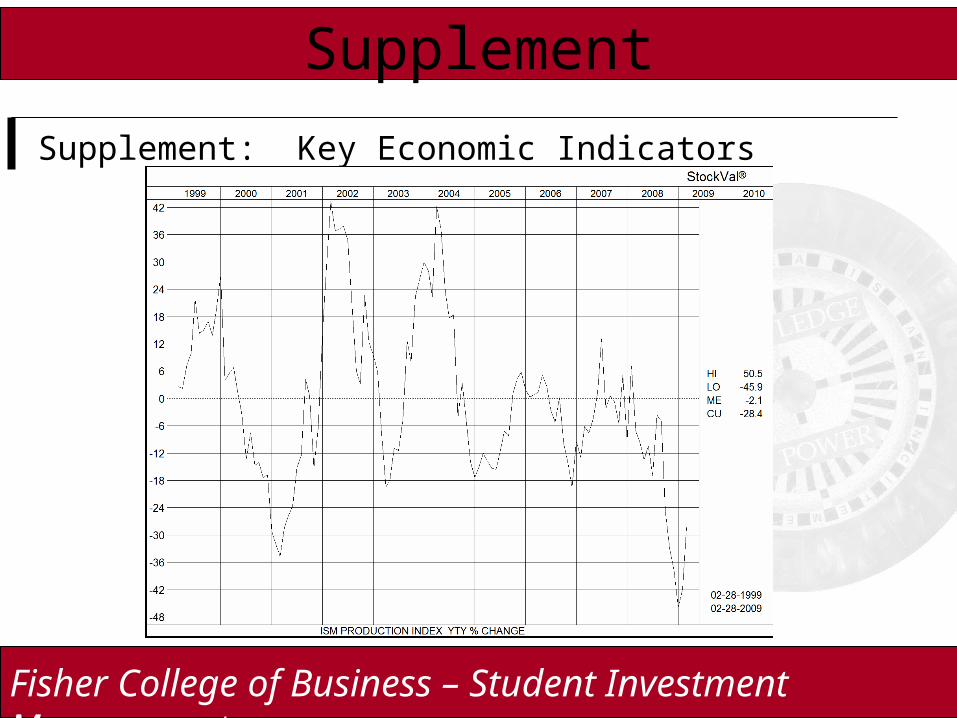
Supplement
Supplement: Key Economic Indicators

Fisher College of Business – Student Investment Management
Supplement
Supplement: Key Economic Indicators

Fisher College of Business – Student Investment Management
Possible Dilution from Merger
Supplement
Company project possible dilution of 5%
Dilution / Accretion
-10% -5% 0% 5% 5%
EPS $ 0.52 $ 0.58 $ 0.61 $ 0.64 $ 0.67
Stock Price $ 8.61 $ 9.56 $ 10.07 $ 10.57 $ 11.10
16.5x