Embed Size (px)
Citation preview

MMAATTEERRIIAALLSS AANNDD MMEETTHHOODDSS
III. MATERIALS AND METHODS
3.1 Glassware and plasticware
Scrupulously cleaned, grease free glassware of Corning / Borosil / Scott Durham
brand were used. Molecular / Analar / GR / Excellar grade of chemicals were used to
prepare buffers and all other reagents in triple glass distilled water.
Plasticware including centrifuge tubes, microcentrifuge tubes, cryo vials, tissue
culture Petri plates, real time PCR plates, real time PCR plate sealing film, FACS tubes,
adjustable volumetric micropippets, microtips were procured from Nunc Denmark, BD
Biosciences USA, Eppendorf Germany and Axygen India.
3.2 Marek's Disease virus (MDV)
The Marek's disease virus (MDV-1) with 4x10³TCID50/ml (code MDCVD1C1)
used for challenge studies was procured from Indovax private limited, Gurgaon, India.
3.3 SPF eggs and chicks
One hundred numbers of Specific Pathogen Free (SPF) embryonated chicken eggs
were procured from Indovax Pvt. Ltd. Gurgaon for CEF culture, safety test studies and
confirmation of virulence of MDV-1 virus. The virulence of the virus was confirmed by
inoculating 500 PFU [assuming 1TCID50 = 0.69 PFU (Luria et al., 1978)] intra
abdominally into ten SPF chicks. Virus was tested for the presence of Meq gene, a
principal oncogene (Lupiani, 2004) by processing the feather tips of above chicks by
PCR, using specific primers as per the method described by Raja et al. (2009).
42
3.4 Vaccines
a) Commercial Marek’s Disease Freeze dried HVT Vaccine, living BP (vet). 50
ampoules, stored at 4°C until use.
Upon reconstitution with the diluent supplied along with the vaccine
containing HVT FC 126 live virus vaccine strain, each dose of 0.2ml would give
1,000 PFU.
b) HVT+SB-1 cell associated vaccine - 50 ampoules. The vaccine was stored in a
liquid nitrogen container until use.
c) Other vaccines: Live attenuated Newcastle Disease (ND) vaccine, La Sota strain,
vial containing 500 doses, provided with 15 ml of diluent, procured from the
Institute of Animal Health and Veterinary Biologicals, Bangalore. Each dose
contained freeze dried vaccine virus more than 106 EID50 virus suspended in a
suitable stabilizer.
3.5 Chicks and feed
Two hundred fifty numbers of day old chicks (BV 300) were procured from the
hatchery facility of M/s Venkateshwara Hatcheries Pvt. Ltd. Hosur, Tamil Nadu. All the
chicks were reared in a contained environment in the animal experimentation facility of
Veterinary College, Bangalore. Necessary permission was obtained from the Institutional
Ethics Committee of Veterinary College, Bangalore. Required feed for the birds was
procured from Poultry feed plant, Department of Poultry Science, Veterinary College
43
Bangalore. Chicks were reared under standard managemental conditions by providing
adlibitum clean water and feed.
3.6 Titration of Cell Associated Marek’s Disease HVT+SB-1 vaccine virus
The titration was carried out as per the protocol, Supplemental assay methods 406
(2005) of Center for Veterinary Biologicals of USDA.
3.6.1 Materials
3.6.1.1Equipment/instrumentation
i) Centrifuge (MPW 350R, Poland)
ii) Humidified, rotating egg incubator (Cirugia deluxe Pvt. Ltd. Mumbai)
iii) Water-jacketed incubator with a humidified 5 ± 1% CO2 atmosphere and
temperature set at 37°± 1°C (Stericult, Thermo Scientific, USA)
iv) Magnetic stir plate
v) 250-ml trypsinizing flask with a sterile magnetic stir bar
vi) Electronic water bath
vii) Erlenmeyer flask with a sterile magnetic stirring bar
viii) Neubauer hemocytometer
ix) Sterile scissors, curved tip forceps etc.
3.6.1.2 Other supplies
i) Tissue culture Petri dish, 150 mm (Borosil)
ii) Plastic funnel covered with 4 layers of fine gauze

44
iii) Collagen treated 60-mm gridded cell culture dish (Nunc Denmark)
iv) Specific pathogen-free (SPF) chick embryos, 9 to 11days old
vi) Fetal Bovine Serum (FBS) (Hi-media)
3.6.1.3 Media and Reagents
i. Calcium magnesium free Phosphate buffered saline (0.1M pH 7.4)
(CMF-PBS)
Sodium chloride : 8.00 g
Disodium hydrogen phosphate 2H2O : 1.44 g
Potassium chloride : 0.20 g
Potassium dihydrogen phosphate : 0.20 g
The above salts were dissolved in triple glass distilled water; the volume was
made up to 1000 ml and sterilized by autoclaving at 121o C for 20 min at 15lb pressure
ii. Sodium bicarbonate solution (4.4%)
Sodium bicarbonate : 4.4 g
Triple glass distilled water : 100.0 ml
The solution was sterilized by autoclaving at 121°C for 20 min at 15lb pressure and
stored in one ml aliquots at 4°C
iii. Tryptose phosphate broth
Tryptose phosphate powder : 2.98 g
Triple glass distilled water : 100.0 ml
45
The broth was distributed in 10 ml of aliquots in screw cap tubes and sterilized by
autoclaving at 121°C for 20 min at 15lb pressure and stored at 4°C.
iv. Vitamin supplements
Choline chloride : 0.5 g
Folic acid : 0.5 g
Nicotinamide : 0.5 g
Pantothenic acid : 0.5 g
Pyridoxyl Hydrochloride : 0.5 g
Thiamine : 0.5 g
Riboflavin : 0.5 g
Triple glass distilled water : 100 ml
The solution was sterilized by filtration using a membrane filter of APD 0.22 µ
(Millipore, India) and stored in eight ml aliquots at 4° C.
v. Growth medium (10X stock solution).
Dulbecco's modified minimum essential medium (MEM) procured from M/s Hi-
Media Laboratories, Mumbai and the stock solution was prepared as follows.
Dehydrated medium (1 Unit) : 0.92 g
Amino acid concentrate : 0.032 g
Vitamin supplements : 8.00 ml
Triple glass distilled water up to : 100 ml

46
The ingredients were mixed and stirred on a magnetic stirrer for 30 minutes. The
solution was sterilized by filtration using a membrane filter of APD 0.22 µ (Millipore
India) and stored in 10 ml aliquots at 4°C.
vi. Growth medium (working strength)
Dulbecco's modified MEM (10X) : 10.0 ml
Tryptose phosphate broth : 10.0 ml
Foetal bovine serum : 6.0 ml
Sterile triple glass distilled water : 73.0 ml
Streptomycin / Penicillin stock solution : 1.0 ml
(Streptomycin 10 mg and Benzyl Penicillin 10,000 IU /ml)
Fungizone (2.5 mg/ml) : 0.1ml
pH was adjusted to 7.4 with 4.4 per cent sodium bicarbonate solution.
vii. Maintenance medium
Dulbecco's modified MEM (10X) : 10.0 ml
Tryptose phosphate broth : 10.0 ml
Foetal bovine serum : 2.0 ml
Sterile triple glass distilled water : 77.0 ml
Streptomycin and Penicillin stock solution : 1.0 ml
(Streptomycin 10 mg and Benzyl Penicillin 10,000 IU /ml)
Fungizone (2.5 mg/ml) : 0.1 ml
The ingredients were mixed under sterile conditions just before the use and the
pH was adjusted to 7.4 with 4.4 per cent sodium bicarbonate solution.

47
3.7 Cell culture
3.7.1 Preparation of primary Chick Embryo Fibroblast (CEF)
Primary CEF cultures are prepared from specific-pathogen-free (SPF) chick
embryos of 9 to 11 days old as per the protocol of supplemental assay methods (2005),
Centre for Veterinary Biologicals, USDA.
Air cell ends of the required numbers of embryonated eggs were disinfected with
70 per cent ethanol and the shells were broke opened with sterile forceps. The
membranes were opened with forceps and each of the embryos was lifted out and placed
in a sterile disposable 150 x 10 mm Petri dish. Heads and viscera of the embryos were
removed with sterile forceps and discarded. The embryo was washed several times with
PBS to remove excess blood. The washed embryos were placed in a sterile dry 100 x 10
mm Petri dish and were minced thoroughly using sharp sterile scissors.
The minced tissue was put into a trypsinizing flask containing a magnetic stir bar
and 50 ml growth medium without FBS. The flask was placed on a magnetic stir plate
and was stirred with a moderate vortex for five min until the tissue was completely
homogenized; care must be taken to avoid any froth formation. The cells were allowed
to settle and the supernatant was decanted.
Before proceeding for trypsinization any residual media was rinsed out from the
cells by adding 10 ml of the 0.25 per cent trypsin solution and then the trypsin solution
was completely decanted. Actual trypsinization was carried out by adding 40 ml of 0.25
per cent trypsin and mixing thoroughly. The whole suspension was transferred onto a
48
sterile gauze wrapped glass funnel placed into the opening of a 250 ml conical flask. Two
ml of FBS was added to stop the trypsin activity. The total volume was brought to
approximately 100 ml with growth media, centrifuged for 10 minutes at 250 x g at 10°C.
Supernatant was discarded and the cells were resuspended in 100 ml growth
media. The cells were washed once again by centrifugation and finally re-suspended in
fresh growth medium. A cell suspension of 0.5ml was diluted with an equal amount of
trypan blue solution and the cells were counted in haemocytometer.
Concentration of the cells was adjusted to one million cells / ml of growth
medium and dispensed into tissue culture flasks and incubated for three days at 37 C
in an incubator with five per cent CO2 and 75 per cent humidity to obtain confluent
monolayer.
3.7.2 Secondary CEF preparation
Secondary CEF culture was prepared by removing the medium from the primary
culture flask and adding 5 ml of 0.25 per cent trypsin solution to each flask. The trypsin
solution remained in contact with the cell sheet for 90 sec, before it was removed.
Primary culture flask was placed in a horizontal position with the cell sheet down and
incubated at 37 C for an additional 10 min.
To each of the flasks, 15 ml fresh growth medium was added and shook to loosen
and break up the cell clumps. A cell suspension was poured into an Erlenmeyer flask with
a stirring bar. After a thorough mixing, cell count was made with a hemocytometer. The
volume was adjusted to obtain a cell concentration of approximately 3, 75,000 cells per ml.
49
Four ml of secondary cell suspension was placed into 60-mm plastic tissue
culture dishes and incubated in a humidified incubator at 37°C, with five per cent CO2 for
24 hr prior to inoculation.
3.8 Determination of optimum thawing temperature of vaccine
3.8.1 Reconstitution of vaccine
One ampoule of HVT+SB-1 vaccine was taken out from the liquid nitrogen
storage container and thawed at 45 and 60 seconds by immersing in a electronic water
bath containing distilled water at different temperatures ranging from 20°C to 45°C
and different holding intervals given in Table 1. Immediately the vaccine was diluted
with the diluent, supplied by manufacturer, warmed to RT. It was done gently by
aspirating the vaccine into a 10-ml syringe through an 18-gauge needle and then five ml
of the diluent was collected into the same syringe and mixed gently. The contents of the
syringe were offloaded into the diluent bottle. Two ml from the diluted vaccine was
aspirated and used to rinse the ampoule once, then added back to the diluted vaccine.
Diluted vaccine was mixed gently by slowly inverting the bottle. This mixture constituted
“field strength” of the vaccine equivalent to one dose per 0.2 ml.
3.8.2 Holding period
The diluted vaccine was tested for virus titer at different holding temperatures
(Table 1) and at intervals of 30, 90 and 120 min on ice cubes. The vaccine was gently
mixed at 30 min before proceeding to virus titration. Shortly before the end of the
holding period, a two ml of diluted virus was mixed with 8.0 ml of growth medium to
give an initial dilution of 1:5; further dilutions were carried out to get 1:25, 1:250 and
1:500.

50
Table 1. Determination of optimum thawing temperature: different temperatures,
duration of thawing and holding period employed
Sl. No. Thawing temperature Duration of thawing Holding period
1 20°C 60 sec 30, 90 & 120 min on ice
2 26°C 45 sec 30, 90 & 120 min on ice
3 35°C 45 sec 30, 90 & 120 min on ice
4 35°C 45 sec 30, 90 & 120 min at RT
5 40°C 45 sec 30, 90 & 120 min on ice
6 45°C 45 sec 30, 90 & 120 min on ice
51
3.8.3 Plaque assay
After a gentle but thorough mixing one ml of each of the final dilutions were
seeded into 60 mm Petri dishes containing CEF culture as per 3.7.2. Five replicates were
maintained for each dilution. A thorough and gentle mixing was done by taking
adequate care to avoid any damage to the cells. The entire process of dilution and
seeding was completed within two min to prevent cells from attaching to the surface of
the dilution tubes. Further, the seeded plates were swirled gently to ensure uniform
distribution of virus. The plates were incubated in a 75 per cent humidity atmosphere at
37ºC containing five per cent CO2.
Twenty-four hours post-inoculation, the medium from the plates was removed
and replaced with 5 ml maintenance medium. The same was replaced on day three. Petri
plates with cells alone without seeding the vaccine virus were served as controls to
monitor the integrity of monolayer.
The plaques were counted on day five post inoculation using an inverted
microscope. The cell controls were used to confirm the validity of the assay. The test is
considered to be valid only if the monolayer in the control plates remained healthy.
Following formula was used to determine the titer (PFU/ml) of the vaccine per
dose of 0.2 ml
No. of plaques x V d x 5
= PFU/dose d=dilution factor
V = volume of diluted virus added to the plate

52
3.9 Experimental design to asses potency and to evaluate the immune response.
To assess potency and to evaluate the immune response of bivalent HVT+SB-1
MD vaccine against Monovalent HVT vaccine, 210 numbers of one day old unvaccinated
layer chicks were randomly divided into three groups as shown in Table 2.
The indicators chosen to assess potency and to evaluate the immune response are;
i) T helper and T cytotoxic cells count by flow cytometry, ii) quantification of challenge
virulent MDV load against the vaccine virus load in feather pulp by Real time PCR and
iii) analyzing the histopathological changes in selected visceral organs of vaccinates
(HVT alone and bivalent HVT+SB-1) against unvaccinated control chicken.
Vaccines were administered subcutaneously at hatch at a dose of 1,000
PFU/0.2ml to Groups 1 and 2. The Group 3 was sham vaccinated to serve as controls. On
day 9 pv, chicks in all the groups were challenged with MDV-1, an oncogenic virus, by
Subcutaneous route, at a dose of 500 PFU/0.18ml. Blood samples were collected
randomly from six birds in each group on days 8th dpv and 7th, 14th, 28th, 43rd and 61st
dpc, for estimation of T helper and T cytotoxic cell population by flow cytometry. Six
birds from each group were sacrificed on 7th, 14th, 28th, 43rd and 61st dpc. Spleen, liver,
bursa, kidney, proventriculus, thymus, heart and sciatic nerves were collected to study
histopathological changes. Whole feather tips collected from these birds just before the
sacrifice served as source of DNA to estimate MDV-1, the challenge virus load, as a
means to evaluate the efficacy of vaccine.
53
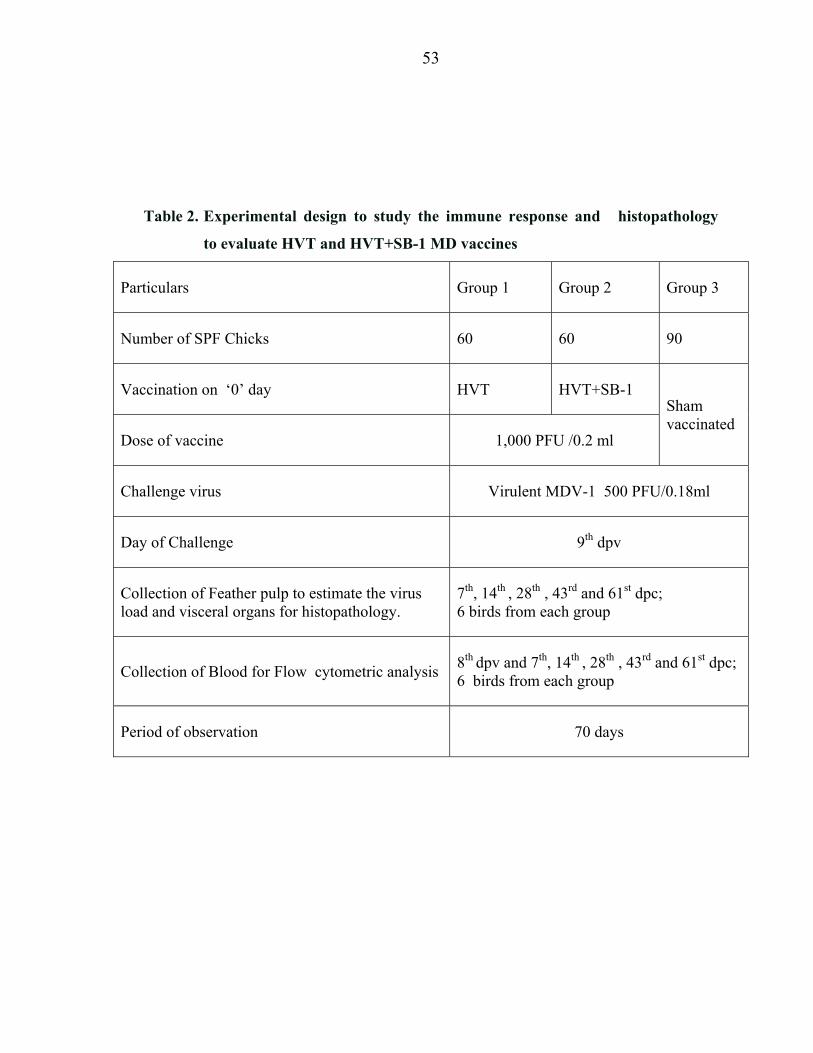
Table 2. Experimental design to study the immune response and histopathology
to evaluate HVT and HVT+SB-1 MD vaccines
Particulars Group 1 Group 2 Group 3
Number of SPF Chicks 60 60 90
Vaccination on ‘0’ day HVT HVT+SB-1 Sham vaccinated
Dose of vaccine 1,000 PFU /0.2 ml
Challenge virus Virulent MDV-1 500 PFU/0.18ml
Day of Challenge 9th dpv
Collection of Feather pulp to estimate the virus load and visceral organs for histopathology.
7th, 14th , 28th , 43rd and 61st dpc; 6 birds from each group
Collection of Blood for Flow cytometric analysis 8th dpv and 7th, 14th , 28th , 43rd and 61st dpc; 6 birds from each group
Period of observation 70 days

54
Vaccinated chicks in Groups 1 and 2 and controls in Groups 3 were raised
separately throughout the experiment. All the chicks were vaccinated on day one except
group 3 as shown in Table 2.
3.10 Determination of safety and potency of HVT+SB-1 cell associated vaccine and
HVT cell free vaccine
Safety and potency were determined as per the methods prescribed in the OIE
Terrestrial Manual 2010 adopted by the World Assembly of Delegates of the OIE in
May 2010.
3.10.1 Safety test
Twenty five, one day old SPF chicks received 10,000 PFU of HVT+SB-1 and
HVT vaccine. The chicks were observed for 21 days. The test is not valid if more than
five birds showed abnormal clinical signs or died from causes not attributable to the
vaccine. The vaccine complied with the test if no chicken showed notable clinical signs
of disease or died from causes attributable to the vaccine.
3.10.2 Potency test
3.10.2.1 Materials
a) 30, one day old chicks in group 1 and group 2 were identified and marked separately
for potency testing.
b) Vaccines: HVT+SB-1cell associated bivalent and HVT cell free freeze dried vaccine.
55
3.10.2.2 Method
Thirty, one day old chicks received 1,000 PFU of dose of the HVT vaccine and
HVT+SB-1 vaccine; 30 chicks were used as unvaccinated challenged controls with each
vaccine. On day nine after immunization, each chick was challenged by intra abdominal
route with 500 PFU of virulent MDV. Each of the birds was observed daily for the
development of clinical signs and death up to 70 dpv. Number of birds dying post
vaccination was recorded and per cent mortality and protective index (PI) was calculated
as per the formula given by I.P.VET (2000). At the termination of experimental period all
the survivors were sacrificed, gross lesions, if any, were scored and organs were collected
for histopathological examination. The PI was calculated.
% MD in unvaccinated and challenged - % MD in vaccinated and birds challenged birds
PI = % MD in unvaccinated challenged birds
3.11 Estimation of CD4 and CD8 cell counts by Flow cytometry
Estimation of CD4 and CD8 cells were carried out at the Center for Cellular and
Molecular Patterns, National Centre for Biological Sciences, Bangalore. The protocol
supplied along with the Monoclonal antibodies by the Manufacturer, AbD Serotech
USA, was followed.
56
3.11.1 Materials
3.11.1.1 Phosphate buffered saline with bovine serum albumin (PBS-azide-BSA)
Phosphate buffered saline : 1000 ml
Sodium azide : 5.0 g
BSA (sigma) : 10.0 g
The solution was freshly prepared and sterilized by filtration.
3.11.1.2 Wash buffer (PBS-Azide)
Sodium chloride : 8.00 g
Disodium hydrogen phosphate : 1.21 g
Potassium chloride : 0.20 g
Potassium dihydrogen phosphate : 0.20 g
Distilled water (DW) : 1000 ml
Sodium azide : 0.5 g
The solution was sterilized by autoclaving at 121oC for 15 min at 15 lb pressure
and stored at 4oC in aliquots of 100 ml.
3.11.1.3 Cell fixing buffer (Para Formaldehyde in PBS-Azide)
Phosphate buffered saline : 1000 ml
Sodium azide : 0.5 g
Para Formaldehyde (Sigma) : 20.0 g
3.11.1.4 FACS Tubes
Round bottom polypropylene tubes (5 ml) with caps were used (M/s Becton
Dickinson, UK).

57
3.11.1.5 Antibodies
Monoclonal anti chicken CD4 mouse antibody tagged with FITC and anti chicken
CD8a mouse antibody tagged with PE were procured from M/s AbD Serotech, USA.
3.11.2 Optimization of anti chicken CD4 and CD8 antibodies
An end point titration was carried out to determine the optimum concentration of
anti chicken CD4 and CD8 monoclonal antibodies to be used to bind lymphocytes. It
was performed by using the different concentrations 2.5, 5.0, 7.5 and 10µl of the anti
chicken CD4 and CD8 monoclonal antibodies (1µg/µl) to bind to the lymphocytes.
3.11.3 Protocol for measurement of CD4 and CD8 T cells by Flow cytometry
3.11.3.1 Isolation of lymphocytes from EDTA treated blood from chicken
3.11.3.1.1 Materials
i) HiSep ™ LSM 1084 medium used for the isolation of mononuclear cells from EDTA
treated, defibrinated chicken blood was procured from M/s Hi media Mumbai.
ii) Two ml tubes treated with EDTA
iii) Sterile glass Pasteur pipettes
iv) Centrifuge (MPW 350R, Poland)
v) Five ml FACS tubes
vi) Ice cooler
vii) Trypan blue stain, 0.4%

58
3.11.3.1.2 Method
1. 3.0 ml of HiSep LSM 1084 was aseptically transferred to clean centrifuge tubes of 15
ml capacity
2. 3.0 ml whole blood was carefully overlaid on HiSep LSM 1084
3. Erythrocytes and granulocytes were sedimented out by centrifuging the tubes at 400
x g for 30 min at RT. Lymphocytes formed a band above HiSep LSM 1084.
4. Supernatant containing plasma and platelet above the interface band was aspirated
and discarded.
5. Lymphocyte cell band was collected using a clean glass Pasteur pipette.
6. Lymphocyte fraction was added to 10 ml PBS in 15 ml centrifuge tube and
centrifuged for 10 minutes at 250 x g and the supernatant was discarded.
8. The cell pellet was re-suspended with one ml PBS in 5ml FACS tube and mixed
gently by inverting several times.
9. The contents were centrifuged at 250 x g for 10 min and the supernatant was
discarded.
10. Steps 8 and 9 were repeated again to remove any traces of HiSep LSM 1084 from the
lymphocytes.
11. Cells after the final wash were dissolved with one per cent BSA and 0.9 per cent
Sodium azide in 100µl of PBS.
12. Cells were counted in Neubauer slide and optimized to one million cells/ml
13. Anti chicken mouse monoclonal antibodies, 7.5 µl of CD4 and 2.5 µl of CD8 were
added and incubated on ice for 30 min in dark room with intermittent mixing.
14. One ml of PBS was added to each tube and washed at 250x g for 5 min.
59
15. Supernatant was completely decanted and one per cent BSA and 0.9 per cent Sodium
azide in 500 µl of PBS was added to the pellet. FACS tubes were gently tapped to
dissolve the pellet.
16. Finally, the contents were subjected to FACS analysis for cell differentiation and
data acquisition.
3.12 DNA extraction from feather tips
3.12.1 Materials
i) Proteinase K (MBI Fermentas)
ii) Proteinase K buffer
EDTA : 0.930g
SDS : 2.500g
Tris HCl : 0.605g
Deionized water : 50ml
iii) Sodium acetate (5M)
Sodium acetate : 8.2g
Deionized water : 20ml
iv) Proteinase K mixture
Proteinase K : 4mg
Proteinase K buffer : 10ml

60
v) Phenol: Chloroform: Isoamyl alcohol
Phenol : 25ml
Chloroform : 24ml
Isoamyl alcohol : 1ml
vi) Isopropanol
vii) Ethanol (70%)
3.12.2 Method
Extraction of DNA from feather follicles was carried out as per the procedure
described by Handberg et al. (2001). Briefly, the procedure includes;
a) Proximal shaft (about one cm) of five feather tips of different sizes collected from
each chicken were shaken over night at 55ºC with 200 µl of proteinase K mixture
(400µg of proteinase K / ml of proteinase K buffer).
b) To this, 20µl of 5 M sodium acetate and 200µl of Phenol: chloroform: Isoamyl
alcohol was added and centrifuged at 13,000g for 15 min at 4°C.
c) The aqueous phase was transferred to 200µl isopropanol and was centrifuged again at
13,000g for 15 min at 4°C.
d) Supernatant was removed and the DNA pellet was washed twice with cold (-20oC),
70 per cent ethanol for 10 min by vortexing and subsequent centrifugation at 13,000g
for 15 min at 4°C.
e) After decanting the ethanol, the traces were removed by air drying the DNA pellet
under laminar flow hood for 15 to 30 min.

61
f) DNA pellet was dissolved in 100 µl of sterile nuclease free water and left at RT for at
least 30 min before storing at -20ºC till further use.
3.12.3 Assessment of Quality and Quantity of DNA
The quantity of DNA was calculated by spectrophotometric method. The optical
density (OD) at 260 and 280 nm was taken in UV spectrophotometer with distilled water
as reference. Purity of DNA was estimated on the basis of OD ratio at 260:280 nm. The
samples with acceptable purity (i.e., ratio between 1.6-1.8) were quantified using the
following formula and used for PCR. Concentration of DNA (µg/ml) = OD at 260 x
dilution factor x 50 Where, 50 is concentration of dsDNA expressed in µg/ml at OD of
one.
The quality of DNA was further checked by submarine agarose gel
electrophoresis using 0.8 per cent agarose in 0.5X TBE (pH 8.0) buffer (Sambrook and
Russel, 2001). Ethidium bromide (1 %) was added @ 0.5µl /100ml. The wells were
charged with 5µl of DNA preparations mixed with IX Bromophenol Blue dye.
Electrophoresis was carried out at 5V/cm for 20 min at RT and then the DNA was
visualized under UV transilluminator.
3.13 Polymerase chain reaction
The conventional PCR was carried out to ensure the specificity of the primers in
amplifying the gene of interest. The PCR product was subjected for gel electrophoresis,
to check the size of the amplicon. The Real Time PCR was carried out to quantify MDV-
1 DNA in vaccinated-challenged and unvaccinated challenged control birds.

62
3.13.1 Materials
3.13.1.1 Clinical samples
Feathers were collected from the six birds in each group at different intervals as
mentioned in Table 2. A minimum of ten feathers from each bird were collected into a
sterile polythene zip lock bag on days 7, 14, 28, 43 and 61 post challenge. The feathers
were stored at -20°C until use.
3.13.1.2 Reference MD viruses
a) Cell free HVT vaccine virus commercially available from Ventri Biologicals Ltd.,
Pune, India.
b) Cell associated HVT+SB-1 vaccine virus commercially available from Ventri
Biologicals Ltd., Pune, India.
3.13.1.3 Equipments / reagents (End point PCR)
a) Palm cycler, CGI 960 (M/s. Corbett Research, Australia)
b) Micropipettes (Thermo scientific, Finland)
c) Thin walled PCR tubes of 200 µl capacity (Axygen)
d) Red Taq PCR Master Mix (Bangalore genie) containing
i) 0.05U/µl TaqDNA polymerase (recombinant) in reaction buffer,
ii) MgCl2 (4mM) and
iii) dNTPS (0.4 mM each).
e) Agarose gel (1.8%)
f) Tris - EDTA (TE) buffer
63
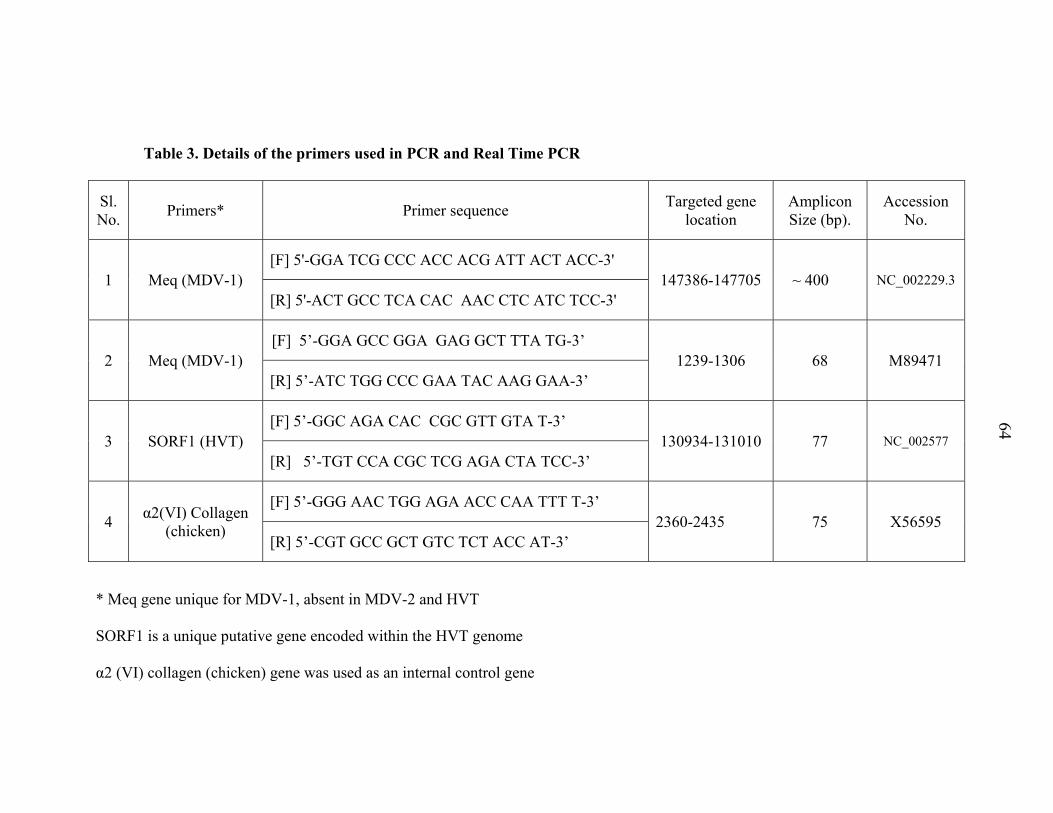
3.13.1.4 Primers
Three sets of primers for Meq (MDV-1), SORF1 (HVT) and α2 (VI) collagen
(chicken) genes as reported by Islam et al. (2004) was made use in real-time PCR. α2
(VI) collagen (chicken) gene was used as an internal standard to determine the relative
expression of Meq and SORF1 (HVT) genes. The specificity of the primers was checked
with the Basic Local Alignment Search Tool (http: //www.ncbi. nlm.nih.gov/BLAST). All
the three sets of HPLC purified primers (Table 3) were synthesized at Bioserve Pvt. Ltd.,
Hyderabad, supplied in lyophilized form. The primers were reconstituted prior to use in
TE buffer to get a concentration of 20 pmol/µl.
3.13.1.5 Template DNA
The DNA concentration was determined and samples were diluted upto the final
concentration of 100 ng/µl with sterile MiliQ water and stored at - 20°C. DNA used for
PCR was one µl per reaction.
3.13.2 Method (End point PCR)
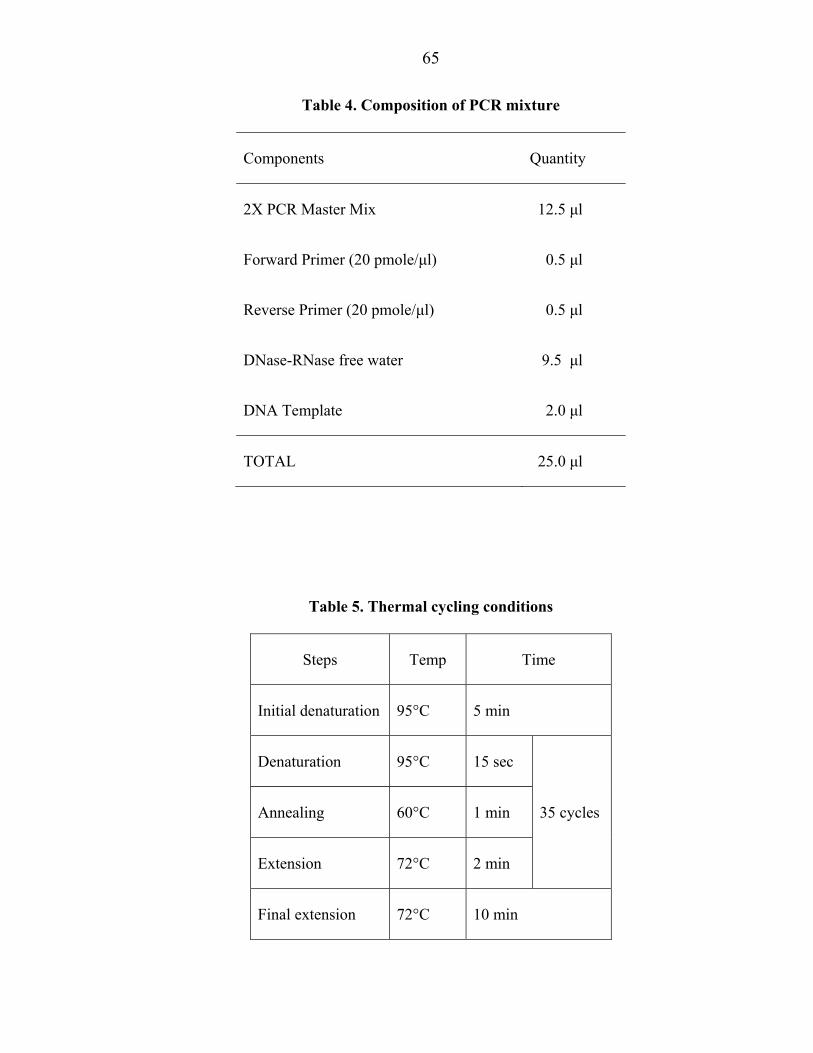
PCR was carried out in a final reaction volume of 25 µl using 200 µl capacity thin
walled PCR tubes. A reaction mixture was prepared as per the details given in Table 4.
PCR tubes containing the mixture were tapped gently and spun briefly. The PCR tubes
with all the components were transferred to thermal cycler (Palm cycler, CGI 960 (M/s.
Corbett Research, Australia). The PCR conditions used for all the three sets of primers is
shown in table 5. All PCR runs included three non-template DNA samples as negative
controls.
64
Table 3. Details of the primers used in PCR and Real Time PCR
Sl. No. Primers* Primer sequence Targeted gene
location Amplicon Size (bp).
Accession No.
1 Meq (MDV-1) [F] 5'-GGA TCG CCC ACC ACG ATT ACT ACC-3'
147386-147705 ~ 400 NC_002229.3 [R] 5'-ACT GCC TCA CAC AAC CTC ATC TCC-3'
2 Meq (MDV-1) [F] 5’-GGA GCC GGA GAG GCT TTA TG-3’
1239-1306 68 M89471 [R] 5’-ATC TGG CCC GAA TAC AAG GAA-3’
3 SORF1 (HVT) [F] 5’-GGC AGA CAC CGC GTT GTA T-3’
130934-131010 77 NC_002577 [R] 5’-TGT CCA CGC TCG AGA CTA TCC-3’
4 α2(VI) Collagen (chicken)
[F] 5’-GGG AAC TGG AGA ACC CAA TTT T-3’ 2360-2435 75 X56595
[R] 5’-CGT GCC GCT GTC TCT ACC AT-3’
* Meq gene unique for MDV-1, absent in MDV-2 and HVT
SORF1 is a unique putative gene encoded within the HVT genome
α2 (VI) collagen (chicken) gene was used as an internal control gene
65
Table 4. Composition of PCR mixture
Components Quantity
2X PCR Master Mix 12.5 µl
Forward Primer (20 pmole/µl) 0.5 µl
Reverse Primer (20 pmole/µl) 0.5 µl
DNase-RNase free water 9.5 µl
DNA Template 2.0 µl
TOTAL 25.0 µl
Table 5. Thermal cycling conditions
Steps Temp Time
Initial denaturation 95°C 5 min
Denaturation 95°C 15 sec
35 cycles Annealing 60°C 1 min
Extension 72°C 2 min
Final extension 72°C 10 min

66
3.13.3 Visualization of PCR product
To confirm the targeted PCR amplification, ten µl of the PCR product from each
tube was mixed with two µl of 6X gel loading buffer and electrophoresed along side 50bp
DNA molecular weight marker (Bangalore Genei) in 1.8 per cent agarose gel containing
ethidium bromide (0.5µg/ml) at constant 80V for 30 min in 0.5X TE buffer. The
amplified product was visualized under UV light and documented by gel documentation
system (Alpha Imager, Alpha Infotech, USA).
3.14 Real Time PCR
3.14.1 Equipments / reagents
a) Applied Biosystems 7300 real time thermal cycler
b) 96 well real time PCR plates (Axygen)
c) PCR film-self adhesive (Eppendorf Germany)
d) Micropipettes
e) 1.5 ml microcentrifuge tubes for preparing Master Mix
f) MaximaTM SYBR Green 2× Master Mix (Catlog # K0221 Fermentas Inc, USA)
containing
i) MaximaTM Hot start Taq DNA Polymerase
ii) MaximaTM SYBR Green qPCR Buffer
iii) SYBR Green I
iv) ROX passive reference dye
v) Primers –mentioned in Table 3
vi) Nuclease free water
vii) DNA extracted from feather tips
67
3.14.2 Real Time PCR protocol
3.14.2.1 Plate preparation
The reaction was prepared in a 96-well plate (96-Well Optical Reaction Plate,
Barcoded, serial No. 4306737, Applied Biosystems, USA), using SYBR green qPCR
Master Mix (Fermentas Inc. USA; Catlog No. K0221). The final volume per well was
25 µl.
3.14.2.2 Determination of primer efficiencies
For the comparative CT method of relative quantitation to be valid, the variation of
the efficiency of amplification between the target and that of the active reference (House
keeping gene) must not exceed five per cent (Real time PCR Handbook, University of
Illinois, 2003).
Primer efficiency was determined as per the protocol given by Fraga et al. (2008).
A tenfold dilution (1, 1:10, 1:100, 1:1000 and 1:10,000) of 100 ng of DNA from feather
tip sample that was detected as positive for Meq, SORF1 and α2 (VI) collagen (chicken)
gene was tested using real-time PCR to obtain a standard curve. Threshold Cycle (CT)
value was plotted as a function of the dilution to draw a linear regression line through
the plot. The slope of the regression line was calculated using Graph Pad Prism software
version 5.
1. Ten fold Serial dilution of a 100 ng of DNA (100 to 10-4) representing five data points
was prepared in triplicate.

68
2. A separate PCR Master Mix for each of Meq, SORF1 and α2 (VI) collagen gene was
prepared in 1.5 ml micro centrifuge tubes as mentioned in table 6. The Master Mix
(24 µl) was dispensed into each of the wells of the real time PCR plate in triplicates.
3. One µl of the serially diluted DNA template was added to each reaction well in PCR
plate.
4. PCR plates were placed in AB 7300 Thermal Cycler and PCR reaction was run to
determine CT values for each dilution.
5. CT values versus the logarithm of the concentration of DNA were plotted.
6. Slope of the line was used to determine the efficiency of the PCR using equation.
E = (10 –1/slope –1) × 100
7. Amplification efficiency values for each primer set were recorded.
3.14.2.3 Determination of relative primer efficiencies
The CT values obtained for each of the primers at different dilutions of template
DNA was used to calculate relative primer efficiencies. The CT values obtained were
compared by subtracting the CT values of primer set for target genes [Meq and SORF1
(HVT)] from primer set of house keeping gene (α2 (VI) Collagen) and the difference
was plotted against the logarithm of the template amount (a tenfold serial dilution). If the
slope of the resulting line is <0.1, the amplification efficiencies are comparable.
3.14.2.4 Real-time polymerase chain reaction
AB 7300 Real Time Thermal Cycler was used to carry out real-time PCR
amplification reactions as per the protocol given by Fraga et al. (2008).

69
Table 6. Various components used in SYBR Green based Real Time PCR
Sl. No. Components Quantity
1 Fermentas SYBR Green PCR Master Mix (2X) 12.5µl
2 Forward Primer (20 pmol/µl) 0.3 µl
3 Reverse Primer (20 pmol/µl) 0.3 µl
4 Template DNA 1.0 µl
5 Nuclease Free water 10.9 µl

70
i. SYBR Green 2× Master Mix, primers, template DNA, nuclease free water and 1.5 ml
microcentrifuge tubes were kept on ice.
ii. PCR mix was prepared in 1.5 ml microcentrifuge tubes separately for each primer as
shown in Table 6. Master Mix was mixed thoroughly and 24 µl of it was dispensed to
each wells of Real time PCR 96 well plate.
iii. Template DNA was added to each reaction well and the plate was sealed with
adhesive tape.
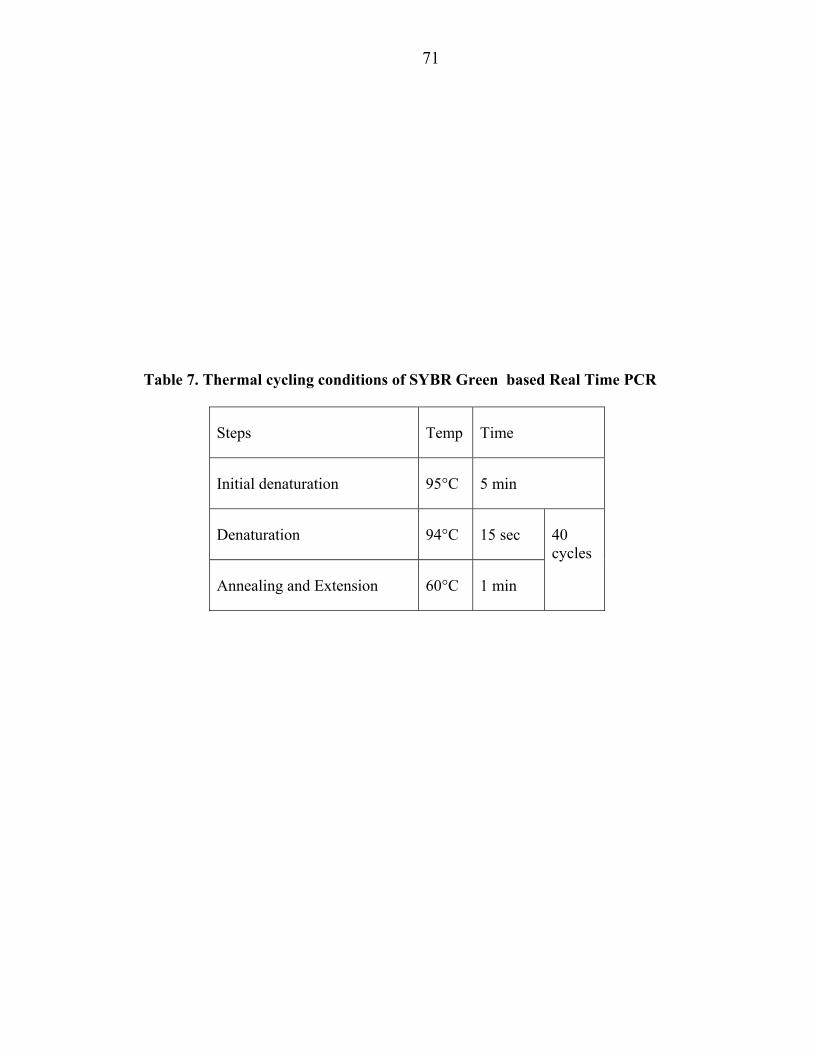
iv. AB 7300 Real Time Thermal Cycler was set up and programmed to the conditions
mentioned in Table 7.
v. Reaction plate was placed in the Thermal Cycler and PCR reaction was run to
determine CT values for each sample.
vi. Once the reaction cycles were completed, the dissociation curve analysis was
obtained and the results were analyzed using ∆∆CT method (Livak and Schmittgen,
2001).
3.14.2.5 Analysis of real-time data
Relative quantification of the Meq and SORF1 gene was carried out using the
comparative CT (∆∆CT) method. The raw CT values for the Meq (target) gene and the α2
(VI) collagen (chicken) (house keeping gene) gene for the three groups (Control,
HVT+SB-1 and HVT) and CT values of SORF1 gene for the HVT and HVT+SB-1 group
of birds were exported from the ABI 7300 SDS program into Excel (Microsoft Windows
XP). The relative fold change in the expression of a particular gene, as reflected in DNA
level, between two different groups (either HVT+SB-1 v/s controls or HVT v/s controls
71
Table 7. Thermal cycling conditions of SYBR Green based Real Time PCR
Steps Temp Time
Initial denaturation 95°C 5 min
Denaturation 94°C 15 sec 40 cycles
Annealing and Extension 60°C 1 min
72
or HVT+SB-1 v/s HVT ) was calculated for each interval (7th, 14th , 28th, 43rd and 61st
day pc) as per the steps mentioned below.
i. The target gene was normalized to the Housekeeping gene (endogenous control):
∆CT = CT target gene – CT endogenous control.
ii. The sample was normalized to the calibrator sample. In HVT+SB-1 v/s control and
HVT v/s control comparison, the control was taken as calibrator whereas HVT+SB-1
and HVT were considered as samples. In HVT v/s HVT+SB-1 comparison, the
calibrator was HVT and the sample was HVT+SB-1.
∆∆CT = ∆CT sample – ∆CT calibrator
iii. The amount of target, normalized to an endogenous reference and relative to a
calibrator, is given by:
Fold change = 2 –∆∆CT
3.15 Histopathology
3.15.1 Collection of tissue specimen
Tissues like liver, spleen, kidney, proventriculus, bursa, thymus and sciatic nerves
were collected into 10 per cent neutral buffer formalin, from randomly selected six birds
from each of the three groups; 1, 2 and 3 (Table 2) on 7th, 14th, 28th, 43rd and 61st dpv.
3.15.2 Histopathological examination
The formalin fixed tissues were processed by paraffin wax embedding method of
tissue sectioning. The sections were cut at 6-8 microns thickness with automatic section
cutting machine (SLEE-MAINZ, Germany) and were stained with haematoxyline and
eosin (H & E) stain (Luna, 1968). The H & E stained slides were read under microscope
and histopathological changes were recorded.


![Dnevni avaz [broj 6955 djelimičan, 19.12.2014]](https://img.dokumen.tips/doc/110x75/577cc1661a28aba71192e5dd/dnevni-avaz-broj-6955-djelimican-19122014.jpg)