Embed Size (px)
Citation preview

17-Jun-14 1 M.Karweit (modified)
Material Testing Lab
Focus:
This laboratory includes three separate materials testing experiments to be done on spaghetti of 3 different
diameters. See individual labs for respective objectives. Students will work in groups of three, and all
students are required to contribute to the completion of the lab report (additional handout will provide
specific details for write-up). Students are expected to put more thought into the objectives/hypotheses
and communication of results since few instructions are given.
Background:
Materials Science and Material Properties
Materials Science involves investigating the relationships that exist between the (internal) structures and
properties of materials. Engineers rely upon these relationships in their design of everything, since every
design requires the use of materials. Although the earliest humans had access to a limited number of
natural materials, stone, wood, clay, skins, etc., developments in materials science and materials
engineering has allowed for a parallel progression of technology. The most common material problem
today is that of selecting the right material for the project from the many thousands that are available.
A material’s properties are quantitative traits that tell us something about the nature of that material, and
a material’s performance will be a product of its properties. These properties may be constant or
dependent upon environmental conditions, and most important properties of materials may be grouped
into six different categories: mechanical, electrical, thermal, magnetic, optical, and deteriorative.
The mechanical properties of materials are most relevant to the design of structures. The mechanical
properties reflect the relationship between a material’s reaction (or deformation) to an applied load or
force. Examples of mechanical properties of materials are ultimate tensile/compressive strength,
toughness, hardness, ductility, modulus of elasticity, and stiffness.
There are three principal ways in which a load may be applied to a structural member: tension (pulling),
compression (pushing), and shear (frequently applied through torsion). In this Material Testing Lab,
students will perform three tests on spaghetti to determine the modulus of elasticity (Young’s Modulus,
E) of spaghetti, the tensile strength of spaghetti, and to prove the format of the Euler Buckling equation.
Although generally useful, students will not be performing shear tests of spaghetti as part of this lab.
Terminology
TERM DEFINITION
Ductility a measure of the degree of plastic deformation that has been sustained at failure. A
brittle material experiences little or no plastic deformation

17-Jun-14 2 M.Karweit (modified)
Elastic Deformation deformation in which stress and strain are proportional. This deformation is
nonpermanent, so the specimen returns to its original shape when the applied load
is released.
Hardness resistance to (different types of) permanent shape change when a force is applied.
Hookean Solid any material that displays linear-elastic elongation.
Plastic Deformation when a material is deformed beyond the area of elastic deformation and stress is no
longer proportional to strain, this permanent deformation occurs.
Proportional Limit the point in material testing before which elastic deformation occurs and beyond
which plastic deformation occurs.
Stiffness resistance to deformation.
Strength ability of a material to withstand an applied stress without failure.
Tensile Strength the maximum stress sustained by a material in tension. Prior to and including the
tensile strength, all deformation is uniform throughout the specimen tested.
However, if this stress is maintained or surpassed, necking begins to form and all
subsequent deformation is confined to this neck.
Toughness resistance to fracture in a material when stressed. Toughness indicates how
much energy a material can absorb before rupturing. Think of chipping away at ice
on a wind shield.
Yield Strength the stress corresponding to the intersection between the stress-strain curve and a
line parallel to the elastic portion of the stress-strain curve at a 0.002 strain offset.
A material’s yield strength should be constant regardless of its cross-sectional area.
Yielding plastic deformation.
Young’s Modulus also known as the modulus of elasticity, E is the constant of proportionality as
defined by Hooke’s Law. This modulus may be thought of as stiffness, or a
material’s resistance to elastic deformation (i.e., the greater the modulus, the stiffer
the material).
TERM FORMULA UNITS DEFINITION
Engr. Stress 𝜎 =𝐹
𝐴0 MPa the instantaneous force applied to a specimen over
original cross-sectional area
True Stress 𝜎 =𝐹
𝐴 MPa the instantaneous force applied to a specimen over the
instantaneous cross-sectional area
Strain 𝜖 =∆𝑙
𝑙0 none the elongation (or change in length) of a specimen divided
by the original length, sometimes referred to as percent
elongation
Hooke’s Law 𝜎 = 𝐸𝜖 MPa strain is directly proportional to stress for “Hookean”
materials (linear-elastic materials); this is equivalent to the
spring equation

17-Jun-14 3 M.Karweit (modified)
Experiment 1: Tensile Test
Objectives:
1. What are our questions?
2. How are we going to answer our questions?
Background:
Tensile tests are one of the most common mechanical property tests. A specimen with uniform cross
section (usually circular or rectangular) along its length (see Figure 1 below) is loaded into an apparatus
similar to that shown below in Figure 2. The specimen is usually deformed to the point of fracture with a
gradually increasing tensile load applied along the long axis of the specimen. All deformation of the
specimen is uniform throughout the narrow portion of the specimen, at least until the material’s Ultimate
Tensile Strength is reached. An example of the test’s resulting stress-strain curve is shown in Figure 3.
If you pull on both ends of a rod with an increasing amount of force (making sure to apply the force only
along the length of the rod), at some point the rod will stretch, like silly putty, or break. The force will
have exceeded the material’s yield strength. Depending on the material, the rod may simply snap in two.
It also might experience plastic deformation in the form of necking (a gradual reduction in cross-sectional
area) before it breaks. Under tensile loading, brittle materials tend to fracture without deformation, while
ductile materials typically experience plastic deformation and necking before breaking.
The force required to pull a rod apart depends on two things: the inherent strength of the material and the
cross-sectional area of the rod. A cotton string is easier to break than the same size steel wire. A larger
cross-section requires a larger force to pull it apart. This makes sense because a larger cross-sectional area
means that there are more atomic bonds to pull apart along a fracture line, which in turn necessitates a
larger force. With a circular cross-sectional area A = π R2, the force to break the rod is
mRkP , where the constant k depends on the material.
Procedure:
Wear safety glasses and closed-toed shoes throughout the lab. In addition, wear gloves while
handling the lead BBs and be sure to wash your hands after the lab!
Figure 1 Tension Specimens1
Figure 2 Tension Test Device2
Figure 3 Sample Stress-Strain Curve3

17-Jun-14 4 M.Karweit (modified)
You will measure the fracture strength of spaghetti by pulling on it using a
lever arm apparatus. You will use the spaghetti epoxied to two cotter pins the
previous day.
1. Start with the thinnest spaghetti. Use a micrometer to measure the
spaghetti diameter.
2. For the lever-arm apparatus, the lower end of the spaghetti will be attached
to a metal pin (use another cotter pin); the upper end will be attached to the
lever arm via a chain and “S-hook” (see figure). Adjust the chain so that the lever arm is as level as
possible.
3. Fill the bucket with BBs until the spaghetti breaks. Record the mass when the spaghetti breaks.
Record whether the spaghetti beaks along its length or at the glue joint.
4. Repeat for three samples of each spaghetti thickness. Measure the spaghetti thickness each time. You
will have 12 data points for the four thicknesses of spaghetti.
THINK ABOUT: What parameters do you need to record in your lab notebook?
Data Analysis: An Introduction into EXCEL spreadsheets
1. Enter your data into an Excel spreadsheet, along with the proper units. It will work best if you
organize your spreadsheet in the following manner:
2. Add a column C where you calculate the radius of the spaghetti in the units of meters.
a. First, label the column - in cell C1 type Radius (m)
b. Then calculate the radius for the first sample by typing this equation into cell C2
=A2/1000/2
This will take the diameter in mm and convert it into meters (A2/1000) and then it will
convert the diameter to a radius (1/2)
c. To copy this equation:
i. Click on the contents of Cell C2
ii. Hold down the Ctrl button and the C key at the same time (to copy)
iii. Click on C3 and drag the mouse to highlight the cells where you want to
copy the equation.
iv. Hold down the Ctrl button and the V key at the same time (to paste)
This will copy the equation into cells C3 and higher.
17-Jun-14 5 M.Karweit (modified)
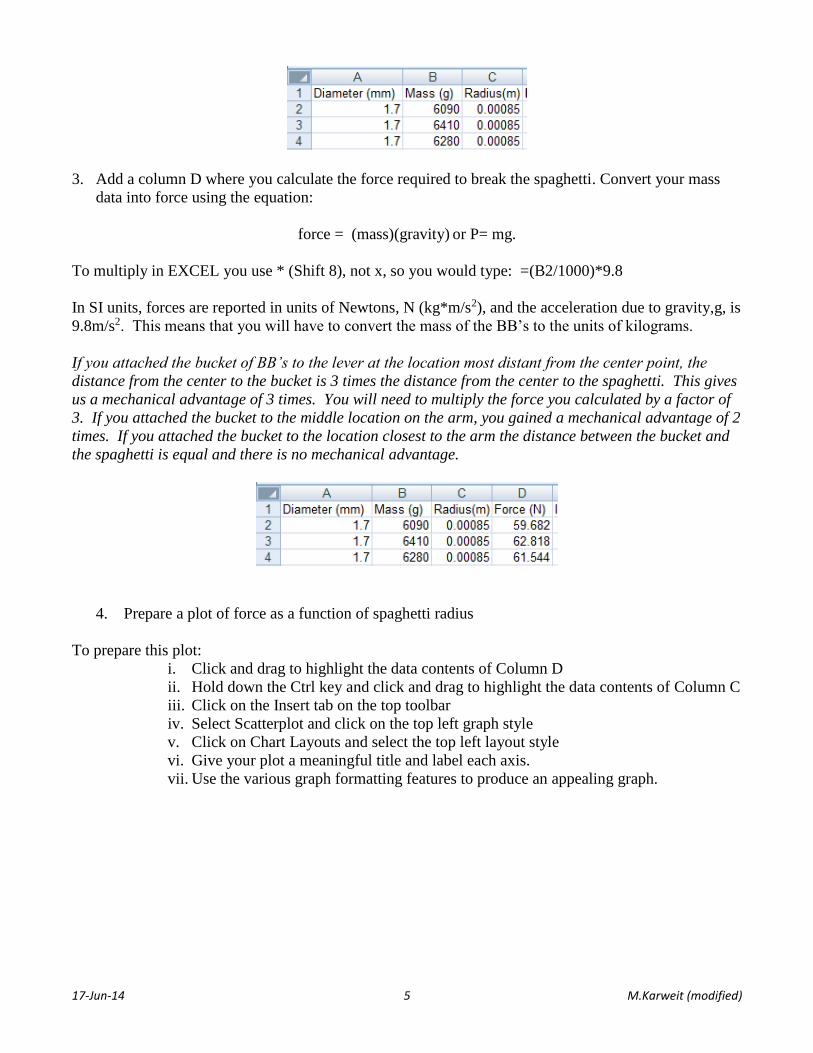
3. Add a column D where you calculate the force required to break the spaghetti. Convert your mass
data into force using the equation:
force = (mass)(gravity) or P= mg.
To multiply in EXCEL you use * (Shift 8), not x, so you would type: =(B2/1000)*9.8
In SI units, forces are reported in units of Newtons, N (kg*m/s2), and the acceleration due to gravity,g, is
9.8m/s2. This means that you will have to convert the mass of the BB’s to the units of kilograms.
If you attached the bucket of BB’s to the lever at the location most distant from the center point, the
distance from the center to the bucket is 3 times the distance from the center to the spaghetti. This gives
us a mechanical advantage of 3 times. You will need to multiply the force you calculated by a factor of
3. If you attached the bucket to the middle location on the arm, you gained a mechanical advantage of 2
times. If you attached the bucket to the location closest to the arm the distance between the bucket and
the spaghetti is equal and there is no mechanical advantage.
4. Prepare a plot of force as a function of spaghetti radius
To prepare this plot:
i. Click and drag to highlight the data contents of Column D
ii. Hold down the Ctrl key and click and drag to highlight the data contents of Column C
iii. Click on the Insert tab on the top toolbar
iv. Select Scatterplot and click on the top left graph style
v. Click on Chart Layouts and select the top left layout style
vi. Give your plot a meaningful title and label each axis.
vii. Use the various graph formatting features to produce an appealing graph.

17-Jun-14 6 M.Karweit (modified)
5. Inspect your graph carefully, what sort of trends do you see? Does the data appear to be linear?
We would like to find the relationship between the spaghetti radius and the force it takes to break the
spaghetti. Linear relationships are easy for us to understand. If your plot of force vs. radius is not linear,
you will need to manipulate the data to find a linear relationship. Using logarithms will allow us to
determine the mathematical relationship between force and radius.
If we make the assumption that the force is a function of only the radius we can set up the following
proportionality, force is proportional to the radius raised to the power x:
P α Rx;
We can convert this proportionality into an equality by adding a proportionality constant, in this case, k:
P = kRx
How can we use this equation to determine the value of x? Taking the log of each side changes the
exponential equation to a linear equation y = mx + b. The equation:
𝑃 = 𝑘 𝑅𝑥
becomes,
log 𝑃 = 𝑥𝑙𝑜𝑔𝑅 + 𝑙𝑜𝑔𝑘

17-Jun-14 7 M.Karweit (modified)
Plotting log P vs. log R gives a straight line with slope x and intercept log k. By plotting the logs rather
than the values themselves, the straight line shows that P is proportional to R to some power. The slope
is the power. Many physical relationships follow such power laws.
6. Plot log P vs. log R.
To do this you will want to create a column of data for log(P) and log(R). If you would like
EXCEL to calculate the log of the radius given in Cell C2, you would type the following
equation in Cell E2:
=log(C2)
7. Use the Trendline function of Excel to display the best fit line for your data.
i. Select a data point on the graph and right click on that datapoint.
ii. Select Add Trendline
iii. Select Linear
iv. Check the box for Display Equation on chart
v. Check the box for Display R-squared value on chart (this is a measure of how well the
equation fits the data – the closer this value is to 1.000, the better the data fits the given
equation).
8. What is the equation for the relationship between P and R? Use the equation displayed on the graph
after you add the Trendline.
A word about units: A number without a unit is meaningless. You should always write a unit with a
number. Getting a meaningful value often depends on the units you use. You sometimes need to convert
one unit, like miles per hour, to another, like feet per second.
Spaghetti’s yield strength (in Pascals) is equal to force (in Newtons) divided by area (in square meters).
A material’s yield strength should be constant regardless of its cross-sectional area. However,
imperfections and non-uniformities in a material can cause deviations in the measured values of
strength.
9. In your Excel sheet, add a column for the spaghetti cross area, A = πR2.
i. The EXCEL function for π is =PI()
ii. To raise a value to a power in EXCEL, you use the ^ key (Shift 6)
10. Add a column for yield strength and calculate it for all your data points.
11. Do you get about the same value for all the spaghetti, independent of diameter?
12. What is the average value for the spaghetti yield strength?
To calculate an average in EXCEL, you use the AVERAGE( ) function. To determine the
average of the contents of cells C2 through C12, you would type the following in an empty cell
in your spreadsheet:
=AVERAGE(C2:C12)

17-Jun-14 8 M.Karweit (modified)
Deliverables for Tension Homework:
1. Excel spreadsheet showing your data.
2. Graphs of data with the lines and slopes shown – with titles and axes labeled.
3. A paragraph stating what the results mean.

17-Jun-14 9 M.Karweit (modified)
Experiment 2: Bending from Perpendicular Force Test
Objectives:
1. What are our questions?
2. How are we going to answer our questions?
Background:
Spaghetti bends easily when you push perpendicular to it. Now
we will examine the strength of spaghetti relevant to this
bending.
Strength is related to bending in the following way: when a
specimen is bent its material is being strained (stretched or
compressed). Atoms are pushed closer together on the inside of
the bend and pulled farther apart on the outside of the bend (in
Figure 5 the top of the beam experiences compression while the
bottom of the beam experiences tension). Since these atoms are
no longer at their equilibrium distance, they exert reactionary
forces within the specimen which balance the bending load – up
to a point.
At some degree of bending, the specimen yields or fractures. For brittle materials like spaghetti, the
specimen may simply fracture. For non-brittle materials like aluminum, the specimen yields and takes on
a permanent deformation. These points are called the fracture strength and yield strength, respectively. If
the material breaks, the atoms on the outside of the bend have been pulled too far apart to hold the material
together. The material has reached its maximum strain.
Pre-lab excercises:
Spend 5 minutes playing with your spaghetti and make an effort to determine what affects the bending
strength. As a guideline think about the following:
1. How does the magnitude of the force affect the deflection (extent of bending)
2. For a given force does a longer piece deflect more/less than a shorter piece of the same diameter
3. For 2 different diameters but equal length pieces, which deflects more?
Now formulate a proportionality between P (force) and (a) y (deflection); (b)L (length); and (c) D
(diameter). For now, don’t worry about exponentials.
How is strength related to bending?
1. On an atomic scale, what is going on when a sample is bent? Do the atoms on the outside and
inside of the bend undergo the same force?
2. How would you expect the bending of spaghetti (brittle) to be different from the bending of
annealed Aluminum (ductile)?
Once the material breaks/cracks/fractures, it has reached its maximum strain and the corresponding
strength is called its fracture strength.
Figure 5 Specimen Bending
17-Jun-14 10 M.Karweit (modified)
Theoretically, these observations can be summed up in the equation for the bending load on a rod. P is
directly proportional to the deflection y.
𝑃 = 𝛼𝑦
where 𝛼 =3𝜋𝐷4𝐸
4𝐿3
where P is the force applied to bend the material, y is the vertical deflection of the rod caused by the force
P, D is the rod diameter, E is Young’s Modulus, and L is the length of the rod between two supports.
Verify that this equation agrees with our observations. Note, also, that this linear equation is congruent
to Hooke’s Law.
In this lab you will measure the bending deflection of spaghetti under a perpendicular load. You will then
use the results to infer Young’s Modulus and the ultimate yield strength or fracture strength of the
spaghetti.
Recording Data:
Record all your data in a notebook and then transfer it to an Excel data sheet. Think about the information
you want to record in your lab notebook. Plan ahead to decide how you will record it in a table of rows
and columns. You will be taking a lot of data so good data management is important. Don’t forget to
measure the diameter for every piece of spaghetti you test.
Pre-lab question: What parameters do you need to record in your lab notebook for each data
measurement? Prepare a sample table with a few imaginary, but plausible, data.
Procedure:
Wear safety glasses and closed-toed shoes throughout the lab. In addition, wear gloves while
handling the lead BBs and be sure to wash your hands after the lab!
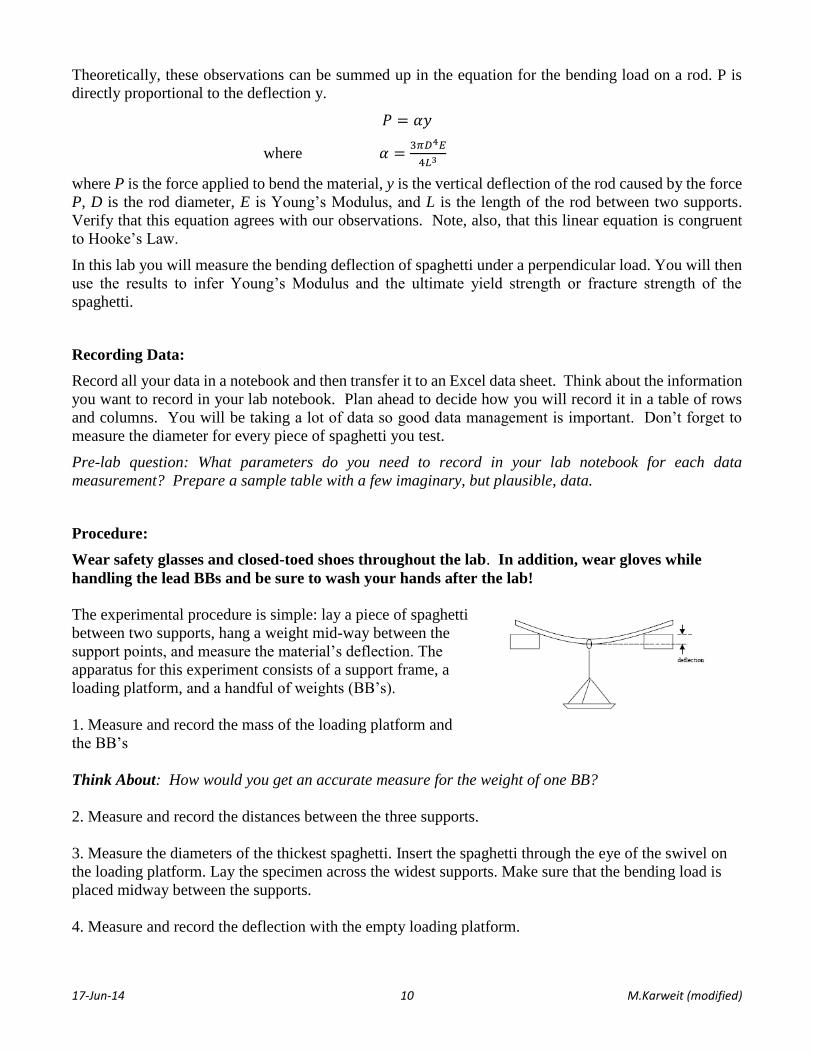
The experimental procedure is simple: lay a piece of spaghetti
between two supports, hang a weight mid-way between the
support points, and measure the material’s deflection. The
apparatus for this experiment consists of a support frame, a
loading platform, and a handful of weights (BB’s).
1. Measure and record the mass of the loading platform and
the BB’s
Think About: How would you get an accurate measure for the weight of one BB?
2. Measure and record the distances between the three supports.
3. Measure the diameters of the thickest spaghetti. Insert the spaghetti through the eye of the swivel on
the loading platform. Lay the specimen across the widest supports. Make sure that the bending load is
placed midway between the supports.
4. Measure and record the deflection with the empty loading platform.

17-Jun-14 11 M.Karweit (modified)
5. Begin to add BB’s. Record the number of BB’s and the deflection for each BB added. At some
maximum deflection, the specimen will break. That value is especially interesting.
6. For the largest diameter of spaghetti, repeat the load vs. deflection measurement on the other two
support widths. Measure and record the diameter of each spaghetti piece tested.
7. For the shortest span length only, repeat the test for the other three spaghetti thicknesses. This will
give you a total of six data sets.
Data Analysis:
Enter your data into an Excel spreadsheet. Think about what columns of information you want to
display. The way you display data will make your plotting simple or difficult. Make sure you include
units (meters, kilograms, etc.)
Enter your data into an Excel spreadsheet, along with the proper units.
Using Excel, convert your mass data into force using the equation:
force = (mass)(gravity) or P= mg.
In SI units, forces are reported in units of Newtons, N (kg*m/s2), and the acceleration due to
gravity,g, is 9.8m/s2.
For the largest diameter of spaghetti and widest separation, plot the weight force P as a function
of the deflection y.
QUESTION 1: What sort of trend do you see in your plot of force vs. deflection?
Use the trendline function of Excel Chart to calculate a linear fit to the data. The slope for the
line is the same as from page 10.
Repeat the process for each of your other data sets. (You can put them all on the same graph for
easier comparison).
On a clear part of your spreadsheet, summarize your data for the five data sets. Make columns
for D (in meters), L (in meters), and (in Newtons/meter). Enter the values for the five data
sets.
Add a fourth column for Young’s Modulus E. In that column, calculate E from the equation on
page 10 using D, L and .
QUESTION 2: How do the values of E compare for the five data sets? Should they be the
same?
Calculate the average E, which is the goal of the lab. Young’s Modulus for spaghetti should be
around 4x 10⁹ Pa.
17-Jun-14 12 M.Karweit (modified)
Deliverables for Bending Homework:
1. Excel spreadsheet showing your data.
2. Graphs of data and results – with titles and axes well labeled so the information is clearly shown.
3. A paragraph which answers QUESTION 1 and QUESTION 2 and states what the results mean.
Experiment 3: Buckling Test
Objectives:
1. What are our questions?
2. How are we going to answer our questions?
Background:
Although compression testing in addition to tension testing is also useful for determining such mechanical
properties as yield strength, elastic modulus, ultimate strength, etc., it is particularly useful for determining
the relationship between a material’s length and its compressive strength. A material in compression will
fail by one of two ways: buckling or crushing.
Spend 5 minutes playing with your spaghetti and make an effort to determine what affects the buckling
strength. As a guideline think about the following:
1. Does the resistance to buckling increase or decrease as L decreases (D stays the same)?
2. For 2 different diameters but equal length pieces, does the thin sample buckle more or less than
the thick sample?
Theoretically, these observations can be summed up in an equation for the compression buckling of a rod.
If you try to compress a cylindrical rod by applying an increasing force against its end, you will reach a
point where the rod no longer remains straight, but begins to bend or buckle. The force at which this
happens is called the Euler buckling load P.
𝑃 =𝐴𝐸𝜋2
(2𝑘𝐿/𝑅)2
where P is the buckling load, A is the cross-sectional area of the specimen tested, E is Young’s Modulus
for the material, k is a constant that depends on how the rod is held, L is the length of the specimen, R is
the radius of the cylindrical specimen, and m is a known exponent that will be determined in this
experiment. For a circular rod (A = R2) held in such a way to allow free rotation at the ends (in other
words, pinned), k=1 and P becomes
𝑃 =𝐸𝜋3𝑅4
4𝐿2
𝑃 =𝐸𝜋3𝐷4
64𝐿2
Taking an additional step and grouping the constants in a term 𝛽,
𝑃 = 𝛽𝑅4
𝐿2
17-Jun-14 13 M.Karweit (modified)
Procedure:
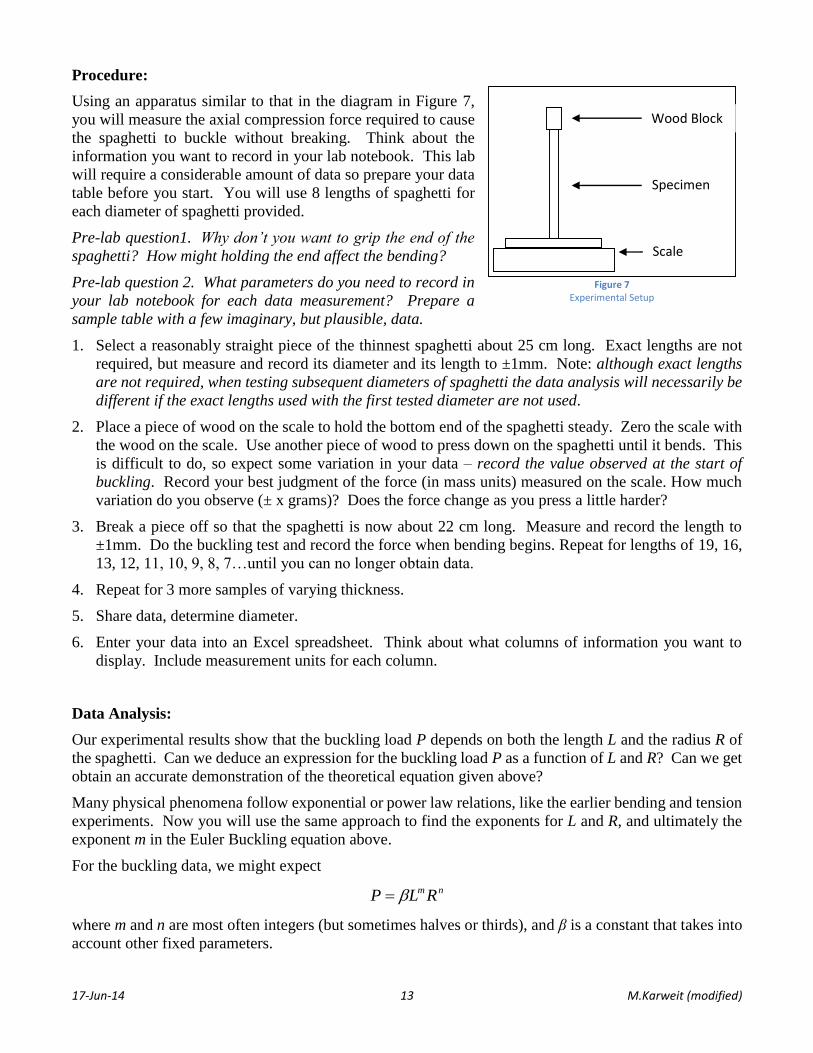
Using an apparatus similar to that in the diagram in Figure 7,
you will measure the axial compression force required to cause
the spaghetti to buckle without breaking. Think about the
information you want to record in your lab notebook. This lab
will require a considerable amount of data so prepare your data
table before you start. You will use 8 lengths of spaghetti for
each diameter of spaghetti provided.
Pre-lab question1. Why don’t you want to grip the end of the
spaghetti? How might holding the end affect the bending?
Pre-lab question 2. What parameters do you need to record in
your lab notebook for each data measurement? Prepare a
sample table with a few imaginary, but plausible, data.
1. Select a reasonably straight piece of the thinnest spaghetti about 25 cm long. Exact lengths are not
required, but measure and record its diameter and its length to ±1mm. Note: although exact lengths
are not required, when testing subsequent diameters of spaghetti the data analysis will necessarily be
different if the exact lengths used with the first tested diameter are not used.
2. Place a piece of wood on the scale to hold the bottom end of the spaghetti steady. Zero the scale with
the wood on the scale. Use another piece of wood to press down on the spaghetti until it bends. This
is difficult to do, so expect some variation in your data – record the value observed at the start of
buckling. Record your best judgment of the force (in mass units) measured on the scale. How much
variation do you observe (± x grams)? Does the force change as you press a little harder?
3. Break a piece off so that the spaghetti is now about 22 cm long. Measure and record the length to
±1mm. Do the buckling test and record the force when bending begins. Repeat for lengths of 19, 16,
13, 12, 11, 10, 9, 8, 7…until you can no longer obtain data.
4. Repeat for 3 more samples of varying thickness.
5. Share data, determine diameter.
6. Enter your data into an Excel spreadsheet. Think about what columns of information you want to
display. Include measurement units for each column.
Data Analysis:
Our experimental results show that the buckling load P depends on both the length L and the radius R of
the spaghetti. Can we deduce an expression for the buckling load P as a function of L and R? Can we get
obtain an accurate demonstration of the theoretical equation given above?
Many physical phenomena follow exponential or power law relations, like the earlier bending and tension
experiments. Now you will use the same approach to find the exponents for L and R, and ultimately the
exponent m in the Euler Buckling equation above.
For the buckling data, we might expect
nm RLP
where m and n are most often integers (but sometimes halves or thirds), and β is a constant that takes into
account other fixed parameters.
Wood Block
Specimen
Scale
Figure 7 Experimental Setup

17-Jun-14 14 M.Karweit (modified)
With two variables, however, we must analyze them one at a time. We will hold one constant while
analyzing the other.
Part 1 – The Length Variable
1. Select the data for the thickest spaghetti. Using Excel, convert your mass data into force using the
equation:
force = (mass)(gravity) or P= mg.
In SI units, forces are reported in units of Newtons, N (kg*m/s2), and the acceleration due to gravity,
g, is 9.8m/s2.
2. Plot Buckling Load P (in Newtons) vs. length L (in meters). Is the plot linear?
3. Now plot Log P vs. Log L. Use the trendline function of Excel Chart to calculate the slope for the
line. The slope is the value of m, the exponent for L. How does it compare with the theoretical
value?.
4. Repeat step 3 for the other thicknesses of spaghetti.
5. Summarize your results for all the data. Are the results similar? Calculate the average value for the
exponent. What integer is it close to?
Part II The Diameter Variable
1. For the 19-cm spaghetti, plot log P vs. log R. Your force, P, should have units of N. The radius.
R, should have units of m. You will have four data points, one for each of the four thicknesses.
2. Use the trendline function of Excel Chart to calculate the slope for the line. The slope is the
value of n, the exponent for R. How does it compare with the theoretical value?.
3. Repeat these calculations for another length. Choose a length that is less than 15 cm. Are the
results similar?
Part III Calculation of Young’s Modulus
Recall that the equation for the buckling load is : 2
43
4L
REP

17-Jun-14 15 M.Karweit (modified)
If you plot P vs. R4 L-2, you should get a straight line with a slope of 4
3
E . You must, however,
be careful with units. Put all units in the mks system.
1. Make a column in your spreadsheet for R4 L-2. For all your data, plot P vs. R4 L-2. What kind of
line do you get? Use the trendline to calculate the slope of the line.
2. Using the slope, calculate E. Compare your value to the results you got for the bending lab.
Full Lab Report for the Buckling Materials Lab Activity:
Type a full lab report to include these sections:
Objective: A sentence to describe the goals of your experiment.
Partners: List the names of your lab partners.
Procedure: A brief description of what you did, with sufficient information for someone else to
reproduce your work. List the equipment you used. Use simple drawings to illustrate the procedure.
If you are following a written procedure, include it rather than copy it – and describe how you
deviated from the written procedure.
Data: Include a spreadsheet with all your data.
Results: Graphs of data and results – with titles and axes well labeled so the information is clearly
shown. After each graph, write a simple sentence explaining any trends. For example, “as diameter
of the pasta increases, tensile strength increases.”
Error Analysis: Examine any lab error. Describe how the error might affect your results. Never say
“human error”—I know you are human. Be specific about the causes of error.
Discussion and Conclusions: Determine whether the results make sense. If appropriate, compare your
results with theory. What did the lab demonstrate? Was it successful? Be sure to answer any questions
asked in the procedure here.