Embed Size (px)
Citation preview

MASTERARBEIT
Titel der Masterarbeit
Activity of Eurycoma analogs and Artemisinin andtheir interaction in Plasmodium falciparum in vitro
Verfasserin
Karin Taus, Bsc
angestrebter akademischer Grad
Master of Science (MSc)
Wien, 2012
Studienkennzahl lt Studienblatt: A 066 827Studienrichtung lt. Studienblatt: Masterstudium AnthropologieBetreuerin: Prof. Dr. Christine Fellner


In this, O Nature, yield I pray to me.I pace and pace, and think and think, and take
The fever’d hands, and note down all I see,That some dim distant light may haply break.
The painful faces ask, can we not cure?We answer, No, not yet; we seek the laws.O God, reveal thro’ all this thing obscure
The unseen, small, but million-murdering cause.(Sir Ronald Ross 1895)


Contents
1 Zusammenfassung 11
2 Abstract 13
3 Introduction 153.1 History of malaria . . . . . . . . . . . . . . . . . . . . . . . . . . . . . . . 153.2 Epidemiological facts . . . . . . . . . . . . . . . . . . . . . . . . . . . . . 183.3 The Parasite . . . . . . . . . . . . . . . . . . . . . . . . . . . . . . . . . . 20
3.3.1 Plasmodium falciparum . . . . . . . . . . . . . . . . . . . . . . . . 203.3.2 Plasmodium vivax . . . . . . . . . . . . . . . . . . . . . . . . . . . 223.3.3 Plasmodium ovale . . . . . . . . . . . . . . . . . . . . . . . . . . . 233.3.4 Plasmodium malariae . . . . . . . . . . . . . . . . . . . . . . . . . 24
3.4 The Life cycle . . . . . . . . . . . . . . . . . . . . . . . . . . . . . . . . . 253.4.1 Liver phase . . . . . . . . . . . . . . . . . . . . . . . . . . . . . . 253.4.2 Blood phase . . . . . . . . . . . . . . . . . . . . . . . . . . . . . . 263.4.3 Mosquito phase . . . . . . . . . . . . . . . . . . . . . . . . . . . . 27
3.5 The Vector . . . . . . . . . . . . . . . . . . . . . . . . . . . . . . . . . . 273.6 Clinical symptoms of P. falciparum . . . . . . . . . . . . . . . . . . . . 28
3.6.1 Uncomplicated malaria . . . . . . . . . . . . . . . . . . . . . . . . 283.6.2 Severe malaria . . . . . . . . . . . . . . . . . . . . . . . . . . . . . 28
3.7 Diagnosis of malaria . . . . . . . . . . . . . . . . . . . . . . . . . . . . . 303.7.1 Symptom-based diagnosis . . . . . . . . . . . . . . . . . . . . . . 303.7.2 Rapid diagnostic tests . . . . . . . . . . . . . . . . . . . . . . . . 303.7.3 Microscopic diagnosis . . . . . . . . . . . . . . . . . . . . . . . . . 31
3.8 Antimalarial drugs . . . . . . . . . . . . . . . . . . . . . . . . . . . . . . 323.8.1 Classification of antimalarial drugs . . . . . . . . . . . . . . . . . 323.8.2 Treatment of malaria . . . . . . . . . . . . . . . . . . . . . . . . . 33
3.9 Antimalarial drug resistance . . . . . . . . . . . . . . . . . . . . . . . . . 353.9.1 Mechanism of antimalarial resistance . . . . . . . . . . . . . . . . 373.9.2 Treatment failure . . . . . . . . . . . . . . . . . . . . . . . . . . . 37
4 Methods and Material 394.1 Study area . . . . . . . . . . . . . . . . . . . . . . . . . . . . . . . . . . . 394.2 Patients . . . . . . . . . . . . . . . . . . . . . . . . . . . . . . . . . . . . 40
4.2.1 Including criteria . . . . . . . . . . . . . . . . . . . . . . . . . . . 404.2.2 Epidemiology . . . . . . . . . . . . . . . . . . . . . . . . . . . . . 40
5

Contents
4.3 Substances tested . . . . . . . . . . . . . . . . . . . . . . . . . . . . . . . 424.3.1 Artemisinin . . . . . . . . . . . . . . . . . . . . . . . . . . . . . . 424.3.2 Extracts from Eurycoma longifolia . . . . . . . . . . . . . . . . . 43
4.4 In vitro test system . . . . . . . . . . . . . . . . . . . . . . . . . . . . . . 444.5 Evaluation and statistical analysis . . . . . . . . . . . . . . . . . . . . . . 46
5 Results 475.1 Activity of tested drugs . . . . . . . . . . . . . . . . . . . . . . . . . . . . 48
5.1.1 Activity of Artemisinin . . . . . . . . . . . . . . . . . . . . . . . . 485.1.2 Activity of Eury 1 . . . . . . . . . . . . . . . . . . . . . . . . . . 525.1.3 Activity of Eury 2 . . . . . . . . . . . . . . . . . . . . . . . . . . 565.1.4 Activity of Eury 3 . . . . . . . . . . . . . . . . . . . . . . . . . . 605.1.5 Activity of Eury 1 plus Artemisinin . . . . . . . . . . . . . . . . . 645.1.6 Activity of Eury 2 plus Artemisinin . . . . . . . . . . . . . . . . . 685.1.7 Activity of Eury 3 plus Artemisinin . . . . . . . . . . . . . . . . . 72
6 Discussion and Conclusion 776.1 Activity and Regression Analysis . . . . . . . . . . . . . . . . . . . . . . 77
6.1.1 Artemisinin . . . . . . . . . . . . . . . . . . . . . . . . . . . . . . 776.2 Variance analysis of resulting data . . . . . . . . . . . . . . . . . . . . . . 78
6.2.1 Analysis for Interaction between Artemisinin and Eurycoma 1, 2,3 in P. falciparum . . . . . . . . . . . . . . . . . . . . . . . . . . 78
7 Annex 81
6

List of Figures
3.1 Malaria distribution in the mid-19th century . . . . . . . . . . . . . . . . 173.2 Malaria distribution 2007 . . . . . . . . . . . . . . . . . . . . . . . . . . . 193.3 Different stages of P. falciparum in erythrocytes . . . . . . . . . . . . . . 203.4 Different stages of P. vivax in erythrocytes . . . . . . . . . . . . . . . . . 223.5 Different stages of P. ovale in erythrocytes . . . . . . . . . . . . . . . . . 233.6 Different stages of P. malariae in erythrocytes . . . . . . . . . . . . . . . 243.7 Life Cycle of Plasmodia . . . . . . . . . . . . . . . . . . . . . . . . . . . 263.8 Anopheles gambiae . . . . . . . . . . . . . . . . . . . . . . . . . . . . . . 273.9 Antimalarial drug resistance to P. falciparum according to WHO . . . . 36
4.1 Map of Thailand . . . . . . . . . . . . . . . . . . . . . . . . . . . . . . . 394.2 Artemisinin . . . . . . . . . . . . . . . . . . . . . . . . . . . . . . . . . . 424.3 E. longifolia . . . . . . . . . . . . . . . . . . . . . . . . . . . . . . . . . 434.4 Structure of quassinoids from E. longifolia (1 = eurycomanone; 2 = 13,21-
dihydroeurycomanone; 3 = 13α (21)-epoxyeurycomanone) . . . . . . . . 43
5.1 Regression analysis of Artemisinin . . . . . . . . . . . . . . . . . . . . . . 505.2 Effective doses of Artemisinin . . . . . . . . . . . . . . . . . . . . . . . . 515.3 Regression analysis of E. longifolia 1 extract . . . . . . . . . . . . . . . . 545.4 Effective doses of E. longifolia 1 extract . . . . . . . . . . . . . . . . . . 555.5 Regression analysis of E. longifolia 2 extract . . . . . . . . . . . . . . . . 585.6 Effective doses of E. longifolia 2 extract . . . . . . . . . . . . . . . . . . 595.7 Regression analysis of E. longifolia 3 extract . . . . . . . . . . . . . . . . 625.8 Effective doses of E. longifolia 3 extract . . . . . . . . . . . . . . . . . . 635.9 Regression analysis of Artemisinin plus E. longifolia 1 extract . . . . . . 665.10 Effective doses of Artemisinin plus E. longifolia 1 extract . . . . . . . . . 675.11 Regression analysis of Artemisinin plus E. longifolia 2 extract . . . . . . 705.12 Effective doses of Artemisinin plus E. longifolia 2 extract . . . . . . . . . 715.13 Regression analysis of Artemisinin plus E. longifolia 3 extract . . . . . . 745.14 Effective doses of Artemisinin plus E. longifolia 3 extract . . . . . . . . . 75
7


List of Tables
3.1 Summary and biological activities of anti-malarial drugs . . . . . . . . . 33
4.1 Micro titre plate and concentrations of the substances used in the study . 45
5.1 Drug concentration (Artemisinin) and SMI% . . . . . . . . . . . . . . . . 485.2 Regression parameters of Artemisinin* . . . . . . . . . . . . . . . . . . . 495.3 EC values: Artemisinin . . . . . . . . . . . . . . . . . . . . . . . . . . . . 495.4 Drug concentration (Eury 1) and SMI% . . . . . . . . . . . . . . . . . . 525.5 Regression parameters of Eury 1* . . . . . . . . . . . . . . . . . . . . . . 535.6 EC values: Eury 1 . . . . . . . . . . . . . . . . . . . . . . . . . . . . . . 535.7 Drug concentration (Eury 2) and SMI% . . . . . . . . . . . . . . . . . . 565.8 Regression parameters of Eury 2* . . . . . . . . . . . . . . . . . . . . . . 575.9 EC values: Eury 2 . . . . . . . . . . . . . . . . . . . . . . . . . . . . . . 575.10 Drug concentration (Eury 3) and SMI% . . . . . . . . . . . . . . . . . . 605.11 Regression parameters of Eury 3* . . . . . . . . . . . . . . . . . . . . . . 615.12 EC values: Eury 3 . . . . . . . . . . . . . . . . . . . . . . . . . . . . . . 615.13 Drug concentration (Eury 1 plus Artemisinin) and SMI% . . . . . . . . . 645.14 Regression parameters of Eury 1 plus Artemisinin* . . . . . . . . . . . . 655.15 EC values: Eury 1 plus Artemisinin . . . . . . . . . . . . . . . . . . . . . 655.16 Drug concentration (Eury 2 plus Artemisinin) and SMI% . . . . . . . . . 685.17 Regression parameters of Eury 2 plus Artemisinin* . . . . . . . . . . . . 695.18 EC values: Eury 2 plus Artemisinin . . . . . . . . . . . . . . . . . . . . . 695.19 Drug concentration (Eury 3 plus Artemisinin) and SMI% . . . . . . . . . 725.20 Regression parameters of Eury 3 plus Artemisinin* . . . . . . . . . . . . 735.21 EC values: Eury 3 plus Artemisinin . . . . . . . . . . . . . . . . . . . . . 73
6.1 Comparison of EC values 2009, 2010 . . . . . . . . . . . . . . . . . . . . 776.2 Regression parameters of Artemisinin 2009/2010 . . . . . . . . . . . . . . 776.3 Comparison of regression parameters Artemisinin 2009/2010 . . . . . . . 78
7.1 Patient record form Mae Sot 2010, P. falciparum . . . . . . . . . . . . . 827.2 Patient record form Mae Sot 2010, P. falciparum . . . . . . . . . . . . . 837.3 Patient record form Mae Sot 2010, P. falciparum . . . . . . . . . . . . . 847.4 Summary sheet Mae Sot 2010 P. falciparum . . . . . . . . . . . . . . . . 857.5 Schizont count Pf 2010 Artemisinin . . . . . . . . . . . . . . . . . . . . . 867.6 Schizont count Pf 2010 Eury-1 . . . . . . . . . . . . . . . . . . . . . . . . 877.7 Schizont count Pf 2010 Eury-2 . . . . . . . . . . . . . . . . . . . . . . . . 88
9

List of Tables
7.8 Schizont count Pf 2010 Eury-3 . . . . . . . . . . . . . . . . . . . . . . . . 897.9 Schizont count Pf 2010 Eury-1-Art . . . . . . . . . . . . . . . . . . . . . 907.10 Schizont count Pf 2010 Eury-2-Art . . . . . . . . . . . . . . . . . . . . . 917.11 Schizont count Pf 2010 Eury-3-Art . . . . . . . . . . . . . . . . . . . . . 92
10

1 Zusammenfassung
Die vorliegende Studie wurde zwischen Juni und August 2010 in Mae Sot, einer Stadtim Nordwesten von Thailand an der Grenze zu Myanmar durchgeführt. Dieses Gebietist bekannt für seine multiresistenten P. falciparum Stämme. Das Ziel dieser in-vitroStudie war die Aktivität, Sensibilität sowie die Interaktion von Artemisinin, E. longifoliaExtrakten und Kombinationen aus beiden gegen P. falciparum zu testen.
Für die Untersuchungen wurde der WHO Standard in-vitro Test Mark III zur Messungder Schizontenreifungshemmung verwendet. Während der Studienzeit wurden 36 frischeParasitenisolate positiv auf P. falciparum getestet. Von diesen konnten 29 Isolate in dieStudie aufgenommen werden.
Bei keiner der getesteten Substanzen konnte eine komplette Schizontenreifungshem-mung festgestellt werden.
Die relative Schizontenreifungshemmung (SMI%) für Konzentrationen von 30 nmol/lbis 3000 nmol/l war für Artemisinin zwischen 20,31% und 92,32%, for Eury-1 zwi-schen 14,71% und 81,05%, für Eury-2 zwischen 14,47% und 82,02%, für Eury-3 zwi-schen 12,38% und 85,31%, für Eury-1-Art zwischen 18,96% und 92,34%, für Eury-2-Artzwischen 18,28% und 90,90% und für Eury-3-Art zwischen 18,69% und 93,03%.
Die durchschnittlichen EC50 Werte für Artemisinin, Eury-1, Eury-2, Eury-3, Eury-1-Art, Eury-2-Art und Eury-3-Art waren 27,8586 nmol/l, 113,4614 nmol/l, 96,9067nmol/l, 102,3605 nmol/l, 50,7239 nmol/l, 36,0345 nmol/l und 35,6274 nmol/l. Die durch-schnittlichen EC90 Werte für die selben Substanzen in der gleichen Reihenfolge waren1277,0471 nmol/l, 13874,2892 nmol/l, 7763,3631 nmol/l, 5323,0386 nmol/l, 2621,9225nmol/l 1706,2443 nmol/l und 1415,4586 nmol/l. Die durchschnittlichen EC99 Werte fürdie selben Substanzen in der gleichen Reihenfolge waren 28865,3737 nmol/l, 697799,1449nmol/l, 276600,7487 nmol/l, 133347,3393 nmol/l, 65359,5184 nmol/l, 39,599,0921 nmol/lund 28472,0333 nmol/l.
Sowohl der Vergleich der EC Werte mit den EC Werten aus 2009 als auch die Regres-sionsparameter dieser zwei Jahre führte zu der Erkenntnis, dass die Wirksamkeit vonArtemisinin in diesem Gebiet nachgelassen hat.
11

1 Zusammenfassung
In der Varianzanalyse zeigten die Substanzen Eury-1-Art und Eury-2-Art einen si-gnifikanten Synergismus. Die Hemmung bei dem kombinierten Eury-3-Art Substrat warhöher als bei den einzelnen Komponenten Art mit Eury-3. Dieses Ergebnis könnte durchdie schwächere Wirkung von Artemisinin beeinflusst worden sein.
12

2 Abstract
This study was carried out in Mae Sot, a town in north western Thailand on the borderto Myanmar between June and August 2010. This area is known for its multi-drug-resistant strains of P.falciparum. The aim of this in vitro study was the assessment ofthe activity and sensitivity of Artemisinin, E. longifolia analogs, combinations of bothand their interaction in P. falciparum.
The examinations were based on the WHO standard in vitro micro-test Mark III fordetermining the inhibition of schizont maturation. Fresh blood isolates from 36 patientswere tested positive of P. falciparum. Out of them, 29 isolates could be included in thestudy.
A complete cut-off concentration could not be calculated for any of the tested sub-stances.
The observed inhibition of schizont maturation (SMI%) was for Artemisinin between20,31% and 92,32%, for Eury-1 between 14,71% and 81,05%, for Eury-2 between 14,47%and 82,02%, for Eury-3 between 12,38% and 85,31%, for Eury-1-Art between 18,96%and 92,34%, for Eury-2-Art between 18,28% and 90,90% and for Eury-3-Art between18,69% and 93,03% for concentration from 3 nmol/l up to 3000 nmol/l.
The mean EC50 values for Artemisinin, Eury-1, Eury-2, Eury-3, Eury-1-Art, Eury-2-Art and Eury-3-Art were 27,8586 nmol/l, 113,4614 nmol/l, 96,9067 nmol/l, 102,3605nmol/l, 50,7239 nmol/l, 36,0345 nmol/l and 35,6274 nmol/l. The mean EC90 val-ues for the same substances in the same order were 1277,0471 nmol/l, 13874,2892nmol/l, 7763,3631 nmol/l, 5323,0386 nmol/l, 2621,9225 nmol/l 1706,2443 nmol/l and1415,4586 nmol/l. The mean EC99 values for the same substances in the same orderwere 28865,3737 nmol/l, 697799,1449 nmol/l, 276600,7487 nmol/l, 133347,3393 nmol/l,65359,5184 nmol/l, 39,599,0921 nmol/l and 28472,0333 nmol/l.
The comparison of the EC values with EC values from 2009 as well as the regres-sion parameters of this two years lead to the assumption that there is a decrease ineffectiveness of Artemisinin in this area.
In the variance analysis the isolates showed in Eury-1-Art and Eury-2-Art a significant
13
2 Abstract
synergism. The inhibition under Eury-3-Art was higher than under separate compounds.This might be influenced from the reduced activity of Artemisinin.
14

3 Introduction
The human malaria parasites belong to the Domain: Eukaryota, Kingdom: Chroma-lveolata, Superphylum: Alveolata, Phylum: Apicomplexa, Class: Aconoidasida, Or-der: Haemosporida, Family: Plasmodiidae, Genus: Plasmodium (Wehner and Gehring,2007).
The Genus Plasmodium (Marchiafava and Celli, 1885) can be further divided into twosubgenera: Plasmodium in the strict sense, where P. vivax (Grassi and Feletti, 1890),P. ovale (Stephens, 1922) and P. malariae (Grassi and Feletti, 1890) belong to andLaverania with P. falciparum (Welch, 1897) as the only agent. (Garnham, 1988)
3.1 History of malaria
Human being and the malaria parasites have a common evolutionary history. Thereare different theories from where and how Plasmodium may have evolved. Accordingto Garnham (1966) the quartan malaria parasite appeared and evolved together withthe first prosimian in the Eocene, the tertian group in the Oligocene together with themain simians. The subgenera Laverania at the time when higher apes and early manseparated. (Bruce-Chwatt, 1988)
With this theory it seams that host-parasite relation started in tropical Africa whenhumans still lived as nomads. This way of life limited the malaria transmission. In theNeolithic revolution with settlements, agriculture and migration along river valleys inIndia, south China, Mesopotamia and the Nile valley the population began to grow.Together with the warm climate and good breading conditions for mosquitoes due toperiodic inundations of the rivers the infection started to spread, so malaria endemicitybegan. Along with human migration also malaria conquered other parts of continents.Whereas the spread of malaria on the American continent is not fully clear, the rathercold climate in Europe was limiting the malaria transmission to warm seasons. (Bruce-Chwatt, 1988)
15
3 Introduction
Evidence of malaria parasites in humans can be found in ancient texts and humanfindings. So seamed to exist malaria in Thailand 4000 years ago. This is based on ex-amination of human bones, where severe anemia was observed, which could be a sign ofchronic malaria. In ancient texts from Egypt different types of fever sometimes accom-panied with enlarged spleen were described, which lead to the assumption of malarialorigin. Enlarged spleens have also been found in Egyptian mummies about 3000 yearsold. (Poser and Bruyn, 1999)
In China different types of fever with enlarged spleen were already mentioned in docu-ments 2700 BC. For treatment, together with acupuncture, exorcisms and other plants,they used Ch’ang shan (Dichroa febrifuga) which is known to have some antimalarialeffect. The first evidence for the use of Qinghaosu (Artemisia annua), which is now thestandard treatment of P. falciparum malaria, can be found in Chinese documents 340AD. (Bruce-Chwatt, 1988)
The first clear description of the different fever attacks together with other symptomslike splenomegaly, cachexia and bilious complexions is found in Hippocratic book ofendemics of the fourth century BC. But not only the clear description, also a coherencebetween the fever, marshes and even division of low, moist and hot districts and the riskinvolved is documented. Even though Hippocrates thought the disease was caused bydrinking the stagnant water. (Poser and Bruyn, 1999)
The Roman history is strongly associated with malaria, even if the first appearanceof the disease is not clear. But the intermittent fever related with swampy areas canbe found in many Latin documents starting in the first century BC. At the time themalaria burden became so severe that they built a temple for the goddess Febris Magnaand might even play an important role at the fall of the Roman Empire. (Bruce-Chwatt,1988)
In following centuries malaria stayed a great burden almost all over Europe withouttreatment and caused many deaths. Before the discovery of the Cinchona bark, manydifferent, for present times scurrilous ways of treatment for the intermittent fever aresuggested in papers all over the world. There are also different stories from whom andwhen and how the Cinchona bark was discovered and used first. The only thing whichseams to be clear, is the finding of it in the late sixteenth or early seventeenth centurysomewhere in Peru. And that it was brought to Europe and promoted around 1730 byJesuits, thats why it was also called ’Cardinal’s Powder’ and ’Jesuits’ Bark’. The activeagent of the Cinchona bark is known today as Quinine. (Poser and Bruyn, 1999)
Despite this effective medicine of the Cinchona bark against malaria, the disease was
16

3.1 History of malaria
still widely distributed all over the world in the nineteenth and beginning of the twentiethcentury, even up to Canada and the Arctic Circle in Europe, pictured in Fig. 3.1.Almost 90% of the world population was living in malaria endemic areas (Wernsdorferand Wernsdorfer, 2003; Poser and Bruyn, 1999).
Figure 3.1: Malaria distribution in the mid-19th centurySource: Wernsdorfer and Wernsdorfer, Malaria at the turn from the 2nd to the 3rd millennium
The term ’Malaria’ origins from Italian and means ’bad air’, was coined in the nine-teenth century and referred to the fact that this periodic fever occurred in Europe mainlyin marshy areas and was caused by the ’bad air’ of these swamps (Poser and Bruyn,1999).
In the nineteenth century the theory that malaria may be caused by a ’contagiumvivum’ a living microorganism and not by ’bad air’ was formulated. In 1880 AlphonseLaveran, a French surgeon, discovered the actual parasite of malaria. But he falselythought that there was only one type of parasite causing malaria. Camillo Golgi pro-claimed in 1885, that there are distinct species causing tertian and quartan malaria. Upto that point the parasites could only be seen in fresh blood, the development of stainingby Metchnikoff in 1886 and further developed by Dimitri Romanowsky in 1891 helpedto differentiate the plasmodial species, the further differentiation of the parasite species,the life-cycle and the transmission through anopheline mosquito bites was discovered in1897 by the British military doctor Ronald Ross. This was the final breakthrough inmalaria research. (Poser and Bruyn, 1999; Bruce-Chwatt, 1988)
17

3 Introduction
In the twentieth century malaria could be eradicated in some parts like Canada andSweden by changing the land use. This did not happen in other parts of the world. Atthe end of the second world war dichloro-diphenyl-trichloroethane (DDT) was discoveredas a cheap, safe and potent insecticide. Together with the synthesized chloroquine groupof drugs it seamed to be the breakthrough in eradicating malaria from the world. Thismethod was working in USA, Europe, Australia and parts of northern Asia and led to areduction of endemicity in north Africa, southern Asia, western Oceania and other partsof America (Gramiccia and Beales, 1988). By 1975 around 50% of the world populationlived in malaria free areas (Wernsdorfer and Wernsdorfer, 2003).Between 1975 and 2000 due to resistance to DDT and antimalarial drugs and also as
an effect of the reduction in research and control efforts, malaria started to increase again(Gramiccia and Beales, 1988). Even though malaria was eliminated from large areas ofChina and by 2000 about 60% of the world population lived in malaria free areas, inmany parts of the world, especially sub-saharan Africa and civil war afflicted regions, animprovement of the malaria situation cannot be seen in the near future. (Wernsdorferand Wernsdorfer, 2003; Gramiccia and Beales, 1988)
3.2 Epidemiological facts
In low-income countries malaria is one of the main causes of morbidity and mortality(WHO, 2011).According to the world malaria report released by the WHO (World Health Orga-
nization) in 2010, in 106 countries and areas malaria is endemic. Fig. 3.2 shows thegeographical distribution of malaria in 2007. In these countries an estimated 225 mil-lion cases of malaria occurred among 3,3 billion people at risk in 2009. Compared withthe figures of 2005 this is a drop of 19 million reported cases. This seamed to be dueto impact of malaria control (WHO, 2010d). But these estimations are only based onnumbers of national malaria control programs and probably far from complete. Theincidence may probably be much higher.The main malaria case reduction of 86% can be found in the European Region followed
by American Regions with 42%. In Rwanda, Sao Tome and Principe and Zambia anincrease of cases was reported, the reason is not clear. “The vast majority of cases in2009 (78%) were in the African Region, followed by the South-East Asia (15%) andEastern Mediterranean Regions (5%).” (WHO, 2010d, p. 60)More than 90% of the clinically manifest malaria cases are caused by P. falciparum,
18

3.2 Epidemiological facts
Figure 3.2: Malaria distribution 2007Source: http://www.mosqguide.org.uk/images/Malaria.jpg
which can manifest in severe malaria with fatal outcome and therefore the reason ofnearly one million deaths worldwide (Wernsdorfer and Wernsdorfer, 2003). The worldmalaria report estimated a decrease of 20% of malaria deaths between 2005 and 2009with the largest reduction in the Region of America (WHO, 2010d). But again theseare only numbers of national malaria control programs.“It is estimated that 91% of deaths in 2009 were in the African Region, followed by theSouth-East Asia (6%) and Eastern Mediterranean Regions (2%). About 85% of deathsglobally were in children under 5 years of age.” (WHO, 2010d, p. 60)
The WHO and some partners started the roll back malaria program to reduce themalaria burden in the world. The main goal of this program is to reduce the number ofmalaria cases and deaths by 75% or more by 2015.Strategies to attain this target are that: “countries must reach all persons at risk formalaria with an insecticide-treated mosquito net (ITN) or indoor residual spraying (IRS)and provide laboratory-based diagnosis for all suspected cases of malaria and effectivetreatment of all confirmed cases.” (WHO, 2010d, p. xiii)
19

3 Introduction
3.3 The Parasite
The species Plasmodium with around 100 subspecies is part of the suborder Protozoa.Out of these 100 only 6 are human pathogen, P. falciparum, P. vivax, P. ovale whichare obligate human pathogen, P. malariae in human and other primates, P.knowlesi(Sinton and Mulligan, 1932) and P. cynomolgi (Mayer, 1907) usually in primates butfacultative also in humans. The rest is hosted in simians, birds and reptiles. (Wernsdorferand Wernsdorfer, 2010)
3.3.1 Plasmodium falciparum
Figure 3.3: Different stages of P. falciparum in erythrocytes(Source: http://hermes.ffn.ub.es/oscar/Biologia/Malaria/Malariafalcip.gif)
P. falciparum is the pathogenic agent of malaria tropica and is responsible for almostall severe cases and malarial deaths. If untreated usually 25% of P. falciparum infections
20

3.3 The Parasite
have a lethal outcome in nonimmune persons. The specially unpleasant and dangerouseffect of P. falciparum malaria is its potential to invade all ages of Red Blood Cells(RBC), hence the parasitaemia can be up to 50%, its incubation period of 8-11 days andthe occurrence of schizogony in deep capillaries. The infected RBC become physicallyaltered and tend to adhere to the internal lining of the capillaries. Together with changesin the capillary walls themselves, this has the effect of producing microcirculatory arrestin different organs like stomach, brain, kidney, liver, lungs and can also lead to ‘algidmalaria’. (Lucius and Loos-Frank, 2008; Garnham, 1988)
That a parasite is killing his host leads to the hypothesis that P. falciparum is, inevolutionary terms, a relatively young parasite (about 10000 years old). Well adaptedparasites tend not to kill their host, because they need them to survive themselves.(Lucius and Loos-Frank, 2008)
Compared to the other plasmodium species the incubation is relatively short, and oneerythrocyte can be invaded by more than one parasite or often shows double chromatin.A mature schizont, which cannot be seen in the peripheral blood, contains 24-36 mero-zoites, the duration of the erythrocytic schizogony is 48 hours and is not synchronized.That is why the fever pattern is continuously with temperatures up to 40℃, but withoutperiodic intervals. The gametocytogenesis takes 12 days, the gametocytes are ovoid andcan appear in a blood film if the infection stays 8-10 days in the host. The differentstages of P. falciparum can be seen in Fig. 3.3. An untreated primary attack usuallylasts around 2-3 weeks. True relapses from the liver do not occur, and recurrences aftera year are rare. The maximum duration of P. falciparum in the host is about 4 years.(Wernsdorfer and Wernsdorfer, 2010; Lucius and Loos-Frank, 2008)
The sporogony of P. falciparum in the mosquito needs a relative high temperature>18℃, hence why the distribution of P. falciparum malaria occurs mainly in the tropes.(Lucius and Loos-Frank, 2008; Garnham, 1988)
People living in a holoendemic area can acquire a partial immunity, which can bepassive or active. New born get the passive immunity from their immune mother throughtransport through the placenta. This will last for the first months. Thereafter and tillthe age of five, the highest mortality rates can be found. Children at the age of five to sixyears develop an active immunity so the mortality rates decrease. Due to the acquiredimmunity the parasitaemia is lower and the clinical symptoms are less severe. Withoutrepeated infections the immunity will disappear within a year. (Troye-Blomber et al.,1999)
21

3 Introduction
3.3.2 Plasmodium vivax
Figure 3.4: Different stages of P. vivax in erythrocytes(Source: http://upload.wikimedia.org/wikipedia/commons/6/60/Plasmodiumvivax.jpg)
P. vivax is the pathogenic agent, next to P. ovale of the malaria tertiana. Thedistribution of P. vivax is worldwide due to relatively low average temperature of 16℃needed for the sporogony in the mosquito. It is predominant in India, Central and SouthAmerica and eastern Asia, but it is absent in areas where people live with Duffy negativeantigens on erythrocytes, which occur mainly in West Africa. (Lucius and Loos-Frank,2008; Garnham, 1988)The incubation period of P. vivax is 8-17 days. The merozoits can only enter reticulo-
cytes, the young RBC. Therefore the parasitaemia is usually limited to 2%. The invadedRBCs are enlarged and have tiny reddish granules, so called “Schüffner dots”. The ery-throcytic schizogony takes 48 hours and is synchronized. Malaria tertiana has its namebecause of this erythrocytic schizogony, with fever attacks every 48 hours, according tothe roman counting where day one is the day with the first fever attack. Mature sch-izonts contain 16-24 merozoits. The duration of the gametocytogenesis is 48-96 hours
22

3.3 The Parasite
and the gametocytes are round. Different development stages of the parasite can beseen in Fig. 3.4. As a speciality P. vivax can form hypnozoits, which can survive in thehepatocytes of the human liver and cause relapse after months to years. An untreatedprimary attack usually lasts around 12-15 cycles till cure. But due to the hypnozoits,relapse can appear up to 5 years, which is the maximum duration of the parasite in thehost. (Lucius and Loos-Frank, 2008; Markell et al., 1999)
Even though P. vivax malaria is regarded to be ‘benign’, the attacks have a seriouscourse, with fever up to 40,5℃, chills and rigor to last four to eight hours. Very sel-dom are severe cases with splenic rupture, pulmonary injury and even cerebral malaria.(Mendis et al., 2001)
3.3.3 Plasmodium ovale
Figure 3.5: Different stages of P. ovale in erythrocytes(Source: http://static.periscopepost.com/wpcontent/uploads/2010/04/Povale.gif)
The appearance of P. ovale is generally rare and its distribution mainly in the tropicalAfrica. Sometimes there are reported cases in South America and Asia. There are many
23
3 Introduction
similarities in morphology and symptoms to P. vivax, but the clinical picture is not assevere. (Lucius and Loos-Frank, 2008; Markell et al., 1999)Like P. vivax, the merozoits of P. ovale can only invade reticulocytes and also the in-
cubation period is almost the same. The invaded RBCs are enlarged and show Schüffnerdots as well, but have a typical ovoid form which gave the name to the parasite. The ery-throcytic schizogony takes 48 hours and is synchronized, which again leads to a malariatertiana. But compared to P. vivax there are less merozoits (8-12) in a mature schizont.With 48-96 hours the duration of the gametozytogenesis is the same as well. Differentstages of P. ovale in RBCs can be seen in Fig. 3.5. An untreated infection can last upto 7 years in the host, the hypnozoits from the hepatocytes can cause relapses. (Markellet al., 1999; Garnham, 1988)
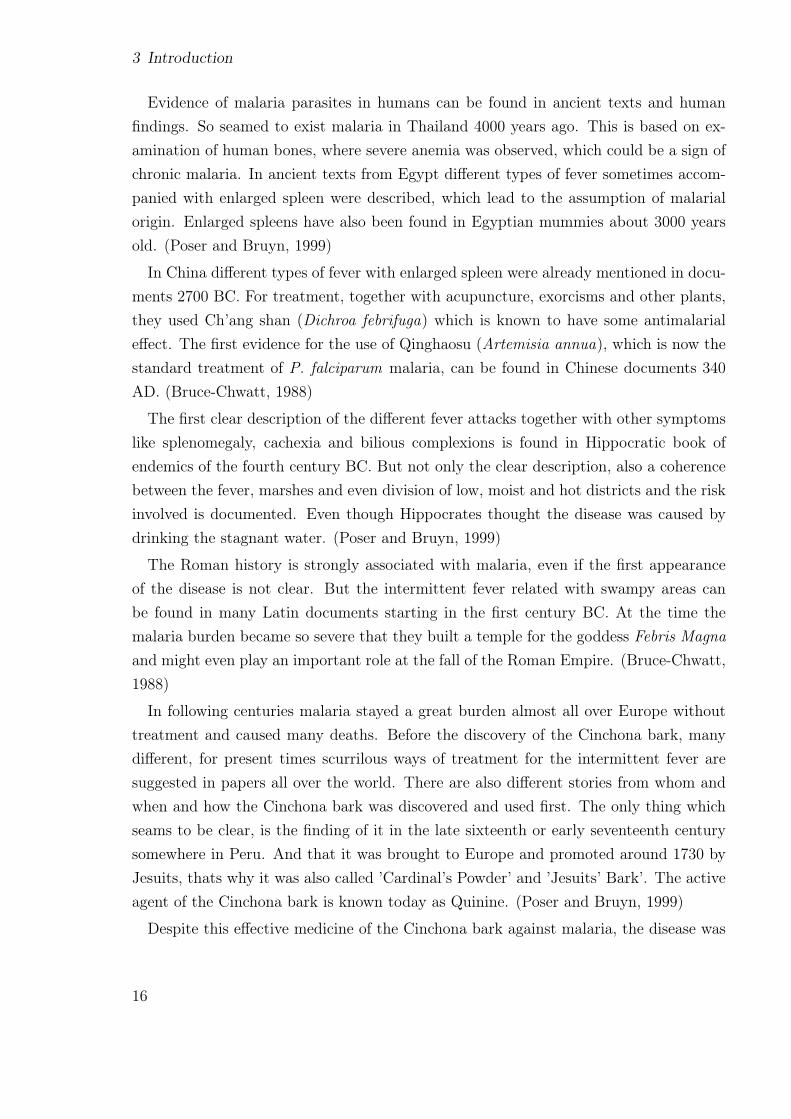
3.3.4 Plasmodium malariae
Figure 3.6: Different stages of P. malariae in erythrocytes(Source: http://www.bioon.com/Article/ UploadFiles/200406/20040603215831151.gif)
P. malariae is the pathogenic agent of malaria quartana. The distribution of P.malariae malaria is mainly in western and eastern Africa and parts of India, but generallyvery rare. (Lucius and Loos-Frank, 2008; Markell et al., 1999)The incubation period is 18-40 days. Merozoits from P. malariae can only invade
old RBCs, therefore the parasitaemia is most of the time less than 1%. The RBCs
24

3.4 The Life cycle
are not enlarged and have no Schüffner dots. The name malaria quartana, is owedto the fact that the fever attacks are every 72 hours, which is also the time for thesynchronized erythrocytic schizogony. Trophozoites tend to form the characteristic bandform. Shown, together with other stages in Fig. 3.6. A mature schizont contains 6-8merozoits, which are typically arranged in a rosette, the so called ‘daisy head’. Theduration of the gametozytogenesis is 72-120 hours, but the round gametocytes usuallyappear some weeks after the initial fever attack. An untreated primary attack usuallylasts for 3-24 weeks. The attacks are not as severe as P. vivax malaria, but last longerand sometimes nephrotic syndromes can occur as complications. P. malariae does notform hypnozoits, but it can still come to relapse even 50 years after primary infection.(Lucius and Loos-Frank, 2008; Markell et al., 1999; Garnham, 1988)
Due to the fact that P. malariae malaria is the most benign of all plasmodial infections,it seams that on a phylogenetic base it is the oldest and most adapted plasmodial species.But there are already evidences against this theory. (Garnham, 1988)
3.4 The Life cycle
The life cycle of plasmodia, pictured in Fig. 3.7, is divided in an asexual cycle in thehuman being and a sexual cycle in the female Anopheles (Meigen, 1818) mosquito (Naucket al., 1967).
3.4.1 Liver phase
The target of the sporozoites, which are imported through an infected mosquito bite,are the liver cells. They reach the cells by circulating for a short time in the bloodstream. In the hepatic cells they develop into exoerythrocytic schizonts within 5-15days, depending on the plasmodial species (Fujioka and Aikawa, 1999), 5,5 days in P.falciparum, 8 days in P. vivax, 9 days in P. ovale, and 15 days in P. malariae (Aikawa,1988). P. cynomolgi, P. vivax and P. ovale now also develop their dormant stage thehypnozoites, which can turn into exoerythrocytic schizonts and appear as relapse evenafter years (Fujioka and Aikawa, 1999). A mature exoerythrocytic schizont contains2000-40000 merozoits depending on the plasmodial species (P. malariae ∼ 2000, P.ovale ∼ 15000, P. vivax ∼ 10000 and P. falciparum 20000-40000) (Wernsdorfer andWernsdorfer, 2010). The hepatocytes rupture and merozoits are released to the bloodstream and invade RBCs within 30 seconds. Now the erythrocytic cycle begins. (Fujioka
25

3 Introduction
Figure 3.7: Life Cycle of Plasmodia(Source: http://www.jci.org/articles/view/33996/files/JCI0833996.f1/medium)
and Aikawa, 1999)
3.4.2 Blood phase
The development in the RBCs from merozoits through ring, trophozoites and schizonts iscalled the erythrocytic schizogony (Fujioka and Aikawa, 1999). In most species the mero-zoits in the RBCs have only one nucleolus and cytoplasm. By digesting the haemoglobinand developing a vacuole they grow to trophozoits. Further on the nucleolus begins todivide and becomes a schizont (Aikawa, 1988). After maturation of the schizont withthe species specific amount of merozoits, (mentioned in 3.3.1, 3.3.2, 3.3.3, 3.3.4) the
26

3.5 The Vector
RBCs bust and the released merozoits invade again new RBCs. After several of theseerythrocytic cyles, some of the merozoits turn into sexual forms, the female macroga-metocytes and the male microgametocytes. This is called the gametocytogony. (Fujiokaand Aikawa, 1999)
3.4.3 Mosquito phase
After intake of this sexual form via a blood meal in the mosquito midgut, the macrogame-tocytes leave the erythrocytes and form macrogametes. The microgametocytes exflagel-late and form eight microgametes. After fertilization of a macrogamete with a microga-mete a zygote is formed, which develops within 18-24 hours to an ookinet. The ookinetmoves through the peritrophic membran and the epithelial cells. Beneath the basementmembrane of the midgut epithelium they turn into an oocyst. An oocyst releases up to10000 sporozoits, which move to the salivery glands and accumulate there. In case thisinfected mosquito takes another blood meal from a human being, the life cycle startsagain. (Fujioka and Aikawa, 1999)
3.5 The Vector
Figure 3.8: Anopheles gambiae(Source:
http://www.raywilsonbirdphotography.co.uk/Anophelesgambiae.jpg)
The obligate vector for all human pathogen plasmod-ium are the female anopheline mosquitoes. An ex-ample pictured in Fig. 3.8 with A. gambiae. Out ofthe currently known 420 different anopheline species,around 67 merit consideration as malaria vectors, butroughly half of them are responsible for the mosttransmissions. (Wernsdorfer and Wernsdorfer, 2010)The distribution of the anopheline mosquitoes is
not restricted to the tropics and subtropics, they arefound worldwide, even in the arctic territories. But ifa mosquito is able to transmit malaria, many factorshave to accord. Some of these differences in malaria
infection and transmission may be due to differences in preference for human blood(anthropophilism) or for animal blood (zoophilism). Another factor is the temperature,the sporogony in the mosquito can only take place at a temperature between 16℃and 33℃. Therefore a temperature range between 20℃ and 30℃ and humidity form
27

3 Introduction
the optimum conditions. Partially this is also depending on the different plasmodialspecies, e.g. P. vivax can stand lower temperatures whereas P. falciparum needs highertemperatures. Some other important conditions are the lifespan of the mosquito, theduration of blood meals (at least two are needed for transmission), the breeding andliving preferences and the frequency of occurrence of female mosquitoes. (Wernsdorferand Wernsdorfer, 2010; Lucius and Loos-Frank, 2008; Weyer, 1939)
3.6 Clinical symptoms of P. falciparum
P. falciparum malaria or malaria tropica can roughly be divided into uncomplicated andsevere malaria (Harinasuta and Bunnag, 1988).
3.6.1 Uncomplicated malaria
The first symptoms appear 8-12 days after the bite of an infected mosquito and arenot specific. With headaches, fatigue, muscle and joint pain, nausea, diarrhea followedby chills, fever and vomiting, it is difficult to distinguish from influenza or other viralinfections. In the early stage of the infection the fever pattern is continuous remittent butwithout periodicity. Mild anemia and enlarged spleen might also be found, especially inpatients with constant re-infections. With proper treatment in this stage, the infectionscan be fully cured. Without treatment the primary attack can lead to severe malariaand can be fatal to non immune people. (WHO, 2010b; Harinasuta and Bunnag, 1988)
3.6.2 Severe malaria
Although about one percent of all malaria cases turn into severe malaria, it is stillresponsible for around one million deaths each year in sub-Saharan Africa (Mackintoshet al., 2004).The reason for the manifestation of severe malaria is the fact that infected RBCs tend
to adhere in the small blood vessels and block the blood supply to organs. This canappear suddenly and at any stage of the infection. (Harinasuta and Bunnag, 1988)
Definition of severe P. falciparum malaria according to WHO
“In a patient with P. falciparum asexual parasitaemia and no other obvious cause ofsymptoms, the presence of one or more of the following clinical or laboratory features
28

3.6 Clinical symptoms of P. falciparum
classifies the patient as suffering from severe malaria:
Clinical features:
• impaired consciousness or unrousable coma
• prostration, i.e. generalized weakness so that the patient is unable walk or sit upwithout assistance
• failure to feed
• multiple convulsions - more than two episodes in 24 h
• deep breathing, respiratory distress (acidotic breathing)
• circulatory collapse or shock, systolic blood pressure <70 mm Hg in adults and<50 mm Hg in children
• clinical jaundice plus evidence of other vital organ dysfunction
• haemoglobinuria
• abnormal spontaneous bleeding
• pulmonary oedema (radiological)
Laboratory findings:
• hypoglycaemia (blood glucose <2.2 mmol/l or <40 mg/dl)
• metabolic acidosis (plasma bicarbonate <15 mmol/l)
• severe normocytic anaemia (Hb <5 g/dl, packed cell volume <15%)
• haemoglobinuria
• hyperparasitaemia (>2% /100000/µl in low intensity transmission areas or >5%or 250000/µl in areas of high stable malaria transmission intensity)
• hyperlactataemia (lactate >5 mmol/l)
• renal impairment (serum creatinine >265 µmol/l).”
(WHO, 2010b, p. 35)
29

3 Introduction
3.7 Diagnosis of malaria
3.7.1 Symptom-based diagnosis
As mentioned in 3.6 the clinical symptoms of malaria, e.g. headache, fever, chills andfatigue, are very general. Therefore they fit to quite a number of other diseases andalso vary in different areas. A diagnosis of malaria based only on symptoms is low insensitivity and specificity. Even if a detailed weighting and scoring system can improvethis, it is still not accurate enough and might be too difficult to implement and supervise.On the one hand a symptom-based diagnosis of malaria may lead to an over diagnosis.On the other hand also to under diagnosis. Nevertheless to know the symptoms isimportant for the initial thought to get to the right diagnose (WHO, 2010b; Gilles,1988).
3.7.2 Rapid diagnostic tests
According to the WHO “Rapid diagnostic tests (RDT) are immunochromatographic teststhat detect parasite-specific antigens” (WHO, 2010b, p. 118). RDTs can be dividedinto four groups of antigen targets: histidin-rich protein 2 (HRP2), parasite lactonedehydrogenase (pLDH), Plasmodium aldolase and the fourth not further identified isspecific to P. vivax (Murray et al., 2003). Many different tests from various producersare available to detect P. falciparum, most of them use HRP2 or pLDH or both (WHO,2008).Compared to microscopy, the advantage of RDTs is the simplicity in performance,
interpretation and rapid results. To perform the test, there is no laboratory required,not even electricity and the health workers need to be trained but less skilled (WHO,2010b).But there are also limitations of this test method, for example the sensitivity. Most
tests have limitations to detect low parasite density (200 parasite/µl), but good detectionat 2000-5000 parasites/µl (WHO, 2008). Another limitation is the specificity, manyof these test only differentiate P. falciparum and non-P. falciparum, but the non-P.falciparum are not clearer defined (Murray et al., 2003). In P. falciparum there arealso difficulties to differ new infections from effectively treated infections in the lastthree weeks, due to the persistence of HRP2 in the blood after treatment (WHO, 2010b;Murray et al., 2003). There can also be false-positive results from patients with acquiredimmunity or rheumatoid factors (WHO, 2008; Murray et al., 2003)
30

3.7 Diagnosis of malaria
However RDTs can be a good alternative to reduce anti-malarial overuse in areas withlow transmission and poor settings. But it is important to ensure the good quality andstorage of the tests and well trained health workers (WHO, 2010b; Murray et al., 2003).
3.7.3 Microscopic diagnosis
The light microscopy should be the ‘field standard’ in malaria diagnosis (WHO, 2010b).There are two ways of examination, a ‘thick film’ and a ‘thin film’. In the thick filmmany layers of red and white blood cells upon each other, so the parasites are moreconcentrated and therefore easy to find and identify. This method is used to search forparasites. A thin film, if properly made, consists only of one layer of blood cells. Thismethod is used to confirm the plasmodial species and only in exceptions for parasiticsearch (WHO, 1991).
Preparation of a thick film
Before starting, the patients data need to be recorded and the slide appropriately labeled.After disinfection and drying, the finger tip is pricked with a sterile lancet. Two or threelarge drops of blood are placed close together in the middle of the slide. To make aneven thick film with a diameter of about one centimeter, the drops are joined with somestrokes using the corner of another slide. Before staining, the slide needs to fully dry.(WHO, 1991)
Giemsa stain
Giemsa is the most commonly used stain for the diagnosis of malaria on blood smears(Shute, 1988).
“Giemsa stain is an alcohol-based Romanowsky stain. Giemsa stain is a mixtureof eosin, which stains parasite chromatin and stippling shades of red or pink, andmethylene blue, which stains parasite cytoplasm blue. White-cell nuclei stain blue toalmost black, depending on the type of white cell. During staining, the hemoglobinin the red cells dissolves (dehaemoglobinization)” (WHO, 1991, p. 32).
For the rapid staining a 10% solution of Giemsa in a buffered water (pH 7,2) is used,about 3-5 ml for each slide. Staining time is eight to ten minutes. After that the slidesneed to be washed gently with plain water and dried properly in a drying rack. (WHO,1991; Shute, 1988)
31

3 Introduction
Examination blood films for malaria parasites
The examination of blood films for malaria parasites is done by light optical microscopeusing a x10 paired oculars and x100 oil immersion objective (WHO, 1991).
“Using the fine adjustment, focus on the cell elements and confirm that the portion ofthe film is acceptable for routine examination: 15-20 white blood cells per thick filmfield will give a satisfactory film thickness. Films with fewer white blood cells perfield will require more extensive examination. Routine examination of a thick filmis based on examination of 100 good fields; i.e. a slide can be pronounced negativeonly when a minimum of 100 fields have been carefully examined for the presence ofparasites.” (WHO, 1991, p. 72).In a positive slide the parasite species needs to be identified and the density to be
counted against white blood cells (WHO, 1991).
For microscopical diagnosis of malaria high costs in setting up, training and supervi-sion are involved and the maintainability might be difficult. But if this is done, it is themethod with the highest sensitivity and specificity. (WHO, 2010b)
3.8 Antimalarial drugs
Since malaria is a serious disease, a proper treatment is important (WHO, 2010b).
3.8.1 Classification of antimalarial drugs
Anti-malarial drugs can be roughly classified according to their biological activity intissue schizontocides and blood schizontocides (Desjardins et al., 1988). This is listed inTable 3.1.
Blood schizontocide (erythrocytic schizontocide): “refers to a drug which destroysasexual parasites in the blood” (Desjardins et al., 1988, p. 828). Blood schizontocidesare used as treatment as well as prophylaxis, but do not work against intrahepatic forms.Agents are: 4-Aminoquinolines, Arylaminoalcoholes and Artemisinin and its derivatives(Stuart et al., 2008).
Tissue schizontocide (exoerythrocytic schizontocide): “refers to a drug which de-stroys asexual parasites in the tissues” (Desjardins et al., 1988, p. 828), by inhibiting
32

3.8 Antimalarial drugs
Table 3.1: Summary and biological activities of anti-malarial drugs(0= no effect, + =effect, VMO=effective against P. vivax, P. malariae, P. ovale,
F=against P. falciarum)
Class DrugBloodschizon-tocide
Tissueschizon-tocide
Maturegameto-cytes
4-Aminoquinolines Chloroquine ++ 0 VMOArylaminoalcohols Quinine ++ 0 VMO
Quinidine ++ 0 VMOMefloquine ++ 0 VMO
Phenoenthrene methanol Halofantrine ++ 0 0
Artemisinin andderivatives
Artemisinin ++ 0 +
Artemether ++ 0 +
Artesunate ++ 0 +
Antimetabolites Proguanil + + 0Pyrimethamine + 0 0Sulfadoxine + 0 0
Antibiotics Tetracycline + F 0Doxycycline + + 0Clindamycin + + 0
8-Aminoquinoline Primaquine 0 + 0(Stuart et al., 2008; Ridley, 2002; Desjardins et al., 1988)
early stages or destroying hynozoites. Agents are: 8-Aminoquinoline, Proguanil andprobable Pyrimethamine (Desjardins et al., 1988).
Gametocytocide: “refers to a drug which destroys the sexual forms of the parasitein the blood” (Desjardins et al., 1988, p. 828).
3.8.2 Treatment of malaria
Since malaria is a complex disease with different activators, the following aspects haveto be considered before treatment is given:
• “The identity (species) of the Plasmodium with which the individual is infected or
33

3 Introduction
to which exposure is anticipated
• The severity of an existing infection including level of parasitemia and presence ofcomplications
• The anticipated level of immunity based on prior infection of exposure
• The likelihood of drug resistance based on geographical considerations
• The presence of special risk factors such as age, pregnancy and intercurrent illness
• The tolerability of specific drugs” (Desjardins et al., 1988, p. 828)
Treatment of uncomplicated P. falciparum malaria
For many years the standard therapy for uncomplicated P. falciparum malaria wasChloroquine. But now there is a resistance to Chloroquine in almost all parts of theworld as well as to sulphadoxine/pyrimethamine. (Ridley, 2002)
The standard therapy recommended from the WHO is now a combination of two bloodschizontocides with different way of action, to reduce the risk of resistance. One of thismedications should be an artemisinin derivative (Stuart et al., 2008). This treatmentregime is called Artemisinin-based combination therapy (ACT).There are four oral ACTs recommended at this time:
• artesunate plus mefloquine (AS+MQ) in Asia
• artemether plus lumefantrine (AL) worldwide
• artesunate plus amodiaquine (AS+AQ) worldwide
• artesunate plus sulfadoxine-pyrimethamine (AS+SP)
(WHO, 2010b)
Artemisinin is contraindicated during the first trimester of pregnancy. In this periodQuinine as a monotherapy or in combination with clindamycin should be given. (Stuartet al., 2008)
34

3.9 Antimalarial drug resistance
Treatment of severe P. falciparum malaria
Severe P. falciparum malaria is an emergency with a high mortality rate and needs tobe treated in a hospital with prompt parenteral antimalarials and good medical care(WHO, 2010b).
There are two treatment regimes recommended from theWHO, intravenous Artemetheror Artesunate or Quinine. Artesunate should be given in non-endemic areas with lowto moderate transmission. In areas with high transmission the treatment of choice isintravenous Artemether or Quinine. (WHO, 2010b; Stuart et al., 2008)
Since Quinine causes a range of side effects it should only be given if other recom-mended parenteral antimalarials are not present (WHO, 2010b).
When the patients get better after the initial parenteral treatment and can tolerateoral medications, a full course of oral ACT should be given (WHO, 2010b).
Treatment of P.vivax, P. ovale, P. malariae malaria
The current WHO recommendation to treat the so called benign malarias is still Chloro-quine. In areas with Chloroquine resistance, Amodiaquine or an Artemisinin derivativeor Mefloquine should be given. The hypnozoites from P. vivax and P. ovale must betreated with Primaquine for radical cure. (Stuart et al., 2008)
“In pregnant patients with P. vivax or P. ovale infections, radical cure with Pri-maquine should be postponed until after delivery; Chloroquine at a dose of 600 mgweekly can be given until then.” (Stuart et al., 2008, p. 189)
3.9 Antimalarial drug resistance
Resistance to antimalarial drugs has been defined by the WHO in 1965 as the “ability ofa parasite strain to survive and/or multiply despite the administration and absorptionof a drug given in doses equal to or higher than those usually recommended but withintolerance of the subject”. And was modified by Bruce-Chwatt L.J. 1981 that the drugmust “gain access to the parasite or the infected red blood cell for the duration of thetime necessary for its normal action” (Bloland, 2001, p. 12).
Malaria with its estimated one million deaths each year is one of the greatest diseaseburdens in the world, even more with antimalarial drug resistance (Wongsrichanalaiet al., 2002). The distribution of resistance can be seen in Fig. 3.9.
35

3 Introduction
Out of the four human pathogen plasmodial species, P. falciparum is the one with acomprehensive resistance to quite some drugs. A resistance to chloroquine in P. vivaxcan be found in some parts of the world. In P. ovale and P. malariae resistance is notdocumented yet. (Wongsrichanalai et al., 2002; Bloland, 2001)Chloroquine resistant P. falciparum strains are documented, except of Central Amer-
ica and the Caribbean, in all areas where P. falciparum is endemic. In the late 1950sthe first Chloroquine resistance to P. falciparum was reported at the Thai-Cambodianborder and in Colombia, followed by Africa in 1978 in the east and covered this conti-nent by 1983 and South America in the 1980s. By 1989 (with Asia and Oceania) theresistance was worldwide. (Wongsrichanalai et al., 2002)
P. falciparum resistance to sulfadoxine-pyrimethamine (SP) started again on the Thai-Cambodian border and is constantly increasing in Africa where it is used as a substitutionfor chloroquine (Wongsrichanalai et al., 2002; Bloland, 2001).Up to now resistance from P. falciparum to mefloquine as well as artemisinin and
derivatives occur only in some parts of south-east Asia and Africa (Wongsrichanalaiet al., 2002; Bloland, 2001).If a parasite is resistant and not only to the first two antimalarial drug classes (4-
aminoquinolines e.g. chloroquine and antifolates e.g. SP) but also to a third class, it iscalled a Multi-drug-resistance (MDR) (Wongsrichanalai et al., 2002).
Figure 3.9: Antimalarial drug resistance to P. falciparum according to WHOSource: Wongsrichanalai et al. (2002)
36

3.9 Antimalarial drug resistance
3.9.1 Mechanism of antimalarial resistance
There are different ways of how a parasite can acquire a resistance to drugs:A resistance can occur through a spontaneous mutation, which makes the parasite lesssensitive to a drug or drug class. Sometimes a single mutation is enough to make aparasite resist against a drug, for some drugs multiple mutations are needed. It does notnecessarily mean that all parasites of a population have the same range of resistance,this can vary from completely sensitive to highly resistant. (Bloland, 2001)
Another way for example (chloroquine), that the parasite can increase his capacity toexcrete the drug through his food vacuole, so that the drug does not reach the necessarylevel to inhibit the haem polymerization. If resistance to other quinolines develop withthe same mechanism is not yet proved. (Bloland, 2001)
Also the half-life of a drug can influence resistance. Drugs with a long half-life (SP,MQ) decrease the duration of treatment and thus encourage the compliance, but alsoincrease the possibility of the parasite to develop resistance. This can happen especiallyin areas with high transmission when the drug level drops below the level of full parasitegrowth inhibition but stays above 5% inhibition. There is still selective pressure but notenough to kill recrudescent parasites or from new infections. Due to this sub-therapeuticdrug level parasites can build up resistance. The same can happen, if medication is underdosed either due to incorrect prescription or low patient compliance of dose or duration.(Bloland, 2001)
In vivo, in vitro, animal model studies, and molecular characterization are the fourdifferent ways how antimalarial resistance can be tested (Bloland, 2001).
3.9.2 Treatment failure
According to WHO “Treatment failure is defined as an inability to clear malarial para-sitaemia or resolve clinical symptom despite administration of an antimalarial medicine.”(WHO, 2010a, p. 9)
Not every treatment failure occurs due to drug resistance. There are many otherreasons, like incorrect dosage of drugs, non compliance of patients in duration or dosingof drugs, poor absorption or fast elimination of drugs in very sick patients, poor qualityor expired drugs or drug interaction. (WHO, 2010a; Bloland, 2001)
Treatment failures are classified by the WHO in 2009 as follows:
37

3 Introduction
“Early treatment failure (ETF)
• danger signs or severe malaria on day 1, 2 or 3 in the presence of parasitaemia;
• parasitaemia on day 2 higher than on day 0, irrespective of axillary temperature;
• parasitaemia on day 3 with axillary temperature is 37.5℃; or
• parasitaemia on day 3 is 25% of count on day 0
Late clinical failure (LCF)
• danger signs or severe malaria in the presence of parasitaemia on any day betweenday 4 and day 28 (day 42) in patients who did not previously meet any of thecriteria for early treatment failure; or
• presence of parasitaemia on any day between day 4 and day 28 (day 42) withaxillary temperature >37.5℃ in patients who did not previously meet any of thecriteria for early treatment failure
Late parasitological failure (LPF)
• presence of parasitaemia on any day between day 7 and day 28 (day 42) withaxillary temperature <37.5℃ in patients who did not previously meet any of thecriteria for early treatment failure or late clinical failure
Adequate clinical and parasitological response (ACPR)
• absence of parasitaemia on day 28 (day 42), irrespective of axillary temperature,in patients who did not previously meet any of the criteria for early treatmentfailure, late clinical failure or late parasitological failure” (WHO, 2010a, p. 90)
From a contemporary perspective, malaria is not going to be eradicated in the closefuture, consequently effective antimalarials are going to be needed. As long as drugsare in use, there is always a risk that parasites develop resistance. To minimize the riskof resistance drugs pressure needs to be reduced by correct diagnosis and prescription,good patients compliance and the use of drug combinations. (Bloland, 2001)
38

4 Methods and Material
4.1 Study area
Figure 4.1: Map of Thailand(Source:http://www.beepworld.de)
The study was carried out in the Malaria Clinicin Mae Sot, Thailand. Mae Sot is a town in theTak province, about 550km northwest of Bangkokon the border to Myanmar, shown in Fig. 4.1. TheMoei River is the natural border between these twocountries and the surroundings are forest hills wheremalaria transmission is high. (Knauer et al., 2003)
Tak province is one of the regions in Thailandwhich suffers most of malaria. One of the reasonsfor this situation is the heavy border traffic be-tween Myanmar and Thailand due to labor migra-tion. Most of the population is located in remoteand rural areas surrounded by rice and cotton pad-dies and mountains with little access to health care.(WHO, 2007)
The main malaria vectors in this region and typicalfor forest areas are Anopheles dirus and Anophelesminimus. The malaria transmission period shows two peaks, one during rainy seasonbetween May and September and the second in November and December, but can gen-erally occur at any time of the year. (Knauer et al., 2003) Malaria is endemic in thisregion, with P. vivax as the leading species (approximately 60%), followed by P. falci-parum (approximately 40%). Mixed infections and other species such as P. malariaeare rarely seen. (WHO, 2010c)
The standard treatment of uncomplicated P. falciparum malaria is an oral combina-tion therapy of Mefloquine and Artesunate. Irrespective of their nationality, the treat-ment for all patients with malaria in Thailand is free of charge. This governmental
39

4 Methods and Material
program aims at preventing the increase of drug resistance due to self treatment withincorrect use of drugs and low compliance. (WHO, 2010c)The samples were taken between end of June 2010 and beginning of August 2010.
The cases were diagnosed from the medical assistants of the local malaria clinic withGiemsa-stained thick blood film and microscope.
4.2 Patients
4.2.1 Including criteria
All patients came for treatment to the malaria clinic of Mae Sot. For inclusion in ourstudy they had to be above 9 years old (excluding pregnant women) and suffering fromP. falciparum mono infections with a parasitaemia between 1000 and 100000 asexualparasites/micro liter blood.Exclusive criteria, apart from childhood and pregnancy, were severe and complicated
malaria and a recent treatment with Mefloquin within the last 63 days all other anti-malarial drugs and antibiotics within the last 14 days.All P. falciparum malaria patients were treated with Artesunate and Mefloquine, the
standard therapy in Thailand, after confirmation of the diagnosis and blood samplingfor the in-vitro test.Before a blood sample was taken, an oral informed consent was required from the
patients, including epidemiological data such as sex, age, nationality, occupation, placeof residence, origin of infection and the registration number of the Mae Sot MalariaClinic.
4.2.2 Epidemiology
During the period of the study in Mae Sot 36 patients were tested positive with P.falciparum malaria. Out of this group 29 patients could be included in the study. Outof this 29, 9 where female with an average age of 29,68 years. The remaining 20 malepatients had an average age of 30,74 years.
18 out of the 29 patients in the study had their residence in Thailand (3 female and15 male), the other 11 (6 female and 5 male) lived in Myanmar.
Out of the 29 patients from the study, only 13 got their infection in Thailand, while
40

4.2 Patients
the remaining 16 got infected in Myanmar. This might be due to the poor health systemin Myanmar.
The most common occupation of the patients with P. falciparum malaria was farmerwith 15 individuals, followed by 5 labourers (mainly woodcutters) and 5 workers. Thesefindings are not uncommon since people with outdoor activities are more exposed tomosquitoes.
41

4 Methods and Material
4.3 Substances tested
In the study Artemisinin (explained in 4.3.1) and extracts from E. longifolia (explainedin 4.3.2) were tested. Also combinations of Artemisinin and extracts from E. longifoliawere tested to prove an interaction.
4.3.1 Artemisinin
Figure 4.2: Artemisinin( Source: http://www.york.ac.uk/org/cnap/artemisiaproject/images/artemsinin.gif)
Artemisinin, (structure shown in Fig. 4.2), was iso-lated from Chinese scientists in 1971 from the leaves ofArtemisia annua. The indigenous plant, which growsthroughout China, is locally called Qinghao and is in useas herbal medicine since more than 2000 years. (Werns-dorfer and Trigg, 1988)Artemisinin is a very stable sespquiterpene lactone
and almost insoluble in water, only sparingly soluble inoils, but dissolve in ethyl alcohol and dimethyl sulfoxide(DMSO). Because of the poor solubility of the parent com-
pound, Artemisinin, some halve synthetic derivatives like artemether, artesunate, ar-teether, dihydroartemisinin and artelinic acid were metabolized. All of them are verypotent and rapid acting blood schizontocides and can be administrated in many differ-ent ways, i.e. oral, intramuscular, intravenous and even rectal. (Krishna et al., 2004;Meshnick et al., 1996)There is no difference of bioactivity between Artemisinin and its derivatives, because
all are rapidly metabolized to di-hydroartemisinin (DHA) with a short half-live (Werns-dorfer and Wernsdorfer, 1991).In P. falciparum Artemisinin and its derivatives are active against the broadest age
range of the parasites, from tiny rings that have just invaded erythrocytes, up to maturetrophozoites and even schizonts. Which also impacts the mosquito transmission. Butthey do not work against hepatic stages, therefore no prophylactic potential. Apartfrom P. falciparum they are killing all human pathogen Plasmodium species. (Woodrowet al., 2005)The Artemisinins act faster than all other types of antimalarial, thus it is recommended
by the World Health Organization (WHO) in oral Artemisinin combination therapy(ACT) as first line treatment for uncomplicated P. falciparum malaria. The combinationis necessary because Artemisinin and its derivatives have a very short half-life, so a
42
4.3 Substances tested
treatment for seven days would be required. In combination with a slow eliminationantimalarial the treatment can be shortened to three days. A benefit from the ACT is,that the partner compounds protect from resistance. (WHO, 2010b)
4.3.2 Extracts from Eurycoma longifolia
Figure 4.3: E. longi-folia
( Source:http://www.corenberg.com)
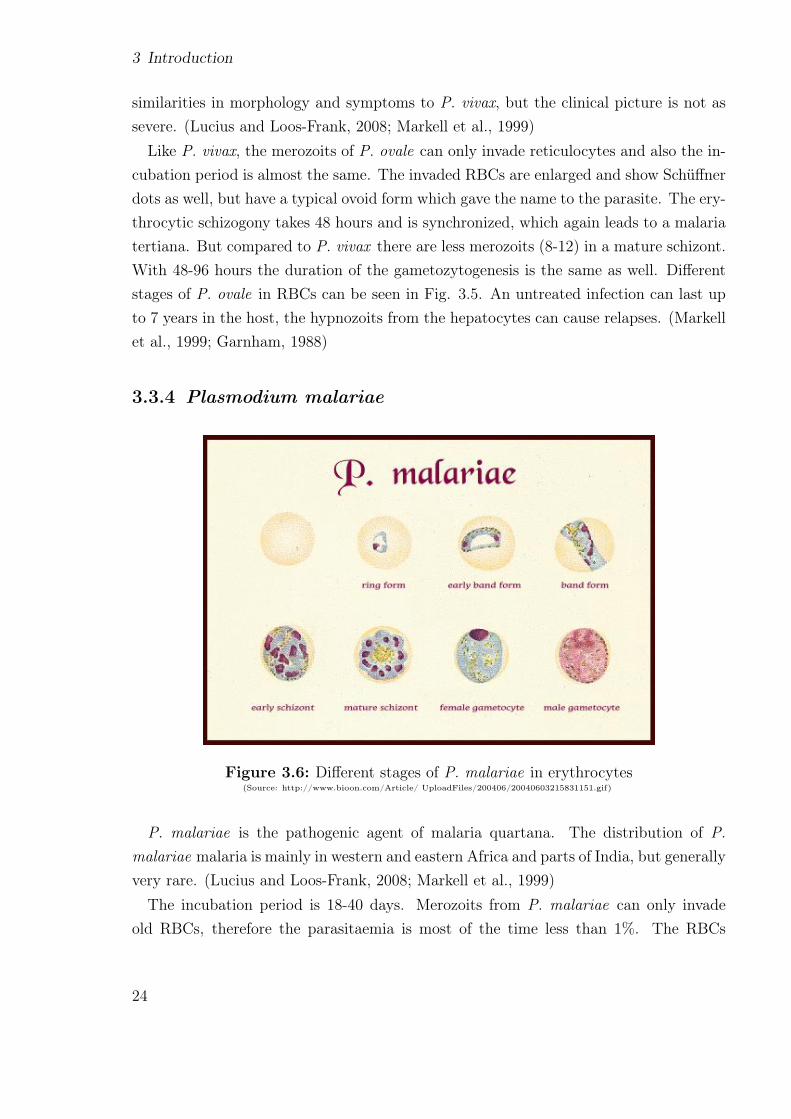
Eurycoma longifolia Jack is a plant in the family Simaroubaceae.It is an evergreen flowering tree, shown in Fig. 4.3 on the leftside, indigenous to the jungles of Malaysia and Indonesia. Inthe local traditional medicine several products, especially fromthe roots pictured in Fig. 4.3 on the right side, locally known asTongkat Ali or Pasak Bumi, are used as antipyretic, antimalarialand anabolic properties. (Wernsdorfer et al., 2009; Chan et al.,2004)
In the late 20th century many substances from E. longifo-lia Jack have been tested in different areas, for example theiranabolic properties (Muhamad et al., 2010) or their cytotoxicactivity against tumor cells (Zakaria et al., 2009; Tee and Azimahtol, 2005).
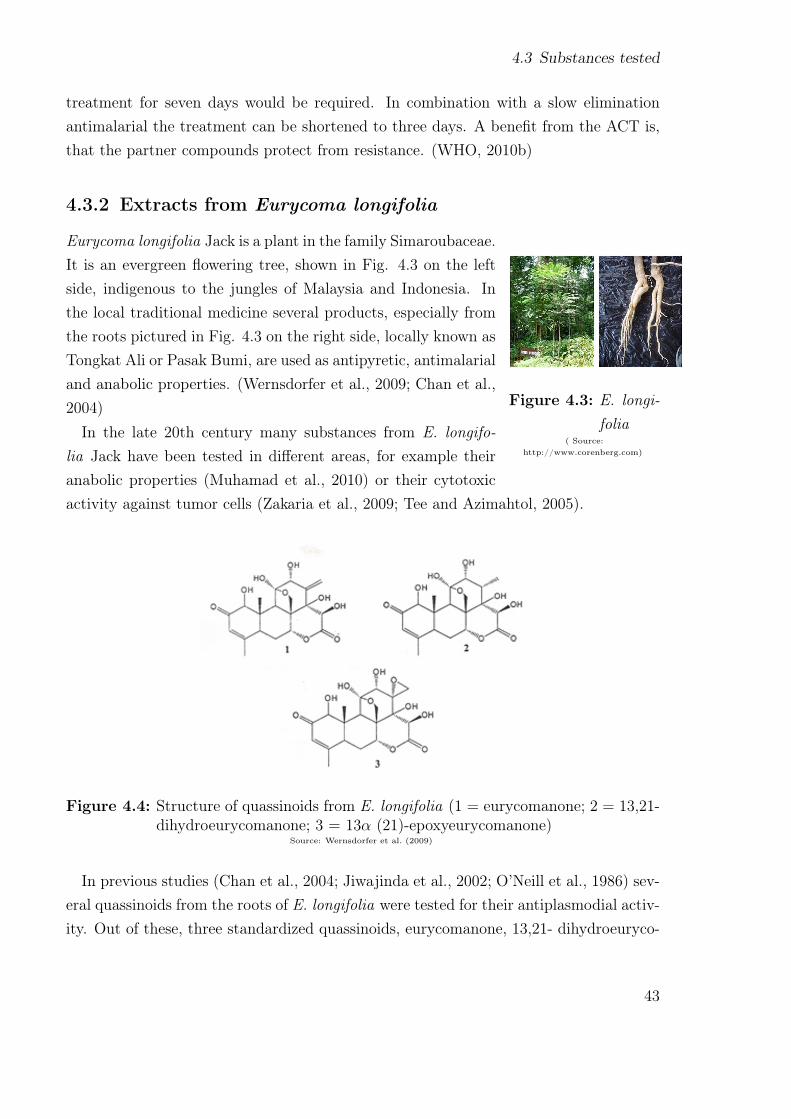
Figure 4.4: Structure of quassinoids from E. longifolia (1 = eurycomanone; 2 = 13,21-dihydroeurycomanone; 3 = 13α (21)-epoxyeurycomanone)
Source: Wernsdorfer et al. (2009)
In previous studies (Chan et al., 2004; Jiwajinda et al., 2002; O’Neill et al., 1986) sev-eral quassinoids from the roots of E. longifolia were tested for their antiplasmodial activ-ity. Out of these, three standardized quassinoids, eurycomanone, 13,21- dihydroeuryco-
43
4 Methods and Material
manone and 12α(21)-epoxyeurycomanone (structure shown in Fig. 4.4) were isolated atthe University Sains Malaysia by Professor Kit Lam Chan and provided for our study.The E. longifolia extracts where tested as followed:
1. Eury 1: eurycomanon (80%)
2. Eury 2: eurycomanon (80%) + 13,21- dihydroeurycomanone (4,9%)
3. Eury 3: eurycomanon (76%) + 13,21-dihydroeurycomanone (4,3%) + 12α (21)-epoxyeurycomanone (2,3%)
4.4 In vitro test system
The examinations are based on the WHO standard in vitro micro-test Mark III for thedetermination of drug sensitivity in P. falciparum . This test provides information aboutsensitivity and drug response by measuring the inhibition of schizont maturation in freshblood isolates of P. falciparum . (WHO, 2001)The pre-dosed test plates were prepared at the Institute of Specific Prophylaxis and
Tropical Medicine, Medical University of Vienna.
For the test, the RPMI 1640 LPLF-Medium is prepared with sodium bicarbonateand Gentamycine, distributed in sterile plastic tubes à 900µl and stored at 4℃. Afterdisinfecting the puncture site (finger tip or earlobe) with an alcohol swap and dryingup, 100µl blood are taken in a sterile heparinized capillary tube, diluted into the serialnumber labeled plastic tube with the medium and gently agitated (n.b. this amount(1 ml) of blood-medium-mixture (BMM) is sufficient for two test columns). The BMMcan be kept up to 4 hours in the incubator at nearly 37℃. For longer storage the BMMneeds to be cooled down at 4℃, either in the refrigerator or on wet ice, without directcontact to the tube. (WHO, 2001)At the same time a thick blood film is prepared to determine the initial parasitaemia
of the patient to control the including criteria. This pre-incubation slides are read forthe number of asexual parasites per at least 200 leukocytes and calculated with thefollowing formula:
Parasites/µl = Number of parasites counted x 8000number of leukozytes counted
(WHO, 1991)
44

4.4 In vitro test system
Table 4.1: Micro titre plate and concentrations of the substances used in the study
A B C D E F G H
Eury 1 0 3 nM 10 nM 30 nM 100 nM 300 nM 1000 nM 3000 nM
Eury 2 0 3 nM 10 nM 30 nM 100 nM 300 nM 1000 nM 3000 nM
Eury 3 0 3 nM 10 nM 30 nM 100 nM 300 nM 1000 nM 3000 nM
Art 0 3 nM 10 nM 30 nM 100 nM 300 nM 1000 nM 3000 nM
Art+Eury1 0 3 nM 10 nM 30 nM 100 nM 300 nM 1000 nM 3000 nM
Art+Eury2 0 3 nM 10 nM 30 nM 100 nM 300 nM 1000 nM 3000 nM
Art+Eury3 0 3 nM 10 nM 30 nM 100 nM 300 nM 1000 nM 3000 nM
For the test the appropriate drugs are dosed on sterile micro titre plates with 12columns of 8 wells each, sealed with a transparent sheet and labeled with the containingdrug. The wells B to H are filled with increasing concentrations of the substances to betested, well A is as a control free of drugs. An illustration of a micro titre plate is shownin table 4.1.
50µl aliquots of the BMM are added to well A-H of the scheduled test plates, beginningby well A to prevent contamination. The dosed plates are closed with a sterile lid andgently agitated in order to dissolve the drugs. The patients number, date and time ofinoculation are inscribed on the lid. After that, the plates are placed in a candle jar(desiccator), containing a small container of water. The candle jar is sealed airtight,after the candle exhaust it is put in the incubator at 37,5℃ for 24 to 26 hours. (WHO,2001; Wernsdorfer and Wernsdorfer, 1995)
After incubation the test plates are removed from the candle jar and ‘harvested’ bydischarging the medium supernatant and preparing thick films from the sediments onmicroscopy slides. Each test column is placed in a set order of eight thick films on oneslide, starting from well H up to well A. Each slide is labeled with patient number,substance and date of test. (WHO, 2001)
The slides are then dried at least 24 hours. After drying they are stained with Giemsasolution at pH 6,8 for 90 minutes. (Wernsdorfer and Wernsdorfer, 1995)
45

4 Methods and Material
4.5 Evaluation and statistical analysis
The reading of the thick blood films is done by a light optical microscope with x10 pairedoculars and x100 oil immersion objective (WHO, 1991).In the evaluation, beginning with well A (control), the number of schizonts (≥ 3
chromatin dots) are counted against other asexual forms to a total of 200 parasites.The slide is classified as valid, if the control shows either ≥ 20 schizonts in total or≥ 10% schizonts of all asexual parasites in the count. Are these criteria fulfilled, thereading can proceed with well B to H. Usually the number of schizonts decreases withthe increase of substanceconcentration, up to the point of total inhibition. The so-calledcut-off point or cut-off concentration gives a rough indication of the parasite sensitivityto the testsubstance. (Wernsdorfer and Wernsdorfer, 1995)
The statistical evaluation is done by the classic method of Litchfield and Wilcoxon(1949), based on the assumption of a log-normal distribution of drug resistance in allparasite populations with no recent drug contact. The drug concentrations are trans-formed into logarithms and the inhibition in % in probits. For the calculation of theindividual effective drug concentration (EC50, 90, 99), the % inhibition of schizont mat-uration at given drug concentration (SMI%) and regression parameters, a computermodel of Wernsdorfer and Wernsdorfer (1995) is used. With the EC50, EC90 and EC99
of the individual samples the correlation coefficient between two substances is calcu-lated. The interaction analysis, where the sensitivity of the individual substances arecompared with the sensitivity of combinations is done with the Variance analysis (Sokaland F. James Rohlf, 1995) with the following formula:
t= x1 −x2√(V 1+V 2) · 1/n
The term t is the probability that the difference is merely due to chance. x1 and x2
denote the difference of the incidences, n is the number of cases incorporated in theanalysis and V1 as well as V2 the variances between the two sets of figures.
46

5 Results
The following tables and figures of the results are listed in a certain orderbeginning with the % inhibition of schizont maturation (SMI%). This relative SMI%
shows the maturation inhibition of schizonts with increasing drug concentration com-pared with the control well A and gives information about the relative activity of thetested substances.
The next table shows the regression parameters. Important in this table are thecorrelation of regression (r) and the function out of it the heterogeneity (χ2), as wellas the slope function (S). According to Litchfield and Wilcoxon (1949) a steep slopefunction (S <2) shows a full activity in a narrow concentration-range, whereas a flatslope function ( S >8) could be a sign for decreasing sensitivity.
In the following tables are the calculated mean effective drug concentrations (EC) andthe 95% confidence interval.
After that the regression analysis as well as the effective doses are presented graphi-cally.
47

5 Results
5.1 Activity of tested drugs
A cut-off concentration could not be calculated for any of the tested substances.
5.1.1 Activity of Artemisinin
Out of the 36 isolates, 29 (80,5%) have an adequate maturation of schizonts (more than10% schizonts in well A).The arithmetic mean schizont concentration in well A per 200 asexual parasites was
53,58%
The relative schizont maturation inhibition (SMI%) for Artemisinin at the concentra-tion 3nmol/l is 20,31% increases constantly up to the concentration 3000nmol/l with92,32% (shown in Tab. 5.1), but never reaches 100% the total maturation inhibition.
Table 5.1: Drug concentration (Artemisinin) and SMI%
Drug conc. SMI%
3,0 20,31
10,0 35,22
30,0 55,35
100,0 68,63
300,0 80,26
1000,0 87,63
3000,0 92,32
48

5.1 Activity of tested drugs
Table 5.2: Regression parameters of Artemisinin*
n = 29 S = 19,4581 fs = 2,7147
a = 3,8853 A = 4,0674 fEC-50 = 1,9794
b = 0,3350 K = 7 fEC-90 = 4,3358
r = 0,9942 N’ = 145 fEC-95 = 5,9518
χ2 = 0,6576 R = 1000 fEC-99 = 11,5216*According to Litchfield and Wilcoxon (1949): n=number of isolates, a=intercept of regression, b=slope of regression, r=correlation of
regression, χ2=heterogeneity, S=slope function, A=intermediate term for fs, K=number of drug concentration, N’= number of data pointsEC16 to EC84, R=highest/lowest drug concentration tested, fs=factor of S, fEC=multiplication/division factor for obtaining 95%
confidence intervals of EC
Table 5.3: EC values: Artemisinin
EC Mean 95% Confidence Intervals
Lower Higher
EC1 0,0269 0,0023 0,3098
EC16 1,4317 0,7233 2,8340
EC50 27,8586 14,0741 55,1441
EC84 542,0753 273,8548 1072,9980
EC90 1277,0471 294,5380 5536,9748
EC95 3776,8250 634,5657 22479,0063
EC99 28865,3737 2505,3266 332575,3264
The regression analysis of the inhibition of schizont maturation through Artemisininis also represented graphically in Fig. 5.1, as well as the effective dose in Fig. 5.2.
49

5 Results
Figure 5.1: Regression analysis of Artemisinin
50

5.1 Activity of tested drugs
Figure 5.2: Effective doses of Artemisinin
51

5 Results
5.1.2 Activity of Eury 1
Out of the 36 isolates, 29 (80,5%) have an adequate maturation of schizonts (more than10% schizonts in well A).
The arithmetic mean schizont concentration in well A per 200 asexual parasites was40,27%
The relative schizont maturation inhibition (SMI%) for Eury 1 at the concentration3nmol/l is 14,71% and increases constantly up to the concentration 3000nmol/l with81,05% (shown in Ta. 5.4), but never reaches 100% the total maturation inhibition.
Table 5.4: Drug concentration (Eury 1) and SMI%
Drug conc. SMI%
3,0 14,71
10,0 28,53
30,0 38,97
100,0 45,00
300,0 60,75
1000,0 71,55
3000,0 81,05
52

5.1 Activity of tested drugs
Table 5.5: Regression parameters of Eury 1*
n = 29 S = 41,6637 fs = 3,7908
a = 3,7384 A = 9,1621 fEC-50 = 2,0649
b = 0,2666 K = 7 fEC-90 = 6,5403
r = 0,9948 N’ = 203 fEC-95 = 10,1272
χ2 = 0,4504 R = 1000 fEC-99 = 24,8886*According to Litchfield and Wilcoxon (1949): n=number of isolates, a=intercept of regression, b=slope of regression, r=correlation of
regression, χ2=heterogeneity, S=slope function, A=intermediate term for fs, K=number of drug concentration, N’= number of data pointsEC16 to EC84, R=highest/lowest drug concentration tested, fs=factor of S, fEC=multiplication/division factor for obtaining 95%
confidence intervals of EC
Table 5.6: EC values: Eury 1
EC Mean 95% Confidence Intervals
Lower Higher
EC1 0,0184 0,0007 0,4592
EC16 2,7233 1,3188 5,6234
EC50 113,4614 54,9467 234,2906
EC84 4727,2259 2289,2838 9761,4216
EC90 13874,2892 2121,3590 90741,7865
EC95 54190,5172 5350,9626 548800,7233
EC99 697799,1449 28036,9133 17367234,4752
The regression analysis of the inhibition of schizont maturation through Eury 1 is alsorepresented graphically in Fig. 5.3, as well as the effective dose in Fig. 5.4.
53

5 Results
Figure 5.3: Regression analysis of E. longifolia 1 extract
54

5.1 Activity of tested drugs
Figure 5.4: Effective doses of E. longifolia 1 extract
55

5 Results
5.1.3 Activity of Eury 2
Out of the 36 isolates, 29 (80,5%) have an adequate maturation of schizonts (more than10% schizonts in well A).
The arithmetic mean schizont concentration in well A per 200 asexual parasites was43,10%
The relative schizont maturation inhibition (SMI%) for Eury 2 at the concentration3nmol/l is 14,47% and increases constantly up to the concentration 3000nmol/l with82,02% (shown in Tab. 5.7), but never reaches 100% the total maturation inhibition.
Table 5.7: Drug concentration (Eury 2) and SMI%
Drug conc. SMI%
3,0 14,47
10,0 24,43
30,0 38,20
100,0 50,33
300,0 66,68
1000,0 75,63
3000,0 82,02
56

5.1 Activity of tested drugs
Table 5.8: Regression parameters of Eury 2*
n = 29 S = 30,0079 fs = 3,7116
a = 3,6628 A = 6,3117 fEC-50 = 2,1868
b = 0,2924 K = 7 fEC-90 = 6,5266
r = 0,9964 N’ = 145 fEC-95 = 9,9845
χ2 = 0,3539 R = 1000 fEC-99 = 24,0399*According to Litchfield and Wilcoxon (1949): n=number of isolates, a=intercept of regression, b=slope of regression, r=correlation of
regression, χ2=heterogeneity, S=slope function, A=intermediate term for fs, K=number of drug concentration, N’= number of data pointsEC16 to EC84, R=highest/lowest drug concentration tested, fs=factor of S, fEC=multiplication/division factor for obtaining 95%
confidence intervals of EC
Table 5.9: EC values: Eury 2
EC Mean 95% Confidence Intervals
Lower Higher
EC1 0,0340 0,0014 0,8162
EC16 3,2294 1,4767 7,0621
EC50 96,9067 44,3135 211,9197
EC84 2907,9698 1329,7575 6359,2711
EC90 7763,3631 1189,5007 50668,1559
EC95 26896,6276 2693,8322 268549,9745
EC99 276600,7487 11505,9012 6649455,1797
The regression analysis of the inhibition of schizont maturation through Eury 2 is alsorepresented graphically in Fig. 5.5, as well as the effective dose in Fig. 5.6.
57

5 Results
Figure 5.5: Regression analysis of E. longifolia 2 extract
58

5.1 Activity of tested drugs
Figure 5.6: Effective doses of E. longifolia 2 extract
59

5 Results
5.1.4 Activity of Eury 3
Out of the 36 isolates, 29 (80,5%) have an adequate maturation of schizonts (more than10% schizonts in well A).
The arithmetic mean schizont concentration in well A per 200 asexual parasites was40,48%.
The relative schizont maturation inhibition (SMI%) for Eury 3 at the concentration3nmol/l is 12,38% and increases constantly up to the concentration 3000nmol/l with85,31% (shown in Tab. 5.10), but never reaches 100% the total maturation inhibition.
Table 5.10: Drug concentration (Eury 3) and SMI%
Drug conc. SMI%
3,0 12,38
10,0 23,92
30,0 34,17
100,0 44,86
300,0 67,12
1000,0 78,23
3000,0 85,31
60

5.1 Activity of tested drugs
Table 5.11: Regression parameters of Eury 3*
n = 29 S = 21,4589 fs = 2,9027
a = 3,4988 A = 4,4685 fEC-50 = 2,0245
b = 0,3243 K = 7 fEC-90 = 4,7329
r = 0,9958 N’ = 145 fEC-95 = 6,6492
χ2 = 0,5121 R = 1000 fEC-99 = 13,4864*According to Litchfield and Wilcoxon (1949): n=number of isolates, a=intercept of regression, b=slope of regression, r=correlation of
regression, χ2=heterogeneity, S=slope function, A=intermediate term for fs, K=number of drug concentration, N’= number of data pointsEC16 to EC84, R=highest/lowest drug concentration tested, fs=factor of S, fEC=multiplication/division factor for obtaining 95%
confidence intervals of EC
Table 5.12: EC values: Eury 3
EC Mean 95% Confidence Intervals
Lower Higher
EC1 0,0786 0,0058 1,0597
EC16 4,7701 2,3562 9,6570
EC50 102,3605 50,5609 207,2288
EC84 2196,5473 1084,9825 4446,9105
EC90 5323,0386 1124,6793 25193,6182
EC95 16315,8003 2453,8079 108486,6247
EC99 133347,3393 9887,5680 1798370,7250
The regression analysis of the inhibition of schizont maturation through Eury 3 is alsorepresented graphically in Fig. 5.7, as well as the effective dose in Fig. 5.8.
61

5 Results
Figure 5.7: Regression analysis of E. longifolia 3 extract
62

5.1 Activity of tested drugs
Figure 5.8: Effective doses of E. longifolia 3 extract
63
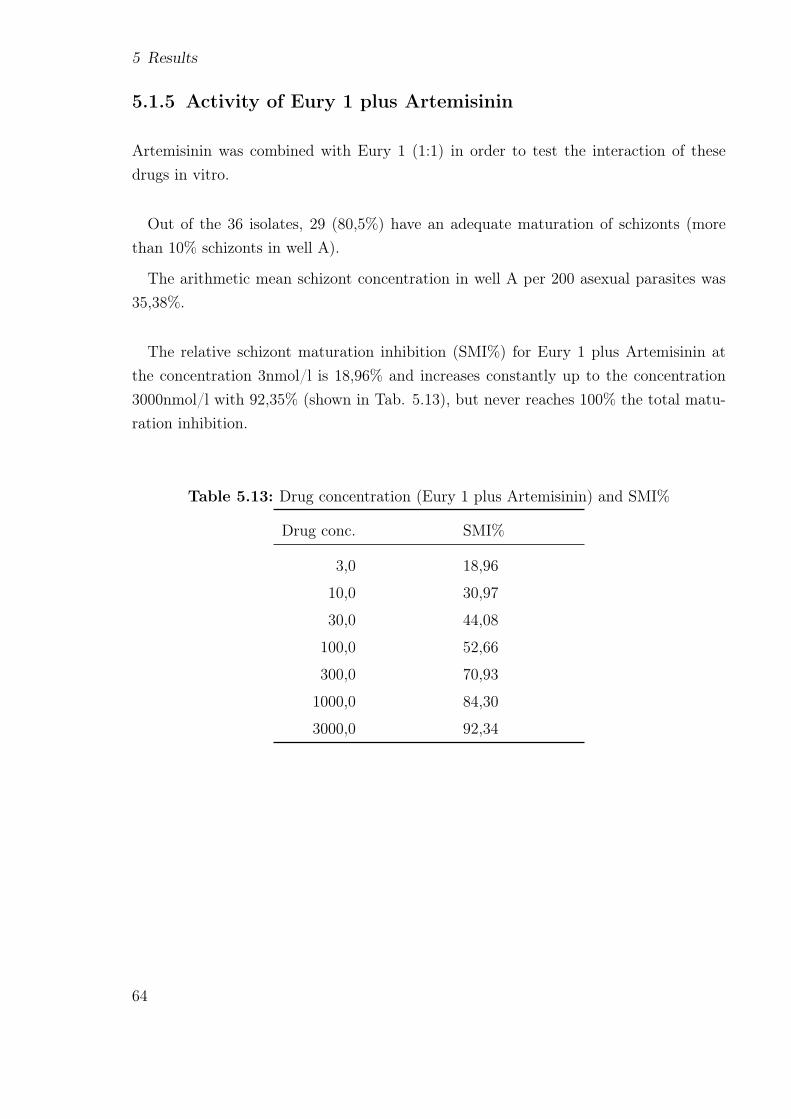
5 Results
5.1.5 Activity of Eury 1 plus Artemisinin
Artemisinin was combined with Eury 1 (1:1) in order to test the interaction of thesedrugs in vitro.
Out of the 36 isolates, 29 (80,5%) have an adequate maturation of schizonts (morethan 10% schizonts in well A).
The arithmetic mean schizont concentration in well A per 200 asexual parasites was35,38%.
The relative schizont maturation inhibition (SMI%) for Eury 1 plus Artemisinin atthe concentration 3nmol/l is 18,96% and increases constantly up to the concentration3000nmol/l with 92,35% (shown in Tab. 5.13), but never reaches 100% the total matu-ration inhibition.
Table 5.13: Drug concentration (Eury 1 plus Artemisinin) and SMI%
Drug conc. SMI%
3,0 18,96
10,0 30,97
30,0 44,08
100,0 52,66
300,0 70,93
1000,0 84,30
3000,0 92,34
64

5.1 Activity of tested drugs
Table 5.14: Regression parameters of Eury 1 plus Artemisinin*
n = 29 S = 21,3587 fs = 2,6375
a = 3,7245 A = 4,4482 fEC-50 = 1,9020
b = 0,3248 K = 7 fEC-90 = 4,1174
r = 0,9948 N’ = 174 fEC-95 = 5,6098
χ2 = 0,6092 R = 1000 fEC-99 = 10,6762*According to Litchfield and Wilcoxon (1949): n=number of isolates, a=intercept of regression, b=slope of regression, r=correlation of
regression, χ2=heterogeneity, S=slope function, A=intermediate term for fs, K=number of drug concentration, N’= number of data pointsEC16 to EC84, R=highest/lowest drug concentration tested, fs=factor of S, fEC=multiplication/division factor for obtaining 95%
confidence intervals of EC
Table 5.15: EC values: Eury 1 plus Artemisinin
EC Mean 95% Confidence Intervals
Lower Higher
EC1 0,0394 0,0037 0,4203
EC16 2,3749 1,2486 4,5169
EC50 50,7239 26,6693 96,4749
EC84 1083,3973 569,6211 2060,5798
EC90 2621,9225 636,7947 10795,4374
EC95 8022,7988 1430,1383 45006,3466
EC99 65359,5184 6121,9852 697791,0812
The regression analysis of the inhibition of schizont maturation through Eury 1 plusArtemisinin is also represented graphically in Fig. 5.9, as well as the effective dose inFig. 5.10.
65

5 Results
Figure 5.9: Regression analysis of Artemisinin plus E. longifolia 1 extract
66

5.1 Activity of tested drugs
Figure 5.10: Effective doses of Artemisinin plus E. longifolia 1 extract
67

5 Results
5.1.6 Activity of Eury 2 plus Artemisinin
Artemisinin was combined with Eury 2 (1:1) in order to test the interaction of thesedrugs in vitro.
Out of the 36 isolates, 29 (80,5%) have an adequate maturation of schizonts (morethan 10% schizonts in well A).
The arithmetic mean schizont concentration in well A per 200 asexual parasites was34,66%.
The relative schizont maturation inhibition (SMI%) for Eury 1 plus Artemisinin atthe concentration 3nmol/l is 18,28% and increases constantly up to the concentration3000nmol/l with 90,90% (shown in Tab. 5.16), but never reaches 100% the total matu-ration inhibition.
Table 5.16: Drug concentration (Eury 2 plus Artemisinin) and SMI%
Drug conc. SMI%
3,0 18,28
10,0 33,58
30,0 48,80
100,0 65,48
300,0 79,03
1000,0 85,48
3000,0 90,90
68

5.1 Activity of tested drugs
Table 5.17: Regression parameters of Eury 2 plus Artemisinin*
n = 29 S = 19,9536 fs = 2,7612
a = 3,8091 A = 4,1657 fEC-50 = 1,9909
b = 0,3322 K = 7 fEC-90 = 4,4333
r = 0,9951 N’ = 145 fEC-95 = 6,1216
χ2 = 0,5378 R = 1000 fEC-99 = 11,9915*According to Litchfield and Wilcoxon (1949): n=number of isolates, a=intercept of regression, b=slope of regression, r=correlation of
regression, χ2=heterogeneity, S=slope function, A=intermediate term for fs, K=number of drug concentration, N’= number of data pointsEC16 to EC84, R=highest/lowest drug concentration tested, fs=factor of S, fEC=multiplication/division factor for obtaining 95%
confidence intervals of EC
Table 5.18: EC values: Eury 2 plus Artemisinin
EC Mean 95% Confidence Intervals
Lower Higher
EC1 0,0328 0,0027 0,3932
EC16 1,8059 0,9071 3,5954
EC50 36,0345 18,0995 71,7415
EC84 719,0197 361,1511 1431,5041
EC90 1706,2443 384,8663 7564,3674
EC95 5092,7366 831,9261 31175,8037
EC99 39599,0921 3302,2740 474850,9971
The regression analysis of the inhibition of schizont maturation through Eury 2 plusArtemisinin is also represented graphically in Fig. 5.11, as well as the effective dose inFig. 5.12.
69

5 Results
Figure 5.11: Regression analysis of Artemisinin plus E. longifolia 2 extract
70

5.1 Activity of tested drugs
Figure 5.12: Effective doses of Artemisinin plus E. longifolia 2 extract
71

5 Results
5.1.7 Activity of Eury 3 plus Artemisinin
Artemisinin was combined with Eury 3 (1:1) in order to test the interaction of thesedrugs in vitro.
Out of the 36 isolates, 29 (80,5%) have an adequate maturation of schizonts (morethan 10% schizonts in well A).
The arithmetic mean schizont concentration in well A per 200 asexual parasites was37,79%.
The relative schizont maturation inhibition (SMI%) for Eury 1 plus Artemisinin atthe concentration 3nmol/l is 18,69% and increases constantly up to the concentration3000nmol/l with 93,03% (shown in Tab. 5.19), but never reaches 100% the total matu-ration inhibition.
Table 5.19: Drug concentration (Eury 3 plus Artemisinin) and SMI%
Drug conc. SMI%
3,0 18,69
10,0 34,08
30,0 48,78
100,0 60,37
300,0 79,68
1000,0 87,84
3000,0 93,03
72
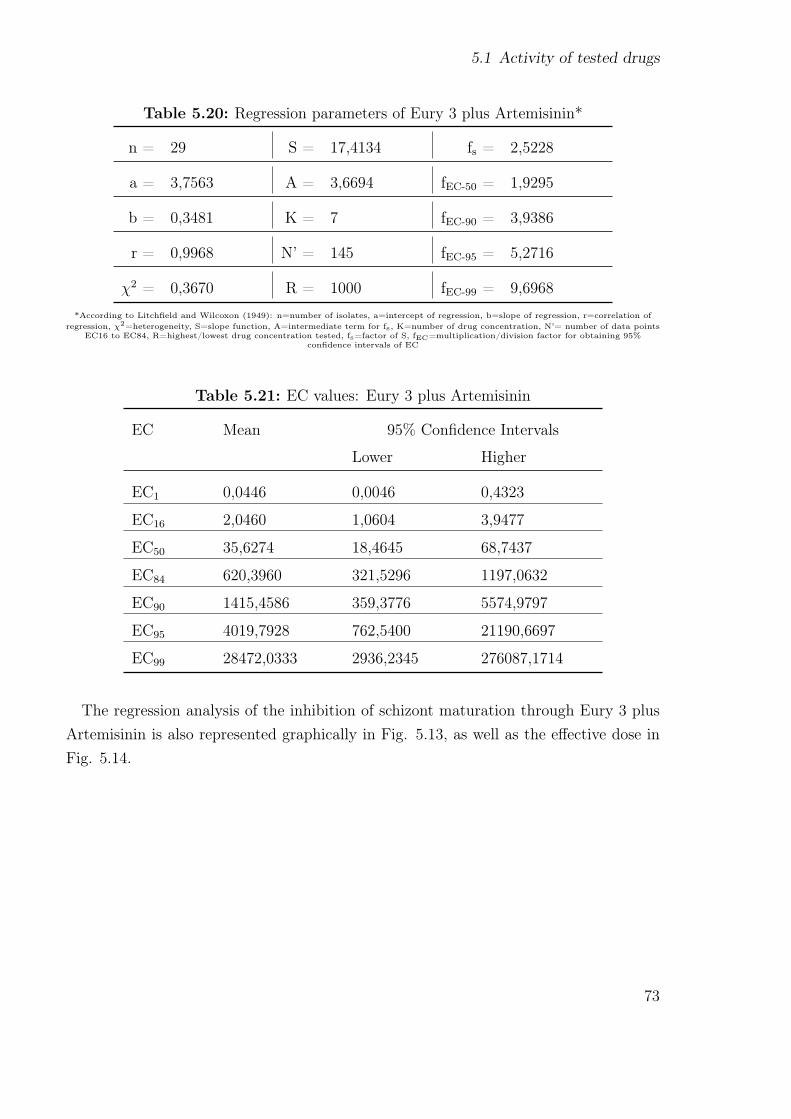
5.1 Activity of tested drugs
Table 5.20: Regression parameters of Eury 3 plus Artemisinin*
n = 29 S = 17,4134 fs = 2,5228
a = 3,7563 A = 3,6694 fEC-50 = 1,9295
b = 0,3481 K = 7 fEC-90 = 3,9386
r = 0,9968 N’ = 145 fEC-95 = 5,2716
χ2 = 0,3670 R = 1000 fEC-99 = 9,6968*According to Litchfield and Wilcoxon (1949): n=number of isolates, a=intercept of regression, b=slope of regression, r=correlation of
regression, χ2=heterogeneity, S=slope function, A=intermediate term for fs, K=number of drug concentration, N’= number of data pointsEC16 to EC84, R=highest/lowest drug concentration tested, fs=factor of S, fEC=multiplication/division factor for obtaining 95%
confidence intervals of EC
Table 5.21: EC values: Eury 3 plus Artemisinin
EC Mean 95% Confidence Intervals
Lower Higher
EC1 0,0446 0,0046 0,4323
EC16 2,0460 1,0604 3,9477
EC50 35,6274 18,4645 68,7437
EC84 620,3960 321,5296 1197,0632
EC90 1415,4586 359,3776 5574,9797
EC95 4019,7928 762,5400 21190,6697
EC99 28472,0333 2936,2345 276087,1714
The regression analysis of the inhibition of schizont maturation through Eury 3 plusArtemisinin is also represented graphically in Fig. 5.13, as well as the effective dose inFig. 5.14.
73

5 Results
Figure 5.13: Regression analysis of Artemisinin plus E. longifolia 3 extract
74

5.1 Activity of tested drugs
Figure 5.14: Effective doses of Artemisinin plus E. longifolia 3 extract
75


6 Discussion and Conclusion
6.1 Activity and Regression Analysis
6.1.1 Artemisinin
The evaluation of the activity of Artemisinin shows for the test isolates an EC50 of27,8586 nmol/l, an EC90 of 1277,0471 nmol/l and an EC99 of 28865,3737 nmol/l. Com-pared with data from 2009 (Kerschbaumer et al., 2010), shown in table 6.1, there is abig increase in these values. This leads to the assumption that there is a decrease ineffectiveness of Artemisinin in this area.
Table 6.1: Comparison of EC values 2009, 2010
Art 2009 2010
EC50 8,1181 27,8586
EC90 137,2319 1277,0471
EC99 1375,6520 28865,3737
The regression lines of Artemisinin from 2009 and 2010, shown in table 6.2 are com-pared for parallelism and activity differences. The slope ratio of the regression lines,shown in table 6.3 can be considered as parallel, since fSR >SR. Therefore the two couldbe compared for an efficacy difference, shown as well in table 6.3.
Table 6.2: Regression parameters of Artemisinin 2009/2010
Art S fs2009 8,9733 1,7836
2010 19,4581 2,7147S = slope function, fs = factor of S
77

6 Discussion and Conclusion
Table 6.3: Comparison of regression parameters Artemisinin 2009/2010
Art2009/2010
SR fSR Slope ofregres-sion
PR fPR
2,1684 3,1714 parallel
EC50 3,4321 2,3810 significant
EC90 9,3057 5,6588 significant
EC99 20,9830 17,2484 significantSR = slope ration, fSR = factor of SR, PR = potency ratio, fPR = factor of PR
The comparison of regression parameters confirm the assumption above that there isa loss of Artemisinin sensitivity between 2009 and 2010. In all three EC values (50, 90,99) the potency ratio (PR) >factor of PR (fPR) at the 95% confidence level.
6.2 Variance analysis of resulting data
6.2.1 Analysis for Interaction between Artemisinin and
Eurycoma 1, 2, 3 in P. falciparum
Variance analysis was applied since the mixture of Artemisinin and the parallel adminis-tered Eurycomanons 1 and 2 charges resulted in P. falciparum always in a significantlylower antiplasmodial activity as compared to freshly prepared 0,5 Artemisinin and Eury1 and 2 charges. This indicates that the Artemisinin+Eury charge prepared at the In-stitute of Specific Prophylaxis and Tropical Medicine, Medical University of Vienna haslost part of its activity due to long contact between Artemisinin and the Eurycomanonecharge. With regard to Eurycomanon 3 it was probably an incompatibility betweenArtemisinin and the Eurycomanon. At the same time, the comparison between the twoformulations indicated in freshly prepared Artemisinin-Eury-1 and Artemisinin-Eury-2synergism at the EC50 and EC90 in P. falciparum.
Eury-1 - Art at EC50
Result: 6,0993 −→ significant synergismDegree of Freedom 54 (=2,6908 at p=0,01)
78

6.2 Variance analysis of resulting data
Eury-2 - Art at EC50
Result: 19,0742 −→ significant synergismDegree of Freedom 56 (= 2,6952 at p=0,01)
Eury-3 - Art at EC50
Result: Inhibition under Eury-3 - Art higher than under separate compounds
Eury-1 - Art at EC90
Result: 11,3260 −→ significant synergismDegree of Freedom 58 (=2,6864 at p=0,01)
Eury-2 - Art at EC90
Result: 9,2170 −→ significant synergismDegree of Freedom 58 (=2,6952 at p=0,01)
Eury-3 - Art at EC90
Result: Inhibition under Eury-3 - Art higher than under separate compounds
In P. falciparum the isolates showed in Eury-1-Art and Eury-2-Art a significant syn-ergism, albeit at indices strongly reduced from the experience in P. vivax. This wasobviously due to the reduced activity of Artemisinin.Follow up on these observations it would be reasonable to investigate potential advan-
tages of Eurycomanones together with Artemisinin in areas with Artemisinin-sensitiveP. falciparum strains.
79


7 Annex
81

7 Annex
Tab
le7.1:
Patient
record
form
Mae
Sot20
10,P
.fa
lcip
arum
DATE
PAT.
NO.
PAT.
REG.
MC
SEX
AGE
OCCUPAT.
RESID
ENCE
COUN-
TRY
ORIG
INOF
IN-
FEC-
TIO
NCOUN-
TRY
NO.
DAYS
SYMPT.
BEFORE
SEEK.
TREATM.
COMMENTS
28.06.20
101
68M
22La
bour
Mya
nmar
Mya
nmar
2d.
Fever
28.06.20
102
71F
35Hou
sewife
Myanm
arMya
nmar
3d.
Fever
29.06.20
103
39M
26La
bour
Tha
iland
Tha
iland
2d.
Fever
30.06.20
104
91M
25Fa
rmer
Tha
iland
Tha
iland
9d.
Fever
30.06.20
105
93F
30Fa
rmer
Myanm
arMya
nmar
6d.
Fever
01.07.20
106
104
M23
Farm
erTha
iland
Tha
iland
1d.
Fever
02.07.20
107
116
F48
Farm
erMya
nmar
Myanm
ar4d.
Fever
02.07.20
108
120
F13
Stud
ent
Mya
nmar
Mya
nmar
3d.
Fever
02.07.20
109
126
F47
Farm
erMya
nmar
Myanm
ar2d.
Fever
02.07.20
1010
130
M18
Farm
erMya
nmar
Mya
nmar
2d.
Fever
06.07.20
1011
84M
16Worker
Tha
iland
Tha
iland
6d.
Fever
06.07.20
1012
171
M16
Farm
erTha
iland
Tha
iland
2d.
Fever
07.07.20
1013
177
M37
Farm
erTha
iland
Tha
iland
3d.
Fever
08.07.20
1014
191
M41
Farm
erTha
iland
Tha
iland
3d.
Fever
09.07.20
1015
212
M15
Stud
ent
Tha
iland
Tha
iland
1d.
Fever
12.07.20
1016
227
M25
Farm
erTha
iland
Tha
iland
3d.
Fever
82

Tab
le7.2:
Patient
record
form
Mae
Sot20
10,P
.fa
lcip
arum
DATE
PAT.
NO.
PAT.
REG.
MC
SEX
AGE
OCCUPAT.
RESID
ENCE
COUN-
TRY
ORIG
INOF
IN-
FEC-
TIO
NCOUN-
TRY
NO.
DAYS
SYMPT.
BEFORE
SEEK.
TREATM.
COMMENTS
14.07.20
1017
247
M11
Mon
kMya
nmar
Mya
nmar
2d.
Fever
veno
usbloo
d14
.07.20
1018
124
M57
Farm
erTha
iland
Tha
iland
5d.
Fever
14.07.20
1019
251
F42
Farm
erMyanm
arMya
nmar
2d.
Fever
15.07.20
1020
268
F18
Worker
Tha
iland
Mya
nmar
2d.
Fever
veno
usbloo
d15
.07.20
1021
269
M24
Worker
Tha
iland
Myanm
ar2d.
Fever
veno
usbloo
d16
.07.20
1022
272
F12
Stud
ent
Tha
iland
Myanm
ar1d.
Fever
19.07.20
1023
283
M47
Farm
erMya
nmar
Mya
nmar
14d.
Fever
19.07.20
1024
152
M45
Labo
urTha
iland
Mya
nmar
2d.
Fever
19.07.20
1025
157
F26
Worker
Tha
iland
Tha
iland
8d.
Fever
20.07.20
1026
163
M36
Labo
urTha
iland
Tha
iland
3d.
Fever
20.07.20
1027
165
M39
Farm
erMya
nmar
Mya
nmar
3d.
Fever
23.07.20
1028
31F
32Worker
Mya
nmar
Myanm
ar3d.
Fever
mixed
form
?28
.07.20
1029
49F
28Worker
Tha
iland
Mya
nmar
20d.
Fever
29.07.20
1030
62M
18La
bour
Mya
nmar
Mya
nmar
2d.
Fever
30.07.20
1031
56M
47La
bour
Tha
iland
Tha
iland
6d.
Fever
30.07.20
1032
76M
39Fa
rmer
Tha
iland
Tha
iland
3d.
Fever
83

7 Annex
Tab
le7.3:
Patient
record
form
Mae
Sot20
10,P
.fa
lcip
arum
DATE
PAT.
NO.
PAT.
REG.
MC
SEX
AGE
OCCUPAT.
RESID
ENCE
COUN-
TRY
ORIG
INOF
IN-
FEC-
TIO
NCOUN-
TRY
NO.
DAYS
SYMPT.
BEFORE
SEEK.
TREATM.
COMMENTS
03.08.20
1033
199
M39
Farm
erTha
iland
Myanm
ar7d.
Fever
veno
usbloo
d05
.08.20
1034
112
F38
Worker
Myanm
arMya
nmar
5d.
Fever
06.08.20
1035
136
M23
Farm
erTha
iland
Tha
iland
3d.
Fever
09.08.20
1036
147
M46
Labo
urTha
iland
Tha
iland
2d.
Fever
84

Table 7.4: Summary sheet Mae Sot 2010 P. falciparum
Isolate no. As Par / ţl % M+ troph Well A Schiz/200 Result Comments
1 14518 12 5 20 Valid WHW2 34225 20% 35 Valid Good3 8889 30% 32 Valid WHW4 9250 28% 61 Valid Good5 83429 59% 20 Valid WHW6 99999 35% 70 Valid Good7 69333 23% 75 Valid Good8 15059 10% washed out Invalid OUT9 29818 17% 20 Valid WHW10 44444 32% 97 Valid Good11 21053 15% 36 Valid Good12 17200 27% 20 Valid WHW13 1300 62% 23 Valid WHW14 19750 17% 3 Invalid OUT15 26233 20% 20 Valid WHW16 74812 15% 20 Valid WHW17 38400 35% 20 Valid WHW18 2576 40% 96 Valid Good19 9697 20% 53 Valid Good20 18963 25% <4 Invalid OUT21 2791 10% 20 Valid WHW22 87999 10% 28 Valid WHW23 26371 20% 44 Valid Good24 42250 25% 51 Valid Good25 6154 25% 47 Valid Good26 49846 30% 23 Valid Good27 61429 20% 40 Valid Good28 6323 25% 62 Valid WHW29 2196 30% 56 Valid WHW30 30737 15% <20 Invalid OUT31 17561 25% 20 Valid WHW32 22400 20% 57 Valid WHW33 9085 20% 59 Valid WHW34 2222 20% 63 Valid WHW35 32400 25% <20 Invalid OUT36 2727 25% 55 Valid GOOD
85

7 Annex
Table 7.5: Schizont count Pf 2010 Artemisinin
A B C D E F G H
PatNo
ControlSCHIZ
Conc.SCHIZ
Conc.SCHIZ
Conc.SCHIZ
Conc.SCHIZ
Conc.SCHIZ
Conc.SCHIZ
Conc.SCHIZ
0 3 10 30 100 300 1000 3000
1 100 70,37 51,85 33,33 25,93 14,81 7,41 3,72 100 82,5 25 17,5 5 2,5 0 03 100 100 86,21 74,14 36,31 17,24 Jan 00 5,174 100 81,25 75 39,58 43,75 25 25 2,085 100 89,29 80,36 16,07 3,57 1,79 0 06 100 93,65 93,65 93,65 57,14 34,92 26,98 15,877 100 81,25 81,25 18,75 10,42 4,17 2,08 09 100 70 27,5 17,5 10 7,5 5 2,510 100 85,11 65,96 29,79 34,04 23,4 19,15 19,1511 100 75,25 68,75 62,5 37,6 18,75 12,5 3,1312 100 76,75 58,14 48,84 39,54 23,26 13,95 4,6513 100 83,96 70,76 49,06 33,96 26,42 20,75 15,0915 100 59,09 36,36 27,27 22,73 13,64 9,09 016 100 67,74 45,16 25,81 9,68 3,23 0 017 100 71,88 51,56 32,81 21,88 18,75 15,63 12,518 100 94,83 67,24 37,93 24,14 15,52 10,34 3,4519 100 60 50 40 23,33 23,33 10 021 100 90 80 53,33 30 23,33 20 13,3322 100 100 100 72,33 52,78 22,22 8,33 2,7823 100 65,79 68,42 52,63 50 52,63 28,95 28,9524 100 62,07 48,28 31,03 20,69 17,24 17,24 23,7925 100 79,41 58,82 58,82 50 44,12 23,53 23,5327 100 78,57 60,71 35,71 10,71 3,57 0 028 100 80 66,67 46,67 33,33 16,67 6,67 029 100 76,36 58,18 38,18 25,54 9,09 3,64 031 100 76,32 57,89 39,47 26,32 18,42 13,16 7,8932 100 94,44 88,89 59,26 38,89 11,11 3,7 1,8533 100 94,74 89,47 76,32 65,79 13,16 2,63 036 100 70,37 66,67 66,67 66,67 66,67 44,44 33,33
86

Table 7.6: Schizont count Pf 2010 Eury-1
A B C D E F G H
PatNo
ControlSCHIZ
Conc.SCHIZ
Conc.SCHIZ
Conc.SCHIZ
Conc.SCHIZ
Conc.SCHIZ
Conc.SCHIZ
Conc.SCHIZ
0 3 10 30 100 300 1000 3000
1 100 85,72 71,43 61,9 52,38 42,86 33,33 9,522 100 93,33 62,22 60 42,22 40 13,33 6,673 100 102,78 102,78 66,57 41,67 25 13,89 5,564 100 103,45 84,49 77,59 70,69 65,52 55,17 55,175 100 80 64,44 60 53,33 15,56 4,44 2,226 100 81,4 84,88 81,4 79,07 75,59 72,09 16,287 100 68,25 53,96 38,09 34,92 23,81 22,22 3,179 100 81,82 63,64 63,64 63,64 18,18 4,55 010 100 80,3 80,3 63,64 68,18 50 36,36 9,0911 100 91,31 82,61 69,57 60,87 52,17 47,83 39,1312 100 91,43 62,86 48,57 31,43 25,71 20 14,2913 100 89,71 80,88 63,24 48,53 44,12 41,18 38,2415 100 62,86 40 25,71 17,14 11,43 8,57 5,7116 100 95 90 85 85 55 35 1517 100 97,87 96,76 72,34 66,32 44,68 36,17 31,9218 100 121,05 103,05 108,77 105,26 52,63 19,3 7,0219 100 64,29 42,86 28,57 28,57 14,29 10,71 7,1421 100 81,54 67,69 55,39 46,16 30,77 21,54 13,8522 100 83,05 67,8 57,63 50,85 20,34 8,47 3,3923 100 65 45 40 40 40 40 3524 100 92,59 86,19 77,78 70,37 66,67 44,44 44,4425 100 85 70 55 95 45 40 3527 100 100 100 100 80 64 12 028 100 86,21 75,86 62,07 48,28 31,03 17,24 6,929 100 71,43 51,43 48,57 45,72 42,86 42,86 37,1431 100 58,62 34,48 27,59 17,24 10,34 6,9 3,4532 100 81,58 65,79 57,9 52,83 36,84 26,32 15,7933 100 77,78 61,11 33,33 19,44 13,89 11,11 8,3336 100 100 80 80 80 80 80 80
87

7 Annex
Table 7.7: Schizont count Pf 2010 Eury-2
A B C D E F G H
PatNo
ControlSCHIZ
Conc.SCHIZ
Conc.SCHIZ
Conc.SCHIZ
Conc.SCHIZ
Conc.SCHIZ
Conc.SCHIZ
Conc.SCHIZ
0 3 10 30 100 300 1000 3000
1 100 70 50 35 25 15 10 02 100 82,86 85,72 58,57 48,57 32,86 32,86 203 100 100 100 64,29 42,86 43,86 42,86 28,574 100 100 97,78 97,78 95,55 66,67 46,67 31,115 100 77,09 60,42 50 41,67 16,67 6,25 2,086 100 100 89,59 70,84 52,09 38,54 20,83 7,297 100 73,17 56,1 56,1 56,1 9,76 4,88 4,889 100 85,71 71,43 66,66 57,14 47,62 42,86 38,110 100 96,72 93,45 92,81 42,62 8,2 3,29 1,6411 100 65 40 35 30 20 15 1012 100 69,23 46,15 46,15 42,31 42,31 42,31 38,4613 100 90,91 81,82 63,64 48,49 39,39 33,33 27,2715 100 84 68 60 52 32 20 816 100 90 85 70 55 30 15 517 100 97,56 92,68 68,29 48,78 34,15 21,95 12,218 100 84,62 69,23 53,65 42,31 34,62 19,23 11,5419 100 70 45 40 25 0 0 021 100 94,74 89,47 84,21 81,6 36,84 15,79 7,8922 100 100 100 77,5 60 27,5 12,5 523 100 100 100 95 95 90 85 8524 100 92 88 76 68 64 64 6425 100 75 60 50 45 40 30 2527 100 100 100 55,56 22,22 14,81 0 028 100 90,91 81,82 63,64 51,52 39,39 27,27 15,1529 100 66,67 45,1 41,18 39,22 33,33 29,41 25,4931 100 70 50 30 20 10 6,67 3,3332 100 97,5 92,5 70 52,5 35 22,5 12,533 100 97,73 93,18 61,36 40,91 18,18 9,09 4,5536 100 59,09 59,09 59,09 59,09 45,46 27,27 27,27
88

Table 7.8: Schizont count Pf 2010 Eury-3
A B C D E F G H
PatNo
ControlSCHIZ
Conc.SCHIZ
Conc.SCHIZ
Conc.SCHIZ
Conc.SCHIZ
Conc.SCHIZ
Conc.SCHIZ
Conc.SCHIZ
0 3 10 30 100 300 1000 3000
1 100 65,22 43,48 39,13 39,13 17,39 8,7 4,352 100 92,13 82,02 74,16 34,83 14,61 8,99 2,253 100 66,67 42,86 38,1 33,33 28,57 23,81 19,054 100 100 100 100 93,94 34,85 22,73 16,675 100 96,3 88,89 85,19 81,48 25,93 7,41 3,76 100 100 100 84,16 84,16 50,5 30,69 7,927 100 100 95 90 85 20 20 09 100 75 55 50 45 30 20 1010 100 96,55 72,41 60,34 50 3,45 0 011 100 66,67 43,33 30 20 13,33 10 6,6712 100 88,89 80,56 66,67 58,33 52,78 47,22 41,6713 100 88,71 77,42 59,68 46,77 35,48 24,19 17,7415 100 94,74 89,47 84,21 78,95 44,74 26,32 10,5316 100 89,29 78,57 46,43 28,57 17,86 10,71 3,5717 100 78,57 61,43 41,43 28,57 18,57 11,43 4,2918 100 100 100 102,94 102,94 102,94 32,35 32,3519 100 85,71 71,43 61,9 42,86 19,05 14,29 9,5221 100 64,44 41,11 32,22 25,56 16,67 10 6,6722 100 83,67 71,43 53,06 38,78 20,41 10. Jan 4,0823 100 100 100 100 85 80 80 8024 100 100 100 100 100 68,18 59,09 54,5525 100 85 70 45 40 40 40 2527 100 78,06 73,17 70,73 19,51 12,2 4,88 028 100 92,5 85 67,5 55 25 12,5 529 100 80 65 62,5 60 45 35 2530 100 92 80 52 32 16 8 432 100 85,37 73,17 65,85 58,54 34,15 19,51 7,3233 100 95,45 95,45 90,91 90,91 40,91 18,18 9,0936 100 100 70 55 40 25 15 15
89

7 Annex
Table 7.9: Schizont count Pf 2010 Eury-1-Art
A B C D E F G H
PatNo
ControlSCHIZ
Conc.SCHIZ
Conc.SCHIZ
Conc.SCHIZ
Conc.SCHIZ
Conc.SCHIZ
Conc.SCHIZ
Conc.SCHIZ
0 3 10 30 100 300 1000 3000
1 100 51,61 35,48 22,58 16,13 12,9 6,45 02 100 97,62 73,81 23,81 19,05 14,29 14,29 03 100 57,69 34,62 34,62 34,62 15,38 7,69 04 100 111,9 88,1 73,81 73,81 38,1 23,61 4,765 100 33,33 11,11 5,56 0 0 0 06 100 90,59 82,35 78,82 75,29 72,94 24,71 7,067 100 87,18 74,36 74,36 74,36 25,64 7,69 5,139 100 50 25 25 25 10 5 010 100 98,48 96,97 95,45 93,94 90,91 13,64 3,0311 100 89,66 79,31 51,72 51,72 27,59 20,69 13,7912 100 75,86 55,17 41,38 31,03 13,79 6,9 3,4513 100 97,37 94,74 92,11 89,47 44,74 23,68 5,2615 100 88,46 76,92 73,08 69,23 26,92 11,54 016 100 85,71 71,43 38,1 14,29 4,76 0 017 100 81,4 65,12 46,51 30,23 18,6 9,3 2,3318 100 83,72 93,02 79,07 60,47 34,88 4,65 019 100 85,71 76,19 71,43 71,43 66,67 61,9 23,8121 100 100 100 68,57 45,71 20 8,57 2,8622 100 58,18 34,55 25,45 16,36 5,45 1,82 023 100 90,48 80,95 66,67 57,14 35,71 35,71 35,7124 100 88 88 88 76 72 72 7225 100 80 64 64 52 48 36 2427 100 70,97 67,74 64,52 58,06 32,26 9,68 3,2328 100 67,65 47,06 44,12 41,18 14,71 5,88 029 100 86,67 76,67 56,67 40 16,67 6,67 031 100 96,3 88,89 66,67 44,44 18,52 7,41 032 100 90,63 68,75 56,25 46,88 18,75 6,25 3,1333 100 96,55 93,1 51,72 27,59 13,79 6,9 036 100 58,33 58,33 41,67 37,5 29,17 16,67 12,5
90

Table 7.10: Schizont count Pf 2010 Eury-2-Art
A B C D E F G H
PatNo
ControlSCHIZ
Conc.SCHIZ
Conc.SCHIZ
Conc.SCHIZ
Conc.SCHIZ
Conc.SCHIZ
Conc.SCHIZ
Conc.SCHIZ
0 3 10 30 100 300 1000 3000
1 100 68 44 36 32 16 8 42 100 93,1 89,66 48,28 41,38 37,93 27,59 3,453 100 80,95 66,67 38,1 23,81 14,29 9,52 4,784 100 92,86 88,1 69,05 50 38,1 14,29 2,385 100 72,41 37,93 10,34 0 0 0 06 100 81,05 74,74 68,42 42,11 30,53 24,21 2,117 100 71,43 66,67 45,24 7,14 4,76 4,76 2,119 100 77,27 59,09 31,82 18,18 13,64 9,09 4,5510 100 115,38 98,46 64,62 24,62 24,62 24,62 24,6211 100 100 100 100 50 30 20 2012 100 96,55 62,07 41,38 27,59 24,14 20,69 17,2413 100 66,67 26,19 19,05 11,9 4,76 0 015 100 84,62 69,23 42,31 26,92 19,23 11,54 016 100 68 48 36 24 8 0 017 100 75,61 56,1 43,9 34,15 19,51 9,76 4,8818 100 94,29 71,43 68,57 65,71 14,29 11,43 019 100 75 60,71 50 39,29 28,57 17,86 17,8621 100 97,22 91,67 86,11 83,33 25 8,33 2,7822 100 70 50 34 22 14 10 423 100 74,07 55,56 51,85 51,85 51,85 51,85 51,8524 100 88,24 73,53 61,76 55,88 44,12 44,12 44,1225 100 62,5 64,17 41,67 37,5 33,33 33,33 2527 100 80,65 80,65 67,74 19,35 9,68 0 028 100 78,79 60,61 48,48 39,39 15,15 6,06 029 100 78,95 63,18 52,63 42,11 15,79 5,26 031 100 71,43 50 32,14 21,43 14,29 7,14 032 100 57,58 33,33 30,3 27,27 12,12 6,06 3,0333 100 97,14 94,29 90 37,14 14,29 5,71 036 100 100 90 75 45 30 30 25
91

7 Annex
Table 7.11: Schizont count Pf 2010 Eury-3-Art
A B C D E F G H
PatNo
ControlSCHIZ
Conc.SCHIZ
Conc.SCHIZ
Conc.SCHIZ
Conc.SCHIZ
Conc.SCHIZ
Conc.SCHIZ
Conc.SCHIZ
0 3 10 30 100 300 1000 3000
1 100 86,96 78,26 69,57 60,87 21,74 8,7 02 100 87,23 65,96 40,43 12,77 10,64 6,38 03 100 34,09 11,36 9,09 4,55 4,55 4,55 2,274 100 94,12 94,12 85,29 41,18 29,41 8,82 05 100 53,33 30 16,67 10 6,67 0 06 100 100 84,04 63,83 50 22,34 20,21 9,577 100 79,31 62,07 50 15,52 5,17 3,45 3,459 100 91,3 86,96 39,13 17,39 8,7 0 010 100 73,42 54,43 40,51 30,38 12,66 7,59 7,5911 100 78,13 59,38 46,88 25 18,75 15,63 6,2512 100 104,17 108,33 95,83 83,33 25 8,33 4,1713 100 55,81 30,23 16,28 93,02 6,98 6,98 4,6515 100 75 58,33 36,11 22,22 13,89 8,33 016 100 83,33 66,67 33,33 16,67 12,5 8,33 4,1717 100 82,76 65,52 48,28 34,48 13,79 3,45 018 100 92,5 85 80 50 22,5 7,5 019 100 81,82 63,64 54,55 50 22,73 13,64 021 100 97,33 92 60 38,67 17,33 8 422 100 75,56 55,56 48,89 42,22 20 8,89 4,4423 100 96 92 84 80 76 68 6024 100 95,65 69,57 65,22 60,87 52,17 47,83 43,4825 100 76 56 48 44 28 16 827 100 93,33 86,67 76,67 56,67 40 16,67 16,6728 100 67,35 44,9 26,53 16,33 8,16 4,08 029 100 80 63,33 53,33 43,33 16,67 6,67 031 100 79,31 65,52 58,62 48,28 17,24 6,9 032 100 65,52 44,83 37,93 31,03 13,79 6,9 3,4533 100 82,76 68,97 48,28 34,48 13,79 6,9 036 100 96 68 52 36 28 24 20
92

Bibliography
Aikawa, M. (1988). W.H. Wernsdorfer and Sir I. McGregor: Malaria, Principles andPractice of Malariology, chapter Fine structure of malaria parasites in the variousstages of development, pages 97–129. Churchill Livingstone.
Bloland, P. B. (2001). Drug resistance in malaria. WHO World Health OrganizationDepartment of Communicable Disease Surveillance and Response.
Bruce-Chwatt, L. (1988). W.H. Wernsdorfer and Sir I. McGregor: Malaria, Principlesand Practice of Malariology, chapter History of malaria from prehistory to eradication,pages 1–59. Churchill Livingstone.
Chan, K.-L., Choo, C.-Y., Abdullah, N. R., and Ismail, Z. (2004). Antiplasmodial stud-ies of eurycoma longifolia jack using the lactate dehydrogenase assay of plasmodiumfalciparum. J Ethnopharmacol, 92(2-3):223–227.
Desjardins, R., Doberstyn, E., and Wernsdorfer, W. (1988). W.H. Wernsdorfer and SirI. McGregor: Malaria, Principles and Practice of Malariology, chapter The treatmentand prophylaxis of malaria, pages 827–864. Churchill Livingstone.
Fujioka, H. and Aikawa, M. (1999). Malaria Molecular and Clinical Aspects, chapterThe Malaria Parasite and its Life-cycle, pages 19–55. harwood academic publishers.
Garnham, P. (1988). W.H. Wernsdorfer and Sir I. McGregor:Malaria, Principles andPractice of Malariology, volume 1, chapter Malaria parsites of man: life-cycles andmorphology (excluding ultrastructure), pages 61–96. Churchill Livingstone.
Gilles, H. (1988). W.H. Wernsdorfer and Sir I. McGregor: Malaria, Principles andPractice of Malariology, chapter The differential diagnosis of malaria, pages 769–780.Churchill Livingstone.
Gramiccia, G. and Beales, P. (1988). W.H. Werndorfer and Sir I. McGregor: Malaria,Principles and Practice of Malariology, chapter The recent history of malaria controland eradication, pages 1335–1378. Churchill Livingstone.
Harinasuta, T. and Bunnag, D. (1988). W.H. Wernsdorfer and Sir I. McGregor:Malaria, Principles and Practice of Malariology, chapter The clinical features ofmalaria, pages 709–734. Churchill Livingstone.
Jiwajinda, S., Santisopasri, V., Murakami, A., Kawanaka, M., Kawanaka, H., Gasquet,M., Eilas, R., Balansard, G., and Ohigashi, H. (2002). In vitro anti-tumor promoting
93

Bibliography
and anti-parasitic activities of the quassinoids from eurycoma longifolia, a medicinalplant in southeast asia. Journal of Ethnopharmacology, 82:55–58.
Kerschbaumer, G., Wernsdorfer, G., Wiedermann, U., Congpuong, K., Sirichaisinthop,J., and Wernsdofer, W. H. (2010). Synergism between mefloquine and artemisininand its enhancement by retinol in plamodium falciparum in vitro. Wiener klinischeWochenschrift, 122/3:57–60.
Knauer, A., Sirichaisinthop, J., Reinthaler, F. F., Wiedermann, G., Wernsdorfer, G.,and Wernsdorfer, W. H. (2003). In-vitro response of plamodium falciparum to themain alkaloids of cinchoma. Wiener klinische Wochenschrift, 115-24:39–44.
Krishna, S., Uhlemann, A.-C., and Haynes, R. K. (2004). Artemisinins: mechanisms ofaction and potential for resistance. Drug Resistance Updates, 7:233–244.
Litchfield, J. and Wilcoxon, F. (1949). A simplified method for evaluation dose-effectexperiments. J Pharmacol Exp Ther, 96:99–113.
Lucius, R. and Loos-Frank, B. (2008). Biologie von Parasiten. Springer Verlag.
Mackintosh, C. L., Beeson, J. G., and Marsh, K. (2004). Clinical features and patho-genesis of severe malaria. Trends in Parasitology, 20 (12):597–603.
Markell, E., John, D., and Krotoski, W. (1999). Markell and Voge’s Medical Parasitology.W.B. Saunders Company.
Mendis, K., Sina, B., Marchensini, P., and Carter, R. (2001). The neglected burden ofplasmodium vivax malaria. Am. J. Rrop. Med. Hyg., 64 (1,2):97–106.
Meshnick, S., Taylor, T., and Kamchonwongpaisan, S. (1996). Artemisinin and theantimalarial endoperoxides: from herbal remedy to targeted chemotherapy. Microbi-ological Reviews, 60/2:301–315.
Muhamad, A. S., Keong, C. C., Kiew, O. F., Abdullah, M. R., and Lam, C. K. (2010). Ef-fects of eurycoma longifolia jack supplementation on recreational athletesŠ endurancerunning capacity and physiological responses in the heat. International Journal ofApplied Sports Sciences, 22/2:1–19.
Murray, C. K., Bell, D., Gasser, R. A., and Wongsrichanalai, C. (2003). Rapid diagnostictesting for malaria. Tropical Medicine and International Health, 8 (10):876–883.
Nauck, E., Fuhrmann, G., Knüttgen, H., Lippelt, H., Minning, W., Mohr, W., Mühlp-fordt, H., Rieth, H., Schumacher, H., Vogel, H., Westphal, A., and Weyer, F. (1967).Lehrbuch der Tropenkrankheiten. Georg Thieme Verlag.
O’Neill, M. J., Bray, D. H., Boardman, P., Phillipson, J. D., Warhurst, D. C., Peters, W.,and Suffness, M. (1986). Plants as sources of antimalarial drugs: in vitro antimalarialactivities of some quassinoids. Antimicrob Agents Chemother, 30(1):101–104.
94

Bibliography
Poser, C. and Bruyn, G. (1999). An illustrated history of Malaria. Parthenon Pub-lisching.
Ridley, R. G. (2002). Medical need, scientific opportunity and the drive for antimalarialdrugs (review). Nature, 415:686–693.
Shute, G. (1988). W.H. Wernsdorfer and Sir I. McGregor: Malaria, Principles andPractice of Malariology, chapter The microscopic diagnosis of malaria, pages 781–814.Churchill Livingstone.
Sokal, R. R. and F. James Rohlf, F. J. (1995). Biometry: the principles and practice ofstatistics in biological research. Freeman.
Stuart, M. C., Kouimtzi, M., Organization, W. H., and Hill, S. R., editors (2008). WHOmodel formulary 2008. WHO World Health Organisation.
Tee, T. T. and Azimahtol, H. L. P. (2005). Induction of apoptosis by eurycoma longifoliajack extracts. Anticancer Res, 25(3B):2205–2213.
Troye-Blomber, M., Weidanz, W. P., and van der Heyde, H. (1999). Malaria Molecularand Clinical Aspects, chapter The Role of T Cells in Immunity to Malaria and thePathogenesis of Disease, pages 403–438. harwood academic publishers.
Wehner, R. and Gehring, W. (2007). Zoologie. Thieme.
Wernsdorfer, G. and Wernsdorfer, W. (1991). Malariamittel aus pflanzen. Mitt. Österr.Ges. Tropenmed. Parasitol., 13:287–300.
Wernsdorfer, G. and Wernsdorfer, W. H. (2003). Malaria at the turn from the 2nd tothe 3rd millenium. Wiener klinische Wochenschrift, 115 (3):2–9.
Wernsdorfer, W. and Wernsdorfer, G. (1995). The evaluation of in vitro tests for theassessment of drug response in plamodium falciparum. Mitt. Österr. Ges. Tropenmed.Parasito, 17:221–228.
Wernsdorfer, W. H., Ismail, S., Chan, K. L., Congpuong, K., andWernsdorfer, G. (2009).Activity of eurycoma longifolia root extract against plamodium falciparum in vitro.Wiener klinische Wochenschrift, 121:23–26.
Wernsdorfer, W. H. and Trigg, P. (1988). W.H. Wernsdorfer and Sir I. McGregor:Malaria, Principles and Practice of Malariology, volume 2, chapter Recent progressof malaria research: chemotherapy, pages 1569–1674. Churchill Livingstone.
Wernsdorfer, W. H. and Wernsdorfer, G. (2010). Horst Aspöck: Krank durch Arthropo-den, volume 30, chapter Malaria, pages 695–716. Denisia.
Weyer, D. F. (1939). Die Malaria Übterträger. Bibliographisches Institut AG.
95

Bibliography
WHO (1991). Basic malaria microscopy. Technical report, WHO World Health Organi-sation.
WHO (2001). In vitro micro-test Mark III for the assessment of the response ofplasmodium falciparum to chloroquine, mefloquine, quinine, amodiaquine, sulfadox-ine/pyrimethamine and artemisinin. instructions for use of the in vitro micro-test kitMark III. Technical report, WHO World Health Organisation, CTD/MAL/97.20 Rev.2.
WHO (2007). Malaria in the greater mekong subregion: Tegional and country profiles.Technical report, WHO World Health Organisation.
WHO (2008). Malaria rapid diagnostic test performance (results of who product testingof malaria rdts: Round 1). Technical report, WHO World Health Organisation.
WHO (2010a). Global report on antimalarial drug efficacy and drug resistance: 2000-2010. Technical report, WHO World Health Organisation.
WHO (2010b). Guidelines for the treatment of malaria (second edition). Technicalreport, WHO World Health Organisation.
WHO (2010c). Malaria in the greater mekong subregion: Regional and country profiles.Technical report, WHO Wourld Health Organization.
WHO (2010d). World malaria report. Technical report, WHO World Health Organisa-tion.
WHO, editor (2011). The top 10 causes of death, Fact sheet Nr. 310,http://www.who.int/mediacentre/factsheets/fs310/en/index.html. WHO (DOR19.12.2011).
Wongsrichanalai, C., Pickard, A. L., Wernsdorfer, W. H., and Meshnick, S. R. (2002).Epidemiology of drug-resistant malaria (review). The Lancet Infectious Diseases, 2.
Woodrow, C., Haynes, R., and Krishna, S. (2005). Artemisinins (review). Postgrad Med.J., 81:71–78.
Zakaria, Y., Rahmat, A., Pihie, A. H. L., Abdullah, N. R., and Houghton, P. J. (2009).Eurycomanone induce apoptosis in hepg2 cells via up-regulation of p53. Cancer CellInt, 9:16.
96

Curriculum vitae
Name: Karin Taus, BscDate and place of birth: 26.04.1973, Wiener Neustadt, AustriaNationality: Austrian
Professional carrier:
• since October 2010 Master degree of Anthropology at the University of Vienna
• 2007 - 2010 Bachelor degree in Biology at the University of Vienna (final exami-nation September 2010)
• 2006 General qualification for University entrance
• 1996 - 1999 nursing care school (final examination with distinction)
Working experience:
• June/August 2010 fieldwork for my Master-thesis in Mae Sot/Thailand
• 2006 till current general nurse in home based care
• 2003 - 2006 field nurse with Medecins sans frontieres (MSF) in varies missions andcountries of Africa
• 1999 - 2006 general nurse in the hospital of Wiener Neustadt