Embed Size (px)
Citation preview

JOEL NUORA
ASSEMBLY LINE BALANCING FOR HIGH-MIX, LOW-VOLUME
PRODUCTION
Master’s Thesis
Examiners: Professor Miia Martinsuo and lecturer Ilkka Kouri Examiners and topic approved by the Faculty Council of the Faculty of Business and Built Environment on 6th March 2013

ii
ABSTRACT TAMPERE UNIVERSITY OF TECHNOLOGY Master’s Degree Programme in Industrial Engineering and Management NUORA, JOEL: Assembly line balancing for high- mix, low-volume production Master of Science Thesis, 93 pages, 1 Appendix page November 2013 Major: Industrial Management Examiners: Professor Miia Martinsuo, lecturer Ilkka Kouri Keywords: Assembly line balancing, production scheduling, high-mix, low-volume, takt time, production levelling This master’s thesis presents assembly line balancing methods, which aim to
improve continuous material flow in a variable environment. The most important
purpose of assembly line balancing is to continuously equalize the workload
between employees. Moreover, aspects related to production scheduling and
control methods for high-mix, low volume assembly lines are also discussed in
this work. The thesis is made as an action research so that available infor-
mation from literature is used and evaluated with the viewpoint of the needs and
problems of the case company. The goal of this thesis is to improve the produc-
tivity of the assembly line of power series hooklifts, with balancing methods and
a more organised production scheduling system.
Nine different assembly line balancing methods are presented, which are all
applied for the operation in the case company to improve the flow of materials.
The most significant method is the conventional way to first divide the total
workload to workstations as equally as possible and then allocate employees
based on average standard times. The first balancing action provides a good
starting point for the application of the methods which focus more on variable
standard times. The other balancing methods include multi-skilled workforce,
pre-assembly stations, different routings, production levelling, in-process inven-
tory, work time arrangements, task assignment variations and waste elimination
from bottleneck stations.
As a result of this thesis standard times of work tasks are used systemically for
assembly line balancing and production scheduling. Applying assembly line
balancing methods has equalized the workloads between employees, de-
creased waiting times and provided a good potential for productivity improve-
ment. For production scheduling the thesis presents a plan based on production
rate oriented system that aims at a more precise target setting. Related to the
scheduling system, a new visual assembly control system has been taken in
use, which has significantly improved target setting practices and real time pro-
duction control.
iii
TIIVISTELMÄ
TAMPEREEN TEKNILLINEN YLIOPISTO Tuotantotalouden koulutusohjelma NUORA, JOEL: Kokoonpanolinjan tasapainottaminen varioivassa ja matalan volyymin tuotannossa Diplomityö, 93 sivua, 1 liitesivu Marraskuu 2013 Pääaine: Teollisuustalous Tarkastajat: professori Miia Martinsuo, lehtori Ilkka Kouri Avainsanat: Tuotannon tasapainottaminen, tahtiaika, hienokuormitus, varioiva kokoonpano Diplomityö esittää kokoonpanolinjan tasapainottamismenetelmiä, joiden pää-
määränä on tarjota paremmat edellytykset materiaalien tasaiselle virtaukselle
varioivassa tuotannossa. Kokoonpanolinjan tasapainottamisen tärkeimpänä
tarkoituksena on jakaa työkuorma jatkuvasti tasaisesti työntekijöiden kesken.
Työssä käsitellään myös hienokuormitukseen liittyviä käsitteitä sekä kontrolloin-
timenetelmiä varioivalle ja matalan volyymin kokoonpanolinjalle. Työ tehdään
toimintatutkimuksena, jossa kirjallisuudesta löytyvää tietoa pyritään hyödyntä-
mään sekä arvioimaan kohdeyrityksen tarpeiden ja ongelmien kautta. Työn ta-
voitteena on parantaa vaihtolavalaitteiden kokoonpanolinjan tuottavuutta tasa-
painotusmenetelmien ja järjestelmällisemmän hienokuormituksen avulla.
Työssä esitetään yhdeksän erilaista tuotannon tasapainotusmenetelmää, joita
kaikkia on sovellettu kohdeyrityksen toimintaan asennuslinjan tasaisen virtauk-
sen edistämiseksi. Merkittävimpänä tasapainotusmenetelmänä voidaan pitää
tavanomaista tapaa jakaa ensin työmäärät keskiarvojen mukaan mahdollisim-
man tasaisesti työpisteille, minkä jälkeen työntekijät sijoitetaan eri työpisteisiin
standardiaikojen keskiarvojen mukaan. Tämä ensimmäinen toimenpide antaa
hyvän lähtökohdan muiden enemmän varioivan tuotannon huomioon ottavien
menetelmien soveltamiselle. Muut esitetyt menetelmät ovat monitaitoiset työn-
tekijät, esiasennus, vaihtoehtoiset reititykset, työjonon tasapainotus, välivaras-
tot, liikkuvat työtehtävät, työaikajärjestelyt sekä pullonkaulatyöpisteiden kehitys.
Työn tuloksena kohdeyrityksen kokoonpanolinjan työvaiheiden standardiaikoja
käytetään järjestelmällisesti kokoonpanolinjan tasapainottamisessa ja hieno-
kuormituksessa. Tasapainotusmenetelmien soveltaminen on tasoittanut kuormi-
tuksia työntekijöiden välillä, vähentänyt odotusaikoja ja tarjonnut edellytykset
tuottavuuden parantamiselle. Hienokuormituksen osalta tuloksena on suunni-
telma laitemääriin perustuvasta tavoitteenasettelusta, jolla pyritään tarkempaan
tuotannon ajoitukseen. Tähän liittyen kohdeyritykselle on myös laadittu uusi vi-
suaalinen asennuksenohjausjärjestelmä, jonka avulla tavoitteenasettelua ja re-
aaliaikaista tuotannonohjausta on pystytty parantamaan huomattavasti.

iv
ACKNOWLEDGEMENTS
This master’s thesis is made for Cargotec Finland Oy, Multilift Raisio factory, in
collaboration with Tampere University of Technology, Department of Industrial
Engineering. I would like to express my gratitude to my thesis supervisors Ilkka
Kouri and Miia Martinsuo for the guidance with the project.
I would also like to thank the company for this very motivating and interesting
project. I am deeply grateful for the assistance given to me by the whole Raisio
factory personnel and it has been a privilege working with you. Special thanks
for Esko Kleemola, Asko Nevalainen and Seppo Kantola for the support and the
discussions related to the development actions of this thesis work.
Finally I would like to thank my family and friends for their encouragement and
support through the whole studentship.
Turku, 25.10.2013
Joel Nuora

v
CONTENTS
1 Introduction .................................................................................................. 1
1.1 Foreword .............................................................................................. 1
1.2 Objectives and scope ........................................................................... 2
1.3 Methodologies ...................................................................................... 3
1.4 Company presentation .......................................................................... 5
2 Assembly line balancing and control ............................................................ 7
2.1 Definition and purpose of assembly line balancing ............................... 7
2.2 Assembly line balancing key terminology ............................................. 9
2.2.1 Time standards ........................................................................ 10
2.2.2 Production scheduling ............................................................. 11
2.2.3 Takt time and production rate .................................................. 12
2.3 Assembly line balancing for variable environment .............................. 16
2.4 Assembly line balancing methods ...................................................... 19
2.4.1 Assembly line balancing based on average station times ....... 19
2.4.2 Flexible multi-skilled workforce ................................................ 24
2.4.3 Pre-assembly for optional modules ......................................... 27
2.4.4 Different routings for variable products .................................... 28
2.4.5 Sequence planning to level out the workload .......................... 30
2.4.6 In-process inventory to avoid idle time .................................... 33
2.4.7 Assignment of identical tasks to different stations ................... 34
2.4.8 Work time arrangements ......................................................... 35
2.4.9 Continuous improvement of current bottleneck station ............ 36
2.5 Synthesis of assembly line balancing for high-mix, low-volume
production .................................................................................................. 38
3 Analysis of demountables assembly line ................................................... 41
3.1 Production system in the case company ............................................ 41
3.2 Work analysis ..................................................................................... 46
3.3 Interview analysis ............................................................................... 48
3.4 Assembly line time study .................................................................... 49
4 Demountables assembly line development................................................ 53
4.1 Assembly line balancing ..................................................................... 53
4.1.1 Assembly line balancing based on average station times ....... 53
4.1.2 Flexible multi-skilled workforce ................................................ 55
4.1.3 Pre-assembly for optional modules ......................................... 58
4.1.4 Different routings for variable products .................................... 59
4.1.5 Work queue levelling ............................................................... 61
4.1.6 In-process inventory to avoid idle time .................................... 63
4.1.7 Assignment of identical tasks to different stations ................... 64
4.1.8 Work time arrangements ......................................................... 65
4.1.9 Continuous improvement of current bottleneck station ............ 66

vi
4.2 Production control ............................................................................... 67
4.2.1 Production scheduling and target setting ................................. 67
4.2.2 Visual management tools for production control ...................... 68
4.2.3 Restrictions and problem solving ............................................. 71
5 Testing and implementation ....................................................................... 74
5.1 Implementation of assembly line balancing methods.......................... 74
5.1.1 Average load percentage towards ideal situation .................... 75
5.1.2 Increased use of multi-skilled employees ................................ 76
5.1.3 New pre-assembly station ....................................................... 77
5.1.4 Different routings for complex products ................................... 78
5.1.5 Sequence planning to support production flow ........................ 79
5.1.6 More detailed in-process inventory planning ........................... 79
5.1.7 Flexible tasks between workstations ....................................... 80
5.1.8 Change to one shift system ..................................................... 80
5.1.9 Problem solving and 5S for bottleneck stations ....................... 81
5.2 Implementation of new production scheduling system ....................... 82
6 Discussion ................................................................................................. 85
6.1 Result analysis ................................................................................... 85
6.2 Subjects for further studies ................................................................. 87
6.3 Conclusions ........................................................................................ 88
7 References ................................................................................................ 90
Appendix 1: Example of time and period dependent variances in a high-mix
production
Appendix 2: Product and workstation dependent variances in the power series
demountable assembly line
Appendix 3: Power series demountables assembly line balancing actions
Appendix 4: Power series demountables assembly line balancing calculations
with average target times
Appendix 5: Productivity of the demountable assembly line during 2013
Appendix 6: MAU Raisio value stream map
Appendix 7: Interview
Appendix 8: Temporary production scheduling system

vii
TERMS AND DEFINITIONS
Cycle time The operation time required to complete one process
in the value stream.
Station time The cycle time of one workstation, which is a sum of
task times based on product specifications.
Total cycle time The sum of all cycle times in a process from the
scope’s first station to the completion of the scope’s
last station of the scope.
Lead time The total amount of time elapsed from the start of the
first phase to the completion of last station.
Takt time The amount of time between two consecutive unit
completions in order to exactly meet the demand.
Formula for calculating the takt time: available produc-
tion time divided by demand.
Planned cycle time The amount of time between two consecutive unit
completions in order to meet the demand, taking into
account unplanned downtime or problems with allow-
ance time.
Production rate The number of completed units or throughput of an
assembly line, which is an inverse ratio for takt time
for same or longer period.
Takt-driven system Aims to synchronous movement of units using takt
time based scheduling.
Production rate The number of completed units during a predeter-
oriented system mined period used as a primary scheduling criteria.

1
1 INTRODUCTION
In this thesis assembly line balancing methods are studied and evaluated for
variable environments. The objective is to find solutions for creating a smooth
and organised production flow. This is a big challenge for high-mix assembly
lines. Assembly line balancing is directly connected to productivity and efficien-
cy of the operation by reducing work overloads and idle time. The aim of this
introductory chapter is to presents the purpose of this thesis, the research
method and the case company of the study
1.1 Foreword
Since the times of Henry Ford’s conveyor-based mass production to today’s
more flexible assembly systems, assembly lines have been an active field of
research. The first assembly line balancing related studies were made in the
1950s and the core idea was only to assign tasks equally to workstations. For
several decades the research concentrated on these simple assembly line bal-
ancing problems, which have many restricting assumptions making them appli-
cable only for single model assembly lines. Today’s more complex product re-
quirements and more variable assembly systems require also more extensions
for assembly line balancing. More research has been recently conducted to
solve more realistic and variable balancing problems. However, there is still a
clear gap between theories and practice, because studies often take into ac-
count only a single or just a few extensions for assembly line balancing prob-
lems. Real-world variable assembly systems require a lot of these extensions in
a combined manner. Thus, there is a need for more flexible assembly line bal-
ancing practices that are applicable for various kinds of flexible assembly lines.
(Boysen et al, 2008; Becker & Scholl 2006)
This thesis will concentrate on the assembly line balancing problems of a real-
world high-mix, low-volume environment. The work is made for Cargotec Fin-
land Oy Multilift factory in Raisio, by focusing on a demountables mixed-model
assembly line. The idea is to study many different balancing methods simulta-
neously first as an alternative development ideas and then in practice. The sec-
ond chapter will concentrate on production balancing and scheduling theories,
which are related to variable low-volume type production needs. Chapters 3, 4
and 5 concentrate on the practical side of this work by introducing the current
situation, the implementation plan as well as implemented development actions.

2
The final chapter focuses on the theoretical and practical views from a com-
parative angle and also presents the conclusions of the thesis.
1.2 Objectives and scope
The main objective of this master’s thesis is to plan alternative solution ideas for
assembly line balancing in high-mix, low-volume production at the Raisio facto-
ry. Based on the balancing related study also production scheduling for the de-
mountable assembly line is analysed. The theory part is mainly focused on
build-to-order type of production in a variable environment. It also examines the
production of complete equipment rather than individual parts. These kinds of
production environments are normally very customer oriented and can be found
in business such as industrial machines, trucks or airplanes.
The research question is: How can the Hiab Raisio factory create a balanced
and organised material flow in a low-volume and high-mix type of demountable
machine assembly line? For Raisio demountable factory the main goals are to
improve productivity and shorten the lead time in assembly line. The objective is
to create a smooth, well planned and organized production flow. There are no
ready-made solutions or proposals for line balancing or takt time, so a master’s
thesis study on this topic is needed. The sub-objectives for balancing are to
minimize waiting times in demountable assembly line and to create a clear tar-
get system which would be based on standard times. The target system will
require visual management improvements and some clarification for production
planning. Other fundamental aims are to increase the overall Lean manufactur-
ing awareness among the employees and to emphasize the importance of elim-
ination of non-value added activities from demountables production.
The development work is reconfiguration of the already existing production sys-
tem rather than developing totally new assembly line. The scope of this thesis is
assembly line of power series demountables from the output area of the paint
shop to the final workstation before testing. Subassemblies are also covered,
because they work with the same pace with the main assembly line. The scope
of the thesis is also presented in the assembly line flowchart in figure 3.2 with
bolded workstations. Development of the outsourced paint shop is left out of the
scope because it does not follow the same production system with the assem-
bly line, and because work time arrangements are not the same. Pipe bending,
which is made as a pre-assembly, is also not covered due to its batch type of
production and different scheduling periods. Final testing is not in the scope,
because its scheduling is based more on quality problems, delivery times and
current product mix of all demountables, rather than standard times of power
series hooklifts. The main focus is on material flow within the assembly line,

3
while inbound and outbound material logistics are studied only in case of re-
strictions, problem solving and production scheduling. Employee engagement
and change management are closely related to the development of assembly
line, but they are not deeply discussed in this thesis. For example in balance
calculations all employees are perceived to have the same competence, moti-
vation and capacity regarding to workloads, which does not reflect to real world
assembly work. In case of standard times the scope is to only use available ma-
terial from ERP system and not to make any detailed stop-watch time studies.
There are no complex mathematical formulations or algorithms in the thesis that
exist in many assembly line balancing theories. It was acknowledged that the
source data is not reliable enough for that kind of statistical research and the
production system is too flexible for very accurate calculations. The idea was to
get a rough balance situation by recognizing the assembly line bottleneck and
other production flow restrictions.
1.3 Methodologies
The methodology of this thesis is an action research, which is aimed at to use
appropriate knowledge to improve practices in an organisation’s context.
Throughout the project, theories from assembly line planning related literature
were used to support decisions in balancing and controlling activities for de-
mountable assembly line. Figure 1.1 illustrates the methodology of the project,
which is also used as a structure of the thesis. The first phase is a development
of different alternative ideas to solve the research question. Ideas are generated
through the literature review and an analysis of the current situation. In the next
phase, these ideas are evaluated with empirical data and logical thinking, which
will result in an implementation plan with selected alternative ideas. In testing
and piloting the plan is implemented in practice for demountable assembly line
and the consequences of different changes are analysed. Finally the results and
empirical work are compared to the literature review in the framework of the
discussion chapter.
Figure 1.1. Methodology of the thesis.

4
The analysis of the current situation was made with empirical participative ob-
servation, interviews, data collection and daily discussions with personnel. The
analysis of the production line was made at the beginning of the year 2013.
The idea behind the observation period was to learn the assembly line better, to
get to know the employees and to find development ideas for production. The
observation was conducted through a two-day hands-on line-work and daily
visits in the assembly area. The findings were first listed as notes, which were
used as checklist for comprehensive report of current situation analysis. Waiting
and idle time were detected to be the most significant inefficiencies of the as-
sembly work and it emphasizes the need of this assembly line balancing work.
Data collection was the biggest part of the empirical work done for this thesis. In
the analysis of the current situation the most important task was to determine
the workstation balance situation by dividing target times to workstations and
calculating of capacity requirements. The data source was the ERP -system
and the work was mainly done through Spreadsheet software calculations. The
source data included total current order book of highly variable power series
demountables. The main analysed factors where cycle times of each work-
station and the differences of standard times between products.
The development project for balancing and production scheduling was made
during spring 2013. The most critical issues were recognized based on the
analysis of current situation. Action plans were planned through meetings, a few
trainings and various tests within the assembly line. There were meetings held
for definition of target times, sequence planning, visual management and gen-
eral development meetings of factory’s lean team. The actual changes in the
assembly were made together with employees, supervisors and managers.
Small changes were usually based on statistical data and discussions with dif-
ferent responsible persons. The test weeks were based on the changes in the
assembly line balancing, but concentrated more on new production scheduling
and a target setting system. The development work was documented mainly to
weekly report made by the author of this thesis. The report included information
of the results previous week, completed hours, productivity, differences com-
pared to targets, report of different changes and author’s opinion of next short-
term development objects. The overall idea of the development project is to
create a plan for future ways of working and it is not aimed implementing all the
changes presented during the thesis project. The most significant assembly line
balancing and controlling actions are made in the long term after having been
well planned, tested and all consequences are recognized. The thesis will pro-
vide an analysis of current situation, a study of the subject, balancing methods,
as well as the first steps in implementing changes. The purpose is also to create
an environment for continuous improvement for assembly line balancing.

5
1.4 Company presentation
This work has been done for Hiab’s Raisio factory, where Hiab Multilift de-
mountables are assembled, designed and managed. The roots of Multilift are
already in the year 1947, when Terho brothers patented demountable working
with cables. This cable lift enabled the founding of the Raisio Multilift factory in
1961 and it is currently the only production facility of Cargotec in Finland. The
Multilift brand name has gone through many acquisitions and owners. It was
first bought by Sponsor Oy in 1968, followed by Partek in 1977. In year 2002
Kone Oyj acquired Partek and made Cargotec as one of its business area for
load handling solutions. Cargotec Corporation demerged from Kone and be-
came an independent stock listed company in 2005. (Teräväinen 2005)
Cargotec improves the efficiency of cargo flows around the world in over 120
countries with an extensive product portfolio. Cargotec’s turnover was 3.3 billion
euros and the average number of personnel was 10 500 in 2012. Cargotec is
composed of three well-known brands MacGregor, Kalmar and Hiab which are
now working as individual business areas. This work is done for Hiab business
area of which sales was 840 million euro with 3038 people in 2012. Hiab pro-
vides different on-road load handling solutions for various transport and delivery
sectors. Its offering contains loader cranes, forestry and recycling cranes, truck
mounted forklifts, tail lifts and demountables. Hiab products are used, for in-
stance, on construction sites, forestry, warehousing, waste handling as well as
by the Defence forces. (Cargotec Oyj, 2013a 3, p.73)
Figure 1.2. Hiab Multilift S-model.

6
Demountables are now sold as Hiab products and Multilift is regarded as a well-
known product name for global market leader demountable solutions. The core
idea of Hiab Multilift demountables is that the truck can be driving all the time
and carry out multiple tasks because containers can be loaded and unloaded
separately. Demountables are used, for example, in waste handling and recy-
cling businesses as well as by fire brigades and defence applications.
(Teräväinen 2005, p.19)
There are three different product families of demountable products: hooklifts
(figure 1.2), cablelifts, and skip loaders. Hooklift is the most important Multilift
product family and it is divided into power series, small hooks and special prod-
ucts. The scope in this thesis is assembly line of power series hooklifts. All the
products are designed modular and assembled from options chosen by cus-
tomers so that there can be thousands of different kinds of variations of hook-
lifts. There is an assembly line for power series hooklifts and assembly cells for
small hooklifts, cablelifts and defence products. Today all welding and part
manufacturing is made by suppliers and Raisio factory only assembles the de-
mountables. More detailed presentation of the demountables production system
is in chapter 3.1.

7
2 ASSEMBLY LINE BALANCING AND CON-
TROL
Assembly line balancing and production balancing are not totally unequivocal
terms, because they are presented in at least in three different kinds of con-
cepts. The most common viewpoint is to balance the speed and volumes of the
production to meet customer demand as closely as possible. Another very
common perspective for balancing is the workload balance based on a certain
time period, which is also called production levelling or known through the Jap-
anese term heijunka. However, in this study production or assembly line balanc-
ing means process design for workloads between assembly line workstations
and employees. The core purpose is to equalize the amount of work between
employees and to improve material flow in the assembly line. In this chapter
there is first an introduction to assembly line balancing and its purposes. After
that the assembly line key terminology and concepts related to production
scheduling are presented. The final sections focus on assembly line balancing
methods and solution ideas for high-mix low-volume environment.
2.1 Definition and purpose of assembly line balancing
An assembly line is a flow-oriented production system where the productive
units performing the operations, referred to as stations, are aligned in a serial
manner. The workpieces visit stations successively as they are moved along
the line. Assembly line balancing was first introduced by Salveson in 1955 in his
pioneer work where production design problems were analysed with prece-
dence graphs and a planned cycle time together with a mathematical formula-
tion. The assembly line balancing problem consists in determining a set of tasks
for every workstation so that precedence relation requirements between single
tasks are not violated and operation time does not exceed the planned cycle
time. In a classical time-oriented assembly line balancing the objective is to min-
imise the manpower needed to assemble one product and the number of sta-
tions which also leads to minimal idle time. (Salveson 1955; Baybards 1986)
Assembly line balancing consists of scheduling and controlling the production in
order to meet the required production rate and to achieve a minimum amount of
idle time. In assembly line balancing all tasks are assigned to workstations so

8
that each station has approximately same amount of work at all times. An un-
balanced line may lead to overburden in some stations, high variation in output,
waiting times and poor efficiency. Instead, well balanced assembly line has to-
tally opposite effects and it promotes a one piece flow for the assembly line.
(Konnully 2013)
The purposes of assembly line balancing are to:
Equalize the workload among the assemblers
Establish the speed of the assembly line
Identify the bottleneck operation
Assist in plant layout
Determine the number of workstations
Determine the labour cost of assembly
Establish the percentage workload of each operator
Reduce production cost. (Stephens & Mayers 2010, p.111)
The most important objective of assembly line balancing is to give each opera-
tor as close to the same amount of work as possible. The workstation with the
largest time requirement is designated to be 100% workstation and is the limit of
output of assembly line. The station is a bottleneck station and it should be the
first priority for development actions. Through a well-balanced assembly line
idle time is minimized and a continuous production is enabled. This leads to a
better productivity of the assembly line. Also speed of the assembly line is a
consequence of balancing calculations, because the amount of workstations
and workers influence on cycle time, which determines the speed of production.
(Stephens & Mayers. 2010, p.111)
Production balancing requires a lot of calculations of production related indica-
tors like cycle times, lead times, standard times and resources. The inputs for
assembly line balancing problems are precedence constraints based on product
and time requirements. These elements can be visualized with precedence
graphs, which contain a node for each task of the assembly system. Figure 2.1
shows a precedence diagram for 10 tasks having task times between 1 and 10
time units. Nodes weight for task times and lines for the sequence constraints.
In this example the precedence constraints require tasks 1 and 4 to be com-
pleted before processing task 5. The tasks are assigned to different stations as
equally as possible so that precedence and capacity constraints are fulfilled at
all times. (Becker & Scholl 2006, p.695)

9
Figure 2.1. Precedence graph. (Becker & Scholl 2006, p.695)
Production balancing may often influence to the number of workstations and
layout changes. This is more common in mass-production type of assembly
where operations are planned in seconds and where there is only one worker
per station, whereas in low-volume production issues related to space and prob-
lem solving, among others, can lead to changes. The assembly line balance
situation is normally visualized through column charts. These charts represent
the differences between workloads between workstations and they are used as
a main visualization tool in this thesis. Examples of column charts can be found
in figures 2.3, 2.4, and 2.6.
The final listed purpose of assembly line balancing is to reduce production
costs. The main improvement comes from the equalized workload, because the
non-productive idle and waiting times are used for assembly work instead. This
leads to a better productivity because the available time is used more effectively
to standard times instead of waiting. The cost savings gained through a better
productivity thus come from more standard hours sold or reduced number of
employees. Another perspective, alternative for the usual time-oriented balanc-
ing, is called cost-oriented assembly line balancing. The objective of this ap-
proach is to minimise the unit costs by giving a value for each task and then
minimise labour and capital costs by reducing idle time by prioritizing most ex-
pensive tasks (Amen 2006, p.749).
2.2 Assembly line balancing key terminology
In this chapter different assembly line control methods are analysed briefly for
high-mix, low-volume assembly line. The definitions for standard time, cycle
time, lead time and other main production scheduling terms are explained brief-
ly to avoid misunderstandings. The terms are presented because they are nec-
essary for production balancing which is the main subject of this thesis. This
chapter also assesses the possibilities and readiness to implement a takt time –
based production system for demountable assembly line which was the initial
vision in the beginning of thesis project. The focus will then be on comparison of
10
takt-driven and production rate oriented system which will be defined and ana-
lysed focusing on high-mix, low-volume assembly lines.
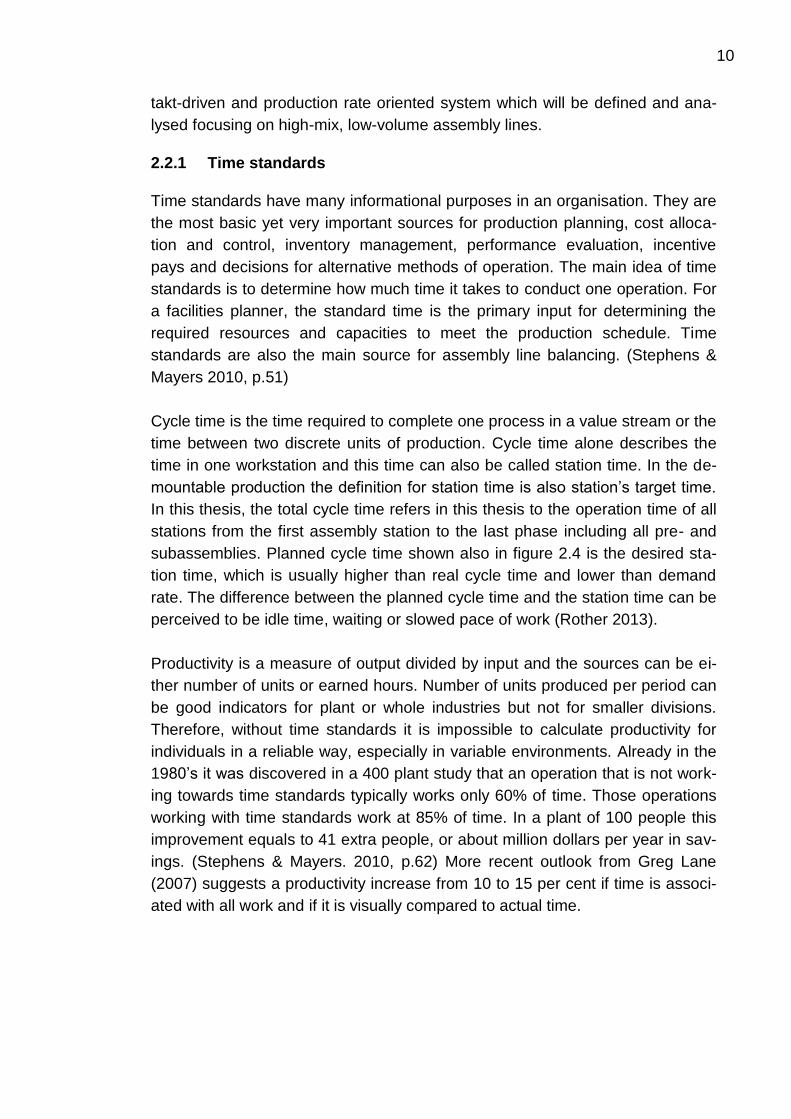
2.2.1 Time standards
Time standards have many informational purposes in an organisation. They are
the most basic yet very important sources for production planning, cost alloca-
tion and control, inventory management, performance evaluation, incentive
pays and decisions for alternative methods of operation. The main idea of time
standards is to determine how much time it takes to conduct one operation. For
a facilities planner, the standard time is the primary input for determining the
required resources and capacities to meet the production schedule. Time
standards are also the main source for assembly line balancing. (Stephens &
Mayers 2010, p.51)
Cycle time is the time required to complete one process in a value stream or the
time between two discrete units of production. Cycle time alone describes the
time in one workstation and this time can also be called station time. In the de-
mountable production the definition for station time is also station’s target time.
In this thesis, the total cycle time refers in this thesis to the operation time of all
stations from the first assembly station to the last phase including all pre- and
subassemblies. Planned cycle time shown also in figure 2.4 is the desired sta-
tion time, which is usually higher than real cycle time and lower than demand
rate. The difference between the planned cycle time and the station time can be
perceived to be idle time, waiting or slowed pace of work (Rother 2013).
Productivity is a measure of output divided by input and the sources can be ei-
ther number of units or earned hours. Number of units produced per period can
be good indicators for plant or whole industries but not for smaller divisions.
Therefore, without time standards it is impossible to calculate productivity for
individuals in a reliable way, especially in variable environments. Already in the
1980’s it was discovered in a 400 plant study that an operation that is not work-
ing towards time standards typically works only 60% of time. Those operations
working with time standards work at 85% of time. In a plant of 100 people this
improvement equals to 41 extra people, or about million dollars per year in sav-
ings. (Stephens & Mayers. 2010, p.62) More recent outlook from Greg Lane
(2007) suggests a productivity increase from 10 to 15 per cent if time is associ-
ated with all work and if it is visually compared to actual time.

11
2.2.2 Production scheduling
The production planning and control function of an organisation is responsible
for ensuring that production activities are as efficient as possible. Its purpose is
to find the best and the cheapest methods to produce the required quantity and
quality at the right time. Production planning is the choice from several alterna-
tives how to utilise the resources available to achieve the desired objectives.
Control is monitoring performance by comparing the results achieved with the
planned targets so that operations can be improved through proper corrective
actions. (Aswathappa & Shridharabhat 2009, p.208)
The purpose of production scheduling is to make a detailed plan for the produc-
tion processes. The basis for production scheduling is the longer term rough cut
planning. Planning the schedule for different tasks requires the knowledge of
standard times and of the current situation in production. The timeframe for pro-
duction scheduling is normally kept as short as possible which typically means
from one week to one day. With a short timeframe it is possible to get more
specific information and reliable plan. Good delivery accuracy and high produc-
tivity are common goals of production scheduling. (Haverila et al. 2009, p.417)
In a lean environment, the production control department plays an absolutely
vital role and it is responsible for very detailed planning. It includes capacity
planning down to a process level. Getting all the right parts to the right point on
time is probably the biggest issue. Production planning department should
make a daily or an hourly plan for each process and compare them with pro-
cess capabilities and realization. (Lane 2007, p.46)
All workstations should have a schedule of what will be occurring during the
day. In high-mix, low-volume environment, where cycle times are normally cal-
culated in several minutes, standard times may not be particularly precise. Cy-
cle times must be close but not necessarily exact. For example 410 minutes can
be counted as seven hours. A continuous updating of standard times is neces-
sary in order to ensure reliability of assembly line balance calculation and prod-
uct costing. (Larco et al. 2008, 74, p.106)
The production planning for different phases in assembly can be done with
backwards or forwards scheduling. Frontwards scheduling starts from the start-
ing time of production and when resources become available to determine due
date. The starting time of the second phase is calculated by adding the time
required to complete the first phase. The next phases are scheduled with the
same system until all phases and the finishing time is calculated. Backwards
scheduling starts from the planned due date so that the starting time of the final

12
phase is calculated backwards in time. The same system is used to calculate
the beginning time of the second last phase and then finally continued to the
first phase. This is the most common system in production planning programs.
(Haverila et al. 2009, p.419)
There are various different charts and tables to visually manage production
schedules. The most popular tool to display schedules is the Gantt chart, which
is used to graphically display the workloads of each work centre. There are two
types of Gantt charts: the workload chart as well as the scheduling chart. In
both charts time elapses on vertical axis. In the Gantt workload chart the hori-
zontal axis shows the amount of work while the vertical bars depict workloads
for different periods. In Gantt scheduling chart different workload groups are on
the vertical axel and tasks are shown with different colours with horizontal bars,
which length depicts time required to complete the phase. (Aswathappa &
Shridharabhat 2009, p.312)
Computer systems are the best for monitoring production control, because as
the data is available as soon as it is entered to the system. Old fashion cards
are slow in comparison and they are subjects to even more errors (Larco 2004,
p.108). The programs that are used for production scheduling are based on dif-
ferent kinds of algorithms that will solve optimisation problems and generate
alternative plans, which are used to support the final decisions made by the
planner. (Haverila et al. 2009, p.419)
2.2.3 Takt time and production rate
Takt is a German word meaning a musical beat, stroke of an engine or a regular
rhythm. These are natural extensions to think of takt time as the time between
beats of the pace of production. Takt time is the average amount of time that
must be elapsed between the completions of two units in order to meet the de-
mand. A takt time based system is transferred also as paced production in
many references which mean that the all stations have common cycle time. This
time matches to the rate of how customers require finished units. This pace is
calculated with demand and net available production time, which means the
working time without breaks. (Baudin 2002, p.42)
Takt time can be likened to conductor’s baton keeps the orchestra in synchro-
nized order (Rother & Harris 2001, p.13). Liker (2004, p.94) compares takt time
to the heart beat of one-piece flow or the person in key position of coxswain

13
coordinating the pace for rowing so that any rower would not under or underper-
form. Analogy of takt time for high-mix products can be compared to chairlift
system presented in figure 2.2 where the workload can be different but the time
between chairs is constant. If there is a heavy load the lift just needs more pow-
er but the frequency will not be affected (Baudin 2002, p.43).
Figure 2.2. The chairlift analogy for takt time in mixed-flow line (Baudin 2002,
p.43)
Takt time provides a good picture of customer demand over a period of time.
The customer takt should be reviewed for example every two weeks because of
demand changes. Effective operation time is calculated by subtracting breaks
and planned downtime from the total available time. When net available time is
divided by the demand for the same period the result is takt time. Takt time itself
is not enough for production scheduling and to be used for cycle time because
there are always problems occurring in production. That is why production is
scheduled for planned cycle time, which is the desired pace of the production.
Planned cycle time is faster than takt time because it accommodates changeo-
vers, downtime and possibly some other non-value added activities. (Rother
2013, p.18)
Lane (2007) calls takt time as pure takt time and planned cycle time as actual
takt time. In actual takt time the basis for calculations is the overall equipment
effectiveness rate. It is more preferred in part manufacturing rather than assem-
bly, but the system is the same. The actual takt time should be compared to
standard times and cycle times for each task. The result is usually showed with
assembly line balancing graphs which are discussed in the next chapter. Takt
time, planned cycle time and standard times are used for production scheduling
to plan activities as efficiently as possible. However, takt time based production
scheduling cannot be applied to all assembly line environments. In low-volume

14
build to order environment, where processes are managed rather with day-by-
hour boards or Gantt’s scheduling charts, takt time is not used. (Lane 2007,
p.36)
The takt time allows defining an ideal state for production one-piece flow with
exactly matching station times. This ideal state can be called as takt-driven pro-
duction, where all deviations are translated to different inefficiencies or wastes.
In takt-driven production takt time gives the direction for operation, but in real-
world assembly lines it is never perfectly realized. Time per demand calculation
is the way to calculate takt time, but it does not tell the rules of how to use the
number or how it maps to shop floor. Takt-driven operation is not relevant for
example in business with non-repetitive operations, where it becomes more dif-
ficult to balance the work among stations with broaden mix of products. In many
production plants the inverse ratio is used which will give the same information
with production rate over a period. Demand per time calculation gives mathe-
matically the equivalent result, but the shop floor operation may be totally differ-
ent. Working at a takt time of 1 minute and making 60 units per hour gives the
same throughput during an hour, but the scheduling system may differentiate
significantly. In terms of units per hour it does not matter if nothing comes out
for the first 59 minutes of an hour as long as all 60 units are completed in the
end. In takt-driven operation unit will come out every minute according to
planned cycle time. (Baudin 2012)
As introduced, the alternative approach for takt-driven operation is to concen-
trate on completed units over a predetermined period. This system does not
have well-established definition and it is called with many different terms like
production rate -oriented system, takt rate -system or throughput -oriented pro-
duction planning. In this thesis the approach is called with production rate ori-
ented system. It is not paced production because the time between two prod-
ucts are completed can fluctuate. Production rate for certain predetermined pe-
riod is much more flexible in variable assembly compared to takt time, because
different products take different time to be completed. Production rate -oriented
system will smooth difficulties in capacity allocation because the requirements
can be divided for longer timeframes than in takt-driven operation.
Production rate or using day-by-hour boards is good especially in shared pro-
cesses where work is done without a solid forecast. The rate and schedule will
serve as clear targets for assembly for a certain period when all different pro-
jects should be completed. Standard times and available capacity are used in
target setting for the rates. The system will help in capacity planning because it
is easier to see where production is late when compared to the targets. The cur-
rent status can be visualized versus plans and ability to prioritize different tasks
15
will increase. With good plans, targets and visualization the current imbalance is
indicated clearly and it is easier to make corrective actions faster. A clear
schedule will also encourage operators to list problems that cause delays.
(Lane 2007, p.36)
In production rate oriented system cycle time is not always the same for all sta-
tions so the control system is normally unpaced. The system can be either un-
paced asynchronous or unpaced synchronous. In asynchronous movement the
products are transferred forward to other works station as soon as they are
completed. In order to balance workloads buffers are needed to avoid waiting
times. Under synchronous system all stations would wait for the slowest station
to finish before the work pieces are transferred. This will cause waiting times but
buffers are not necessary (Boysen et al. 2008, p.8).
The target production rate is calculated based on demand for certain time peri-
od. Takt time calculations may support the scheduling decisions but are not di-
rectly used because of variable product cycle times. The period for the rate is
decided based on product specifications and the required accuracy of plans.
The minimum for the period is planned cycle time of one product which is then
practically the same than takt time based production. The period can also be
the average cycle time to assemble two products. The normal system is to plan
the rate for a longer period such as half a day, day or even a week.
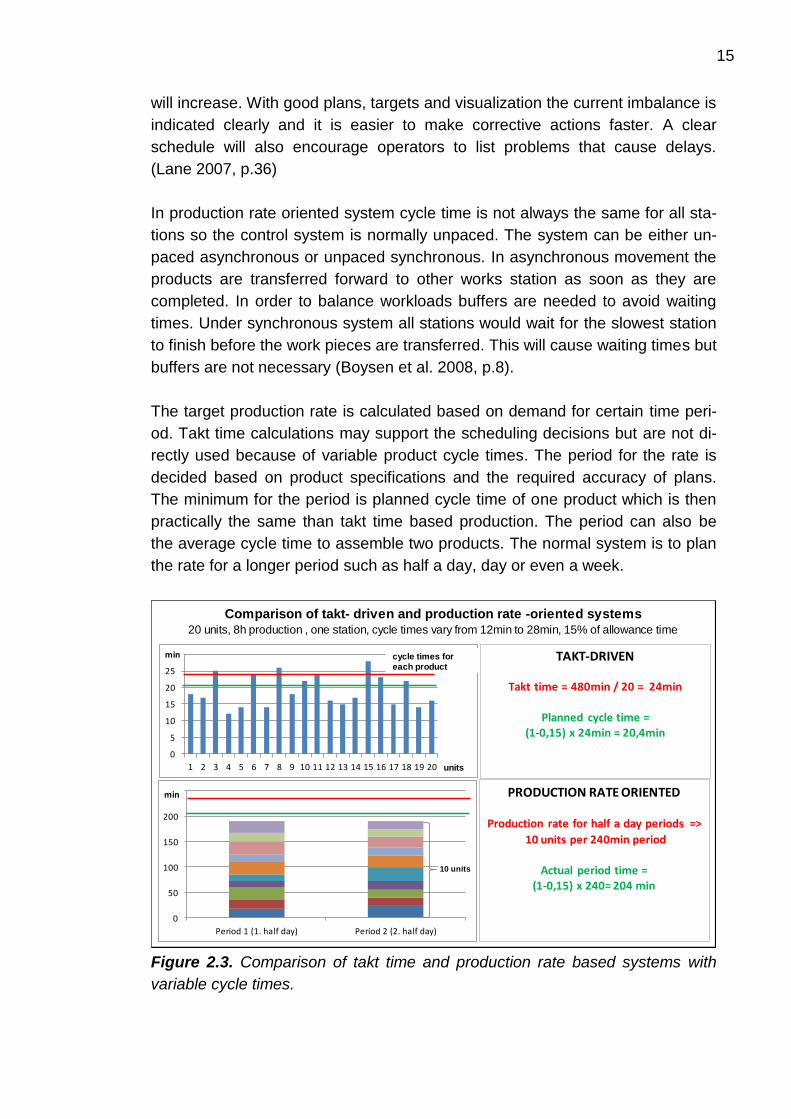
Figure 2.3. Comparison of takt time and production rate based systems with
variable cycle times.
Comparison of takt- driven and production rate -oriented systems20 units, 8h production , one station, cycle times vary from 12min to 28min, 15% of allowance time
0
5
10
15
20
25
30
1 2 3 4 5 6 7 8 9 10 11 12 13 14 15 16 17 18 19 20
min
units
0
50
100
150
200
250
Period 1 (1. half day) Period 2 (2. half day)
min
10 units
TAKT-DRIVEN
Takt time = 480min / 20 = 24min
Planned cycle time = (1-0,15) x 24min = 20,4min
PRODUCTION RATE ORIENTED
Production rate for half a day periods =>
10 units per 240min period
Actual period time = (1-0,15) x 240= 204 min
cycle times for each product

16
Figure 2.3 is an example of a situation of one station’s work for 8 hours. The
target is to complete 20 products, which is the demand of the period for the sta-
tion. There are both takt-driven and production rate oriented systems illustrated
in a high-mix, low-volume production where cycle times vary significantly from
12 minutes to 29 minutes. In both cases the amount of work is the same 380
minutes which is 100 minutes less than 8 hours. In both cases this 15% allow-
ance percentage can be subtracted from the available time to get the planned
cycle time or actual scheduled period time.
In takt-driven production all the cycle times should be as equal as possible but
in variable production it is not necessarily possible. In the example many prod-
ucts cross the planned cycle time and also takt time. In these products more
resources or better productivity is needed to reach takt time. Additionally in-
process inventory can also be used to even out the workload so that the next
stations do not need to wait for products. There is much more unevenness cre-
ated if variable cycle times are tried to fit to the takt-driven system without very
detailed scheduling. In the production rate oriented system these variable fac-
tors are divided into longer periods when the workload seems to be much more
even and short term balancing problems are avoided. The operator only needs
to complete all the required parts during predetermined period while the sched-
uler is responsible that the total cycle time fits to the demand and allowance
rates. In the product rate oriented system product variances fade because of
longer time periods and because it is much easier to reach the targets. In both
systems it is important to aim at to decrease variances in station times and
there are different methods presented in chapter 2.4 for this purpose.
2.3 Assembly line balancing for variable environment
Originally assembly lines were developed for a cost effective mass production
of standardized products and it was also the focus on production planning relat-
ed literature. Since the first mathematical formulation of assembly line balancing
by Salveson 1955 the research focused for many decades on the core problem
to assign tasks to different stations evenly. This was usually done with numer-
ous simplifying assumptions which can only be generalized to mass-production
environment of homogeneous products. When the results were tried to apply in
real world production systems it was understood that product requirements do
not often reflect with the assembly line balancing calculations. These simplified
formulations are today labeled as simple assembly line balancing problems
(SALB) and they have only two constraints considered. In SALB cycle time con-
straint means that station time of any station cannot exceed the planned cycle
time and precedence constraint means that the requirements of assembly order
must be carefully observed. SALB characteristics are applicable for a single

17
model assembly line, which is paced with a fixed cycle time and has no assign-
ment restrictions. In the simple assembly line all the stations are equally
equipped and the idea is to maximize the line efficiency with station times that
are as near to the planned common cycle time as possible. (Baybards 1986,
p.150; Scholl & Becker 2006, p.667)
As mentioned in the first chapter the scope is in high-mix, low-volume assembly
line for complete equipment. The standard assumption for assembly line bal-
ancing is the traditional single model production and many publications study
this perspective. Today’s assembly lines have changed dramatically since the
early versions due to more complex product requirements and diversified cus-
tomer needs. Companies have to be able to individualize their products with
modularisation or mass-customization. For example car manufacturer BMW
offers various optional features that in theory would allow 1032 different models
which are produced in one assembly line. Better production techniques and
production planning enable efficient flow-line systems also for varying low-
volume assembly-to-order production. The main principles are the same in sim-
ple assembly line balancing and mixed-model assembly line balancing but in
the latter all the calculations, problem solving and restrictions are more com-
plex. (Boysen et al. 2008, p.1-3)
More flexible assembly line requirements have also attracted the attention of
researchers and a great amount of different extensions of basic assembly line
balancing studies have been made. Assembly line balancing research evolved
towards formulating and solving generalized problems (GALBP) with different
additional characteristics such as cost functions, equipment selection, U-shaped
line layout and mixed-model production (Scholl & Becker 2006, p.667). The last
one of these characteristics, the mixed-model assembly line balancing, is the
most important extension for this study that concentrates on high-mix produc-
tion of built-to-order products.
In mixed-model assembly line (MALB) the models may differ from each other
with respect to size, color, tasks, task times, precedence relations and many
other variables. Consequently it is almost impossible to find a line balance when
workloads of different stations have the same station time and equipment re-
quirements for all models. In these kinds of environments the conventional con-
straints are no longer relevant, because there can be flexibility in local cycle
time violations and also employees need to be flexible. Cycle time is no longer
the implicit maximum station time because the primary station time must be de-
fined from the average cycle time. Employees must be flexible enough to qualify
several tasks in order to balance the line. The analogy of MALB consists of find-
ing the optimized number of station, cycle times and line balance such as in

18
SALB. However, the work is a lot more complex because of the large amount of
variable factors while the station time must be smoothened for each station
separately. (Becker & Scholl 2006, p.706)
In simple assembly line balancing problems the capacity of the line is defined
from the amount of workstations, because workplaces and operators can be
perceived as the same attribute. In a more variable environment this definition is
not necessarily applicable because many products manufactured on assembly
line are large enough to be worked at several workers simultaneously on one
workstation. Moreover, the stations are often designed merely based on product
structures than on common cycle time and workload may also differ between
stations. In these kinds of variable environments the productive capacity is not
defined by the number of workplaces but by the number of employees required.
Because station times may significantly vary between workstations significantly,
the stations are balanced with the amount of employees. However, it is often
proposed to distribute the total work content as evenly as possible among the
stations because it promises better product quality due to a more standardised
work system. (Becker & Scholl 2009, p.359-361)
In a variable environment it can be challenging to allocate and calculate accu-
rate real workloads of workstations because the cycle times are not the same
for every product or model. For high-mix, low-volume line where standard times
fluctuate, determining average standard time per process is more accurate for
determining resources. The balance of the assembly line is then calculated by
dividing the resources equally based on average standard times. The resource
calculation is straight forward but the resource allocation may not be as simple
and accurate because there is so much variance in times. (Hobbs 2011, p.236)
There are two aspects in assembly line balancing for mixed-model assembly
lines. The first aspect is the equal allocation of the total workload to all employ-
ees based on average station times. This is called vertical balancing and it is
described more in detail in chapter 4.3.1. The other one is more horizontal bal-
ancing, which aims to decrease the variability of station times in order to avoid
occasional work overload or idle time. This method is described more in detail in
chapter 4.3.3 where the method used is to decrease variability by assigning op-
tional modules to pre-assembly. Vertical balancing is important for all kinds of
assembly lines but horizontal balancing is a characteristic only for mixed-model
assembly with variable station times. (Merengo et al. 1999, p.2839)
One of the objectives of assembly line balancing is to determine bottleneck sta-
tion, which is the slowest operation or the most loaded station that is constrain-
ing the assembly line throughput. In high volume plants, a bottleneck can be

19
determined also visually from predetermined buffers before and after work-
station. For example if the buffer before is full and the one after is empty, the
workstation is likely to be a bottleneck or at least a local constraint, and no
deeper analysis is needed. For low-volume production the bottleneck can be
less obvious because the bottleneck can change place depending on certain
condition. (Lane 2007, p.71)
Assembly line balancing for more complex mixed-model lines has regarded as a
tactical level problem. It can be solved by dividing tasks equally to different sta-
tions, assigning unlimited buffers and determination of production sequence of
all models for each station separately. However, competitive markets require
more flexible production systems that respond rapidly to changes in the market
conditions. Then unlimited buffers are not a solution in assembly line systems
and workloads must be planned more in detail in order to avoid unbalance. In
flexible systems with limited buffers mixed-model assembly line balance prob-
lem becomes an operational problem, because task assignment and operations
scheduling must be considered simultaneously with a shorter timeframe.
(Öztürk et al. 2013, p.436)
Larco et al. (2008, p.56) has come to a conclusion that assembly line balancing
and designing layout in a variable environment is more like an art than basic
production planning, because there are so many different factors to be consid-
ered simultaneously. Multi-skilled employees, different routings, scheduling
problems and determination of bottlenecks are just a few extensions compared
to a mass-production environment. These kinds of environments require skilled
planners and self-management from employees in order to operate the facility in
an efficient manner. (Larco et al. 2008, 56; p.91)
2.4 Assembly line balancing methods
Various optimization methods have been introduced and discussed in literature
for assembly line balancing. The methods aim to support decision makers to
configure the assembly systems as efficiently as possible (Boysen et al. 2008).
In this chapter nine different methods presented. They are also perceived as
alternative solution ideas to be implemented in practice for the case company’s
needs. All these alternatives can be used in parallel. However in mixed-model
line at least two methods must be used because both vertical and horizontal
balancing aspects need to be considered.
2.4.1 Assembly line balancing based on average station times
The purpose of this first method is simply to equalize the workload for all em-
ployees based on the workstation planning, capacities and average station

20
times. This is the most common and almost compulsory method to balance as-
sembly lines. It is also presented in all sources that present how assembly line
should be designed and it fits to all kinds of productions. In a high-mix produc-
tion line some other methods must also be used but balancing according to av-
erage workloads is the basis and starting point for actions and for the use of
other methods. This will define the normal situation, which balances the work-
loads on a very long term period, but also considers short-term variations in
production.
There are many factors that affect the production balancing based on workloads
and a lot of calculation is needed. Values that need to be considered in assem-
bly line balancing are, for instance, all standard times, the available working
time, number of workstations, number of workers, routings and demand. The
current production set-up normally defines the most important factors to be
evaluated for reconstructive assembly line balancing. For example the product
structure, the employees’ skills as well as available space can be restrictions
that define the perspective for the plans and actions.
In assembly line balancing the first thing is to evaluate and compare the total
cycle time with the theoretical takt time. In simple assembly line balancing prob-
lems it will give a rough estimation for the number of employees needed and
speed of the line. There are big differences in allocation of these values in dif-
ferent production systems. In simple assembly line balancing problems for mass
production requirements the station times are always the same. The calculated
cycle time is divided equally between workstations, which are usually defined to
match the takt time as presented in chapter 2.2.3. Furthermore, an early study
for mixed-model assembly line by Thomopoulos (1970) attains for equality of
workloads across all workstations and models to enable synchronous move-
ment in assembly line.
The first step in transformation from simple assembly line balancing problem to
mixed model balancing is to compute average task times for workstations.
Becker & Scholl (2006, p.707) call this process as a reduction to single-model
problem. The next step is the minimization of cycle time differences from aver-
age station time and to aim for synchronous takt-driven production. For high
volume assembly line Baudin (2001, p.54) proposes that the cycle time of the
bottleneck station should be equal or multiple of other stations. Then resource
allocation would be pretty simple too because the resources are divided with the
same share than the multiples of station times. To achieve such accurate and
detailed station times, a very comprehensive production planning and schedul-
ing for assembly line must be conducted.

21
These traditional viewpoints presented above indicating that all stations must be
equally equipped with respect to machines and workers is not often applicable
in real-world variable assembly lines. The average task time ensures that the
cycle time is sufficient to perform all tasks on average but even in an optimal
solution considerable inefficiencies such as work overload or idle time may oc-
cur. There are also many restrictions and constraints related, such as flexibility
requirements, problem solving, technological capabilities or position in assem-
bly work. (Becker & Scholl 2006, p.697)
Table 2.1 shows an example of assembly line balancing problem and a tech-
nique for capacity calculation for every workstation. First average standard
times for all existing workstations must exist and takt time needs to be calculat-
ed based on demand. Additionally, allowance percentage or desired productivity
is needed in order to get the planned cycle time for a certain available time pe-
riod. In the example, daily demand is 20 for the day’s production. The allowance
percentage compared to the takt time is set to 80% so that 20% of time is re-
served for problem solving, training or other inefficiencies which are not taken
into account in standard times. In comparison Toyota usually balances their
highly efficient high-volume facility to 95% of allowance time but there process-
es are stabilized and leaders are taught to solve problems efficiently (Lane
2007, p.144).
Table 2.1. Assembly line balance calculation (modified from Stephens & May-
ers. 2010, p.111)
The system above is modified for low-volume environment and manual assem-
bly work. In this example the system is very inflexible because only average
workloads are used and other balancing options are not handled. The times are
presented in minutes and hours instead of seconds which are usually used in a
Daily demand 20 18,5
Time available (min) 480 4
Desired allowance/productivity percent 80 % 74
Takt time (min) 24,0 1
Planned takt time (min) 19,2 100,0 %
0,308
Operation
No.
Average time
standard for
one product
Number of
workers,
stations or
machines
Rounded
up
Cycle time
per station
or machine
Load
Hours per
unit per
worker
Max
units
per
day
Total
productivity
(compared to
100% time)
A1 102 5,31 6 17,0 91,9 % 1,850 22 71 %
A2 99 5,16 6 16,5 89,2 % 1,850 23 69 %
A3 74 3,85 4 18,5 100,0 % 1,233 20 77 %
SA1 80 4,17 5 16,0 86,5 % 1,542 24 67 %
SA3 77 4,01 5 15,4 83,2 % 1,542 24 64 %
SA4 50 2,60 3 16,7 90,1 % 0,925 23 69 %
A7 118 6,15 7 16,9 91,1 % 2,158 22 70 %
T ota l 600 36 11,100 69 %

22
conveyer based production. The number of stations is presented also in number
of employees on one station which is more common in industrial low-volume
assembly work. With these values it is possible to calculate the number of sta-
tions, machines or employees in workstation. (Stephens & Mayers 2010, p.111)
The assembly line set up in this example is the same as in case company, but
the values are made to demonstrate assembly line balance problem. Sub-
assemblies are presented with SA and main assembly line stations with A, and
the sequence of the assembly is from top to down. The average time standard
is presented in the second column for all stations and in variable imbalanced
production those can vary significantly, because normally the layout is planned
more according to product structure than equal amount of work for every sta-
tion. In this example the total cycle time is 600 minutes, which means that it
takes 10 active hours to assemble an average product. Number of workers is
calculated by dividing the average time standard by planned cycle time for each
station. In the next column the computed amount of workers is rounded up to
the next whole number because the idea is to seek for the right head count and
if rounded down the demand or rate targets would not be reached. The assem-
bly line cycle time is presented in the fifth column by dividing the time standard
by the number of workers.
Workstation A3 has the highest cycle time and it is the bottleneck station of the
example. Bottleneck stations are marked as 100% station in balance calcula-
tions which present the place of the current maximum workload of the assembly
line. However, it does not mean 100% productivity because it would be calcu-
lated from the total time available and actualized working hours and here actual-
ized work hours are not concerned. The balance load percentages of the other
stations are calculated based on the workload of the 100% station and the
numbers tell how busy each workstation is compared to the bottleneck station
(Stephens & Mayers. 2010, p.116). The idea of this table is to determine the
amount of employees needed for workstations with given starting values and
the balance situation of the assembly line. The result seeks the minimum num-
ber of employees in order to balance the assembly line with current process
setup by using only average standard times. The numbers can be compared to
actual current situation for indicative action plans for changes. In the last col-
umn we can see that if the demand target is reached with given values the
productivity of the bottleneck station is 77% which is 3% lower than desired.
The total productivity of the assembly line would be only 69% (11% below de-
sired) when actualized standard times are divided by total day’s hours of the
employees. Even theoretical calculations cannot reach to better maximum val-
ues and it underlines the complexity of assembly line balancing for variable en-
vironments.

23
In the example we can see that assembly station SA3 employees work only
83% of time compared to the bottleneck station and the difference represents in
most cases waiting time or slowed pace of work. According to Stephens & May-
ers (2010, p.112) the cost of balancing is calculated from the difference of the
most loaded station compared to the least loaded or slowest activity. In the ex-
ample table the lowest load percentage is 83,2 % and the hours per unit is
1,542. The cost of balancing calculation is presented in table 2.2 with starting
values of volume for one year 10000 and the hourly rate 20€.
Table 2.2. Cost of balancing (modified from Stephens & Mayers. 2010, p.112).
There are many ways to develop the balance situation and productivity of the
presented situation in the example and as discussed before the first priority
should concern on actions for bottleneck station. If there are more employees
added to 100% station when A1 with the second highest load of 92% will turn to
100% station. This improvement will affect all stations with an approximately 8%
increase in load percentage (except A3), and the assembly line will be more
balanced and faster. By adding that one extra person to the 100% station would
save approximately 8% for 32 workers, which is equal to the workload of 2.6
employees. The best balance with these kinds of calculations is the lowest total
number of hours per unit and not the productivity because it is related to com-
pleted standard hours. Another method is to make bottleneck operations more
effective by decreasing the amount of inefficient non-value added activities.
(Stephens & Mayers. 2010, p.113)
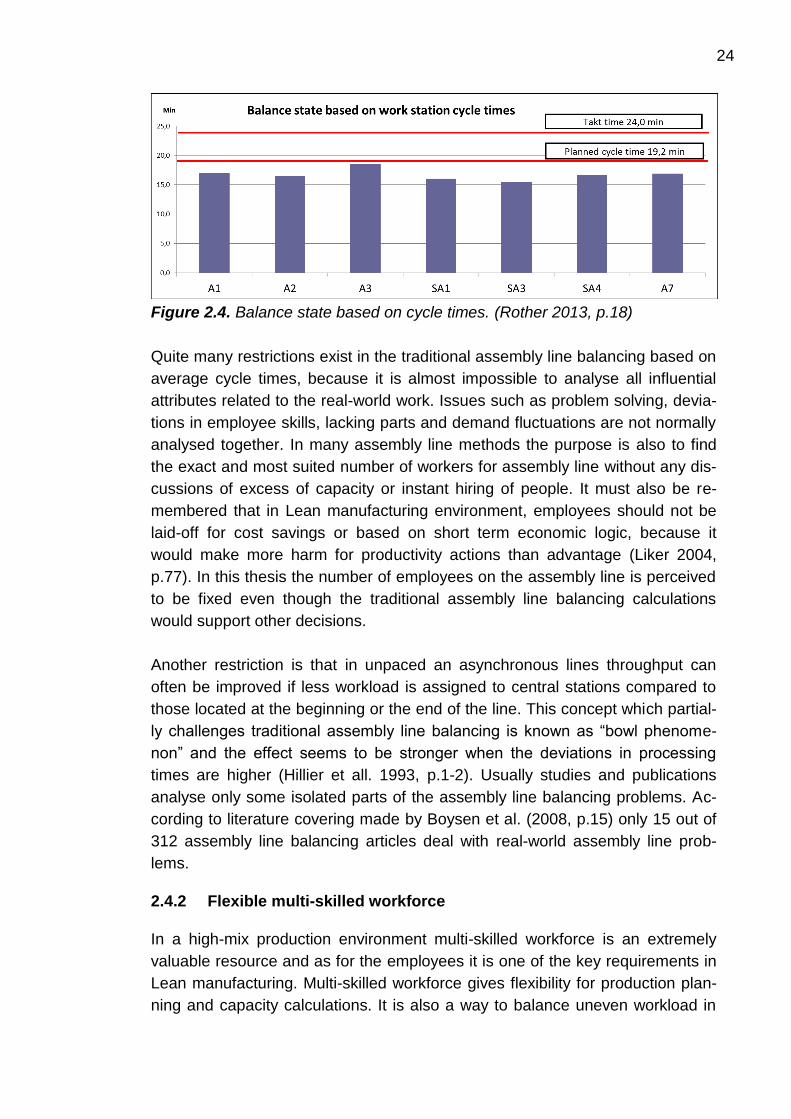
The traditional form of presenting assembly line balance situation is histogram
graphs. Figure 2.4 presents the balance state of the previous example based on
the cycle times. The pillars can easily be compared to each other as well as
both to the customer takt and the planned cycle time. (Rother 2013, p.18)
Balanced cost (hours per unit
for the lowest loaded station) 1,54 hours
Individual cost (83,2% x 1,54) - 1,33 hours
Hour per unit savings 0,21 hours
Units per year x 10000 pieces
Hours per year 2083 hours
Cost of an hour x 20 euros
Savings per year (euros) = 41667 euros
24
Figure 2.4. Balance state based on cycle times. (Rother 2013, p.18)
Quite many restrictions exist in the traditional assembly line balancing based on
average cycle times, because it is almost impossible to analyse all influential
attributes related to the real-world work. Issues such as problem solving, devia-
tions in employee skills, lacking parts and demand fluctuations are not normally
analysed together. In many assembly line methods the purpose is also to find
the exact and most suited number of workers for assembly line without any dis-
cussions of excess of capacity or instant hiring of people. It must also be re-
membered that in Lean manufacturing environment, employees should not be
laid-off for cost savings or based on short term economic logic, because it
would make more harm for productivity actions than advantage (Liker 2004,
p.77). In this thesis the number of employees on the assembly line is perceived
to be fixed even though the traditional assembly line balancing calculations
would support other decisions.
Another restriction is that in unpaced an asynchronous lines throughput can
often be improved if less workload is assigned to central stations compared to
those located at the beginning or the end of the line. This concept which partial-
ly challenges traditional assembly line balancing is known as “bowl phenome-
non” and the effect seems to be stronger when the deviations in processing
times are higher (Hillier et all. 1993, p.1-2). Usually studies and publications
analyse only some isolated parts of the assembly line balancing problems. Ac-
cording to literature covering made by Boysen et al. (2008, p.15) only 15 out of
312 assembly line balancing articles deal with real-world assembly line prob-
lems.
2.4.2 Flexible multi-skilled workforce
In a high-mix production environment multi-skilled workforce is an extremely
valuable resource and as for the employees it is one of the key requirements in
Lean manufacturing. Multi-skilled workforce gives flexibility for production plan-
ning and capacity calculations. It is also a way to balance uneven workload in

25
different workstations when employees change places according to the needs
from fluctuations in workloads. In chapter 3.1 assembly line balancing was pre-
sented based on average workloads of workstations but this method does not
recognize the need of flexibility of high-mix production.
There is an example figure 2.5 which represents workloads of four different
workstations during four periods in a paced assembly line. The example is pre-
sented in a paced and synchronised system without buffers so that the figure
highlights differences of variable station times. All the stations have as much
work but it is unevenly divided during the 4 periods. The assembly line is bal-
anced between average workloads as presented in the previous chapter, but
here time and period dependent variances are presented as well. The workload
can fluctuate at least in four different ways which are a) product mix, b) work-
stations differences, c) variances in workstation cycle times and d) differences
in period total times. Of course changes in demand, problems and many other
factors can also influence on balance situation. A more detailed table with
source numbers for this example is presented in appendix 1.
Figure 2.5. Time depended variances in high-mix production.
a) Variances in product mix mean the differences between total cycle times.
Some models with many customized options are simply much more labour-
intensive than basic products. However, in the example figure every product
has the same total cycle time of 12 but only unit 4 is demonstrated from the be-
ginning to the end. b) Workstation differences mean the variances between cy-
cle times compared to other stations. As mentioned in this example this factor is
also simplified so that the sum of all stations is 12 hours for these 4 periods. c)
Variance in workstation cycle times mean the range from the minimum time to
maximum time of the workstation, which normally depends on the optional at-

26
tributes. In the example presented, both the difference compared to other sta-
tions and the workstation variance range is from 2 to 4. d) Fluctuation in work-
load between periods is also a very important factor which will be analysed
more in-depth in chapter 2.4.5 production levelling. In the example figure it is
clearly visual that different time periods have high cycle time variances from 9 to
15 time units.
When workstation workloads considerably fluctuate between products it makes
little sense to daily rearrange or remove physical workstations. Instead, a more
logical solution is to adjust the number of flexible labour resources so that no
idle time is generated and productivity increases (Hobbs 2011, p.233). In these
kinds of cases presented in figure 2.5 multi-skilled employees are an excellent
way to balance the workload between all employees. For example during period
1 all stations should have an equal amount of employees which is 25% per sta-
tion. When products move forward to period 2 it must be ensured that work-
station 2 has more employees than average because of the higher workload.
During period 3 the total workload is very high but workstation 3 has only 3 time
units and its multi-skilled employees can be allocated to other stations with
more labour-intensive products. During period 4 workstation 3 should instead
have double the amount of resources compared to workstation 2. These balanc-
ing actions described above in highly variable environment would not be possi-
ble without multi-skilled employees who change place based on the standard
time requirements.
Planning a system in order to manage a flexible workforce can be difficult and it
has a lot of restrictions. There must be right standard times and enough time for
each job so that tasks can be performed. The employee must also have the
right skills for the specific job while materials also need to be available when
labour resources are changed between workstations. The most challenging part
is creating a culture of self-management so that people know what tasks are to
be fulfilled and that they are aware of the boundaries. Employees need to be
able to move from one workstation to another without missing a beat. (Lane
2007, p.74)
In order to promote self-management among workers, leaders must work to-
ward becoming leaders, coaches, mentors or advisors rather than remaining in
the role of authoritarian bosses. They need to be ready to step in and help. That
is the way how operators and line leaders learn how to balance their own work
as different products ought to flow through production. The workers in the work-
stations where the complex or variable tasks are completed must be multi-
skilled so that they can perform whatever special or unusual tasks are called
for. One option for managing resources is to create a team of “floaters” who are

27
always ready to help the currently highest loaded station. (Larco et al. 2008,
p.48, p.60, p.86)
There are many restrictions in using multi-skilled workforce as a balancing
method. First of all management must have a proper competence matrix so that
they know who have abilities and willingness to do different tasks (Lane 2004,
p.146). When there is more than one worker in a workplace performing tasks
related to the same workpiece simultaneously, the workers obstructing each
other should be avoided. This can be achieved by a detailed production plan-
ning or subdividing the workpiece to responsibility areas. (Becker & Scholl
2009, p.361)
There are also differences in skills and all employees are not able to perform
tasks in the required standard time. When using multi-skilled employees the
worker should always be able to meet the standard time. Coromias et al. (2008)
suggests that if a task is done by a skilled worker the normal standard time
should be used but if it is assigned to unskilled worker the standard time should
be multiplied by a factor greater than 1. Another solution to this problem is that
the employee’s capacity is calculated by a factor under 1 person in the case of
an unskilled or a temporary worker.
Another restriction consists also of the employees’ change resistance and of
motivational factors. For these issues an adequate awarding system should be
in place so that multi-skilled workers would truly be motivated to change places
and improve their skills. If multi-skilled employees are used as one of the bal-
ancing methods a good controlling system is necessary to support the deci-
sions. However, establishing such awarding system is a true challenge for a
high-mix environment where the production situation is quite unstable and hard
to measure reliably. Problems related to instant “hiring or firing” also prevail
when it comes to capacity requirements as was already discussed in the previ-
ous chapter.
2.4.3 Pre-assembly for optional modules
In order to forward products near to the same pace on mixed-model assembly
line all the station times must be matching at each station. This can be done by
changing more work to subassembly lines from the products which standard
times are over takt time (Baudin 2002, p.113). Pre-assembly is a balancing al-
ternative to level out the peaks in the workload so that optional modules are
assembled already beforehand and the workload in the main assembly line
would be as smooth as possible at all times. Pre-, and subassemblies create
more flexibility in production scheduling because the assembly does not have to
be performed at the same time with the main assembly line. Of course just-in-

28
time principles with minimum inventory and work-in-process must be planned,
but it is not that exact if the parts are only available on time for the main assem-
bly line. When workload is more even it is much easier to create a flow for the
main assembly line.
Assigning tasks to preassemblies is known also as horizontal balancing for
mixed-model assembly lines. The idea is to minimize variances in station times
over all models. This will reduce difficulties in sequence planning and reduce
overloads or idle time in the assembly line. (Merengo et al. 1999, p.2839) There
are three different methods to perform and measure horizontal balancing in the
mixed-model assembly line. The first alternative objective is to minimize the
sum of absolute differences compared to the average station time (Thomopou-
los 1970). A second alternative is to minimize the maximal deviation of station
time of any model compared to the average station time. A third option is to
minimize the sum of cycle time violations of all models in all stations. (Becker &
Scholl 2008, p.708)
The assembly line needs to be loaded so that all stations are always full and
subassembly stations make no exception. These must be scheduled by calcu-
lating backward from the time each subassembly will be needed in final assem-
bly. This creates a cascading linkage backward time from main line to sub-
assembly stations and their possible subassemblies. On the other hand it may
be possible to plan subassemblies without affecting the final assembly as long
as they are completed before the time they are needed. In order to secure that
subassemblies are available when needed the work must begin far enough in
advance. Software used in production scheduling must be capable of making
the calculations for subassemblies too. The controlling of preassemblies can be
compared to making a menu by a chef who needs to start cooking servings at
different times so that they are all served at the same time when needed. (Larco
et al. 2008, p.79, p.100)
When assembly is moved to be preassembled from the assembly line it is im-
portant to also think about make-or-buy decisions. For example outsourcing can
be the best alternative for the subassembly work. Pre-assembly can also be
used by totally opposite way by returning some tasks from pre-assembly to
main assembly line. If there is a low workload at any assembly line main station
it is possible to enrich he workload with additional work from pre-assembly or
from suppliers to the main line. (Baudin 2002, p.113)
2.4.4 Different routings for variable products
Routing is referred to be the sequence of steps required to assemble a single
product. The product is routed from the first assembly station to the second sta-

29
tion and further until the product is finished. Assembly charts are used to show
the sequence of these steps. The sequence of assembly may have several dif-
ferent routing alternatives and time standards are required in order to decide
which assembly sequence is the best. (Stephens & Mayers 2010, p.107)
One balancing method is to change the layout so that it enables assembly line
to adapt to variable standard times of products. This can be done by arranging
different routings or even a totally separate part of the assembly line for more
special product modifications. The main line would do all the standard work and
the alternative routing would operate on more customized versions. Alternative
routings will mitigate the fluctuation of standard times and help in production
planning if takt times of all workstations would constantly be more even regard-
ing workloads. Products that require extra steps are sent to alternative paths
and then they rejoin the main line later when customized options are assem-
bled. This could be compared to scheduling local trains that stop every station
and express trains that stop only in large cities (Larco et al. 2008, p.51).
The different routings can be arranged for example by duplication of work-
stations so that they work parallel side by side in an assembly line. In duplicate
stations the work does not usually start at the same time because of varieties in
processing times, random problems and repair times. In this case buffers are
needed in front of and behind of duplicated stations because it is extremely hard
to schedule the production so that all assembly areas would be full. With paral-
lel stations it is possible to decrease the unproductive portion of the planned
cycle time. (Becker & Scholl 2006, p.701)
The method is pretty much the same than in the pre-assembly alternative pre-
sented before but different routings come to in case when the assembly must
be done directly to the product when pre-assembly is not possible. Different
routings or new secondary assembly line may require lot of planning for layout
and scheduling. It can also be done with very simple decisions on how the work
is arranged in workstations. For example it is sometimes possible to arrange
more space inside a workstation so that more products are assembled at the
same time and enables a situation that a standard product can overtake more
complex one when the waiting time is minimized. If there is already a parallel
assembly in a workstation it can be decided that the other workplace only con-
centrates on more complex products and the other one on standard versions.
The risks related lacking parts or quality problems do not affect the assembly
line so much when there is more than one unit in-process in production.

30
2.4.5 Sequence planning to level out the workload
This chapter discusses production levelling, production smoothing, mixed-model
sequencing and other terms referring to production queue’s sequence planning
as one assembly line balancing method. Planning production order is in many
assembly line balancing theories presented as the only method to balance pro-
duction for the variable production or mixed-model assembly line, but the topics
often are then more often concentrated on high volume production. Assembly
line balancing and sequencing problems are closely interrelated. However,
probably due to the computational complexities involved, these two problems
are usually addressed independently of each other. (Fernandes & Groover
1995)
There are two basic objectives in model sequence planning when studied from
different perspectives. The first objective is to minimize work overloads or idle
time, which occur when there are fluctuations in station times. For this objective
the approach is mixed-model sequencing, which aims to avoid sequence de-
pended work overloads based on detailed scheduling. This approach studies
operation times, worker movements, station requirements and other operational
characteristics. The second objective is to level part usages in order to support
just-in-time objectives because of deviations in material requirements. The ap-
proach for this problem is level scheduling according to demands and material
needs following lean and just-in-time principles. Model sequences are planned
with such a manner that material usages are as smooth as possible. In this
study the focus is on the first objective, mixed-model sequencing, but some
techniques from just-in-time principles do also apply for smoothen capacity utili-
zation. (Boysen et al. 2009, p.350)
The first assembly line balancing method presented demonstrates that cycle
times need to be determined by observing average station times over all mod-
els. This is also labelled as a reduction to single-model problem. As a conse-
quence, the station times of some models are longer than the planned cycle
time, whereas those of others are shorter. Whenever multiple labour-intensive
models, follow each other in direct succession at a specific station, a work over-
load situation occurs. In such situations, workers are not able to finish the prior
products in time and the cycle time or the planned cycle time might be exceed-
ed. Line stoppage, utility workers, off-line repair or higher local production
speed at the station are examples of reactions to compensate the overload. A
more proactive way to avoid overload is to find a sequence of models which
balance the workload by altering high station times to less work intensive ones
at each station. Planning the production sequence for a short term product mix
is a way to minimize the overloads in workstations and better assembly line bal-

31
ance can be achieved. The amount of overloads by itself is also one measure of
efficiency of the assembly line balance. (Boysen et al. 2008, p.4; Boysen et al.
2011, p.4736)
As discussed in chapter 2.4.3 related to pre-assembly, horizontal balancing has
a great influence on sequence planning. The better the horizontal planning,
meaning less variance in mixed-model line station times, works the better re-
sults are possible from short term sequence planning. The objectives of mixed-
model sequence problems arise per shift, day or week with particular demand
and volume of different models. (Becker & Scholl 2006, p.707)
The next four different types of methods with different timeframes to level out
the workload are discussed for a built-to-order environment. The methods do
not exclude each other but are just used in different occasions in queue plan-
ning. The first queue planning method starts already before the orders and the
last is used already when the product is on assembly line. The sequence plan-
ning systems for different timeframes are:
1. The product is allocated with predetermined slot-based levelled sequence
2. The production sequence is levelled according to time of delivery
3. Short term daily production and sequence planning
4. Self-management of the next chosen product from the buffer
In the first timeframe the sequence decisions are already made before the actu-
al order is received. Products are scheduled according to predetermined pro-
duction sequence and received orders are allocated with a slot-based system to
the next available free slot. At the same time the predetermined slot-based sys-
tem defines the capacity and the resource constraints. The slots can be based
on a specific product model or the total cycle time of the product.
Production levelling is planning with the aim to get a balanced total workload,
volume and product mix for production. In lean manufacturing production level-
ling is known also with Japanese term “heijunka”. In levelled production prod-
ucts are not built according to the actual flow of the customer orders but it takes
the total volume of orders of a certain period and levels them out so that the
same mix is made each period. Achieving heijunka is fundamental to eliminating
unevenness (mura), which is, in turn, fundamental for eliminating overburden
(muri) and non-value adding activities (muda). When production levelling is
planned and executed effectively the assembly line will theoretically balance
itself after the planned period and resource calculations will thus become sim-
pler. Through this method, flexibility also increases for customers and demand
is smoothened for upstream processes for suppliers creating less inventory.
(Liker 2004, p.114-116)

32
The next timeframe for the sequence planning is set to after the orders are re-
ceived. The queue should be planned according to received orders for a given
time period. In variable production environment this system is called mixed-
model sequencing. The purpose is to find a sequence where work overload and
idle time is minimized. The basic idea is to allocate labour-intensive and more
simple products consecutively. In a mixed-model line this can simply be done
with a total cycle time or by taking into account all variations in all workstations.
This sequence planning is done for a certain time period and it aims to balance
the sequencing periods compared to each other. There is a vast number of pub-
lications for calculating the most effective way to sequence mixed-model as-
sembly lines but in some fields of business the product variety is simply too
large to allow reliable calculations. The only reliable estimation in this field is a
prognosis of single customized options which influences the most for assembly.
Following this prognosis or the determination of the option occurrences, a joint
precedence graph must be made to imply how it really affects the assembly line
workstations. This mixed-model sequencing method based on estimations of
option occurrences is not necessarily the most efficient but it is the most reliable
for very large varieties of products. (Boysen et al. 2008, p.5)
The third timeframe for queue planning is just before the production starts. The
input for this timeframe is the planned sequence, but in real-world assembly
systems there are always exceptions and restrictions compared to ideal se-
quence. This short term production planning takes available material, quality
problems and current production situation into account. The idea is to re-
schedule the sequence according restrictions with best possible way. For this
purpose a flexible scheduling programs are very advantageous.
The last chance to arrange the sequence is when the products are already in
production. The idea is that supervisors and employees would have self-
management to choose correct products from the buffer so that the workstation
is not overloaded with labour-intensive products for long time. The system is
applicable only if there are more than one product in buffer. This system re-
quires that standard times are visually available and employees would have
basic production planning knowledge.
There are many restrictions in using production levelling for the high-mix –low-
volume production system because it is so vulnerable for problems. The chang-
es in work queue because of lacking parts or quality problems must be easily
recalculated. Assembly should not be started if all parts are not been received
from suppliers and then the work queue must be changed. That will mix up the
well planned sequence and then queue levelling will not work as a balancing
method anymore.

33
In production levelling for mixed model assembly line it is not only the total cycle
time which needs to be concentrated but the whole mix. As presented in 2.2 the
total cycle time is not normally divided evenly to workstations but the custom-
ized options define the real situation workstation specifically. For example in
some cases the station time can be very low even though the total assembly
cycle time would indicate very work-intensive product. In next section in-process
inventory is discussed and that can be used together with production levelling
effectively because it reduces the need of accurate calculations. Together
mixed-model sequencing and buffers are an effective way to balance assembly
line and in creating flow in high-mix environment.
2.4.6 In-process inventory to avoid idle time
In unpaced and asynchronous assembly lines workpieces are always moved as
soon as the operations are completed at a station. After transference the station
starts to work with the next unit, unless the preceding station is unable to deliver
it. To minimize waiting times in asynchronous lines, buffers needs to be in-
stalled in-between stations, which can temporally store workpieces for in-
process inventory. Synchronous assembly line works with the same beat and
in-process inventories are needed only for exceptions and flexibility. (Boysen et
al. 2008, p.9)
Using in-process inventory in the assembly line is more like traditional mass
production thinking than lean, but in mixed-model assembly line balancing it is a
good way to smooth peaks in cycle times and it gives flexibility in case of prob-
lems. Buffers can also be used as a visual production controlling method. Buffer
places helps to visualize work-in-process workloads and identify where too
much capacity or manpower is available (Lane 2007, p.92). The inventory can
be used to maintain the targeted takt time when a process is incapable of
achieving the takt time rate (Hobbs 2011, p.232). There is also a trade- off be-
tween installation costs (productivity) and achievable throughput when installing
buffers, because the latter usually increases when more buffers are installed
(Boysen et al. 2008, p.9) Buffers naturally increase work in process level but at
the same time it ensures that all workstations have work to do and decreases
waiting times. In a highly variable production environment buffers can together
with production levelling reduce overloads and improve smooth material move-
ment. Naturally, the most important thing is to create a flow for production.
There are two restrictions related to buffers between workstations when they
are used as a balancing alternative for an unpaced mixed-model assembly line.
The first one is blocking, which occurs when the downstream buffer is full and
the station cannot move completed units forward. Another problem is starving,

34
which occurs when idle time is generated because upstream buffer is empty.
These problems can be solved by assigning more buffer places or by concen-
trating on more detailed production scheduling. (Merengo et al. 1999, p.2843)
In the lean environment it is important to define rules for the buffer places so
that no excess inventory and overproduction is generated. In lean manufactur-
ing this is normally controlled with kanban -systems which indicate the material
needs for products. In a mixed model assembly line another way to indicate the
needs is a constant work in process –system (CONWIP) which is based on
more queue sequence than the amount of certain parts or materials. In a
CONWIP -system the in-process inventory is controlled by the consumption by
a demand. The production of the next unit in queue is triggered only when the
next station has finished its work. The CONWIP systems have been found to
have superior performance especially in variable environments compared to
other systems with respect to the average work-in-process level, variability of
processing times. CONWIP has also been identified to be easier to control and
have a shorter lead time than kanban systems due to the better management of
customized work in-process products. (Pettersen & Segerstedt 2009, p.206)
2.4.7 Assignment of identical tasks to different stations
On multi-product or mixed-model assembly line the normal system to assign
tasks to different workstations is to examine precedence diagrams and product
structures. Normally there are common tasks between products that are always
performed in the same stations. However in case of optional features it is possi-
ble to seek the shortest-route formulation and assign tasks to different stations
in order to optimize current production balance. In this method identical tasks
are performed in different stations so that the assembly line balancing would be
done in a product specific way. The objective is to decrease the station time
variances in a high-mix assembly line. The method for this system is to use
combined precedence diagrams and the optional modules would be assigned to
the lowest loaded station based on production sequence. Another option is to
find the best possible task assignment solutions separately for all the different
models by using computational minimization of variances between station
times. (Erel & Gokcen 1999, p.195)
One suggestion is also to plan standard times based on time-slots by dividing
and combining different task times to fixed standard time for modules. For ex-
ample with fixed 10 minutes module times it is easier to assign tasks to different
stations and balance the line simultaneously. This would require lots of standard
time planning, possible layout changes and strict modularity from the products.
However, it is reminded (Boysen et al. 2008) that investments made for assign-
ing similar tasks to different stations can be considered an improved balance,

35
for instance in form of lower cycle time from the bottleneck stations. There is a
trade-off between higher investment costs and potentially higher output that
should be regarded in mixed model assembly line balancing.
In order to eliminate the idle time, it is also important to consider tasks which
are totally different from the usual ones and not directly related to the product.
If waiting time occurs due to the variances in station times some other tasks
could be offered for the employees. The tasks should necessary, yet not de-
pendent on where or when their fulfillment should take place. There should al-
ways be an alternative plan in order to avoid decrease in productivity. For in-
stance, one could think of many small tasks related to material handling which
would ease the work of assemblers.
According to Becker & Scholl (2006, p.707) the method of assigning identical
tasks to different stations is not usually a desired alternative, because of its var-
ious restrictions. There are station related constraints, assignment restrictions,
additional facility requirements, loss of specialization effects, complicated pro-
duction control and setup inefficiencies. It is also very hard to allocate resources
when tasks can change workstations. Planning identical tasks is yet another
attribute to an already complex production scheduling and the factor must be
monitored carefully. Moreover, restrictions exist in relation to the planning of
efficient logistics for different workstations. The internal logistics should be
planned product specifically so that parts are always provided to the correct
workstation.
2.4.8 Work time arrangements
In some cases it is easier and less costly to manage only one shift, particularly if
running a second shift means an extra support structure and time premiums. An
additional bonus is that the waste of waiting is easier to see and eliminate when
takt time is shorter. (Rother & Harris 2001, p.16)
When labour force or demand is very low the employee allocation can be diffi-
cult because there are not enough people to every workstation in multiple shifts.
Some of the tasks may even require more than one person in order to be per-
formed, which further complicates the capacity calculations. It is more difficult to
match the assembly line balance calculations to the real-world requirements in
practice if the task requires that it is made in pairs.
For example if there are only 10 people in an assembly line of five equal sta-
tions, but one of the stations always requires a minimum of two people for a
safe performance. It is very hard to balance the line equally for all employees in
a two shift system because the special system would require in total two people

36
in the first shift and two people in the second shift. Only 6 employees would re-
main for 4 stations worked with two shifts. This could naturally be balanced with
flexible multi-skilled employees or better workstation planning, but it is not al-
ways possible. In a one shift- operation, all stations would constantly have peo-
ple and the line would thus easily be in balance.
2.4.9 Continuous improvement of current bottleneck station
Developing a bottleneck station should always be the first priority in assembly
line balancing and production planning in general. It is the most crucial work-
station and determines the maximum speed of the whole assembly line. Waste
elimination from a bottleneck station is a very effective way to improve the
productivity of the whole production. This section will concentrate on these key
Lean manufacturing principles as a balancing alternative to improve the flow of
assembly line. (Stephens & Mayers 2010, p.111)
It is important to concentrate very carefully on bottleneck stations in production
scheduling. Furthermore, it is necessary to plan the sequences and the sched-
ules so that the workload is high and stoppages in other stations would not ef-
fect on bottleneck station. Waiting time and lost production in the bottleneck
station is directly decreases the whole factory’s production. (Haverila et al.
2009, p.418)
This ninth alternative is like a combination of all other alternatives, but the focus
of balancing is only on the bottleneck stations. Actions related to bottlenecks
were discussed in the previous balancing alternatives too, but many authors
consider waste elimination also as a way to improve balancing situation of pro-
duction. The idea of this alternative is to have continuous actions to eliminate
waste from the present the bottleneck station so that it meets takt time targets
or the level of average target time. After bottleneck station development the cy-
cle time is reduced and the bottleneck station may change place. The develop-
ment projects are then continued at the next bottleneck station in order to make
it more effective. After several development projects at different bottleneck sta-
tions the production will almost automatically become more balanced. The
analogy of this assembly line method is presented in figure 2.6.

37
Figure 2.6. Developing bottleneck stations as an assembly line balancing
method.
A few examples on how to calculate productivity improvement and cost savings
were presented in chapter 2.4.1. In the example the bottleneck time decreased
5 minutes in total, which means that all workstations need to complete the task
5 minutes faster. If there were 12 workers on the assembly line of the example
the saved time would total 60 minutes for each product. If the volume can be
increased at the same time to new maximum capacity defined by the bottleneck
cycle time, the cost savings could be calculated by multiplying the saved time
with the amount of products. For instance, this 60 minutes saving for 5000
products in a year would be 5000 hours. The saving in time would mean better
throughput or with a 20€ hourly rate 100 000€ savings, again if the throughput is
kept at the maximum level. This is done simply by decreasing the bottleneck
cycle time which will at the same time eliminate waiting time from the other sta-
tions.
A bottleneck can be easily determined in a high volume assembly line if visual
buffers have predetermined sizes. In low-volume it is not that clear. The first
thing to do is to gather some data to clarify the situation or to discover how the
bottleneck changes depending on certain quantifiable or measurable conditions.
(Lane 2007, p.71)

38
There are many ways to improve the efficiency of bottleneck station. The core
idea is to minimize non-value adding value of the work content and to maximise
the work, that the customer is really willing to pay for. In lean manufacturing this
is called waste elimination and there are various different techniques and tools
available presented by numerous authors and benchmarked companies. One of
the most important principles is that assemblers should concentrate only on as-
sembling and materials should be handled by logistics. The cycle time of the
bottleneck station may be shortened dramatically if material handling is totally
changed for responsibility of logistics. Baudin (2002, p.113) suggests that as-
sembly line should be balanced by adding more automation to the bottleneck
station of mixed-flow lines especially if the workloads fluctuate much. Further-
more, improving modularity and the structure of products in order to ensure the
most efficient assembly as possible is also a good way to shorten cycle time of
bottleneck station.
Development actions for bottleneck stations have many advantages but also
some restrictions as an assembly line balancing method. The most significant
positive aspect in developing bottleneck stations is that it really improves effi-
ciency of the assembly line. The other methods concentrate on equalizing work-
load between stations but do not effect on the real work content and non-value
added activities instead of waiting waste. The restriction of this alternative as an
assembly line balancing method is that in variable environment the bottleneck
may change place for different products. The alternative suits best for dedicated
lines where there is normally only one constraint. Even good results from devel-
opment actions can cause more waiting and idle time if they are concentrated
on station which is not bottleneck station. For instance in graph 2.6 actions fo-
cused on AS 4 will not improve the efficiency of the line and will only cause
more waiting for the station if any other balancing actions are not made.
2.5 Synthesis of assembly line balancing for high-mix, low-volume production
Nine different assembly line balancing methods were presented in chapter 2.4
and they are also used as alternative solution ideas for the case company. The
most important finding was that assembly line balancing for the high-mix as-
sembly line must be a combination of both vertical and horizontal balancing.
Another finding is that most of the balancing methods are closely interrelated
and it is difficult to specify the boundaries for each balancing action introduced.
Table 2.3 summarizes all these nine methods with a short description and a list
of main sources used.

39
Table 2.3. Assembly line balancing methods
Assembly line balancing method Summary of the alternative idea Main sources
Assembly line balancing based on average sta-tion times
Calculation of workstation average cycle time and allocation of correct number of employees to workstations. This is also called as a reduction to single model as-sembly line balancing problem because it does not take account any variability of different models.
Stephens & Mayers 2010 Thomopoulos 1970 Becker & Scholl 2006
Flexible multi-skilled workforce
Employees are used as flexible resource to balance the assembly line by changing workstations according to fluctuating work-loads.
Larco et al. 2008 Coromias et al. 2008 Lane 2004 Hobbs 2011
Pre-assembly for optional modules
Assembly line standard times are smooth-ened with horizontal balancing, which aims to reduce variances in station times. Op-tional modules are assigned to pre-assembly stations so that work overloads and idle time would be minimized.
Merengo et al. 1999 Baudin 2002 Larco et al. 2008
Different routings for variable products
Different routings are designed for products with variable waiting times so that waiting times are minimized. Solutions include par-allel workplaces and separate assembly lines for complex and standard products.
Stephens & Mayers 2010 Larco et al. 2008 Becker & Scholl 2006
Sequence planning to level out the workload
Occasional work overloads and idle time are minimized with leveled production se-quence. Mixed-model sequencing aims to situation where models with high pro-cessing times alternate with less work-intensive ones at each station.
Boysen et al. 2008, 2009, 2011 Liker 2004 Karabati & Sayin 2003 Merengo et al 1999
In-process inventory to avoid idle time
Buffers are used to avoid idle time in un-paced and asynchronous mixed model assembly line. Buffers can also be used as a production control method with CONWIP system, which supports continuous flow and assembly line balance.
Boysen et al. 2008 Pettersen & Segerstedt 2009
Assignment of identical tasks to different stations
Idea is to assign optional tasks to different stations based on the best possible line-balance situation. Shortest-path formulation and additional tasks to minimize idle time are included to this method.
Boysen et al 2008 Becker & Scholl 2006 Erel & Gokcen 1998
Work time arrangements
Design the most efficient work time ar-rangement so that constant assembly line balance situation is considered. For exam-ple imbalance caused by safety require-ment or task restrictions can be solved by changing work times.
Rother & Harris 2001
Continuous development actions to current bottleneck station
Continuous elimination of inefficient working practices from current bottleneck station will eventually step by step balance the assem-bly line.
Lane 2007 Baudin 2002

40
The first balancing method is the vertical assembly line balancing activity that
divides the workload for employees for a longer period. There are numerous
articles related to different aspects for single model assembly line balancing that
aims to assign tasks and employees equally to workstations. For variable pro-
duction this vertical balancing must be made with average station times and the
method is called, in many sources, reduction to single model problem. The next
four methods aim to support horizontal balancing, where the idea is to decrease
the variability of standard times and station times in the assembly line. These
methods apply in shorter timeframes and require good controlling systems. The
last two methods are more production planning and scheduling related subjects
that impact upon the assembly line balance as well.
Many factors must be considered in the variable assembly line balancing and
no single solution exists that would directly fit to any real world assembly sys-
tem. Different theories are not able to provide any holistic or comprehensive
solution procedure that would take all variables into account. There must be a
sense of discretion when applying different solution ideas from the literature,
because the scope of the studies rarely matches with the case company. Even
research papers for variable environments have often very restricting assump-
tions regarding the studied assembly system attributes. The ideal situation is
normally presented as takt-driven production where product variances are min-
imized from the main assembly line. It is also difficult to generalize studies that
focus on only some specific product or part type. Most of the research papers
suggest only one or two approaches to balance the line, but it is often not
enough in case of reconfiguration of high-mix assembly lines. This conclusion
from the literature review reinforces the impression that the solution for the case
company of this thesis is going to be a combination of multiple balancing ac-
tions.

41
3 ANALYSIS OF DEMOUNTABLES ASSEMBLY
LINE
In this chapter the power series demountables assembly line is introduced and
analysed. The main advantages and problems are presented based on work
analysis and ten interviews. The most important topic of the current situation
analysis is to describe the balance situation of different workstations and of the
whole assembly line. Results and findings presented in this chapter are used as
a basis for actions for assembly line balancing together with assembly line bal-
ancing methods.
3.1 Production system in the case company
This thesis concentrates only on the assembly line of power series hooklifts.
Power series hooklifts can be further divided to five different product types: slide
(S), slide-low (SL), tilt (T), slide and tilt (Z) and slide-tilt-low (ZL). There are 10
different loading capacities between 14 to 30 tons. Demountables have also
many other variable options that can be categorized based on, for example,
length, valves, control system, oil tanks or container locking but the lifting type is
the most significant differentiation.
The Hiab Multilift power series demountables assembly line consists of ten
workstations. The production is based on thousands of variable modules and
their assembly standard times are calculated in several minutes. The work-
stations usually have their own product structure based responsibilities and the
amount of work significantly varies between products. Also the average work-
loads may differ between different workstations and can cause unequal amount
of work between employees. These attributes in high-mix, low-volume assembly
can easily cause problems for smooth production flow and lead to occasional
waiting in some stations to hurry next. Power series demountables production is
controlled by a sequence method where assembly queue determines the needs
and operation priorities for the whole supply chain.

42
Figure 3.1. Hiab Multilift Z-model.
Figure 3.1 presents Hiab Multilift Z –model and the numbers presents different
frames that also defines the assembly system of demountables:
1. Subframe
2. Rear frame
3. Middle frame
4. Hook frame
5. Slide frame, only in Z- models
The current demountable assembly line in Raisio was initially planned in 2005
and the layout was updated in 2008 and 2012. The scope of this study is the
bolded area of figure 3.2 that presents power range hooklifts production
flowchart. The assembly line consist four main assembly stations and three sub
assembly stations. There is also hydraulic pipe bending pre-assembly station
which is not on scope of this thesis because the pipes are bended more in a
batch production type and not in the same schedule as the products in assem-
bly line. The scope starts from buffer, which is after outsourced paint shop that
is located in the same facility right next to assembly area. Paint shop company
should always plan their production so that there are frames available according
to work queue of demountables assembly line. The first three main stations
(5101-5103) assemble all customer specific modules onto subframes and at the
same time subassemblies (5104-5106) prepare rear-, middle- and hook frames
which are then assembled together in the final assembly line (5107). Assembly
line ends to final testing where all products go through detailed inspection and
reporting procedures. Final testing where all hooklift models are tested is not on

43
scope because it does not always work with the same pace with power series
hooklift assembly line.
Figure 3.2. Power series hook lifts assembly line (modified from Stephens &
Mayers 2001, p.108)
Figure 3.3 describes the different variables in real world assembly lines, which
affects in assembly line balancing methods (Boysen et al. 2008, p.3). The main
aspects of demountable assembly line are presented in the scheme with five
different attributes. Mixed-model assembly line is based on the idea that all dif-
ferent options of big hooks are assembled on the same line. The line control
method is currently unpaced and asynchronous because there is so much vari-
ance between products. Unpaced line means that the workpieces are trans-
ferred when the required task is ready for the workstation and asynchronous
means that workstations decide on transferences individually (Boysen et al.
2008, p.8). This thesis also evaluates other alternatives of line control options in
production scheduling related sections. In this context, the frequency means
that the scope is reconfiguration of already existing line instead of planning a
new assembly line. The business is demountables production which has some
differences compared to the more commonly referred automobile industry.

44
Figure 3.3. Classification of scope from investigated kinds of assembly lines
(modified from Boysen et al. 2008, p.3)
The strategy of Cargotec and Hiab is to concentrate only on the final assembly
of products. In recent years part manufacturing and welding operations have
been outsourced and the focus of the factory is now on the efficiency of logis-
tics, quality and the final assembly of products. For this purpose the Hiab pro-
duction system (HPS) was launched in 2013 to assist as a roadmap for adding
value for Hiab’s customers. HPS is based on Lean philosophy and Toyota Pro-
duction system (TPS), but it is tailored for the needs of Hiab. (Cargotec Oyj
2013b, p.6)
The thesis is one of Raisio factory’s lean and HPS projects. Lean is for eliminat-
ing waste, reducing cycle times, increasing capacity, reducing inventory, in-
creasing customer satisfaction, eliminating bottlenecks and improving commu-
nications. This thesis concentrates on Lean manufacturing principles which are
more closely related to production and offers some tools to be implemented for
the demountable assembly line. The lean manufacturing tools that have already
been vastly used are 5S and just-in-time (JIT) methods. 5S is a housekeeping
method that aims at organizing, standardising and setting in order of everything
at workplaces. JIT is making available the right part at precisely at the right
time, and in right quantity, to go into the assembly. The JIT-production aims to
achieve minimum inventories with a pull system that is based only on material
needs. (Ohno 1982) The thesis focuses on assembly line balancing and produc-
tion scheduling, which both play an important role in Lean manufacturing. Lean
tools are used as a primary guideline for example subjects that relate to produc-
tion levelling, multi-skilled employees, visual management or takt time.
In lean production developing generally culminates to the elimination of three
different kinds of elements that affect all the inefficiencies in production. These
are called with three Japanese words that all start with M –letter; muda, muri
and mura. Muda is all the non-value-added activity that is further divided to
eight different inefficiencies called wastes. One of those wastes is waiting,
which is closely related to assembly line balancing and its elimination is also

45
one of the objectives of this study. The second “M” stands for muri, which is
overburdening people or equipment. Assembly line balancing affects this M too,
because the idea is to create a more stable and well-planned work environment.
The last M is for mura which means unevenness resulted from irregular produc-
tion schedule or fluctuation in volumes per time. Mura is the most interesting of
the three M’s for this thesis because the assembly line balance is improved
simply by eliminating unevenness and variation. There is mura whenever a
smooth flow of work, parts or production schedule is interrupted. All these M’s
affect each other and good results are achieved only by the elimination all them
together. (Liker 2004, p.114-115; Imai 2012, p.90)
Hiab is implementing lean in all of its operations. HPS aims to provide value for
customers and eliminate all forms of inefficiencies in Hiab operation with partici-
pation of all employees. It is done through continuous improvement and lean
philosophy offers the main tools to achieve the targets. HPS house (see figure
3.4) cornerstones safety, waste elimination, standard work and continuous im-
provement are based on these main Lean principles. Quality and on-time are
presented in pillars which enable and support customer satisfaction presented
in the roof. People are set to the centre of the house to present that they are the
enablers that make it all happen. (Cargotec Oyj 2013b, p.1)
Figure 3.4. HPS house (Cargotec Oyj 2013b, p.1).
The most significant part of this thesis concentrates on production balancing
and scheduling issues, which means that the on-time –pillar is the main focus

46
on the HPS house. In HPS booklet (Cargotec Oyj 2013b, p.28) on-time -pillar is
about managing value stream of the supply chain and just-in-time production
initially introduced by Toyota. In this thesis the scope is only in the assembly
line where the customer can be perceived to be the next station in the process.
The idea is to deliver the right product at the right time in the most efficient way.
There have been successive projects in the Raisio factory related to logistics
and outsourcing. In development projects for logistics especially order-handling
procedures were improved. This has led to a more just-in-time material handling
system. Certain key performance indicators show that the situation has signifi-
cantly improved in the long run and now also a more specific production control
is possible when material handling is more reliable. Outsourcing projects have
enabled production planning to concentrate more on the assembly line im-
provement. One big improvement action from recent times was the layout up-
date in 2012. The new layout supports the flow of the materials with more neat,
spacious and organised set up. Together all these recent projects offer a very
auspicious starting situation for this thesis, which concentrates on the produc-
tion planning issues of the assembly line.
3.2 Work analysis
Analysis of the current situation started with a two day hand-on observation pe-
riod in power series assembly line in the beginning of the year 2013. The objec-
tive was to understand the assembly line stations and differences of assembly
work between different products. The idea was also to make a superficial analy-
sis for the most important development subjects in the assembly line and get
familiarised with the people in the production. There were many good conversa-
tions and questioning about the improvement possibilities of the assembly line
with the line personnel. The line work was mainly a follow up of different work
tasks in all stations presented in flowchart in figure 3.2.
The most significant inefficiency or waste in the demountables assembly was
clearly waiting times, which also underlines the importance of this work. The
most important reason for waiting was the imbalance of workloads between
workstations, which is described later more in detail. Waiting was also caused
for example by the inefficient production sequence planning, which was mostly
managed by line managers instead of the master planner. The sequence was
handled more based on experience than hard data and standard times. The
product sequence was written to one flap board where employees needed
come to check the production plan. No planned procedure existed for maintain-
ing and updating the sequence and sometimes it caused problems if it was
somehow changed. For example valves are partly preassembled and if the se-

47
quence is messed up a situation might occur where the pre-assembled valve is
not available for the product in-process.
During the thesis project it could be also clearly noticed that the outsourced
paint shop has a too strong influence to the efficiency of the power series hook-
lifts assembly line. In several occasions employees at the first assembly station
did not have any subframes available in the buffer after the paint shop. This
caused waiting which is also often cumulated to the whole assembly line when
the flow is interrupted already from the first station onwards. The paint shop al-
so had too much influence on the assembly sequence and determined too
much the production planning activities. There are many different factors and
restrictions that influence the sequence and it is hard to make corrective actions
that would not affect other places in a negative way. It was found in the analysis
that with the current system the queue planning creates waiting in many places
and a new system for the queue sequence planning should be created.
There were also various other reasons for waiting which were not that easy to
point out with a data analysis. One of them was that two workstations partially
shared an assembly area, causes continuously short waiting times when the
other task is ready sooner than the other and the product cannot be moved for-
ward on the line. There were no buffers between the stations and the other sta-
tion was able to start assembly work on the product earlier if they made some
operations already in the previous station. This illusion that starting work earlier
would decrease waiting times was hard to break, because the system had been
in use for such a long time. The procedure was in advance for shorter lead time
because the product was completed earlier from the final assembly station, but
at the same time it decreased the productivity due to continuous waiting times.
One reason for waiting was also the fact that parts were lacking and the real
problem was that they were often noticed after the assembly had already start-
ed. The logistic is not the scope of this thesis, but problem solving of these
kinds issues is related to assembly line balancing. In many occasions there was
no substitutive work to do when some parts were missing which caused waiting
problems for many stations. In these cases foremen should be able to quickly
decide what alternative tasks employees should do instead of waiting for miss-
ing parts.
Work analysis also revealed that employees do not have enough information
about the daily or weekly targets that are set for the production. The pace of
operation was more based on the current market situation or the time limits of
individual products. Employees did not have access for the module specific time
standards and they were not used for production planning. The work was more

48
based on the number of products and the total average standard time, even
though the operation is highly variable.
3.3 Interview analysis
Interviews were held for ten assembly line related white collar employees from
production, logistics, production engineering, quality and information manage-
ment. There was an hour booked for each interview but few turned to be more
like production development discussions rather than interviews and took even
two hours. The purpose was to get a comprehensive outlook of the current situ-
ation of the assembly line by canvassing pros and cons, main problems and
development ideas from different departments. The interview question sheet is
presented in appendix 7 in Finnish and it had the same semi-structured ques-
tions for every interviewee. Open questions were about employees’ responsibili-
ties, different development ideas and opinions. The statistical data from the in-
terviews were gathered with likert-scale of four scales questionnaires about
workstation arrangements, time targets and visual management.
The results of the interview showed that logistics and material handling are the
competitive advantages of the Raisio factory. Also the good trends and num-
bers in key performance indicators endorse that result, but those may have also
affected the opinions of the interviewees even too much. The most important
development subject was capacity management related to the assembly line.
The interviewer may have influenced to the interviewees in this question, be-
cause that subject was also discussed generally during the interviews. Other
main development subjects were to improve problem solving and information
flow about the issues in production.
Figure 3.5. Results from structured questions.

49
The results for the structured questions are presented in the figure 3.5 above.
Interviewees though that workstations are defined and arranged pretty well. The
main reason for this is the overall cleanliness of the assembly line, at least
when compared the situation before layout changes. All the tasks and responsi-
bilities are generally working well even though the system is mostly modified by
itself. In an average of the opinions were on the positive side of the scale, but
there were also several small development objects mentioned.
Time targets were regarded as a clear development subject and the average
opinion was on a negative side of the scale. Most of the critics were pointed to
the availability of standard times and how they are used for the guidance for
assembly. There has been a continuous updating of standard times with many
different timing methods for demountables assembly, but the general overview
has not been analysed. Standard times were used more on pricing and capacity
planning than production scheduling. Also definitions and meanings of different
time standards seemed not to be clear enough.
Visual control was perceived to be on a quite good level and on a positive side
of the scale. It polarized the interviewees’ opinions because some perceived it
how different areas are visually defined and others how visual managing helps
to control production flow. Also inconsistent opinions occurred: some thought
that there is enough information available and other thought that the only infor-
mation is the flap board of production sequence to support production control.
3.4 Assembly line time study
Collecting, verifying and analysing relevant data is the starting point for all con-
tinuous improvement projects. The current status hard data helps to understand
where to really focus in problem solving and improving operations. If there is no
data all the decisions are made more like relying on hunches and feelings in-
stead of scientific or objective approach. (Imai 2012, p.7)
The standard time study was probably the most important task of this whole
thesis. The idea of time study was to make a survey of the balancing situation of
the big hook assembly line. The data analysis was based on the work made in
2012 when assembly modules were allocated to correct workstations and ena-
bled to make statistical calculations for the balancing situation. Before it was
possible only to calculate the total assembly line cycle time and productivity, but
now this study was able to reveal more specific standard times for the assembly
line.

50
The methodology was to collect time data of the products in backlog from ERP
system to spreadsheet software sheets and make various calculations and
graphs to present the balancing situation of the production. Another input for the
analysis was capacity information collected from supervisors and daily visits in
the assembly area. The information from workers helped to correct some mis-
takes of standard times and to solve misunderstandings. Also definitions of dif-
ferent standard time calculation methods used in production needed to be de-
fined, because there where many different purposes for different methods. After
brief analysis it was agreed that the standard time called “target time” would be
the correct meter to use for the assembly line balancing actions. With the target
times and capacity allocations it was easy to calculate the balance situation of
assembly line.
The system was to first calculate the average work amount of each workstation
by using target times. The results showed that some workstations have much
more work to do than other stations and the tasks are really divided to work-
stations based on product structure rather than amount of work. The differences
were smoothened by dividing the total workstation average target time by the
current normal number of employees per station. The results show the average
cycle time per product for each workstation and also the differences between
workers from different workstations. The load percentage is then calculated by
comparing each station to the 100% bottleneck station. All station times are di-
vided by the highest average time and multiplied with 100% to get the work-
station workloads (Stephens & Mayers 2010, p.116).
Figure 3.6. Workload percentage situation in the beginning of the project.
The balance situation with load percentages in the beginning of the project is
shown in figure 3.6 and more in detail in the appendix 4 with red colour. The
analysis shows that workstation 5101 is a clear bottleneck station of the assem-
bly line according to the target times. The workload of the second loaded station
5104 is 86% and the least loaded employees in station 5105 have only 36,3 %
workload compared to employees in the 100% bottleneck station when ana-

51
lysed only based on target times. The average workload of workstations is 63%
and average workload of individual employee is only 61% compared to bottle-
neck employees.
The first calculations for takt times and planned cycle times are very often
wrong but they serve as a starting point for setting targets. The initial numbers
provides information of the current pattern of operation so that the first target
condition can be established. With the current situation and targets it is possible
to know exactly where to concentrate on and strive forward by using continuous
improvement methods. (Rother 2013, p.5)
The main restriction relates to the source of time standards and many small
mistakes were corrected during the data analysis. As described above the time
study was done mostly by using only target times. However, this is not the most
reliable way to do time study. The best way would have been to use actual
times and avoid using existing standard times because there are multiple re-
strictions related to ERP –based times (Larco et al. 2004, p.52). However, time
study made by stopwatch based on actual cycle times was not included to the
scope of this thesis. Because of ERP-based target times all the results from
balancing calculations are just indicative rough information which cannot be
used towards any radical changes as a primary source or tool.
The next phase was to analyse the variances between product target times.
The purpose was to evaluate how much different products really affect the as-
sembly line work and the production flow. The analysis was made for all the
orders in backlog to get as comprehensive and reliable source material as pos-
sible. The first research was made in relation to total product target times to get
a picture of how much variance there really is between products. After that the
second research focused on the main options and modules that most affect the
most on production and imbalance.
The analysis of total target times revealed that the scale was very large from the
minimum to the maximum target times. The most labour-intensive product mod-
el require even double amount of work compared to the simplest option of de-
mountables. Based on the total target times, products were divided to three cat-
egories; easy, normal and hard. These categories help to identify the capacity
requirements for different products or planning of production sequence. The
category names are somewhat misleading because for example a hard product
is in fact more labour-intensive but not necessarily any more complicated. In
case of station times the differences were even more significant. In average the
minimum station time is three times shorter than maximum time depending on
workstation.

52
A more detailed analysis based on different product related specification also
showed clear differences in all analysed factors. Target time variances between
product models were as significant as expected. The data analysis convinced
that the most complex low slide-tilt model (ZL) is much more labour-intensive
than the most standard slide model (S). The target times of all other models
gradually increased from S to ZL. The analysis of the lifting capacity, which can
also be considered as the size of the product, showed that usually more capaci-
ty means also longer target time. However, this direct correlation was not as
significant as expected and the product type is much more determining factor.
In analysis of the customized options there were many important findings made
about options that influence to clear peaks in target times in some workstation.
The information was used in several assembly line balancing actions for exam-
ple in planning of new pre-assembly station, routings or production sequence.
The assembly line product variance graph is presented in appendix 2.

53
4 DEMOUNTABLES ASSEMBLY LINE DE-
VELOPMENT
The development areas, balance situation and bottleneck stations were pre-
sented in the last chapter. In this chapter the focus is to create a concrete plan
to balance low-volume high-mix assembly line for demountable production. The
first phase introduces an action plan to balance the workload by re-engineering
part of the assembly and equalizing the amount of work between assemblers.
The second phase presents a plan how to continuously control the balance and
target times. Throughout the process, literature was used as guidance and all
changes were reflected to different theories.
4.1 Assembly line balancing
Based on the time study and balancing situation presented in chapter 3.1 it was
clear that there was a need to make development actions for the assembly line.
As discussed in chapter 2 there are many ways and alternatives to balance as-
sembly lines and the theory was used to give guidance for the development ac-
tions. The first thing in balancing is to recognize the bottleneck station. Data
analysis shows that the bottleneck station with current manpower is clearly
5101 Subframe assembly. Bottleneck is always the constraint for productions
and most of the development ideas and planning should be addressed to the
bottleneck station (Stephens & Mayers 2002). After the plans and first actions
for bottleneck station, all other workstations were also re-evaluated. Next all
these different variables are studied with the alternative balancing methods pre-
sented in table 2.3.
4.1.1 Assembly line balancing based on average station times
The current situation analysis revealed that there are significant differences be-
tween workloads of employees in different workstations when calculated with
average product target times. The most important reason that causes imbal-
ance for assembly line is the uneven workload for different stations and em-
ployees. This can be noticed from figure 3.6 where workstation 5101 is a clear
bottleneck station with over 16% per cent higher workload than the second
highest workstation. It was obvious that there was a need to use this assembly
line balancing method to allocate correct amount of employees to workstation
based on average standard times. Using the method of reduction to a single

54
model problem does not alone solve the assembly line balancing problems for
high-mix, low volume production but it will provide the basis for other balancing
methods.
The development action is to calculate the ideal balance situation by using the
assembly line balancing table presented by Stephens & Mayers (2011, p.111) in
chapter 2.4.1. The table was modified for the needs of case company and the
source numbers were allocated based on current demand and production situa-
tion. The average standard times for each workstation were already calculated
in the current situation analysis so the re-calculation was pretty simple.
The ideal balance situation with a fixed amount of employees is presented in
figure 4.1. The base number of employees of workstations is different in 6 out of
7 stations in the ideal balance situation of demountables assembly line. The
plan is do these changes one by one during a longer period. First there must be
a survey on who are the right individuals to change the base workstation based
on competence matrix and personal affections. A possible training period must
be also planned for workers that do not have enough experience or competence
for a new workstation. All the development actions are made by production
managers and foremen based on ideal situation calculations. After the changes
there is a follow up of the consequences. In appendix 4 the ideal balance situa-
tions are presented with green colour.
Figure 4.1. Ideal assembly line load % with fixed amount of employees.
Because all the assembly line balancing calculations are made only with unreli-
able standard times the ideal situation is not necessarily the best balance set-
ting. There are differences in employees competences and motivation so
standard times do not always correlate with actual times. This stresses the im-
portance of researching the actual cycle times because it is complicated to
make further decisions with unreliable target times that are not verified frequent-
ly. In the future it will be important to follow the balance situation and continu-
ously update the target times. There are still quite many small corrections to be

55
made for the allocation of target times to the right workstations, because some
parts are assembled in wrong place or have totally wrong target times.
4.1.2 Flexible multi-skilled workforce
The demountable assembly line has seven workstations and they are all dedi-
cated to slightly different types of assembly work. There has been a team cul-
ture for workstations and all the employees belong to some workstation team.
However, as may notice from the previous chapter, all target times were in “av-
erage” –format, which indicates that the assembly times of different products
are really very variable. The workstations where employees were placed at
were in turn on “base” –format which indicates that the workstation allocations
are not fixed in variable environment. Some multi-skilled employees have been
changing places according to the needs of fluctuating workloads or to replace
other workers in case of sick days. In the future this will be a clear target to con-
tinuously increase this flexibility factor and encourage employees for self-
management in case of changing places when there is fluctuating workloads.
Competence matrix and motivation methods for changing places flexibility have
already also been in use also before but not very effectively. During the assem-
bly line balancing project the previous subjects and the controlling system for
multi-skilled workforce where analysed and planned.
There are clear advantages in using multi-skilled employees in the demountable
assembly line. It is possible to prevent waiting times, shorten lead time and
equalize the amount of work between assemblers in variable environment. As
presented in chapter 4, the target times fluctuate in average times between sta-
tions but also between different products in one station. For example low model
hook lifts need much more assembly work in piping and valve assembly but not
in the final assembly line. However Z hooks which have both slide and tilt op-
tions need more work at final assembly line but not that much in the first sta-
tions. The time depended factors that effect on fluctuations in capacity require-
ments in short term production scheduling are presented in chapter 2.4.2. All
these variables are relevant in demountables assembly line and they significant-
ly affect the short term employee requirements in different assembly line sta-
tions.
The first variance attribute is the differences in total cycle time. The product mix
and the total standard times of assemble one demountable is the baseline for
variable employee requirements. The difference between the most laborious
and the most simple product is clearly over a double in total cycle time. The
second factor is the difference in station times between each other from differ-
ent stations. As discussed in chapter 2 the purpose of simple assembly line bal-
ancing in mass production is to equalize the workload between workstations,

56
but in high mix industrial assembly the tasks are divided to different station
more based on product structure and the type of different tasks and then bal-
anced with employees. In demountables assembly line there are significant dif-
ferences in the amount of work between workstations. The average target time
of the most loaded station is even 6 times longer than in the least loaded work-
station. This average difference is balanced with employees as discussed in
previous chapter. There are one to eight employees in one work station simul-
taneously. In variable environment, where optional modules affect the amount
of work on different workstations, the range from the most loaded and the least
loaded station at the same time can temporary fluctuate much more. If a very
labour-intensive product in the most loaded station is compared to an easy op-
tion in the least loaded station assembled at the same time, the difference in
standard times can even be over 15 times higher. The number can also be con-
verted to the employee requirements which would indicate 15 more employees
to the most loaded station compared to least loaded station for the product. If
the assembly line works in a strict takt time system it is impossible to balance
this high differences by changing the employees workstation based on period
depended requirements calculated directly from standard times.
Target time variance in one station is the third factor discussed in chapter 2.4.2.
In the demountable assembly line there are often over 300% difference be-
tween consecutive product models in assembly line. In the pre-assembly of
hook frames the difference between two consecutive station times can be even
ten times higher for a laborious product compared to the simplest option. Ac-
cording to theoretical calculations it is not unusual that the difference of capacity
requirement of two consecutive periods in takt-driven production would be over
four employees for one station. There are also practical limits in changing the
employees’ workstations based on each unit and time period because this
would require a very good and reliable controlling system and larger work-
stations. There is an example of the different attributes affecting the station
times described in chapter 2.4.2 and appendix 1.
The fourth source of variance is the period depended fluctuation in total cycle
time, which is a consequence of the production sequence. There is a conflict
between the takt time based production system and capacity requirements if
there are only complex products on the line because there are not enough em-
ployees. In turn when there are only simpler products on the line there is an ex-
cess of capacity if takt time kept the same for the period. This overburdening,
unevenness and waste can be avoided by developing production levelling which
is discussed in chapter 4.1.5.

57
As presented above there are considerable time depended differences and fluc-
tuations in demountables assembly, which affect the capacity planning and pro-
duction flow. It was analysed that it is not possible to make a detailed plan to
manage and control the all the variances affecting on employee allocation for
every single product. That is why employee allocation and use of multi-skilled
employees are based more on average workloads for some period. At the be-
ginning, the period is one day and the plan is to continuously shorten the period.
To manage these short term variations and resource requirements, a system
was designed to give an indicative number for each workstation for certain peri-
od based on target times. At first the system works with spreadsheet software
calculations which convert target times to employee requirements, but in the
future idea is to design even more automatic method. The first step in the calcu-
lation is to download production sequence and all target times from ERP-
system. The next phase is to determine the scheduling timeframe and in 2.2.3
there were two different methods presented for that purpose. Takt-driven sys-
tem and production rate oriented system have the same output but can have a
totally different production system.
In the takt-driven system the period would match with the planned cycle time
and the amount of products would only be one for every short term scheduling
period. In a production rate oriented system the period and number of products
is in more free discretion based on the longer term targets, current capacity or
normal pace of work. Production rate for one day has been the conventional
target setting method for power series demountables assembly line and the sys-
tem is presented more in detail in production scheduling related chapters.
The next phase in employee requirement calculation is to define the available
amount of employees. The spreadsheet software file will then calculate the em-
ployee requirements by first calculating the total target time for each workstation
and then dividing the available employees based on the shares of target times.
This will generate an indicative number of employees expressed to one decimal
place. The employees can’t be divided to decimals but the decimal place will
help foremen to consider the real employee allocation more accurately. For ex-
ample, the indicative number of 3.5 will leave more discretionary power based
on the actual situation than number 4. However, the number of workers should
be quite near to the same value that is calculated based on average workloads
in previous chapter. Workers should be moved to other stations only when there
is a bigger gap between the indicative number and base amount of the employ-
ees in a workstation. The same file works as a reporting system for productivity,
targets and results for certain production indicators. The plan is to start using
the new production scheduling file on testing weeks and to use it as assistance
for employee allocation. The time period during the test weeks is half a day in

58
one shift system and spreadsheet software calculates the employee require-
ments based on target times for each station. The information is then provided
for production foremen who will make employee changes if needed. Idea is that
foremen can proactively react on variable standard times and not only after
some stations are late from targets. The file is available for foremen so that they
can change values and print out the plans also themselves.
There has been a system that a worker who is assigned to another workstation
is regarded to be only 50% of the capacity in the new location. This is because
of possible training requirements, motivational factors and competence differ-
ences compared to base workers of the workstation. This system is considered
to be re-taken in use now when the new production planning system and work-
station based productivity calculation is created. This could help the workstation
team to accept help from people from other stations without the concern of los-
ing in workstation’s productivity so much. There is also an option that a small
team of “floaters” (Larco et al. 2008) would be established for the demountable
assembly line. These employees would have the skills to help workstations that
have higher workload than average or left behind from production targets.
4.1.3 Pre-assembly for optional modules
The customized options assembled in the bottleneck station cause temporary
overload situations in workloads. The labour-intensive products with tool con-
sole or hydraulic front locking options take much longer to assemble compared
to stations average target time in bottleneck station. This creates a lot of fluctua-
tion and disturbs the production flow. This has been conventionally balanced
with buffers after the first station and work queue levelling, but it is not always
enough. When the buffer is already empty or multiple labour-intensive products
one after another are in queue the next workstation will be waiting.
The solution to balance the workload in variable workstation is to add a new
pre-assembly station for these special modules that increases target times. The
plan is to have one pre-assembly worker whose task is to prepare these mod-
ules ready for assembly line and the target times are allocated for the pre-
assembly instead of bottleneck station. There is a figure 4.2 to illustrate how the
new pre-assembly station will balance the workloads between the different
models.

59
Figure 4.2. Analogy in moving optional modules to pre-assembly.
This change requires planning of a new pre-assembly station and load calcula-
tions for the responsible operator. It includes time studies for the modules which
assembly place will be changed and possible planning for tooling issues. The
idea is that the new pre-assembly workload station is also capable of doing
many other kinds of tasks which are not necessarily related to the pace of as-
sembly line. The pre-assembly station provides flexibility and improved planning
capabilities for assembly line planning and balancing.
4.1.4 Different routings for variable products
The idea of different routings can be applied if very labour-intensive products
causes continuously temporary overload situations in a workstation. The op-
tional features can take much longer to assemble, which may lead to situation
that the next station end up to wait for the product to be completed. In de-
mountable production this kind of feature is fast lowering option for valves that
takes much longer to assemble. In this case it was not possible to change any
modules to pre-assembly because the tasks are made directly to the hooklift. In
the beginning situation this optional module causes big problems and even
stoppage of the assembly line flow due to the extra piping that do not always fit
to place as designed. These problems can easily stop the production for quite a
long time and in-process inventories are generated before the station and the
next workstations need to wait. The waiting problem for the waiting assembly
station had conventionally avoided by starting the assembly work already in ad-
vance at the previous station, which will also shorten lead time. This problem
was described already in chapter the 3.1. The assembly in workstation 5103
seemed occasionally more like a cell assembly type production because two
workstations were working parallel at a small area.

60
To solve these problems some small layout changes were planned for 5103
workstation (see figure 4.3). The workstation is enlarged so that up to three
equipment fit to the area. The first one is for cylinder assembly, second for con-
trol systems and the new place is optionally a buffer or an assembly station.
The new 3/5103 workplace is used for assembly when there is a more challeng-
ing product in-process in place 2/5103 and extra personnel there would not help
to speed up the process. This way the employees can avoid waiting by assem-
bling the next product in place 3/5103. The place can also be used as buffer
when 5107 is not ready with the previous product in line. The new layout should
ensure more reliable production flow forward to workstation 5107 and waiting
times are decreased.
Figure 4.3. Layout change for workstation 5103.
In the new layout final assembly station 5107 does not need to start assembly in
advance in previous workstation 5103. Instead they will not assemble rear
frame until the product is completed in workstation 5103 and that is why also
the rear frame buffer place is moved next to the correct assembly area in this
layout plan. The final assembly line workers will no longer disturb the team 5013
anymore with parallel assembly work because all the tasks are done in the right
assembly areas dedicated to each teams. The new enlarger workstation layout
is much more flexible because in case of very variable production or quality
problems it is easier to find alternative solutions to add value to the products
instead of waiting.

61
In the future, the similar kind of change to routings is also possible for the work-
station 5107 where certain models are much more labour-intensive than other
models. The current layout does not allow overtaking of other products in work-
station 5107 so the slowest model will pace the speed of the station. The as-
sembler of the following standard product after labour-intensive product will then
end up having long waiting times. There is a possibility to create a side assem-
bly place like in 5103 but with controversial system. The more complex products
would go to the new place so that other products could pass it. This method is
also compared (Larco et al. 2008, p.51) to local trains that stop at all stations
and express trains that stop only in larger cities. Alternative routings could even
be used in a larger scale by creating another assembly line for complex prod-
ucts. The current assembly line would focus only on standard products and an-
other line for products with more variability. Also defence products could be in-
cluded in the assembly line of complex products. This arrangement would bene-
fit current assembly line because of horizontal balancing, which would decrease
the variability in assembly line. The new line with a good flexibility could for
one’s part improve the efficiency of defence products assembly.
4.1.5 Work queue levelling
Workload levelling is one of the major challenges in the high-mix production
where all workstations have their specific tasks and customized options are as-
sembled at different stations in different times. The cycle times can also fluctu-
ate so that a product that is very laborious for some station can be a very low
loaded for another station. For example assembly of low model products have
higher target times for every workstation but some optional modules for exam-
ple in cylinders cause higher workload for only one station. It is extremely hard
to calculate and evaluate the exact sequence in such a highly fluctuating envi-
ronment where also problems will mix the sequence. As mentioned in the as-
sembly line analysis there is a clear habit of concentrating more on production
rates than standard hours. This perspective is very challenging for production
planning and especially in production levelling because the number of products
is not totally comparable to the amount of work.
There was a meeting held in order to improve the production levelling in the as-
sembly with the responsible people of queue sequence planning activities in
different timeframes. The production engineering manager is responsible for
order receiving practices, Master planner for the weekly sequence planning and
finally the assembly line supervisors are responsible for daily scheduling activi-
ties. The four different options presented in chapter 2.3.5 were analysed for
demountables mixed model sequence planning. The first step in production se-
quence planning is already done in order receiving. The system of using slots in
order receiving was perceived to be too complicated compared to the impend-

62
ing advantages and restrictions. The idea to reserve slot for products is not ap-
plicable for the demountable production because the assembly work is not that
standardized that sequence would rebalance itself with predetermined se-
quence. Furthermore, there are quite many real world production related re-
strictions in the demountable assembly line that the well planned sequence
would not remain the same. In the current system the order receiving depart-
ment sets the delivery date based on available weeks with enough capacity and
customer needs, but variances in power series hooklifts are not covered. The
available capacity is calculated with weekly rates, but standard hours are not
checked in that point. During the follow up period total weekly standard hours
were pretty stable but there is a big risk for high fluctuations. In the future the
available capacity should be based on standard hours instead of product rates.
Some practices related to delivery dates for certain countries should also be
loosened so that the focus would be more on flow of production. However, it
was agreed that these order receiving related sequence planning actions are
not planned during the thesis project.
The actual sequence planning starts when orders are arranged by the Master
planner and the system has been working well. However, there are differences
between daily workloads based on the weekday, because of the time of delivery
requirements by customers. The balance period that sequence planning and
production levelling covers is one week. It was agreed that the workload would
be levelled out for the work week more evenly based on target times. Now this
process is easier than before, because target times are visually available at the
same time the sequence is finalised.
The main restriction is related to mixed-model sequence planning are the re-
quirements of the outsourced paint shop, which also influences also the produc-
tion scheduling of the assembly line. The short-term solution was to increase
the buffer places after the paint shop in order to give flexibility for production
levelling. With extra buffer places it is now easier to plan the assembly se-
quence based more on production levelling than the requirements of paint shop.
There are still lots of room for development regarding sequence planning and
production levelling but the actions would need some structural reforms. First
there should be certain practices agreed with the paint shop about the most im-
portant requirements from both sides. This will be discussed more in chapter
5.3 subjects for further studies. When the process for sequence planning is
more standardised for both parties the next step could be optimizing the se-
quence. The Raisio factory does not have resources to make complicated man-
ual calculations presented in many articles but there is a wide variety of produc-
tion planning programs that should be considered. The programs should be
able to calculate the most optimal sequence and which is flexible enough for

63
instant changes. However, the near future implementation plan is to focus more
on assembly line levelling for the weekly load and to stabilize the queue with
larger buffer after paint shop.
Short term production scheduling concentrates on fine-tuning the sequence and
problem solving. The most significant reasons for changes in sequence are
lacking parts or problems with paint shop. Now production levelling in problem
solving cases is much easier when the target times are presented in reports that
foremen use for production planning. Foremen use mainly total times to adjust
the sequence with the best possible way so that no waiting would occur in the
assembly line. The next step would be to teach employees for self-management
for production levelling so that they would rebalance the assembly line by se-
lecting products in the right sequence from buffers. One possible restriction for
this self-management is that employees would select only the most convenient
products to assemble and ignore the delivery dates.
4.1.6 In-process inventory to avoid idle time
Buffers have been used as a production controlling method in demountable
production to level out the fluctuations, to reduce waiting times and to ensure
that every worker has equipment to assemble at their station. During this thesis
project these buffer places were defined more specifically and started to be
used as one of the balancing methods to smooth the flow in the assembly line.
Buffers can provide flexibility and decrease the risk that problems will affect the
production. Buffers are also increasing work in process value, but in the Raisio
factory’s case this is not seen as to be a big problem because in any case the
parts are in the inventory value without structural changes in logistics. In lean
manufacturing one idea to keep minimum inventories is to ensure that problems
cannot be hidden in work-in-process-inventories. Increasing WIP will also in-
crease lead time and that will have a negative effect on one of the objectives of
this thesis, which was totally controversially to shorten lead time. This can be
calculated by using Little’s law where throughput will remain the same regard-
less of buffers. (Little & Graves 2008)
However, during the thesis project it became clearer that minimizing waiting
times is much more important than short lead time for the assembly line. Short-
ening lead time will not give as good results as minimizing waiting times, which

64
improves productivity. That is one reason which supports the decision to set
buffers between demountable assembly stations.
Suggestions on new buffer places are presented in the updated value stream
map in appendix 6. There are 7 buffer palaces after paint shop and before as-
sembly line. The high amount will increase the flexibility for production levelling
options and there should not even be so much messing up of sequence when
the correct frame is more likely available. The big buffer will enable flexibility
schedule changes already before the assembly process starts if some product
is lacking parts. The buffer places also decreases the risk that assembly line
would wait for frames that have been occurred every now and then. In the main
assembly line there are one or two buffers between on each station which are
used to avoid waiting in asynchronous assembly. Between the subassemblies
and the final assembly line buffers are not as important because the primary
issue is to ensure that there is correct frame always available.
In order to keep the balance between flexibility and minimum in-process inven-
tory there should be a clear control practices. The demountable assembly line is
ideal for CONWIP system where products are pulled to buffer place whenever it
is empty, which is indicating the need for a new unit. The pull starts from the last
assembly station or final testing that are producing products according to de-
mand. In fact this system is already partly in practice but it is just not used as a
standard procedure. Implementation of CONWIP system starts with marking of
buffer places. The idea is to mark red and yellow floor paintings, where red indi-
cates need and yellow is additional buffer place to provide flexibility.
Training on main production planning principles should be arranged for workers.
The main issues in training would be the idea of CONWIP system and self-
management for using buffers as a production control method. The objective of
the training would be that all workers really know what needs to be done for
production flow. Today the follow-up of the amount of products in the assembly
line is much easier with the new real time assembly screen, which will be pre-
sented in 4.2.3 visual managing chapter. The new system will help in measuring
the current situation but the actual controlling would be best to arrange by as-
semblers self-managed CONWIP system. Then computer systems would sup-
port the production planning and workers would do the actual controlling and
balancing of the assembly line.
4.1.7 Assignment of identical tasks to different stations
Changing work responsibilities between workstations has not been widely used
in the demountable production. There have not been plans to use this balancing
method in the same manner as presented in literature. Methods presented in

65
chapter 2.4.7 were not applicable for demountable production. It was analysed
that moving tasks from station to station would require too much standard time
calculation and changes for logistics. It was also acknowledged that almost all
restrictions presented in the literature review would realize if task responsibili-
ties are changed.
The only exceptions are some modifications of this method such as pre-
assembly for another main assembly station or extra tasks. Pre-assembly made
by another main assembly station is classified to this method because the task
is not done by separate pre-assembly station but by another main line station.
The idea is that idle time is minimized by assigning the task another station. The
workload is temporary balanced between the helping station and the station that
is behind of schedule. This kind of a situation has been noticed to occasionally
exist between the workstation 5103 cylinder assembly and the workstation 5107
final assembly line. As presented already in 4.1.4 Different routings method
there is sometimes a situation that the final assembly line needs to wait prod-
ucts that have a complex valve option and this causes temporary higher work-
load. One solution is that the workstation 5107 preassembles the valve as ready
as possible in order to avoid this waiting time. The implementation plan is to
assign pre-assembly of the complex valve for final assembly line 5107 in case
they have significantly lower temporary workload. This valve cannot be pre-
assembled in a dedicated pre-assembly station because of logistics reasons
and changing employee places is not possible because of space problems. In-
troduction of this method will be done together with layout change in the area
presented in 4.1.4. There will not be any standard time corrections made for this
case and idea is only to serve one more method to prevent waiting time in final
assembly station.
Another method that closely relates to moving tasks is alternative tasks, which
must be done in some point. Extra tasks such as material handling, packing,
cleaning repairing can be done instead of waiting. These kinds of tasks should
always be available. However there are no implementation plans in scope of
this thesis for alternative or extra tasks.
4.1.8 Work time arrangements
In the demountables assembly line some stations always require a minimum of
two workers because of safety and practicality issues of the tasks. This causes
problems in the evening shift, because based on balance calculations only one
worker would be enough. There is a clear contradiction compared to capacity
requirements. The second, almost mandatory employee is then decreasing
productivity and disturbs production flow with overproduction. In the next day

66
the imbalanced employee allocation leads to almost always to a situation where
some stations need to wait for the first product and others need to hurry.
During the thesis project demountable production changed from two shift sys-
tem to one-shift system. Balance calculations support this decision even though
it was not the most important factor for the change. In a one-shift system it is
theoretically possible to allocate just the correct number of employees to work-
stations because there are no safety related restrictions anymore. This solves
the assembly line problem presented above. In theory the one-shift system
supports the flow of products through assembly line because synchronous
movements are enabled during the whole working day due to the balanced
workload at all times. The most important issue in the change from two-shift
system to the one-shift system is the easier production scheduling which has
direct impact also to production balance. A test week was arranged together
with the change towards one shift system. The plan for the test weeks are pre-
sented more in detail in production scheduling related chapters.
4.1.9 Continuous improvement of current bottleneck station
There are two workstations in the demountable assembly which are defined as
bottleneck station. The other is clearly the workstation with the highest workload
based on standard times and the other because station is affected by problems
that cause delays and disturbance. Main balancing actions were already in the
presented in previous chapters, but they concentrated only on performing the
existing workload as efficiently as possible. Operation as well as standard times
include both value-adding and non-value adding activities. In this method the
focus is to eliminate the tasks that are not adding value by improving the work-
ing practices. Different methods to eliminate these inefficiencies were presented
briefly in chapter 2.4.9. After the development actions for bottleneck station the
tasks should be able to be performed more efficiently and also station time can
then be decreased.
The implementation plan is to concentrate more on these bottleneck stations in
continuous improvement actions. There were no bigger projects planned for
waste elimination during this thesis project but the idea is to make small correc-
tions towards working practices and problem solving. For the first station, the
idea is to evaluate operation and development objects in 5S audits and make
various small corrective actions in order to ease the working practices. For the
other bottleneck station the plan is to improve problem solving methods so that
quality problems, lacking parts or other problems that disturb production would
be solved faster.

67
4.2 Production control
In the beginning of the thesis project the idea was to make a takt time study and
plan changes for implementing takt-driven system for demountable assembly
line. The subject was re-evaluated to focus on assembly line balancing but also
production control development actions were made. Most of these activities
were based on an assembly line balancing study and its implementation plans,
which required changes for production control methods too. In this section those
plans and changes for production scheduling and control are presented based
on the research made in chapter 2 and requirements from balancing activities.
4.2.1 Production scheduling and target setting
The plan is to schedule the assembly line with production rate oriented system.
The scheduling period will be in the beginning one work day for each station.
The follow up is made continuously so that all problems, overproduction and
leaving behind can be noticed as soon as possible. When the control system for
follow up and the target system is standardized the period for production rate
can be shortened to half day. Change to half day scheduling period will require
minor changes to computer systems so that the monitoring would be as practi-
cal as possible. The objective is to smooth the flow for assembly line and create
flexibility with buffers for the variable product mix. In the future this scheduling
period can be further shortened more from a half day and be even few hours.
However, takt-driven or paced production will not be implemented during this
project.
The reason to use production rate oriented system instead of takt-driven opera-
tion is the high variety and easier production planning for demountable produc-
tion. Scheduling production rates for a period is much more flexible and it
doesn’t need as exact standard times than as assembly based on takt time. It
will also divide the workloads to longer timeframe than takt time and then ca-
pacity calculations can be done for average workloads instead of unreliable in-
dividual standard hours. The complexity of takt-driven capacity planning is pre-
sented in chapter 4.1.2. The production rate and the target setting are based on
the current situation in production and delivery dates of products. The target
rate is set to all workstation so that the assembly line balance would be main-
tained. In the target situation all workstations and buffer places will always be in
the situation presented in chapter 4.1.6 and value stream map in appendix 6.
Improving the target setting was one of the objectives of this thesis. The produc-
tion rate oriented system will not make any revolutionary change to the previous
system where the daily targets were based on the amount of completed prod-
ucts from final testing. Now the target rate is also set for every workstation,

68
which will define production controlling for the whole assembly line. Another
way to control targets is to set production rate targets only for the final work-
station and control the flow with buffers. The current situation and the targets
are now visually presented for all employees and it is easier to react on prob-
lems proactively.
4.2.2 Visual management tools for production control
Visual management is a powerful method to provide information and help in a
clearly visible manner. It means to stabilize and to improve the process by iden-
tifying problems and highlighting discrepancies between targets compared to
current realities. Visual management is used to direct, organize and standardize
operations with many ways. Visual management can help in making problems
visible, managing complexity, instructing work and setting targets. It also moti-
vates and provides opportunities to for improvement to both workers and man-
agers to achieve goals when all the operations are as visual as possible. (Imai
2012, p.103-113)
In this context visual management is discussed only regarding assembly line
balancing activities and production control practices. There were various differ-
ent assembly line balancing techniques and an implementation plan made for
each method in chapter 4.1. These plans include things such as controlling mul-
ti-skilled employees, follow up of buffer places, sequence planning, and problem
solving. The production rate oriented system presented in chapter 4.2.1 for
one’s part handles issues like target setting, standard times and current produc-
tion real time situation. In the beginning situation, all these factors above were
controlled only with paper reports, flap board for work sequence and experi-
enced supervisors. Obviously these methods were not enough to support all the
assembly line balancing activities and more detailed production scheduling.
That was the main reason for planning a totally new visual control system for
demountable production. A working solution for logistics already existed and the
new control system for the assembly was made with the same program and
with nearly the same techniques. The new visual assembly line control system
was named assembly screen.
The purpose of the new assembly screen is to be a visual tool for production
control activities. It is a visual display of information entered into different infor-
mation systems. It provides real time assembly line information product and
workstation specifically for power series hooklifts assembly line. The objectives
of different attributes to be displayed in assembly screen are presented in table
4.1. Also the relation to the implementation plans of assembly line balancing
and scheduling are presented in the table. Part of the implementation plans also
serve as requirements for the assembly screen. The assembly screen was

69
planned and created during spring 2013, launched in week 19 and it has been
continuously improved after that. The assembly situation and sequence is
shown to everybody with large televisions in assembly area and all the comput-
ers connected to Multilift Intranet.
Table 4.1. Objectives and requirements of the new assembly screen
Displayed in assembly screen Relation to assembly line implementation plan (related chapter number and short explanation)
1. Assembly sequence of the products 4.1.5: tool for planning production levelling
2. Current real-time production situation
4.2.1: overall production scheduling 4.1.6: tool to control CONWIP- system
3. Target times for each product for all workstations
4.1.2: tool for short term employee allocation
4. Target product rate for each work-station for current scheduling period
4.2.1: basis for production rate oriented system
5. Signal for problems
4.1.9: faster problem solving in bottleneck stations 4.1.5: help for flexible re-sequencing of queue
6. Amount of employees in each station
4.1.2: follow-up for current employee allocation
7. Workstation specific productivity 4.1.1: easier follow-up of overall balance situation
The first step in the new control system was to start using the real assembly
sequence situation in IT -systems so that the first priority of the planned se-
quence is updated to computer systems instead of flap boards. This queue is
the backbone for the whole supply chain from order to delivery of products and
now it can also be used for assembly line as a controlling method more easily.
The queue is arranged so that production levelling would support production
balance. The queue sequence is now more consistent for power series hooks
production because the same sequence is shown for logistics, assembly and
managers via internal IT-system. Flap boards or papers are no longer used to
show the sequence for employees anymore, except some exceptional problem
solving cases. This change to update the assembly sequence to IT-systems
was also a requirement for the new assembly screen.
The second phase in the assembly screen planning to design how current pro-
duction situation should be presented. The solution was to create a cell system
where the product queue is presented vertically and workstations horizontally
from left to right. There is an illustration figure 4.4 of the assembly screen,
where workstations are presented in the first row. Workstation numbers are
marked from pre-assembly 5100 to testing 5108 without 51-marking in the front.
The progress of each unit presented with green colour and the latest green cell
of the unit depicts also the current location of any specific unit on assembly line.

70
It is also clearly visual how many items there are in buffers between each sta-
tion and that can be used as a controlling tool to support CONWIP system pre-
sented in chapter 4.1.6. Reporting from the workstations is done by the assem-
blers with an electrical stick, which is also used for many other purposes. Work-
station checking enables also more detailed automatic time studies in the fu-
ture.
Figure 4.4. Simplified illustration of assembly screen.
The third objective and purpose of the assembly screen is to present target
times product and workstation specifically. At the beginning, it was found out
that standard times were not easily available for employees and they were not
used for production scheduling purposes. In the assembly screen these target
times for workstations and different products are set to each cell, where they
are visually available and all workers. As was discussed already in the time
standards chapter, a study made for 400 industrial plants show that an opera-
tion that is not working toward time standards typically works 60% of time and
operations working with time standards work at 85% of time (Stephens & May-
ers 2010, p.64). According to this research there should now be better possibili-
ties to increase productivity in demountable assembly line because of better
target time availability. Workstation specific target times are important also for
assembly line balancing activities. They provide important information for short
term production scheduling, better production levelling and employee allocation.
Most of these actions are done already beforehand, but the assembly screen
support decision especially when there are quick flexible changes made to the
original plans.
PA A A SA SA SA A A T
Project Typ Model Ctry QNr PA HP KE 00 01 02 04 05 06 03 07 08 Comments
527782 BH XR21S59 -W-ITLF- FX 001 complited
522345 BH XR21S59 -WM-FL-- BE 002 complited during current period
523324 BH XR21Z59 -WMO-L-- AT 003 target rate for the period
528863 BH XR18S53 -P-O-LF- FX 004 0-series late from previous period
528844 BH XR26Z51 -S-ITLF- SE 005 problem ("simple andon" -signal)
528845 BH XR26S55 -DMO-LF- ES 006 started
528442 BH XR24SL59 -D-OCLBT AT 007 see ECR 66297
528847 BH XR24SL56 -W-OTLAT FX 008
528848 BH XR26S55 -DMOTLB- UK 009
528998 BH XR26S55 -DMOTLB- UK 010
524621 BH XR26S55 -DMOCLB- UK 011
528851 BH XR16T59 -WMI-L-- UK 012
528852 BH XR16S59 -WMI-L-- NL 013 lacking part 221334
528853 BH XR21S56 -WM-TLF- FX 014
528210 BH XR21S56 -W-OTLAH CH 015
528855 BH XR18ZL56 -WMO-L-- CH 016
528448 BH XR20SL52 -DMO-L-T BE 017
528272 BH XR18S56 -WM--L-- SE 018
528747 BH XR24SL58 -W-OTE-T BE 019

71
Target rate setting is the fourth factor for the new assembly screen and it is the
basis of production rate oriented system that will be implemented for demount-
ables assembly line. Target rates are set with blue colours to assembly screen
for each workstation for the scheduled period. Currently the period is one day
so all workstations have the day’s target rate clearly presented with blue colour
in assembly screen illustrated in figure 4.4. If the targets rates are not reached
the colour will change to light red and it is reset to include the next period tar-
gets. The blue colour illustrates the targets for the current period. Blue and light
red target cells are then used for capacity calculation (see chapter 5.1.2),
productivity measures and general production controlling. The longer the period
the closer the employee amount is to the average amount of employees. During
one day it is in normal situation very near to the amount calculated with the av-
erage target times presented in appendix 4. However, during a half-day period
the number of employees can already significantly vary compared to the longer
term average base values.
The fifth objective was to create a create signal for problems occurring in the
assembly line. For this purpose there was a stop feature added to the electronic
sticks that were used for workstation phase checking. The button is pressed
when there is some kind of issue, which stops, disturbs or interrupts the produc-
tion of a product. This stop button is shown as a red colour in assembly screen
as a signal for foremen to see and solve the problem. The red signal is a clear
visual help for all assembly line related workers and helps production control.
The sixth and seventh objectives were to show the amount of employees and
productivity of each workstation. The plan is to make another productivity
screen where different assembly line key indicators are displayed. The devel-
opment of the productivity screen is important because most of the calculations
are now made manually with Spreadsheet software and automatic system
would save lots of time. However, the development and implementation of these
features will not be done during this thesis project. Other development plans for
visual management and target setting is to implement tablet computer for pro-
duction scheduling activities. The idea is that if foremen can make changes to
the assembly screen already in the assembly area they do not need to return for
their computers in the office. The tablet will also work as camera, reporting de-
vice for problems and source for work instructions so that all information is easi-
ly available electrically.
4.2.3 Restrictions and problem solving
There were quite many restrictions in the demountables production compared to
calculations, plans and other production scheduling issues. In this chapter the
most critical restrictions are briefly described and analysed. Most of the re-

72
strictions were already mentioned earlier in this thesis and this chapter summa-
rizes these factors from a daily real-world assembly work.
The most significant restriction compared to theoretical assembly line balancing
methods and the real-world actions is that employees do not work like ma-
chines. This thesis does not discuss much about change management or
change resistance, but there could be another research made for those. The
project was first understood as a productivity program which does not always
have the best acceptance among employees, especially during a period of low-
er average demand. As described in the introduction chapter the idea was to
make the work easier by a better organisation and assembly line balancing.
During the project this message needed to be communicated to the employees
in the beginning of every development action performed. One restriction related
to the employee engagement is also that it is difficult to evaluate or measure
production balance and efficiency of scheduling when the productivity rate is
low. In such cases, it depends more on problems or individuals than the current
production system. Employees do not work with the same pace in all demand
situations. In low volume situation the work is done slowly so that it seems diffi-
cult and in high volume the possible bonuses encourages for better productivity.
It has also been recognized that it is easier to manage higher volumes than low
compared to average demand in demountable assembly. All these change re-
sistance and people engagement issues must be carefully considered in all de-
velopment actions and good communication is the best solution in most cases.
The most significant measurable factor that influenced on assembly line balanc-
ing activities and control was the output of units from the outsourced paint shop.
There were several occasions when assembly needed to wait for the painted
subframes and couldn’t work according to the plans. This naturally leads to
plenty of problems such as late production, idle time, uneven workload and pro-
duction planning difficulties. Problem solving is more difficult because of lack of
buffers which leads to decreased flexibility in variable environment. Further-
more, production sequence can be messed up in the paint shop and that affects
directly affects the production levelling. The first assembly workstation must on-
ly take the available frames for production to prevent waiting if the buffer after
paint shop is empty. The lack of frames enforces the management to make
quick actions so that employees would not need to wait and it can be challeng-
ing to organize 5S audits, team meetings, extra work or employees to change
workstations in that situation.
Evaluation and study is made only with current ERP target times and actual
times were not studied properly because that subject was not in the scope of
this thesis. The validation of target times was made by spot checks with ques-

73
tioning employees and foremen. The estimations of different target times of
modules where surprisingly close to the calculated standard times and it verified
that target times where applicable for rough balance calculations. During the
analysis, target times were continuously reassessed by comparing to specific
product type and modules. Even though there were not many major errors
found from standard times, the project stresses the impression that there should
be more specific analysis and time studies performed.
The production control calculations are currently made with an application that
require some amount of knowledge and experience before the system can be
used efficiently. There are already plans to develop more automatic reporting
system but it will require some amount of time and work before the system is
available. In order to control the employee allocation, assembly line balance
situation or workstation specific production indicators there must be resources
and knowhow for manual production planning calculations. There are many re-
strictions related the reliability of computer systems. The assembly screen is
currently the only tool to manage the sequence of units for the assemblers and
especially for the first workstation. The system may go down every once in a
while so there should always be alternative plan ready. The most common prob-
lem, although easily repairable, has been that the when queue is updated the
sequence changes from 1,2,3,4... to 1,10,100, 101… -format and the root rea-
son for the bug has not been found. The easiest alternative plan is to use the
old paint board system that can be set up rather quickly. If the assembly screen
is down the target setting must be done manually with printed papers and good
communication. However, target settings are not that critical information in de-
mountable production that short term computer breakdowns would disturb op-
eration much.
Lacking parts or quality issues are endless problems in high-mix assembly, and
they are also restrictions for reliable and detailed production planning. It is nor-
mal that there are always some problems to be handled in variable production.
In lean manufacturing one idea of small inventories is to force solve these
emerging problems quickly and effectively. The environment for problem solving
should be organised as flexible as possible so that productivity would stay at a
good level. For example work sequence and capacities in different workstations
must be able to be changed when needed to avoid idle time. This requires lot of
self-management from employees and foremen. IT -systems should also be
flexible enough to always changing plans. In this thesis all these restrictions
were handled in different chapters. In the case of assembly line balancing multi-
skilled employees and buffers are the most important flexibility factors for prob-
lem solving.

74
5 TESTING AND IMPLEMENTATION
Testing and implementation of assembly line balancing and production schedul-
ing activities were performed during the thesis project in spring and summer
2013. The idea of this chapter is to describe how the development plans pre-
sented in previous chapter were tested and implemented to demountables
power series assembly line.
5.1 Implementation of assembly line balancing methods
The assembly line balancing actions were practically tested together with the
actual implementation and they were compared to the beginning situation of the
project. Table 5.1 summarizes the implementation plan for different assembly
line balancing methods.
Table 5.1. Implementation plan for demountable assembly line balancing
Assembly line balancing method Summary of the implementation plan Assembly line balanc-ing based on average workloads
Equalize the workload between employees according to average standard times and aim to ideal balance situation
Flexible multi-skilled workforce
Increase changing employees between workstations according to current workloads and create a controlling system to support decisions related to it.
Pre-assembly for op-tional modules
Create a pre-assembly station where few optional modules are prepared for main assembly line in advance in order to smooth fluctuations.
Different routings for variable products
Plan a new layout for routings in cylinder assembly so that responsibilities are clearer and more complex products would not stop the flow.
Sequence planning to level out the workload
Plan is to even out the weekly workload more evenly between workdays and focus more on assembly line than paint shop in production leveling activities
In-process inventory to avoid idle time
Define buffer places more in detail with value stream mapping and train to use them as production control method with CONWIP -system.
Assign identical tasks to different stations
Plan is to assign part of the fast lowering valve assembly for another station when there is overload in cylinder assembly, which would cause waiting.
Work time arrange-ments
Change to one-shift system to develop production scheduling and balance situation during the whole day in order to improve constant flow.
Continuous develop-ment actions to current bottleneck station
Various development actions for bottleneck stations in order to decrease workload or avoid problems that are the constraints for higher productivity.

75
5.1.1 Average load percentage towards ideal situation
The idea of this method was to allocate the correct number of employees to the
workstations and equalize the workload between employees. The main goal
was to improve productivity and material flow in the assembly line. The plan
was to aim for the calculated ideal situation presented in figure 4.1 by making
employee base workstation changes one-by-one and follow the consequences
carefully. One input was also to follow in-process inventories and analyse the
operation performance of workstations. This information helped to analyse the
competence and skill level in a real world production system in order to analyse
the correct amount of required employees to perform the tasks. It worked as a
validation method for ERP- based target times, which were corrected continu-
ously. All the development actions were made by line supervisors who have
experience to handle these situations.
The first balancing action was to add more employees to the highest loaded
bottleneck station from the least loaded station. The next move was to add
more employees to the station which seemed to always be late and had above
average load percentage. These kinds of employee changes were made to six
workstations during the project to balance assembly line based on the average
station times. Only one station has totally same amount of employees than be-
fore.
Figure 5.1. New load percentage of power series assembly line.
The new normal load percentage based on average target times after three
months of the first balancing actions is presented in figure 5.1, which can be
compared to beginning situation presented in figure 3.6. The average of the
new load percentages is in 80% when in the beginning situation it was 63%. In
ideal situation the load percentage would be 85%, with current task assign-
ments. It would be possible to increase the average load percentage with an-
other 5%, by changing even more employees’ base workstations but there are
currently quite many practical restrictions on that. A comparison of the begin-

76
ning situation, the current situation and the ideal situation can be found in ap-
pendix 4. The most significant result was that it was clearly noticeable that wait-
ing times were decreased in stations where the amount of employees was re-
duced.
The theoretical calculations indicates 22% shorter total cycle time, maximum
capacity increase of 29% and improvement of 31% in average load percentage
of assembly line balancing. These results come only from equalizing the same
work more effectively between fixed amounts of employees and decrease the
amount of waiting times from assembly line. However, there are many con-
straints when calculating these kinds of numbers only based on average work-
loads, because of errors in standard times, differentiations in employees and
problems that may define the production very much. It must also be remem-
bered that there are no other assembly line balancing development methods
recognised in these values.
5.1.2 Increased use of multi-skilled employees
During the test weeks target time based employee allocation was taken in use.
There was a spreadsheet software file made to calculate the target times for
each unit and workstation. With these values it generates the indicating em-
ployee requirements for the scheduling period. The system is presented in ap-
pendix 8. The information provided for the foremen did help them to make pro-
active decisions for employee assignment to workstations and follow the pro-
duction situation more deeply. There was also an idea to start using “floaters”
as a method to control to balance workloads with employees changing work-
stations. The method was tested in a limited way with good feedback during this
thesis project. At the beginning it was mostly because of practical consequence,
because there was an employee who did not have a base workstation so with
“floater” status he balanced the most loaded station. The idea could be system-
atized and the team of floaters would have skills to help all workstations if they
are facing problems or lack of capacity. Floaters would be responsible for bal-
ancing employee capacity in assembly line.
The challenges for this system are that there are some problems when employ-
ees and products are examined only based on numbers. Employees have dif-
ferent skills and motivation to change places. There has been a competence
matrix in use for employees, but nonetheless assembly work for highly variable
products is not black- and-white regarding abilities to do the task. For example
some employees have skills to do all assembly tasks for demountables but they
will do it slower and inferior quality than colleagues. Another worker for instance
can be extremely motivated to do only one task but does it very well. In this kind
of environment it is extremely hard to lead personnel and plan the correct re-
77
sources to each station. Some workstations also require lots of experience be-
fore a substitutive or an extra worker is really productive. The extra worker may
even slow down the speed if the worker must be trained much. There is also a
change that the motivation level of employees drops if their good work is
awarded with a workstation change to a station, which is left behind from
schedule. Because of these people engagement factors presented above it is
very difficult to present results in numerical formats.
The conclusion for this method is that employees were assigned to different
workstations more than before and it was analysed to be in advantage for the
assembly line operation. It was decided that the use of new capacity allocation
system will be continued and developed. The Spreadsheet software based sys-
tem requires lots of manual work, which was pretty time consuming. The next
step is to develop these calculations and inputs to be more automatic and inte-
grated to Multilift Intranet’s assembly screen. In the future the purpose is to
measure workstations productivity more closely and maybe design some award
systems for reaching productivity targets. At the same time some kind of an
award system should be generated for multi-skilled employees who are willing
to change workstation.
5.1.3 New pre-assembly station
Because of very fluctuating workloads in the first assembly stations, there was a
new pre-assembly station established for tool console and hydraulic front lock-
ing assemblies. The pre-assembly station is located near to the stations where
the preassembled parts are needed to ensure better communication of needs
and ease of material handling. The new pre-assembly station was numbered as
5100. Also pre-assembly of valves will be changed to be part of pre-assembly
station in the future because now it is part of workstation 5102. There were time
studies made for the changed modules by the person responsible of standard
times. Based on the results of time studies also workload calculations were
made for the needed capacity allocation. Planning mixed-model sequence for
the assembly line is now much easier when the most significant fluctuations are
removed to pre-assembly station and buffers are not essential between main
assembly stations.
The implementation of the new system was successful but there could have
been much better communication and definition of responsibilities. The worker
in the pre-assembly station should have gotten better instructions and sched-
ules in the beginning of the test of new workstation. The pre-assembly could be
used also for many other modules assembled in other stations and that option
should be researched in the future to level out the workload even more. It is
very effective way to smooth peaks in station times. The station times on main

78
assembly line would be more stable if optional modules would be continuously
moved to be preassembled. If there are more these kinds of horizontal balanc-
ing activities made to reduce variances from main assembly line, it may be pos-
sible to adopt takt-driven operation in the future.
5.1.4 Different routings for complex products
The layout change presented in figure 4.3 was implemented during summer
2013. New layout divides the responsibilities between 5103 and 5107, which is
a clear advantage for the operation of both workstations. The new layout is
much more flexible because cylinder assembly can use an extra workplace in
case of quality problems or very complex products. The extra station prevents
that there are not too many operators working around one product and disturb-
ing each other’s work.
The challenge in the layout change was to convince its advantages for employ-
ees. It was difficult to prove that the task time and possible waiting times remain
the same but the responsibilities become clearer. The lead time from the begin-
ning of 5103 to the end of 5107 may be longer but at the same time productivity
should increase because of more effective assembly work. There are no numer-
ical results, but the comments by the employees are mainly positive. There
have been some practical difficulties to use the extra workplace but in general
the new set up has worked well. There could have been better communication
about the purposes of the change and the finalising of the new layout could
have been done in shorter time period. Employees have also understood them-
selves that it is more productive to assemble more than one product simultane-
ously when employees do not disturb each other around one product. Partly
because of the layout change 5103 station has had the biggest productivity im-
provement of assembly stations during the project. Rear frames are assembled
to subframes only in final assembly line area and the waiting time has de-
creased. According to employees on 5107 the production flow has been surpris-
ingly much better than in the previous layout and long waiting times do not exist
so often anymore.
Use of different routings was analysed to be a working method for the variable
demountables assembly line. The method could be implemented to other sta-
tions to differentiate complex and standard products so that with small respon-
sibility definitions assembly line balance would be controlled more easily. Differ-
ent routings could also be used in a larger scale to divide standard models from
more complex products in demountable assembly line to create more equalized
balance for the lines.

79
5.1.5 Sequence planning to support production flow
After the meeting held in spring 2013 for production levelling it was agreed to
concentrate more on weekly sequence planning for assembly line instead of the
paint shop requirements. The levelling is based on total cycle times, because
workstation specific levelling is almost impossible without a program that would
calculate all variances and fluctuations.
During the thesis project there are no clear computational evidence of better
production levelling based on weekly workload, but empirical observation and
according to foremen opinion the situation has improved a little. The real devel-
opment for production levelling was achieved by increasing buffer places after
paint shop. The problem that the paint shop messes up the sequence was
avoided by controlling the output form the outsourced paint shop. Bigger in-
process inventory enabled operators to choose the correct product according to
initial production sequence made by master planner. The buffer rate was fol-
lowed in production daily meetings by recording the amount of frames in buffers
and proactive production planning. The target value was set to seven sub-
frames and if the rate is below the target, corrective actions are made as soon
as possible.
After the implementation of more assembly focused production levelling and
stabilized buffer after paint shop, there are better possibilities to improve the
situation further. All in all sequence planning was identified to be very difficult to
use efficiently for demountable production because of so many variable factors.
In the future it is important to start optimization of production levelling and aim to
decrease in-process inventories with more detailed paint shop queue planning.
5.1.6 More detailed in-process inventory planning
In-process inventories are used to smooth the fluctuations in variable station
times and avoid idle time as an assembly line balancing method. The imple-
mentation plan was to make more detailed and controlled system for inventories
at assembly line area. The plan was also to implement CONWIP system and
control assembly line with buffer places, which would be used as pull signals for
the need of the next product in sequence.
More detailed buffer places were defined with value stream mapping, which is
presented in appendix 6. The buffer values serve also as targets for production
scheduling in production rate oriented system. Foremen use the new defined
buffer places in daily target setting and the ideal situation after a planned period
is usually according to value stream mapping work-in-process values.

80
The values should also be used as indicative number for CONWIP based pro-
duction control system. The system requires a good training for assemblers in
order to work properly. This training was not arranged during the thesis project,
but it will be held together with overall Lean and HPS training. Because of de-
layed training also implementation of CONWIP system is moved forwards. The
next plan is to mark buffer places with different colours that would indicate dif-
ferent pull signals for next products. Red colour is a CONWIP signal for previ-
ous workstation to fill the empty buffer place as soon as possible in order to
avoid idle time and starving for the next station. Additionally there will be yellow
buffer places, which will provide flexibility in high-mix assembly line. If all buffers
are full next product should not be moved to buffer place because it is overpro-
duction.
When these changes above have been implemented, the next focus will be on
decreasing buffer places with more detailed scheduling. The purpose of mini-
mizing in-process inventory is to achieve better value-adding rate percentage
which is calculated by dividing the value adding working time by lead time. In
the future there will be only CONWIP buffers used as balancing method and
additional buffers should be removed.
5.1.7 Flexible tasks between workstations
Balancing method of assigning identical task to different stations was not widely
used for demountable production, because of its various restrictions and chal-
lenges. The only exception was that final assembly line started to preassemble
fast lowering valves for cylinder assembly because it’s high workload. Idea was
to assign the task to another assembly station in order to balance the workload
among these stations and avoid idle time. The method is planned to be used
only when final assembly line does not have enough workload.
The implementation of this change turned out to be pretty difficult because em-
ployees did not have any agreed procedure to move to help the previous station
and supervisors needed to always arrange the process. It was also noticed in
some point that the method became unnecessary when other balancing meth-
ods were taken in use. The final assembly line did not have so much idle time
anymore and they were not able to help in tasks of the previous workstation. It
was finally analysed that this method was not very useful for demountable as-
sembly line except in special occasions.
5.1.8 Change to one shift system
During the thesis project the demountable assembly was changed to a one shift
system, which mainly affected on the assembly line balancing with a more
81
straightforward production planning. As a balancing method the change enabled
to allocate the correct number of workers for each workstation at all times. The
station where minimum of two workers are required because of safety reasons
should not have over capacity compared to other stations anymore during any
shift.
Before the change to one-shift system there was an informative meeting held
for all production employees. The main focus was to explain the reasons for the
change and introduce production planning activities related to it. Employees in
final assembly line had sceptical presumptions that the speed of the line would
not be high enough to feed them enough products. They thought that balancing
activities and improvement of productivity would not succeed. The change to
the one-shift system was made in week 21 and there was a two week test peri-
od arranged when production indicators were monitored more carefully.
The operation in the assembly line worked very well during the test weeks and
the balance situation was clearly improved. Employees from final assembly line
also changed their opinion to support new one-shift system because the flow of
products was more stable and workload more balanced during the work day.
Various computational balance calculations and employees opinions both show
that one-shift system has improved the assembly line operation and decreased
waiting times.
5.1.9 Problem solving and 5S for bottleneck stations
The development plan of this final method was to improve the working practices
in bottleneck stations of demountable assembly. There are two bottleneck sta-
tions in the assembly line for two different reasons. The other one is simply be-
cause of highest workload and the other one is workstation with most of the
problems that stops production.
In the first bottleneck station the focus was more on other balancing actions like
right allocation of employees, but also some waste elimination was made. The
most important tool was 5S audits where working practises and operation were
examined. There were lots of inefficient working detected and corrective actions
were made systematically. Small development actions include for example bet-
ter tools, material markings and safety instructions. Those have decreased
searching times and standardized operations to be more productive.
The other bottleneck station had enough resources but problem solving was not
efficient. The new system of simple stop signal and engineering change request
(ECR) top list where taken in use. Stop-signal, which was presented in the visu-
al management chapter, helped to react on problems faster. This signal was

82
especially practical for bottleneck station due to the amount of problems. During
the test weeks the use of stop signal and it root causes were analysed and the
station pressed stop signal 26% of the occurrences which was more than a
double compared to the average percentage. After the follow-up period this bot-
tleneck station has also clearly been the most active user of the stop-signal.
There are continuous problem solving actions made to prevent these problems
and stop signal has made the solving process more visual so that it is easier to
re-arrange production. Another action for problem solving was establishing of a
top list of production related engineering change requests (ECR) for R&D de-
partment. The purpose was to prioritize design problems so that critical issues
would be solved faster. This has made the communication between production,
engineering department and R&D department more transparent and system-
ised.
The development actions of this method of eliminating inefficiencies from bot-
tleneck stations was not analysed with target times so there is not statistical
evidence of development. However, it was clear that all these small actions
helped operation and improved problem solving processes. In the future it is
important to continue improvement actions and in some point also reflect the
improvements in target times.
5.2 Implementation of new production scheduling sys-tem
For the new production scheduling system there a test period was arranged for
weeks 21 and 22 at the same time when assembly screen was taken in use and
production changed to one shift system. During the test weeks production rate
oriented system with target times were analysed and more accurate measure-
ments were performed for assembly line. Production rates were planned for a
half day scheduling period so that each workstation has near to the same
amount of products to be assembled. The production scheduling system for tar-
get setting is presented in appendix 8. The objective was to find out how new
the more detailed scheduling system works together with balancing activities in
practice.
The original input for the target rates is the weekly target amount of completed
units which is based on orders and rough cut production planning. The weekly
target is then divided to daily target rates for each workstation and then sched-
uled for morning and evening rates separately. The current rate is coloured blue
in assembly screen so that it is visually presented for all employees. The next
step was to calculate the total target hours for each station and define the cor-

83
rect employee allocation. For this purpose a report in attachment 8 was used as
guidance for the foremen to balance employees equally to workstations.
During the first test week there were lots of different problems in production,
which disturbed the flow and balance of assembly line. It was very difficult to
follow how well different balancing actions and target setting works because
production sequence was messed up and products needed to take aside from
assembly line. However, employees and supervisors were pleased how well
one shift system generally worked, because there had been doubts about all
employees working together at same time. The space requirements and almost
double speed of the line did not cause any troubles and there were positive
feedback given for new time arrangements.
During the second test week there were not as much lacking parts or quality
problems in production so the starting situation for test of implementation plan
was better than during the first week. Also the follow up and measuring was
easier because production sequence was pretty stable after the first assembly
station. The second test week succeeded very well and the productivity was
13% higher than the average based on completed number of units. Overall the
assembly line balance was near to the ideal situation and production flow was
according to employees much better than before. The only problem during the
second test week was that paint shop was not able to provide enough frames
for assembly line. The buffer before first assembly station 5101 was empty con-
tinuously so it was impossible to implement any production levelling method.
The first assembly station was the only station that could not achieve the target
rate of the whole week. Other main assembly workstations 5102, 5103 and
5107 were capable for a very stable production flow, which indicated that new
more detailed production scheduling works well. Especially workers in the final
assembly station perceived that there is not as much idle time than before bal-
ancing actions. Subassemblies 5104, 5105 and 5106 did not follow targets that
were presented on assembly screen as well as main stations and their workload
was much more unstable. These fluctuations were balanced with buffers after
the subassembly so that waiting was not occurred in final assembly line.
After the test weeks there was a comprehensive report made for the results and
findings that were used for further balancing actions. The production rate ori-
ented system was analysed to be working method for current demountable as-
sembly, but there are still restrictions to implement shorter period than one day
target rates. There is quite much manual work to do in target setting and calcu-
lating employee allocation in variable production. Especially when assembly
sequence needs to be updated there should be more automatic calculation sys-
tem in order to reschedule production effectively for half only day period. After

84
the test weeks it was decided to continue production rate oriented system with
one day scheduling period. The restriction of a longer period is that workers
complete more products on morning or evening and there are not enough buff-
ers to smooth the temporary unbalance. CONWIP system must be used more
strictly to avoid waiting when completion of products is monitored only once a
day.
In the future the plan is to shorten the scheduling period from one day to half
day and then step by step even shorter. In order to shorten this predetermined
time period there must be continuous improvement in assembly line balancing,
problem solving and employee engagement. Currently the balance calculations
are made with the Spreadsheet software and if the scheduling period is short-
ened also employee calculation should be done automatically. In the future it is
possible that the time period is shortened to even match the planned cycle time,
when the system is changed to takt-driven scheduling method, which was the
initial goal of this thesis.
The assembly screen did helped workers to understand the current production
situation and the targets. Production target rates were displayed in televisions
for all workstations so that everybody knew what they should assemble during
the scheduled period. However there were some problems occurred during the
test weeks because of changes in product sequences and few technical unreli-
ability issues. After the test weeks there were more detailed responsibilities and
standardized updating methods were planned so that the assembly screen
could be used reliably. The assembly screen has worked very well after these
improvements very well and it is fulfils the objectives and requirements present-
ed in chapter 4.2.2 for the flexible target setting system. Production sequence,
current production situation, standard times, target rates for the period and
problem signals are visually presented in real time in televisions and computer
screens connected to Multilift Intranet. The next phase is to implement the cal-
culation of workstation specific employee allocation and productivities to the
program. The assembly screen was originally planned only for demountable
power series production scheduling but now also material handling department
has begun using the tool and there has been interest from other Hiab factories
too.

85
6 DISCUSSION
In this discussion chapter the theoretical and empirical studies are summarized
and compared to each other. The idea of the result analysis chapter is to ana-
lyse how well the thesis answers to the research question and fulfils the objec-
tives set in the introductory chapter. The purpose of the conclusion chapter is to
evaluate and compare how the different theories and assembly line balancing
methods are applicable in practice for the Hiab’s Raisio factory.
6.1 Result analysis
The objective was to create smooth, well planned and organized production
flow, and sub-objectives were to decrease waiting times and create a target
system for assembly line. There were nine different assembly line balancing
methods presented and all these methods were used development actions for
demountable assembly line.
Table 6.1. Assembly line balancing methods for demountable assembly line.
Method
Location/ place
Wh
ole
Ra
isio
pro
du
ctio
n
All a
sse
mb
ly
sta
tio
ns
51
00
Pre
asse
mb
ly
sta
tio
n
51
01
Su
bfr
am
e a
sse
mb
ly
51
02
Ele
ctr
icity a
nd
va
lve
asse
mb
ly
51
03
Cylin
de
r a
nd
ho
sin
g a
sse
mb
ly
51
04
Re
ar
fra
me
pre
asse
mb
ly
51
05
Mid
dle
fra
me
pre
asse
mb
ly
51
06
Ho
ok fra
me
pre
asse
mb
ly
51
07
Fin
al
asse
mb
ly lin
e
sum
1x x x x x x x x 8
2x x x x x 5
3x x x 3
4x x x 3
5x x 2
6x x x x x x 6
7x 1
8x x 2
9x x x x 4
sum 5 3 2 5 2 5 3 1 2 6
Continuous development actions to
present bottleneck station
Production planning and assembly line
balancing based on average work loads
Using multi-skilled work force
Preassembly for optional modules
Different routings for variable products
Sequence planning to level out the
workload
In-process inventory to avoid waiting
Balance assembly line with moving tasks
per station
Work time arrangements
86
Table 6.1 summarizes all the assembly line balancing actions used in different
workstations in demountable assembly. The X -marking indicates of some kind
of change that has been made with any specific method to some location. More
detailed description of each mark is presented in appendix 3. The most signifi-
cant results came from assigning near to the correct amount of employees to
different stations. This gave theoretically 31% better average load percentage
for demountables assembly line, which also decreased the waiting time signifi-
cantly. Other results related to assembly line balancing included an increased
use of flexible multi-skilled employees, new pre-assembly station, development
of routings and more detailed buffer places to control production flow. Most of
the balancing actions focused on 5107 final assembly line, but the most signifi-
cant changes were made to 5101 subframe assembly and 5103 cylinder and
hosing assembly workstations.
Workstation specific target setting and visual assembly screen were the biggest
improvement steps related to scheduling activities. More organised production
planning and all assembly line balancing actions cut idle time and provided
much better changes for even further productivity improvement. The knowhow
and planning practices improved significantly compared to the beginning situa-
tion. All together these development actions and results meet all the objectives
and expectations set for this project.
The research question aims to find answers for creation of a more balanced and
organised material flow for high-mix, low-volume type of assembly line in Hiab
Raisio factory. Literature review provides methods for high-mix assembly line
balancing and they were used as alternative development ideas (table 2.3).
There was an implementation plan made for each method (table 5.1) and sev-
eral different improvement actions were performed to balance the line (table
6.1). The other part of the research question was about organisation of material
flow and the solution was to implement production rate oriented system, which
is controlled with new visual assembly screen. The literature review and imple-
mentation plan do answer to the research question and the results have proved
improvement of the operation of demountable assembly line.
The goals of this thesis in the long run were to improve productivity and shorten
the lead time. During the project assembly line productivity increased over 15%
due to increased production volume calculated by average daily target hours
and decreased amount of employees (see appendices 4 and 5). It is difficult to
measure how much various improvement actions contributed to this increase
because of excess capacity in the beginning situation. The most significant noti-
fication was that this productivity ramp up succeeded exceptionally well and it
did not cause almost any problems. Also according to employees and supervi-

87
sors the efficiency and production flow of the assembly line has improved signif-
icantly compared to the beginning situation. These observations indicate that
the implemented balancing and scheduling actions have really improved the
assembly line operation and increased its capacity constraints. In case of short-
er lead time the thesis did not provide much result during the project. Part of the
balancing was to specify more detailed in-process inventory plans, which had a
slightly negative influence on lead time but positive effect on productivity. How-
ever with more organised production and better knowledge of current situation it
is possible to make improvements also to shorten the lead time in the future.
The updated value stream map will be used for that purpose. The scope will
also be larger than only assembly because it was analysed that the actual
benefits and development objects of shorter lead time are in logistics more than
in the assembly operation.
6.2 Subjects for further studies
There are many issues mentioned that should be researched in the future. The
most critical subject for further study is the production scheduling of the out-
sourced paint shop so that the operation would really support the flow of pro-
duction. The next project should concentrate on sequence of frames loaded to
the painting. Various different factors have an impact on the best possible se-
quence. Available frames, delivery date, paint colour, amount of layers, produc-
tion levelling for assembly line and many other. The current way to manage the
variable sequence is the buffer of seven frames after paint shop. Next develop-
ment subjects would be to plan the system so transparent and reliable that
there would be always correct frames and the buffer could be smaller. The paint
shop is the input for the assembly line so it must be perceived more as part of
assembly line in the future.
In an ideal situation there are seven sub-frames in the buffer after the paint
shop. Consequently, there are also many more other frames in the buffer before
subassemblies. The number is roughly seven plus all the work-in-process prod-
ucts in assembly line before the final assembly station. This will create space
problems for middle frames and hook frames. There should be a layout change
designed for the area to improve the assembly work flow. At the same time as-
sembly line balancing alternatives presented in this thesis could be analysed so
that the workloads of these stations would be more balanced.
The third subject for further study is to analyse possibilities for alternative tasks
for employees working in the assembly line. Research for additional tasks would
support balancing method of 3.7 assignment of identical tasks to different sta-
tions. The tasks could relate to 5S housekeeping program, continuous im-

88
provement, helping logistics or any activity which need to be done anyway in
some point. If there is excess capacity it is good to re-evaluate make or buy de-
cisions of different subassemblies. Furthermore, planning totally alternative
business ideas and work positions could be also thought. The objective is that
there would always be a plan B with extra tasks for idle workers in order to
reach best possible productivity and changes in demand would not affect it so
much.
6.3 Conclusions
The perspective of this study was to analyse different assembly line balancing
problems as alternative solution ideas for demountable production. There were
lots of information and theory available regarding assembly line balancing and
most of them were linked to lean manufacturing, which suited well for the case
company. However, it was very difficult to find theories or examples from litera-
ture, which would fit to the scope of this thesis. Also Boysen et al (2008, p.18)
insist that more research should be done for reconfiguration of real-world as-
sembly line balancing problems. There is a clear gab between the practical line
balancing problems and theoretical research, which lead to situation that there
are not enough widely approved methods to be applied for practice. The most
significant reason for the gap is the amount of different attributes that must be
considered in a real-world assembly line balancing problems and research pa-
pers typically concentrates on only few extensions in an isolated manner. For
instance, it is very hard to evaluate optimization of production levelling, assem-
bly line balancing and multi-skilled employees in one context and make compu-
tational experiments for all attributes simultaneously.
The main difference of this study compared to a literature review is that none of
the research papers or other sources included as many as nine different as-
sembly line balancing alternatives. Most of the researchers have studied only
two or three different methods at a time and the methods are often presented in
an isolated manner compared to each other. Also the style was somewhat dif-
ferent than in many research papers, which were more based on problem defi-
nition and characteristics than problem solutions. The most in-depth research
for assembly line balancing problems were made by Nils Boysen and Armin
Scholl, who had studied the subject for many different kinds of production envi-
ronments.
In this thesis all the nine different alternative solution ideas, implementation plan
and results were analyzed in one context together with an action research
methodology. The research was produced from a large variety of problem defi-
nitions without a coherent direction to any straightforward single solution. The

89
methods were characterized by the author and there were some inconsistency
between the methods presented in literature when compared to the categoriza-
tion of various attributes. As mentioned in many research papers it is extremely
difficult to evaluate the results of any specific action when more than one bal-
ancing methods are used simultaneously. There are also many restrictions and
problems which cannot be connected to any specific method and analysis. Due
to the complexity the balancing methods and real-world assembly system it is
impossible to create any generalized computational models or conclusions of
the results of this thesis compared to different theoretical formulations.
The most important phase of this thesis was the data analysis of the beginning
situation of the demountables assembly line. There were also many other anal-
yses made during the thesis, such as various time studies, comparisons,
productivity follow up and weekly production report by the author of this thesis.
It was interesting to recognise how much hard data and statistics influence on
the production planning decisions even though some issues had been noticed
and known beforehand. It clearly proved that it is much easier for supervisors to
make decisions based on analysed numbers, providing a rational explanation to
lean on. It is much harder to explain changes made based on feelings or obser-
vations made by leaders.
The thesis project clearly increased the knowledge of the operation in the de-
mountables power series assembly line. This study provides a good basis for
continuous improvement actions in the future. The assembly line balance situa-
tion should be continuously re-evaluated and assessed together with standard
times to achieve the best possible productivity. There are still lots of further
studies to be performed in order to achieve better balance and production con-
trol practices. The author of the thesis considers the project as a very interest-
ing, challenging and educational project. The objectives of this thesis were ful-
filled and the author believes that the thesis project has brought The Raisio fac-
tory a few steps closer to a more modern production planning environment.

90
7 REFERENCES
Amen, M. 2006. Cost-oriented assembly line balancing: Mole formulation, solu-
tion difficulty, upper and lower bounds. European Journal of Operational Re-
search 168, 747–770. 24p.
Aswathappa, K. Shridharabhat. K. 2009. Production and Operations Manage-
ment. Global Media. India. 665p.
Baudin, M. 2002. Lean Assembly - The Nuts and Bolts of Making Assembly
Operations Flow. Productivity Press. USA. 274p.
Baudin, M. 2012. Takt time: can it be universally applied to all types of produc-
tion? Michel Baudin’s Blog - Ideas from manufacturing operations. [WWW].
[Accessed on 28.9.2013]. Available at: http://michelbaudin.com/2012/10/31/takt-
time-can-it-be-universally-applied-to-all-types-of-production/.
Baybards, I. 1986. An Efficient heuristic method for the simple assembly line
balancing problem. International Journal of Production Research 24, 149–166.
18p.
Becker, C. Scholl, A. 2006. A survey on problems and methods in generalized
assembly line balancing. European Journal of Operational Research 168, 694-
715. 22p.
Becker, C. Scholl, A. 2009. Balancing assembly line with variable parallel work-
places: Problem definition and effective solution procedure. European Journal
of Operational Research 199, 359-374. 16p.
Boysen, N. Fliedner, M. Scholl, A. 2007. A Classification of assembly line bal-
ancing problems European Journal of Operational Research 183, 674–693.
20p.
Boysen, N. Fliedner, M. Scholl, A. 2008. Assembly line balancing: Which model
to use when?. International Journal Of Production Economies 111, 509-528.
24p.

91
Boysen, N. Fliedner, M. Scholl, A. 2009. Sequencing mixed-model assembly
lines: Survey, classification and model critique. European Journal of Operational
Research 192, 349–373. 25p.
Boysen, N. Kiel, M. Scholl, A. 2011. Sequencing mixed-model assembly lines to
minimise the number of work overload situations. International Journal of Pro-
duction Research Volume 49, Number 16, 4735–4760, 36p.
Cargotec Oyj. 2013a. Annual report 2012. Cargotec. Helsinki. 243p.
Cargotec Oyj. 2013b. Hiab Production system booklet. Cargotec. Helsinki. 60p.
Coromias, A. Pastor, R. Plans, J. 2008. Balancing assembly line with skilled
and unskilled workers. IOC Research Institute. Omega 38, 1126-1132. 6p.
Erel, E. Gokcen H. 1999. Shortest-route formulation of mixed-model assembly
line balancing problem. European Journal of Operational Research 116, 194-
204. 11p.
Fernandes, C. Groover, M. 1995. Mixed-model assembly line balancing and
sequencing: A survey. Engineering Design and Automation 1,33–42. 10p.
Haverila, J. Uusi-Rauva, E. Kouri, I. Miettinen, A. 2009. Teollisuustalous. Infacs
Johtamistekniikka Oy. Tampere. 243p.
Hillier, F. So, K. Boling, R. 1993. Toward Characterizing the Optimal Allocation
of Storage Space in Production Line Systems with Variable Processing Times.
The Institute of Management Sciences. Management Science Vol 39. USA. 9p.
Hobbs, D. 2011. Applied Lean Business Transformation. J. Ross Publishing.
USA. 510p.
Imai, M. 2012. Gemba Kaizen: A Commonsense Approach to a Continuous Im-
provement Strategy. Second edition. McGraw-Hill. USA. 426p.
Karabati, S. Sayin, S. 2003. Assembly line balancing in a mixed-model se-
quencing environment with synchronous transfers. European Journal of Opera-
tional Research 149, 417–429. 13p.
Konnully, J. 2013. Assembly-Line Balancing: An effective tool for improving
productivity. SlideShare Inc. [WWW] [Accessed on 29.7.2013] Available at:
http://www.slideshare.net/JosephKonnully/assembly-line-balancing.

92
Lane, G. 2007. Made-To-Order Lean Excellence in a high-mix, low-volume envi-
ronment. Productivity Press. USA. 209p.
Larco, J. Bortolan, E. Studley, M. 2008. Lean manufacturing in Build to Order,
Complex and Variable Environments. The Oeklea Press. USA. 192p.
Liker, J. 2004. The Toyota Way: 14 Management Priciples From The World’s
Greatest Manufacturer. McGraw-Hill. USA. 330p.
Little, J. Graves, S. 2008. "Little's Law". Building Intuition. International Series in
Operations Research & Management Science 115. 81p.
Merengo, C. Nava, F. Pozetti, A. 1999. Balancing and sequencing manual
mixed-model assembly lines. International Journal of Production Research 37,
2835–2860. 26p.
Ohno, T. 1982. How the Toyota Production System was Created. Japanese
Economy. Volume 10, Number 4, 83–101. 18p.
Pettersen, J. Segerstedt, A. 2009. Restricted work-in-process: a study of differ-
ences between Kanban and CONWIP. International Journal of Production Eco-
nomics 118, 199–207. 8p.
Rother, M. 2013. Improvement Kata Handbook – Grasp the Current Condition.
Version 17. 53p. [WWW] [Accessed on 1.8.2013] Available at: http://www-
personal.umich.edu/~mrother/Materials_to_Download.html.
Rother, M. Harris, R. 2001. Creating Continuous Flow. The Lean Enterprice In-
stitute. USA. 105p.
Salveson, M. 1955. The assembly line balancing problem. Journal of Industrial
Engineering 6, 18-25. 8p.
Scholl, A. Becker, C 2006. State-of-the-art exact and heuristic solution proce-
dures for simple assembly line balancing. European Journal of Operational Re-
search 168, 666–693. 28p.
Stephens P, Mayers F. 2010. Manufacturing Facilities Design and Material
Handling. Fourth edition. Pearson Education International. USA. 486p.

93
Thomopoulos, N.1970. Mixed model line balancing with smoothed station as-
signments, Management Science 16, 593–603. 11p.
Teräväinen, E. Cargotec – Siellä missä tavara liikkuu. Cargotec. 135p.
Öztürk, C. Tunalı, S. Hnich, B. Örnek, A. Balancing and scheduling of flexible
mixed model assembly lines. Constraints 18, 434–469. 36p.

Example of time and period dependent variances in high-mix production
Total cycle time
for the period
Unit 1 12
Unit 2 12
Unit 3 12
Unit 4 12
Unit 5 12
Unit 6 12
Unit 7 12
Total cycle time
for the period
Period -2 unit 1 5 n/a n/a n/a n/a
Period -1 unit 2 2 unit 1 2 n/a n/a n/a
Period 0 unit 3 3 unit 2 5 unit 1 2 n/a n/a
Period 1 unit 4 3 unit 3 3 unit 2 3 unit 1 3 12
Period 2 unit 5 2 unit 4 3 unit 3 2 unit 2 2 9
Period 3 unit 6 4 unit 5 4 unit 4 3 unit 3 4 15
Period 4 unit 7 3 unit 6 2 unit 5 4 unit 4 3 12
Period 5 n/a unit 7 3 unit 6 4 unit 5 2 n/a
Period 6 n/a n/a unit 7 2 unit 6 2 n/a
Period 7 n/a n/a n/a unit 7 4 n/a
period 1-4 total 12 12 12 12
total
Period 1 100 %
Period 2 100 %
Period 3 100 %
Period 4 100 %
33 %
27 %
17 %
Work station 1
25 %
22 %
27 %
25 %
22 %
27 %
25 %
Work station 3
25 %
22 %
20 %
33 %
Period cycle times in paced assembly without buffers
Unit cycle times
Percentage of workers needed to balance the paced assembly line
Work station 4
25 %
Work station 2
25 %
4
2
3
2
4
3
2
2
4
2
3
2
3
4
4
3
2
5
3
3
4
2
3
Work station 1 Work station 2 Work station 3 Work station 4
Work station 1 Work station 2 Work station 3 Work station 4
5
2
3
3
2
3 24 3
3
2
3 4
3
3
42
3
2
4
3
0
2
4
6
8
10
12
14
16
Period 1 Period 2 Period 3 Period 4
Tota
l ass
em
bly
tim
e p
er
pe
rio
d
Periods in paced and synchronous assembly without buffers
Time and period depended variances in high-mix production
Work station 1
Work station 2
Work station 3
Work station 4unit 4
All units has equal
total cycle time
Work station cycle
time range is 2-4
hours
High variance in
total cycle time per
periods althought all
the products have
equal total cycle time
Equal amount of work
for every work station
for periods 1-4.
APPENDIX 1: EXAMPLE OF TIME AND PERIOD DEPENDENT VARIANCES IN A HIGH-MIX PRODUCTION